BBX Capital Inc · OTC:BBXIA
BBX Capital — BankAtlantic Bancorp — Investor Presentation (February 2005)
55 slides from BBX Capital's investor presentation, Feb 17, 2005
Slide 1: BankAtlantic Bancorp February 2005 NYSE: BBX
FEBRUARY 2005 NYSE BBX Prepared:February 16, 2005
Slide 2: BankAtlantic Bancorp: Florida financial services holding company
BANKATLANTIC BANCORP NYSE:BBX A Florida based financial services holding company Investment Banking and Retail Brokerage
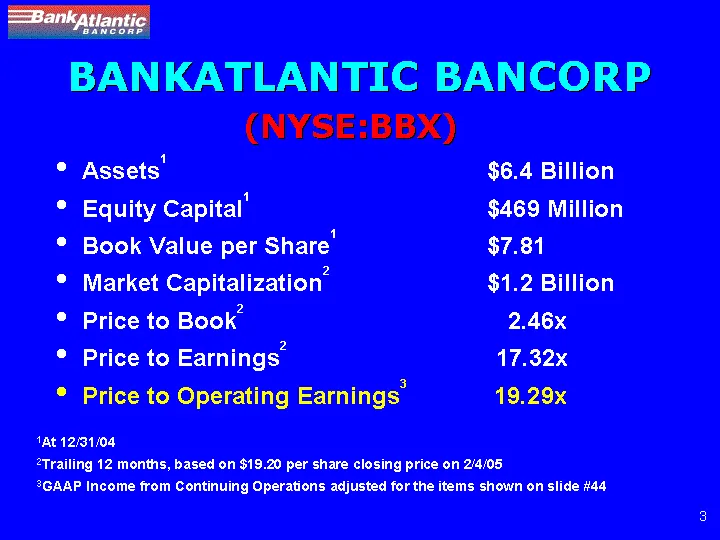
Slide 3: BankAtlantic Bancorp (NYSE:BBX) key statistics
BANKATLANTIC BANCORP (NYSE:BBX) • Assets 1 $6.4 Billion • Equity Capital 1 $469 Million • Book Value per Share 1 $7.81 • Market Capitalization 2 $1.2 Billion • Price to Book 2 2.46x • Price to Earnings 2 17.32x • Price to Operating Earnings 3 19.29x 1 At 12/31/04 2 Trailing 12 months, based on $19.2
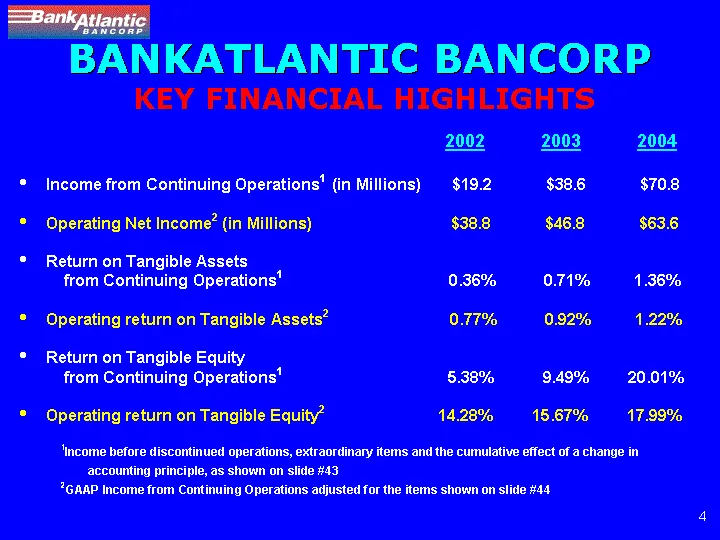
Slide 4: Key Financial Highlights
BANKATLANTIC BANCORP KEY FINANCIAL HIGHLIGHTS • Income from Continuing Operations 1 (in Millions) $19.2 $38.6 $70.8 • Operating Net Income 2 (in Millions) $38.8 $46.8 $63.6 • Return on Tangible Assets from Continuing Operations 1 0.36% 0.71% 1.36% • Operating return on Tangible Assets 2 0.77% 0.92%
Slide 5: BankAtlantic Overview
BANKATLANTIC OVERVIEW • Founded in 1952 • “Florida’s Most Convenient Bank” • 74 branches • High visibility in South Florida • Strong demographics
Slide 6: BankAtlantic Branch Network
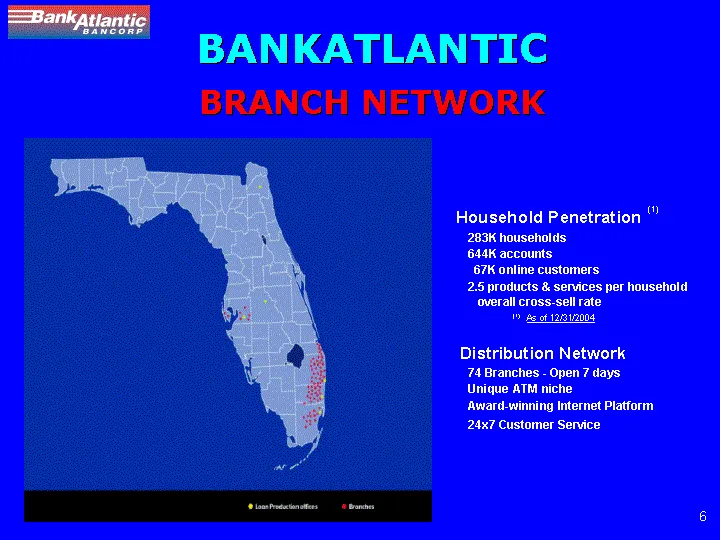
BANKATLANTIC BRANCH NETWORK Household Penetration 283K households644K accounts 67K online customers 2.5 products & services per household overall cross-sell rate As of 12/31/2004 Distribution Network 74 Branches — Open 7 days Unique ATM niche Award-winning Internet Platform 24x7 Customer Service
Slide 7: Florida Deposit Ranking
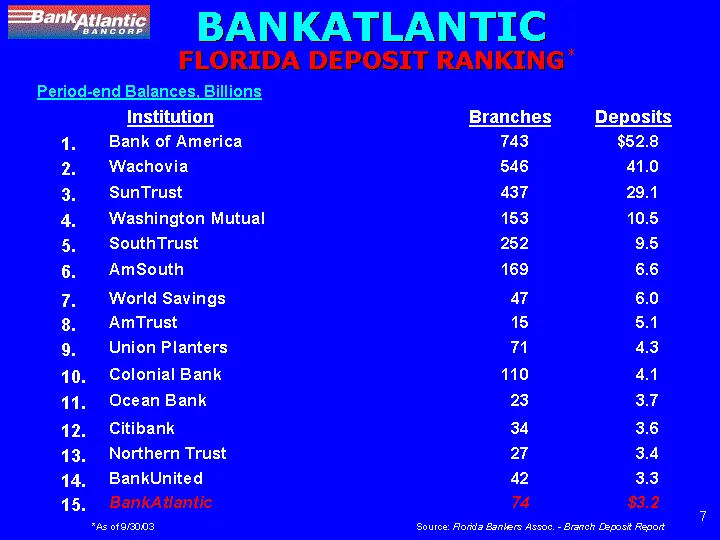
BANKATLANTIC FLORIDA DEPOSIT RANKING * Period-end Balances, Billions Institution Branches Deposits 1. Bank of America 743 $52.8 2. Wachovia 546 41.0 3. SunTrust 437 29.1 4. Washington Mutual 153 10.5 5. SouthTrust 252 9.5 6. AmSouth 169 6.6 7. World Savings 47 6.0 8. AmTrust 15 5.1 9. Union Planters
Slide 8: BankAtlantic Market Share
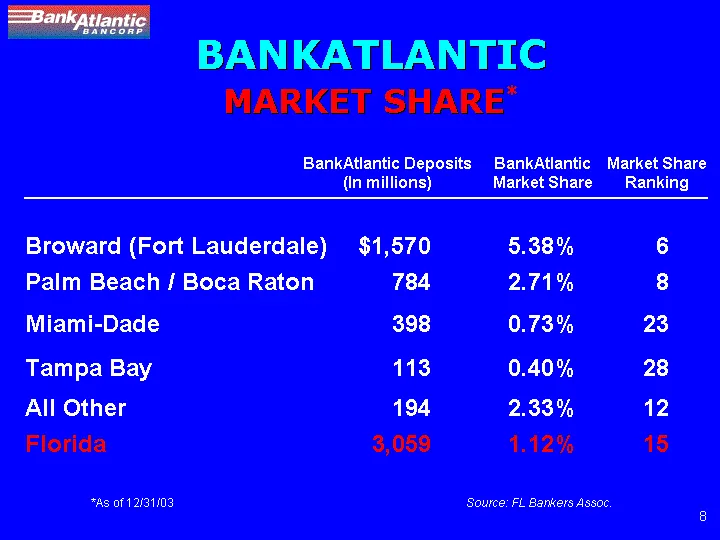
BANKATLANTIC MARKET SHARE * BankAtlantic Deposits (In millions) BankAtlantic Market ShareMarket Share Ranking Broward (Fort Lauderdale) $1,570 5.38% 6 Palm Beach / Boca Raton 784 2.71% 8 Miami-Dade 398 0.73% 23 Tampa Bay 113 0.40% 28 All Other 194 2.33% 12 Florida 3,059 1.12% 15 *As of 12/31/03 Sour
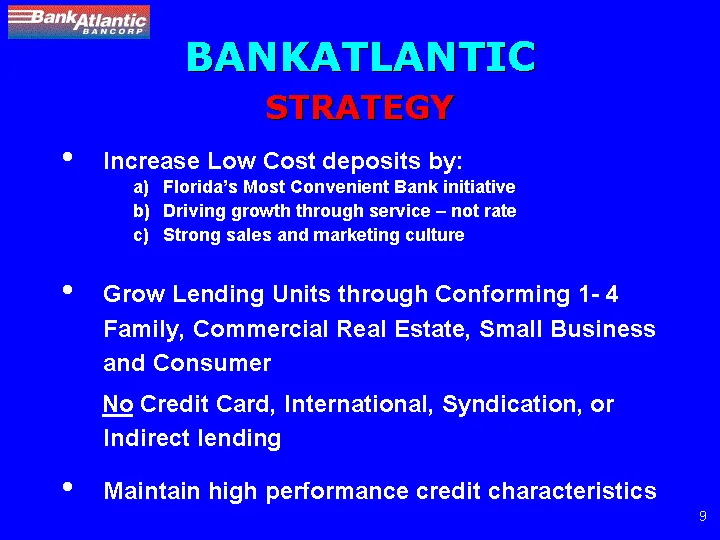
Slide 9: BankAtlantic Strategy
BANKATLANTIC STRATEGY • Increase Low Cost deposits by: • Florida’s Most Convenient Bank initiative · Driving growth through service – not rate •Strong sales and marketing culture • Grow Lending Units through Conforming 1- 4 Family, Commercial Real Estate, Small Business and Consumer No Credit Card,
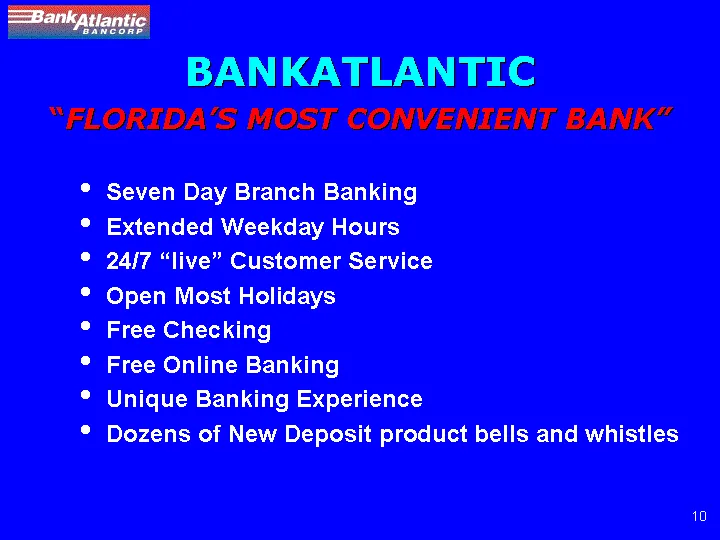
Slide 10: Florida's Most Convenient Bank
BANKATLANTIC “ FLORIDA’S MOST CONVENIENT BANK” • Seven Day Branch Banking • Extended Weekday Hours • 24/7 “live” Customer Service • Open Most Holidays • Free Checking • Free Online Banking • Unique Banking Experience • Dozens of New Deposit product bells and whistles

Slide 11: Florida's Most Convenient Bank
FLORIDA’S MOST CONVENIENT BANK
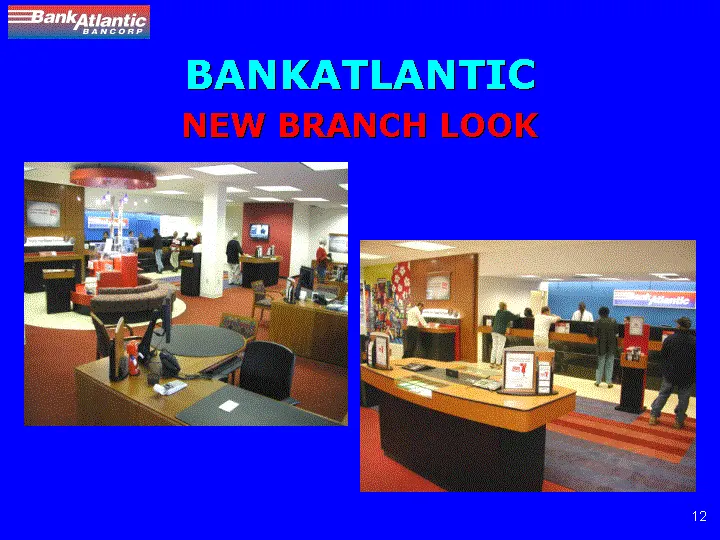
Slide 12: BankAtlantic New Branch Look
BANKATLANTIC NEW BRANCH LOOK
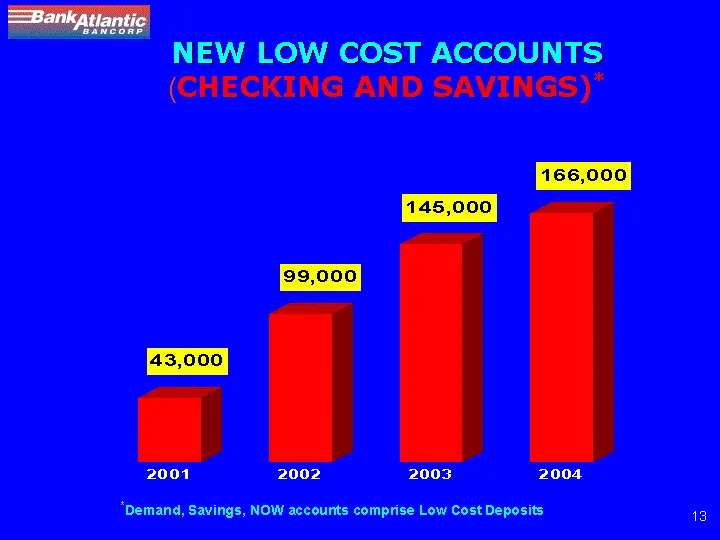
Slide 13: New Low Cost Accounts (Checking and Savings)
NEW LOW COST ACCOUNTS (CHECKING AND SAVINGS)* 43,000 99,000 145,000 166,000 2001 2002 2003 2004 * Demand, Savings, NOW accounts comprise Low Cost Deposits
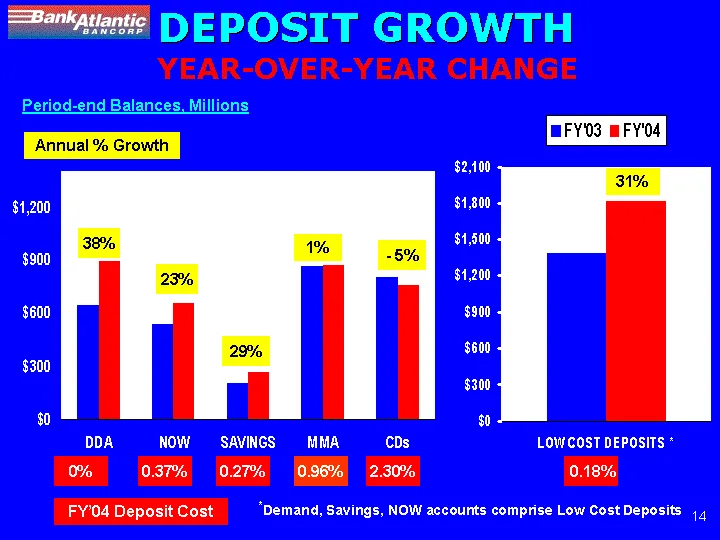
Slide 14: Deposit Growth Year-over-Year Change
DEPOSIT GROWTH YEAR-OVER-YEAR CHANGE Period-end Balances, Millions Annual % Growth $1,200 $900 $600 $300 $0 38% 23% 29% 1% -5% DDA NOW SAVINGS MMA CDs 0% 0.37% 0.27% 0.907 2.30% FY04 Deposit Cost FY’03 FY’04 $2,100 $1,800 $1,500 $1,200 $900 $600 $300 $0 31% LOW COST DEPOSITS* 0.18% * Demand, Savings
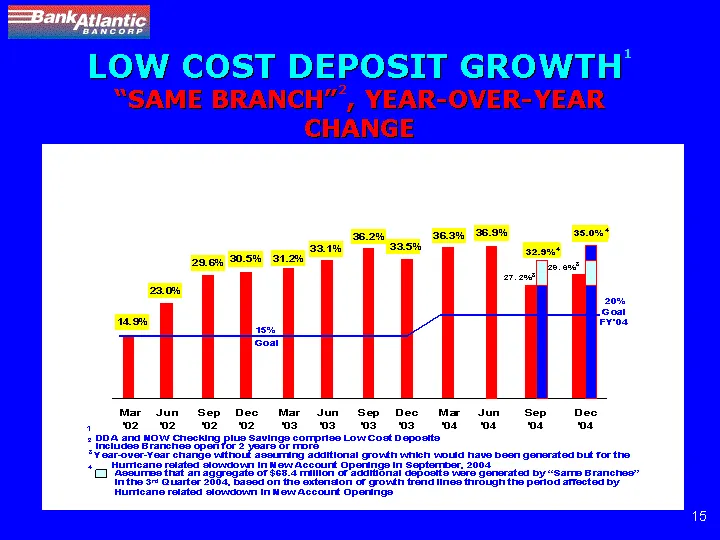
Slide 15: Low Cost Deposit Growth Same Branch
LOW COST DEPOSIT GROWTH 1 “SAME BRANCH” 2, YEAR-OVER-YEAR CHANGE 14.9% 23.0% 29.6% 30.5% 33.2% 33.1% 36.2% 33.5% 36.3% 36.9% 27.2% 32.9% 29.6% 35.0% 20% Goal FY’04 Mar ‘02 Jun ‘02 Sep ‘02 Dec ‘02 Mar ‘03 Jun ‘03 Sep ‘03 Dec ‘03 Mar ‘04 Jun ‘04 Sep ‘04 Dec ‘04 1 DDA and NOW Checking plus Savings comp
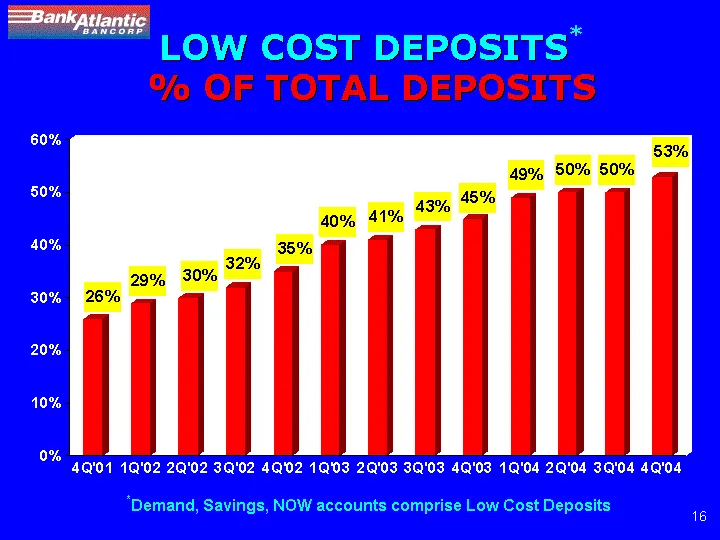
Slide 16: Low Cost Deposits % of Total Deposits
LOW COST DEPOSITS* % OF TOTAL DEPOSITS 60% 50% 40% 30% 20% 10% 0% 26% 29% 30% 32% 35% 40% 41% 43% 45% 49% 50% 50% 53% 4Q’01 1Q’02 2Q’02 3Q’02 4Q’02 1Q’03 2Q’03 3Q’03 4Q’03 1Q’04 2Q’04 3Q’04 4Q’04 * Demand, Savings, NOW accounts comprise Low Cost Deposits
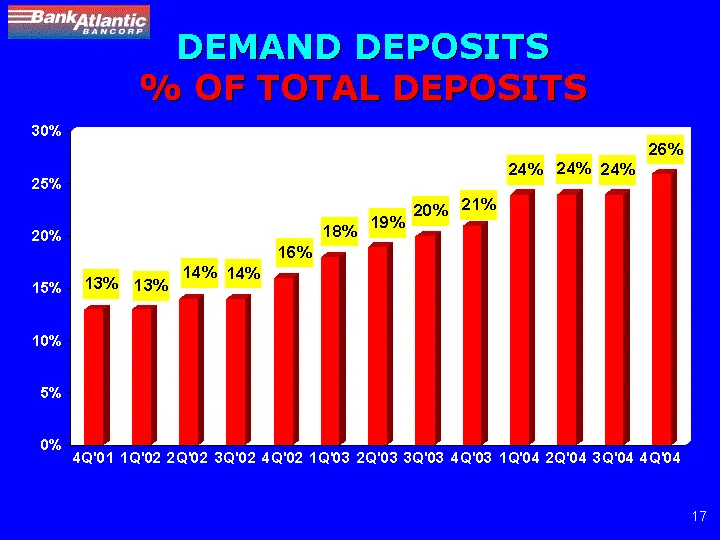
Slide 17: Demand Deposits % of Total Deposits
DEMAND DEPOSITS % OF TOTAL DEPOSITS 60% 50% 40% 30% 20% 10% 0% 13% 13% 14% 14% 16% 18% 19% 20% 21% 24% 24% 24% 26% 4Q’01 1Q’02 2Q’02 3Q’02 4Q’02 1Q’03 2Q’03 3Q’03 4Q’03 1Q’04 2Q’04 3Q’04 4Q’04
Slide 18: Total Deposits Bank Operations
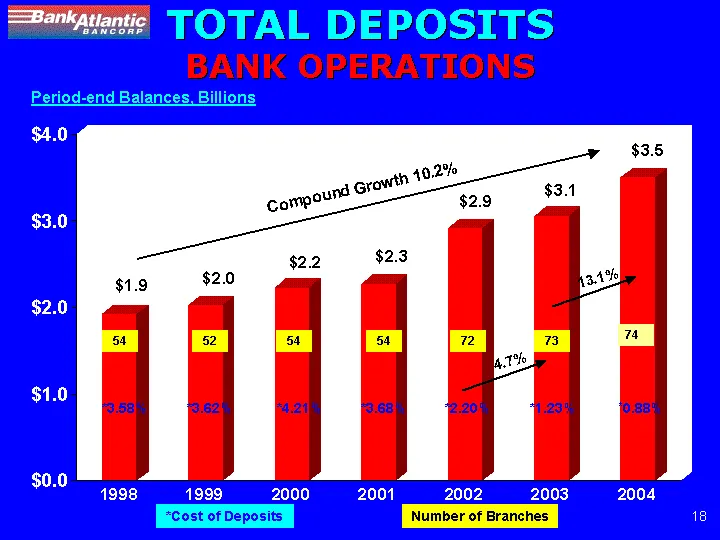
TOTAL DEPOSITS BANK OPERATIONS Period-end Balances, Billions Compound Growth 10.2% $4.0 $3.0 $2.0 $1.0 $0.0 $1.9 $2.0 $2.25 $2.3 $2.9 $3.1 $3.5 54 52 54 54 72 73 74 1998 1999 2000 2001 2002 2003 2004 *Cost of Deposits Number of Branches
Slide 19: Self Service Coin Counter
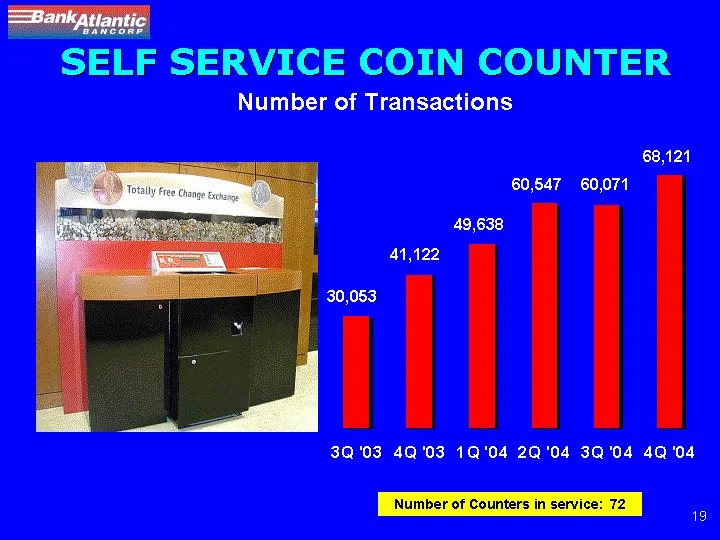
SELF SERVICE COIN COUNTER Number of Transactions 30,05341,12249,63360,54760,07168,121 3Q ‘034Q ‘031Q ‘042Q ‘043Q ‘044Q ‘04 Number of Counters in service: 72

Slide 20: BankAtlantic.com
BANKATLANTIC.COM • 67,000 online customers • Free Online Banking • Electronic Bill Pay • 24x7 Customer Service Winner 2002 Standard of Excellence Award
Slide 21: Growing Fee Income
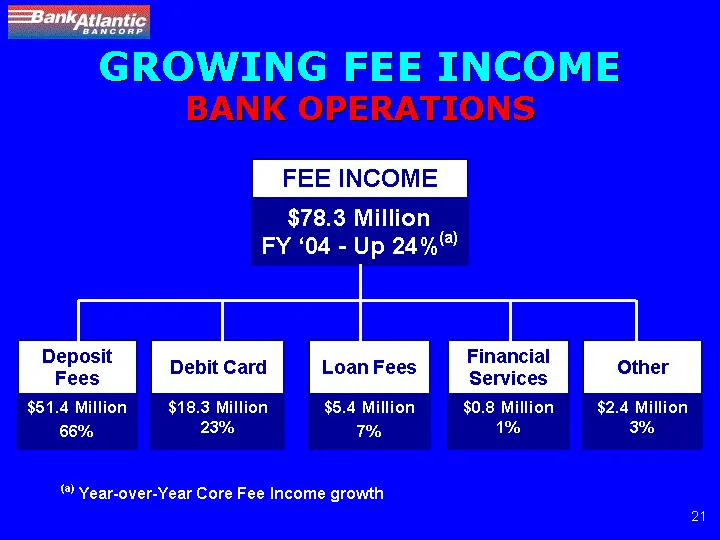
GROWING FEE INCOME BANK OPERATIONS FEE INCOME $78.3 Million FY ‘04 — Up 24% (a) Deposit Fees $51.4 Million 66% Debit Card $18.3 Million 23% Loan Fees $5.4 Million 7% Financial Services $0.8 Million 1% Other $2.4 Million 3% (a) Year-over-Year Core Fee Income growth
Slide 22: Fee Income Bank Operations
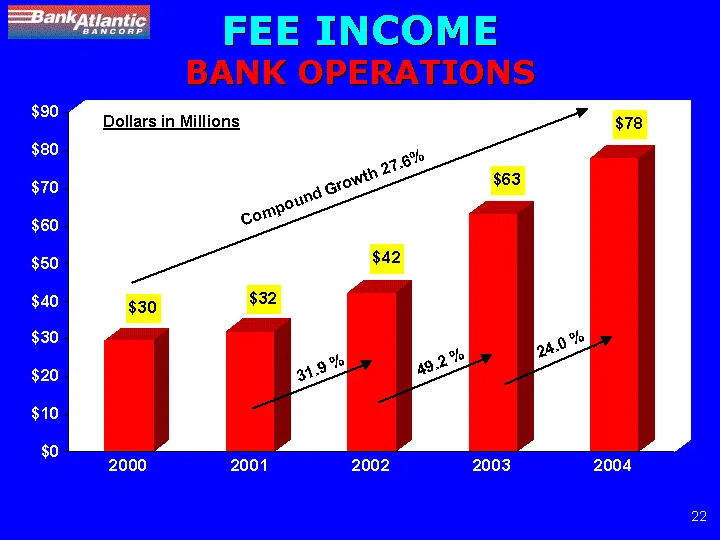
FEE INCOME BANK OPERATIONS Dollars in Millions Compound Growth 27.6% 200 2001 2002 2003 2004 $30 $32 31.9% $42 42.9% $63 24.0% $78 $0 $10 $ 20 $30 $40 $50 $60 $70 $80 $90
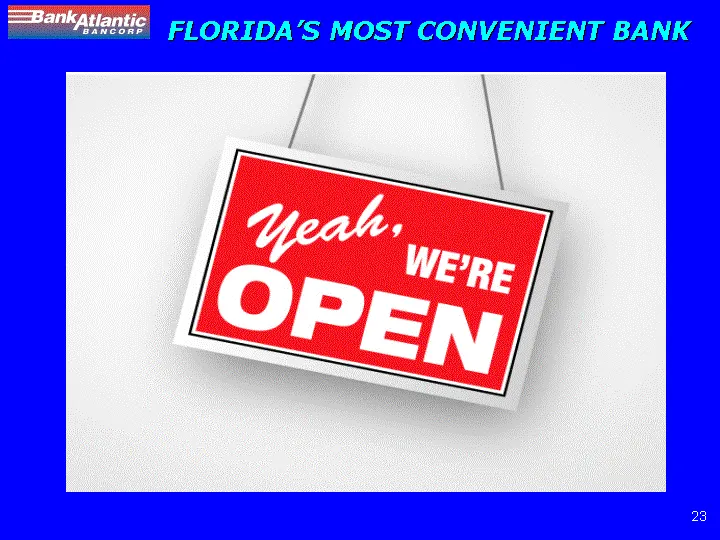
Slide 23: Florida's Most Convenient Bank
FLORIDA’S MOST CONVENIENT BANK
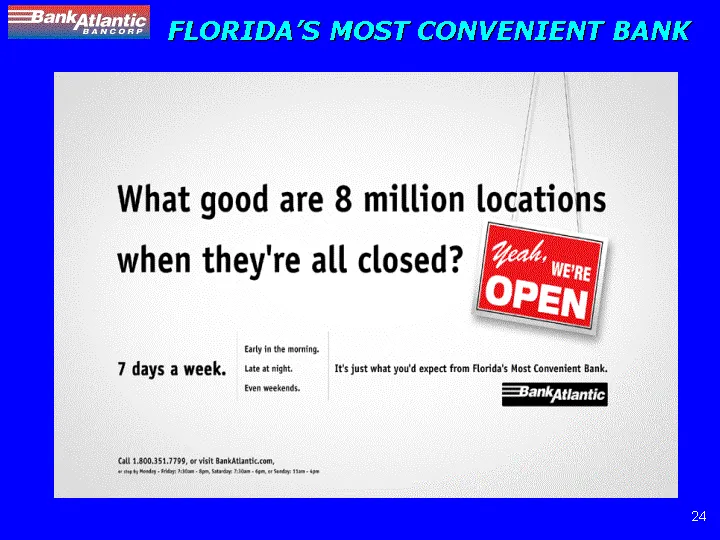
Slide 24: Florida's Most Convenient Bank
FLORIDA’S MOST CONVENIENT BANK
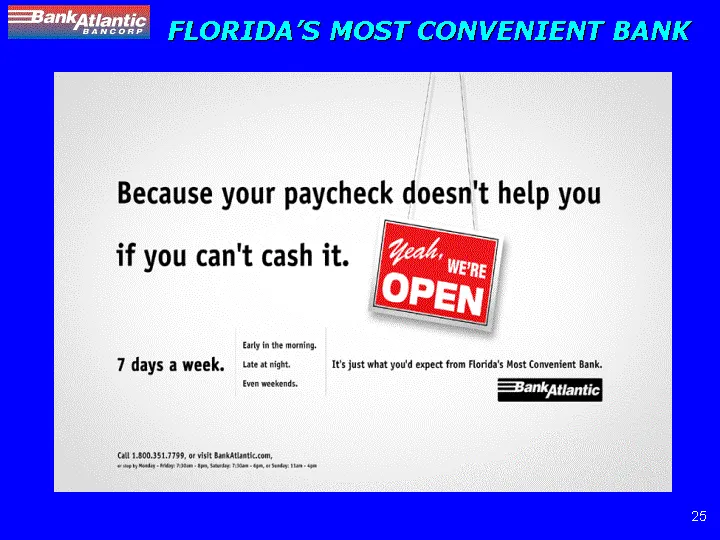
Slide 25: Florida's Most Convenient Bank
FLORIDA’S MOST CONVENIENT BANK
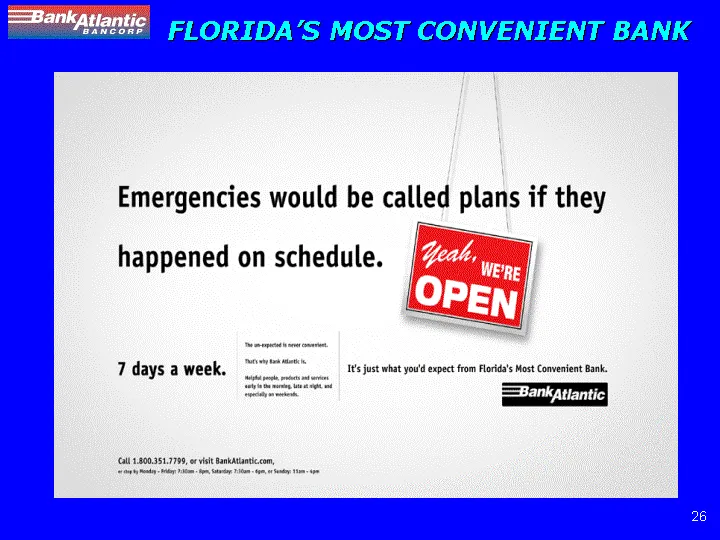
Slide 26: Florida's Most Convenient Bank
FLORIDA’S MOST CONVENIENT BANK
Slide 27: Florida's Most Convenient Bank
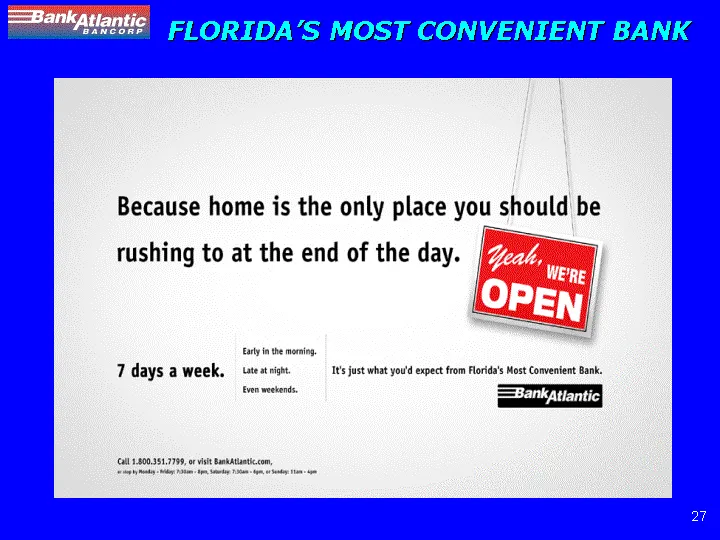
FLORIDA’S MOST CONVENIENT BANK
Slide 28: BankAtlantic 2005 Branch Expansion Strategy
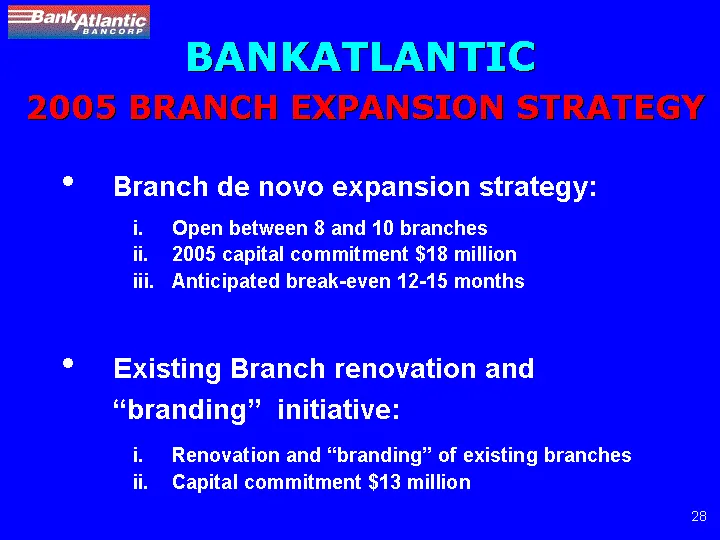
BANKATLANTIC 2005 BRANCH EXPANSION STRATEGY • Branch de novo expansion strategy: i.Open between 8 and 10 branches ii.2005 capital commitment $18 million iii.Anticipated break-even 12-15 months • Existing Branch renovation and “branding” initiative: i.Renovation and “branding” of existing branches ii
Slide 29: Loan Growth Bank Operations
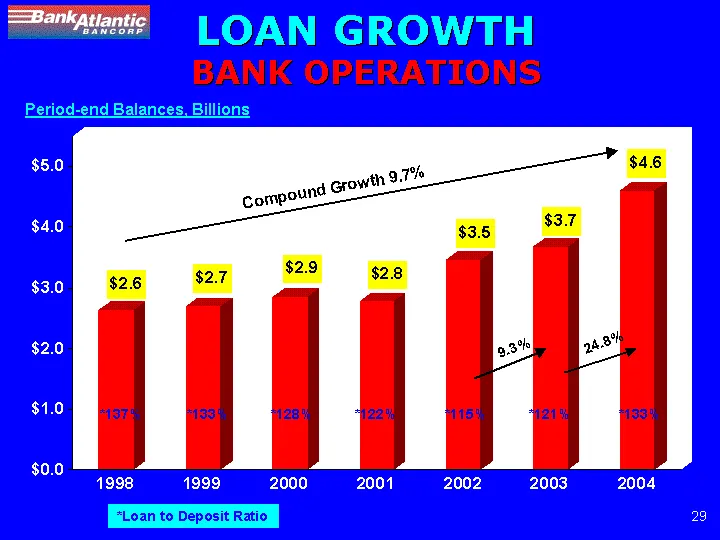
LOAN GROWTH BANK OPERATIONS Period-end Balances, Billions Compound Growth 9.7% 1998 1999 2000 2001 2002 2003 2004 137% 133% 128% 122% 115% 121% 133% %2.6 $2.7 $2.9 $2.8 $3.5 9.3% $3.7 24.8% $4.6 *Loan to Deposit Ratio
Slide 30: Loan Composition Bank Operations
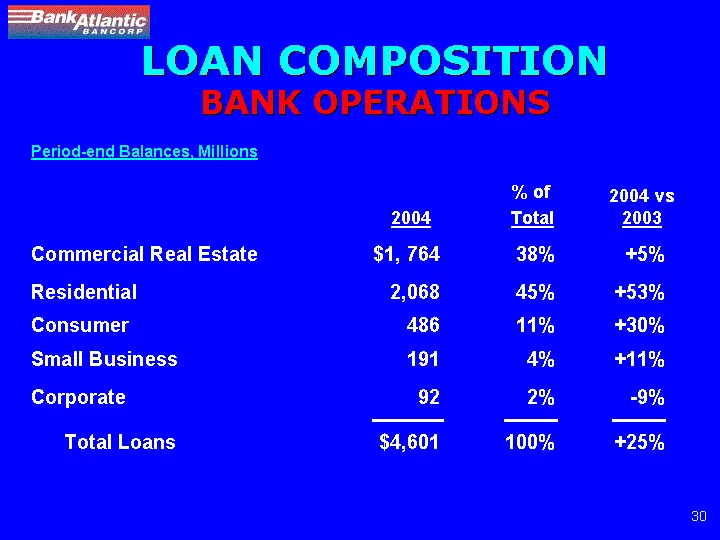
LOAN COMPOSITION BANK OPERATIONS Period-end Balances, Millions 2004 Total 2004 vs 2003 Commercial Real Estate $1, 76438% +5% Residential 2,068 45% +53% Consumer 486 11% +30% Small Business 191 4% +11% Corporate 92 2% -9% Total Loans $4,601 100% +25%
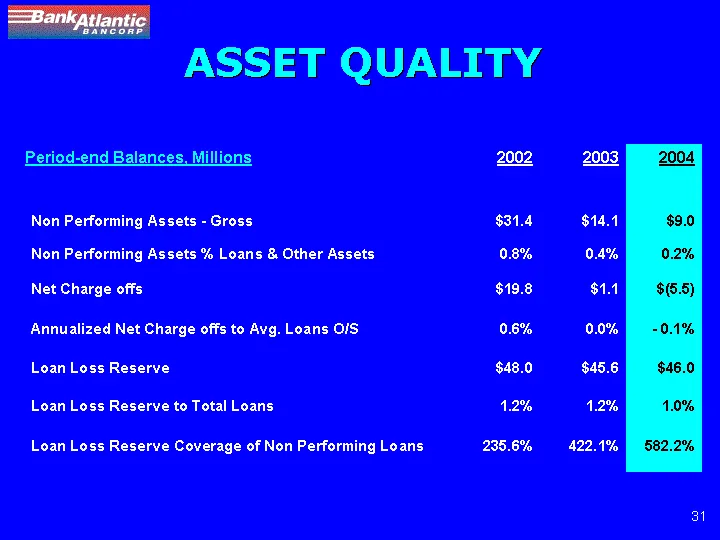
Slide 31: Asset Quality
ASSET QUALITY Period-end Balances, Millions — 2002 2003 2004 —— —— —— — Non Performing Assets – Gross $31.4 $14.1 $9.0 Non Performing Assets % Loans & Other Assets 0.8% 0.4% 0.2% Net Charge offs $19.8 $1.1 $(5.5) Annualized Net Charge offs to Avg. Loans O/S 0.6% 0.0% 0.1% Loan Loss Reserve $48.0 $45
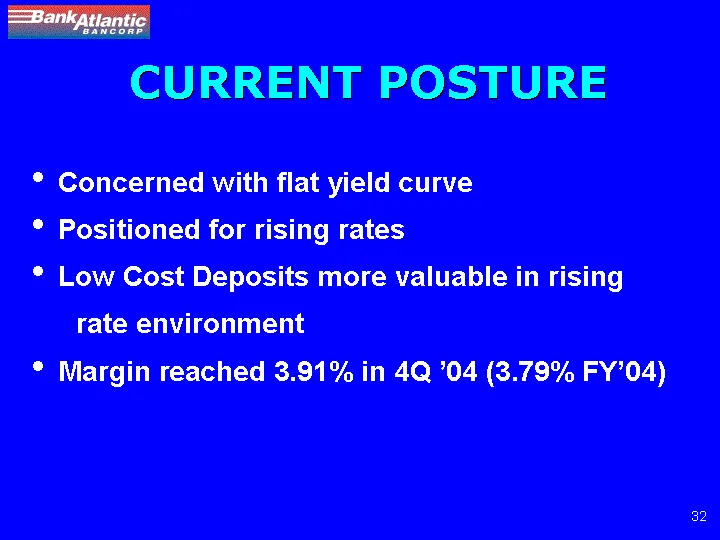
Slide 32: Current Posture
CURRENT POSTURE • Concerned with flat yield curve • Positioned for rising rates • Low Cost Deposits more valuable in rising rate environment • Margin reached 3.91% in 4Q ‘04 (3.79% FY’04)
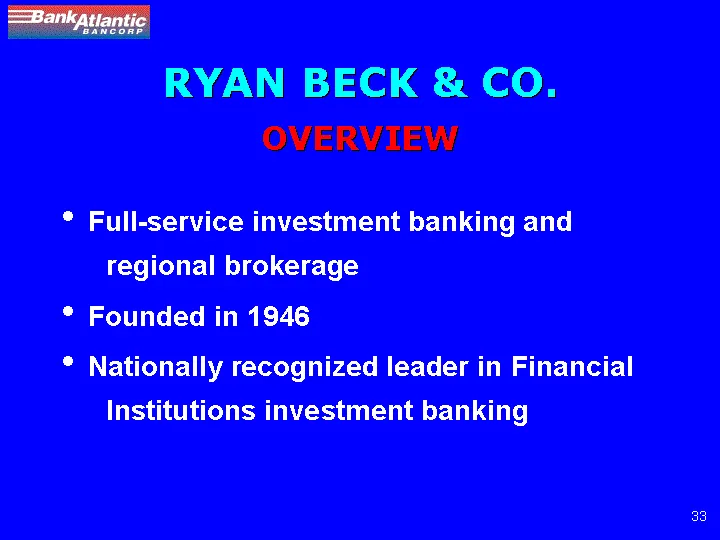
Slide 33: Ryan Beck & Co. Overview
RYAN BECK & CO. OVERVIEW • Full-service investment banking and regional brokerage • Founded in 1946 • Nationally recognized leader in Financial Institutions investment banking
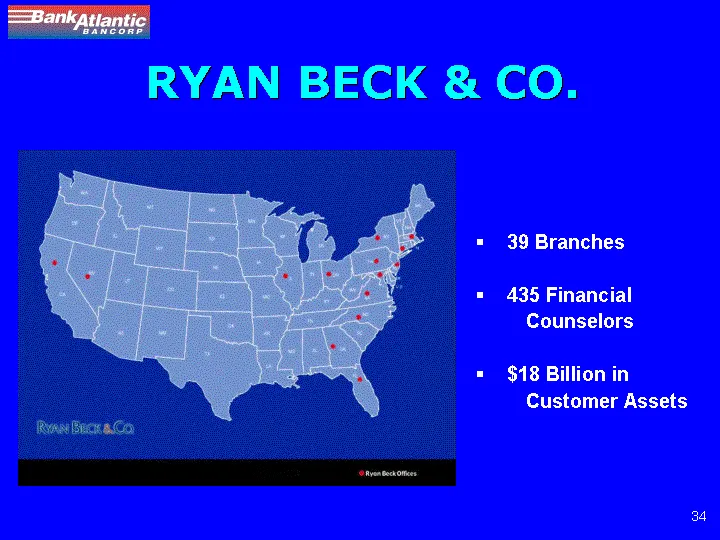
Slide 34: Ryan Beck & Co. Overview
RYAN BECK & CO. OVERVIEW RYAN BECK & CO. · 39 Branches · · 435 Financial Counselors · · $18 Billion in Customer Assets
Slide 35: Ryan Beck & Co. Total Revenue
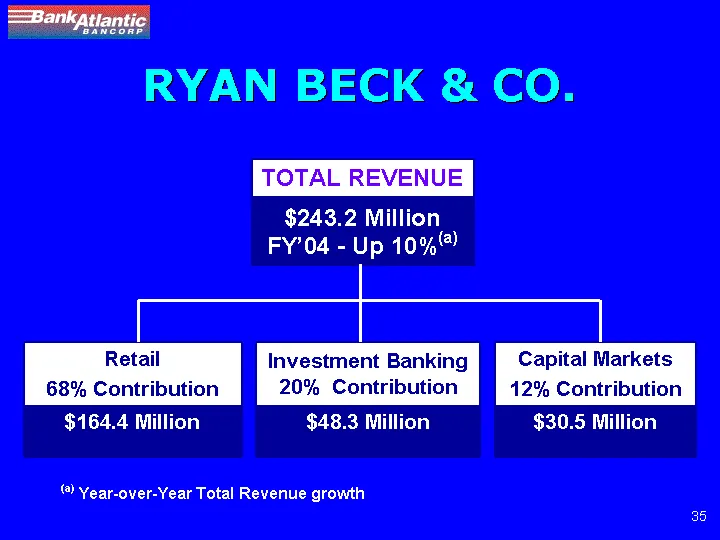
RYAN BECK & CO. TOTAL REVENUE $243.2 Million FY’04 — Up 10% (a) Retail 68% Contribution $164.4 Million Investment Banking 20% Contribution$48.3 MillionCapital Markets 12% Contribution $30.5 Million a) Year-over-Year Total Revenue growth

Slide 36: Financial Results
FINANCIAL RESULTS
Slide 37: Income from Continuing Operations
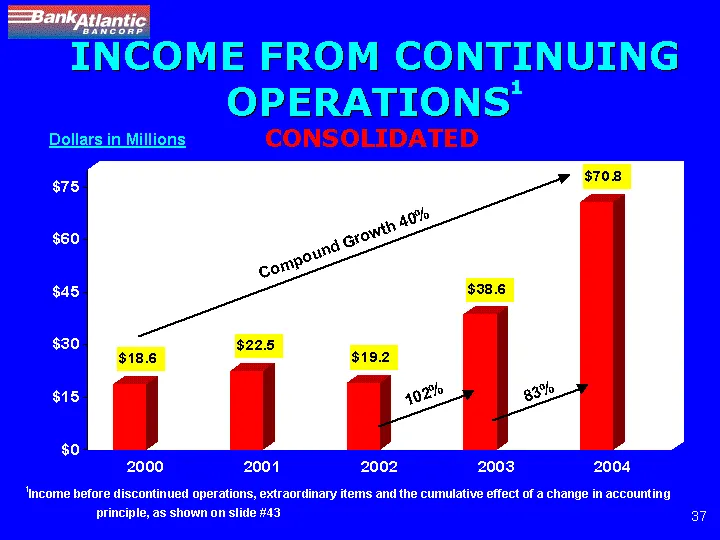
INCOME FROM CONTINUING OPERATIONS 1 Dollars in Millions CONSOLIDATED $18.6 $22.5$19.2$38.6$70.8 1 Income before discontinued operations, extraordinary items and the cumulative effect of a change in accounting principle, as shown on slide #43 Compound Growth 40% 102% 83% CONSOLIDATED
Slide 38: Operating Net Income
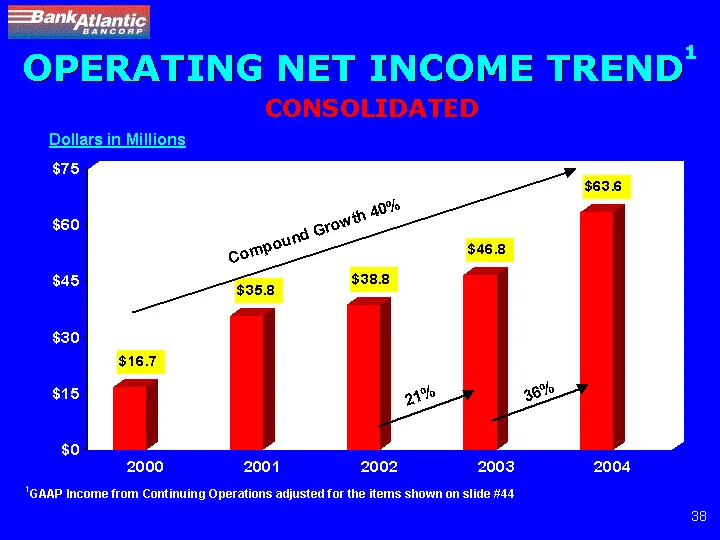
20002001200220032004 Operating Net Income $16.7$35.8$38.8$46.8$63.6 $0 $15 $30 $45 $60 $7 5 Compound Growth 40%
Slide 39: EPS from Continuing Operations
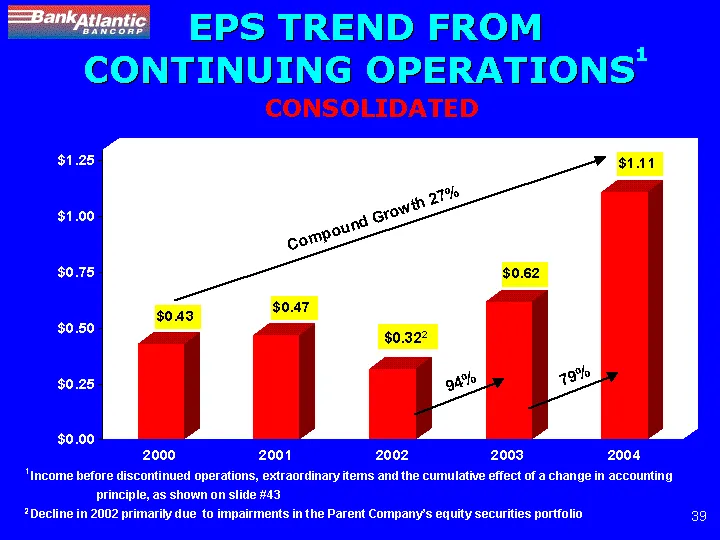
Compound Growth 27% 1 Income before discontinued operations, extraordinary items and the cumulative effect of a change in accounting principle, as shown on slide #43 2 Decline in 2002 primarily due to impairments in the Parent Company’s equity securities portfolio $0.43 $0.47 $0.62 $1.11 94% 79% $0.
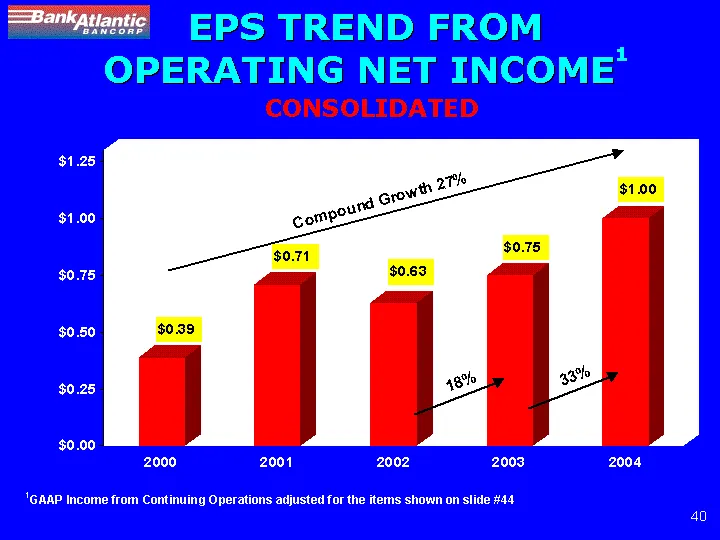
Slide 40: EPS Trend from Operating Net Income
EPS TREND FROM OPERATING NET INCOME 1 CONSOLIDATED Compound Growth 27% 1 GAAP Income from Continuing Operations adjusted for the items shown on slide #44 33% 18% $0.39$0.71$0.63$0.75 $1.00 200020012002 2003 2004 EPS from Operating Income 0.39 0.71 0.63 0.75 1

Slide 41: Stockholder Value
STOCKHOLDER VALUE
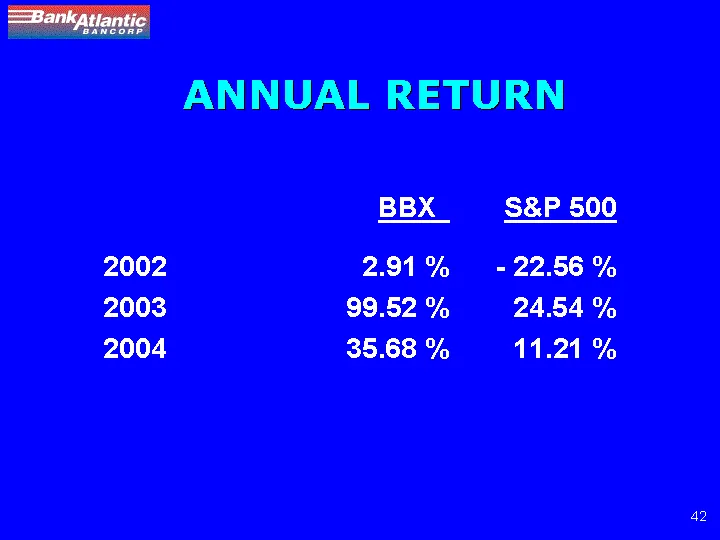
Slide 42: Annual Return BBX vs S&P
ANNUAL RETURN BBX S&P 500 — 2002 2.91 %- 22.56 % 2003 99.52 % 24.54 % 2004 35.68 % 11.21 %
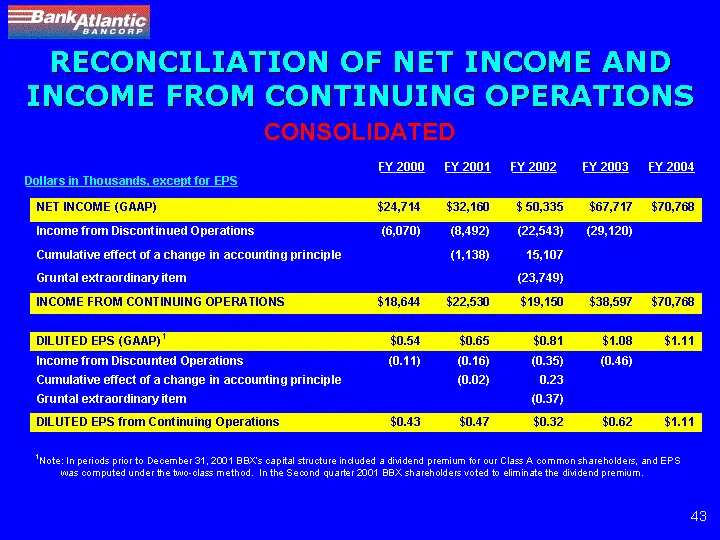
Slide 43: Reconciliation of Net Income and Income from Continuing Operations
RECONCILIATION OF NET INCOME AND INCOME FROM CONTINUING OPERATIONS FY 2001 CONSOLIDATED Dollars in Thousands, except for EPS FY 2000 FY 2001 FFY 2002 FY 2003 FY 2004 NET INCOME (GAAP)$24,714$32,160 $50,335 $67,717$70,768 Income from Discontinued Operations(6,070) (8,492) (22,543)(29,120) Cumulative
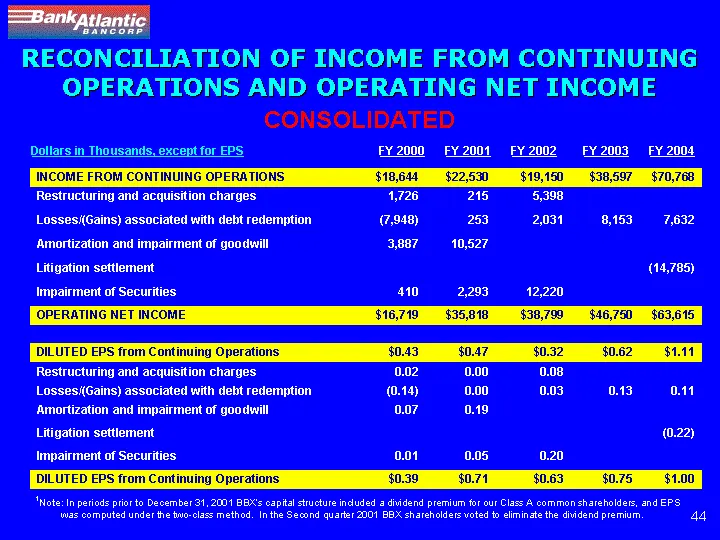
Slide 44: Reconciliation of Income from Continuing Operations and Operating Net Income
RECONCILIATION OF INCOME FROM CONTINUING OPERATIONS AND OPERATING NET INCOME CONSOLIDATED Dollars in Thousands, except for EPS FY 2000 FY 2001 FY 2002 FY 2003 FY 2004 INCOME FROM CONTINUING OPERATIONS $18,644 $22,530 $19,150 $38,597 $70,768 Restructuring and acquisition charges 1,726 215 5,398 Losse
Slide 45: Forward-Looking Information
FORWARD-LOOKING INFORMATION Except for historical information contained herein, the matters discussed in these slides contain forward-looking statements within the meaning of Section 27A of the Securities Act of 1933, as amended (the “Securities Act”), and Section 21E of the Securities Exchange Act

Slide 46

Slide 47: Supplemental Data
SUPPLEMENTAL DATA
Slide 48: Earnings Contribution BankAtlantic Bancorp
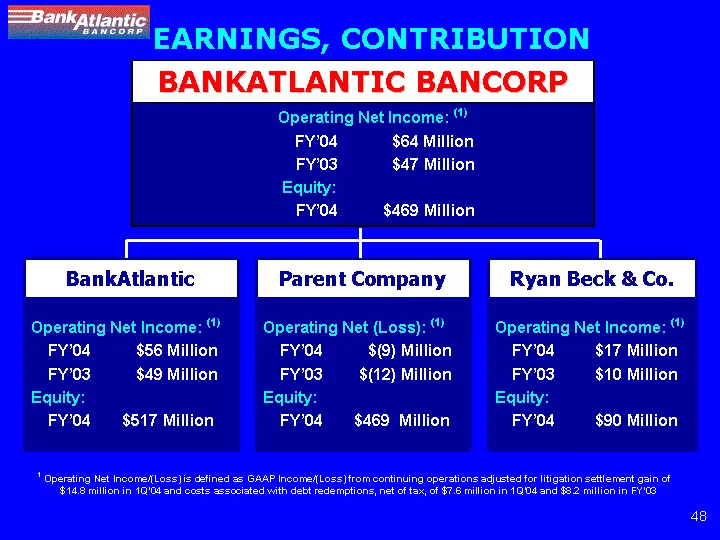
EARNINGS, CONTRIBUTION BANKATLANTIC BANCORP Operating Net Income: (1) FY’04 $64 Million FY’03 $47 Million Equity: FY’04 $469 Million BankAtlantic Parent Company Ryan Beck & Co. Operating Net Income: (1) FY’04 $56 Million FY’03 $49 Million Equity: FY’04 $517 Million Operating Net (Loss): (1) FY’04 $(
Slide 49: Net Interest Margin Bank Operations
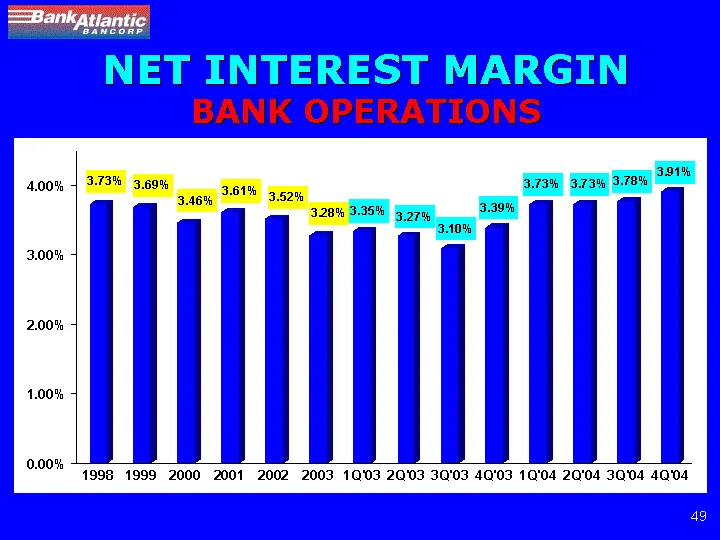
NET INTEREST MARGIN BANK OPERATIONS 1998 1999 2000 2001 2002 2003 1Q ‘03 2Q’03 3Q’03 4Q’03 1Q’04 2Q’04 3Q’04 4Q’04 0.00% 1.00% 2.00% 3.00% 4.00% 3.73% 3.69% 3.46% 3.61% 3.52% 3.28% 3.35% 3.27% 3.10% 3.39% 3.73% 3.73% 3.78% 3.91% FY 2000 FY 2001FY 2001 00
Slide 50: Net Interest Margin: Funding Mix
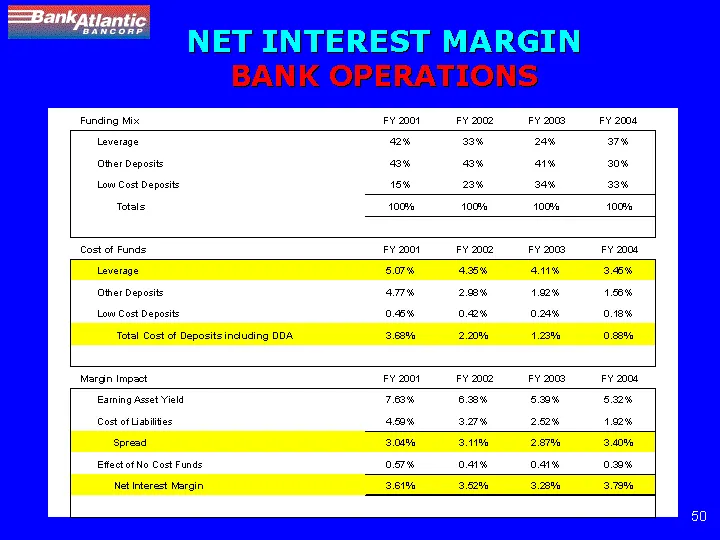
NET INTEREST MARGIN BANK OPERATIONS Funding Mix FY 2001 FY 2002 FY 2003 FY 2004 Leverage 42%33% 24% 37% Other Deposits 43% 43% 41% 30% Low Cost Deposits 15% 23% 34% 33% Totals 100%100% 100% 100% Cost of Funds FY 2001 FY 2002 FY 2003 FY 2004 Leverage 5.07%4.35% 4.11% 3.45% Other Deposits 4.77% 2.98%
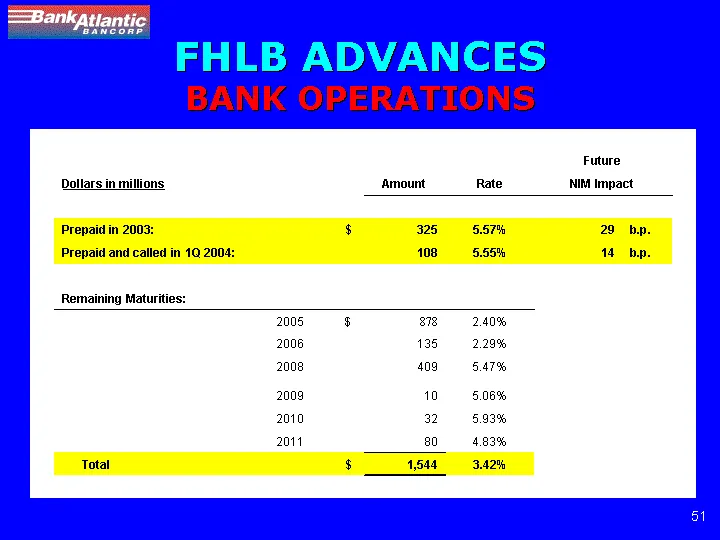
Slide 51: FHLB Advances Bank Operations
FHLB ADVANCES BANK OPERATIONS Future Dollars in millions Amount Rate NIM Impact — Prepaid in 2003: $ 325 5.57% 29 b.p. Prepaid and called in 1Q 2004: 108 5.55% 14 b.p. Remaining Maturities: 2005 $ 878 2.40% 2006 135 2.29% 2008 409 5.47% 2009 10 5.06% 2010 32 5.93% 2011 80 4.83% Total $ 1,544 3.42%
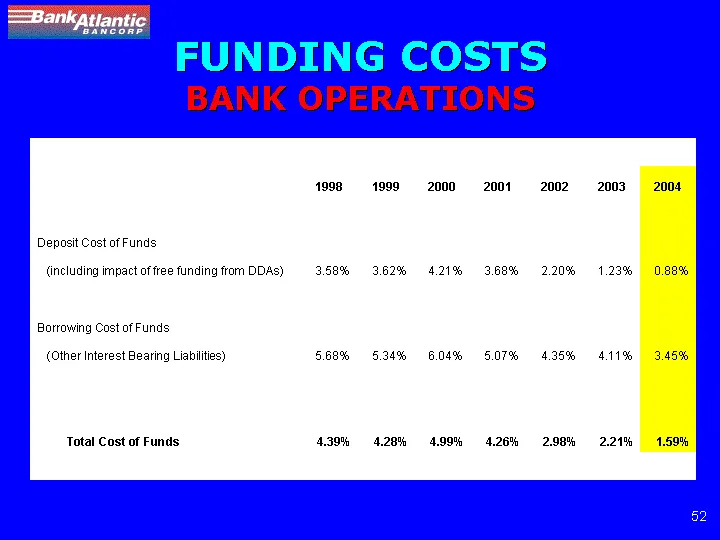
Slide 52: Funding Costs Bank Operations
FUNDING COSTS BANK OPERATIONS 1998 1999 2000 2001 2002 2003 2004 Deposit Cost of Funds (including impact of free funding from DDAs) 3.58% 3.62% 4.21% 3.68% 2.20% 1.23% 0.88% Borrowing Cost of Funds (Other Interest Bearing Liabilities) 5.68% 5.34% 6.04% 5.07% 4.35% 4.11% 3.45% Total Cost of Funds 4.3
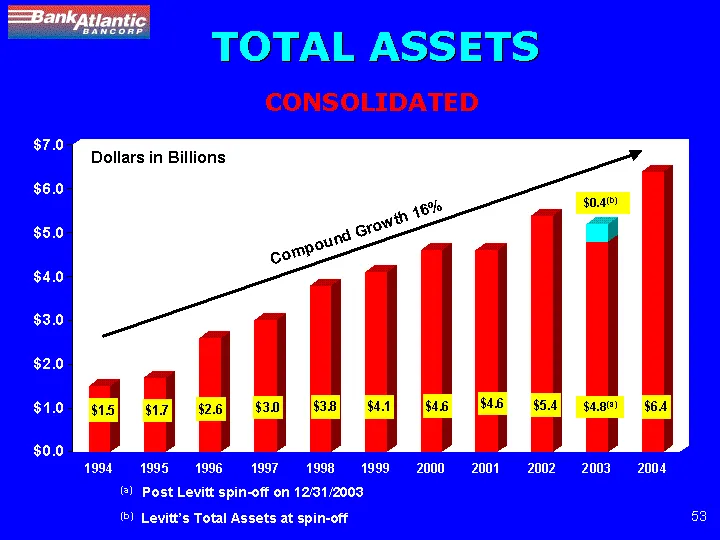
Slide 53: Total Assets Consolidated
TOTAL ASSETS CONSOLIDATED Dollars in Billions Compound Growth 16% $7.00 $6.00 $5.00 $4.00 $3.00 $2.00 $1.00 $0.00 1994 1995 1996 1997 1998 1999 2000 2001 2002 2003 2004 $1.5 $1.7 $2.6 $3.0 $3.8 $4.1 $4.6 $4.6 $5.4 $4.8 (a) $6.4 $0.4(b) (a) Post Levitt spin-off on 12/31/2003 (b) Levitt’s Total Assets
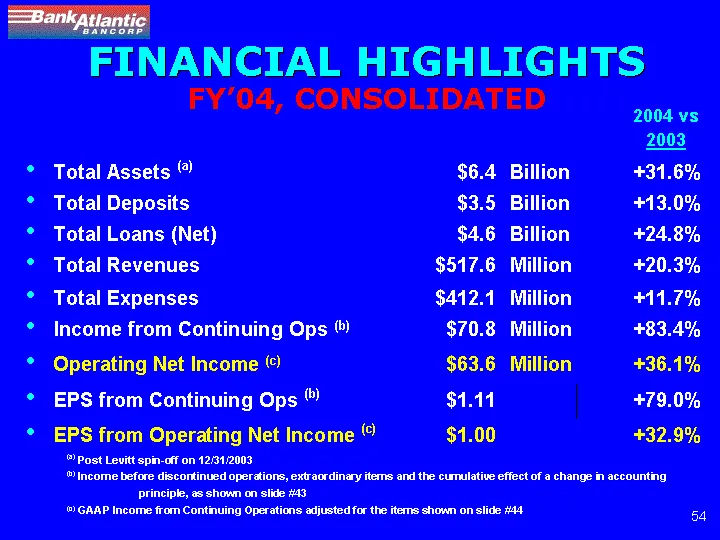
Slide 54: Financial Highlights FY'04 Consolidated
FINANCIAL HIGHLIGHTS FY’04, CONSOLIDATED • Total Assets (a) $6.4 Billion +31.6% • Total Deposits $3.5Billion +13.0% • Total Loans (Net) $4.6 Billion +24.8% • Total Revenues $517.6 Million +20.3% • Total Expenses $412.1 Million +11.7% • Income from Continuing Ops (b) $70.8 Million +83.4% • Operating

Slide 55
Source: SEC EDGAR · 8-K filed Feb 17, 2005
More decks from BBX Capital Inc
 Merger or Acquisition (November 2016)60 slides · Nov 21, 2016
 Merger or Acquisition (October 2016)61 slides · Oct 11, 2016
 Merger or Acquisition (July 2016)11 slides · Jul 28, 2016
 Investor Presentation (November 2014)77 slides · Nov 26, 2014
 Merger or Acquisition (November 2014)77 slides · Nov 26, 2014
 Merger or Acquisition (September 2014)74 slides · Sep 19, 2014