CYS Investments — Banking and Financial Services Conference 2014
21 slides from CYS Investments's conference presentation, Nov 13, 2014
Slide 1: Investment Outlook
EXHIBIT 99.1 Investment Outlook Kevin Grant Chief Executive Officer Banking and Financial Services Conference November 13, 2014
Slide 2: Forward-Looking Statements
Forward-Looking Statements This presentation contains forward-looking statements, within the meaning of Section 27A of the Securities Act of 1933, as amended, and Section 21E of the Securities Exchange Act of 1934, as amended, that are based on management’s beliefs and assumptions, current expectati
Slide 3: CYS Overview
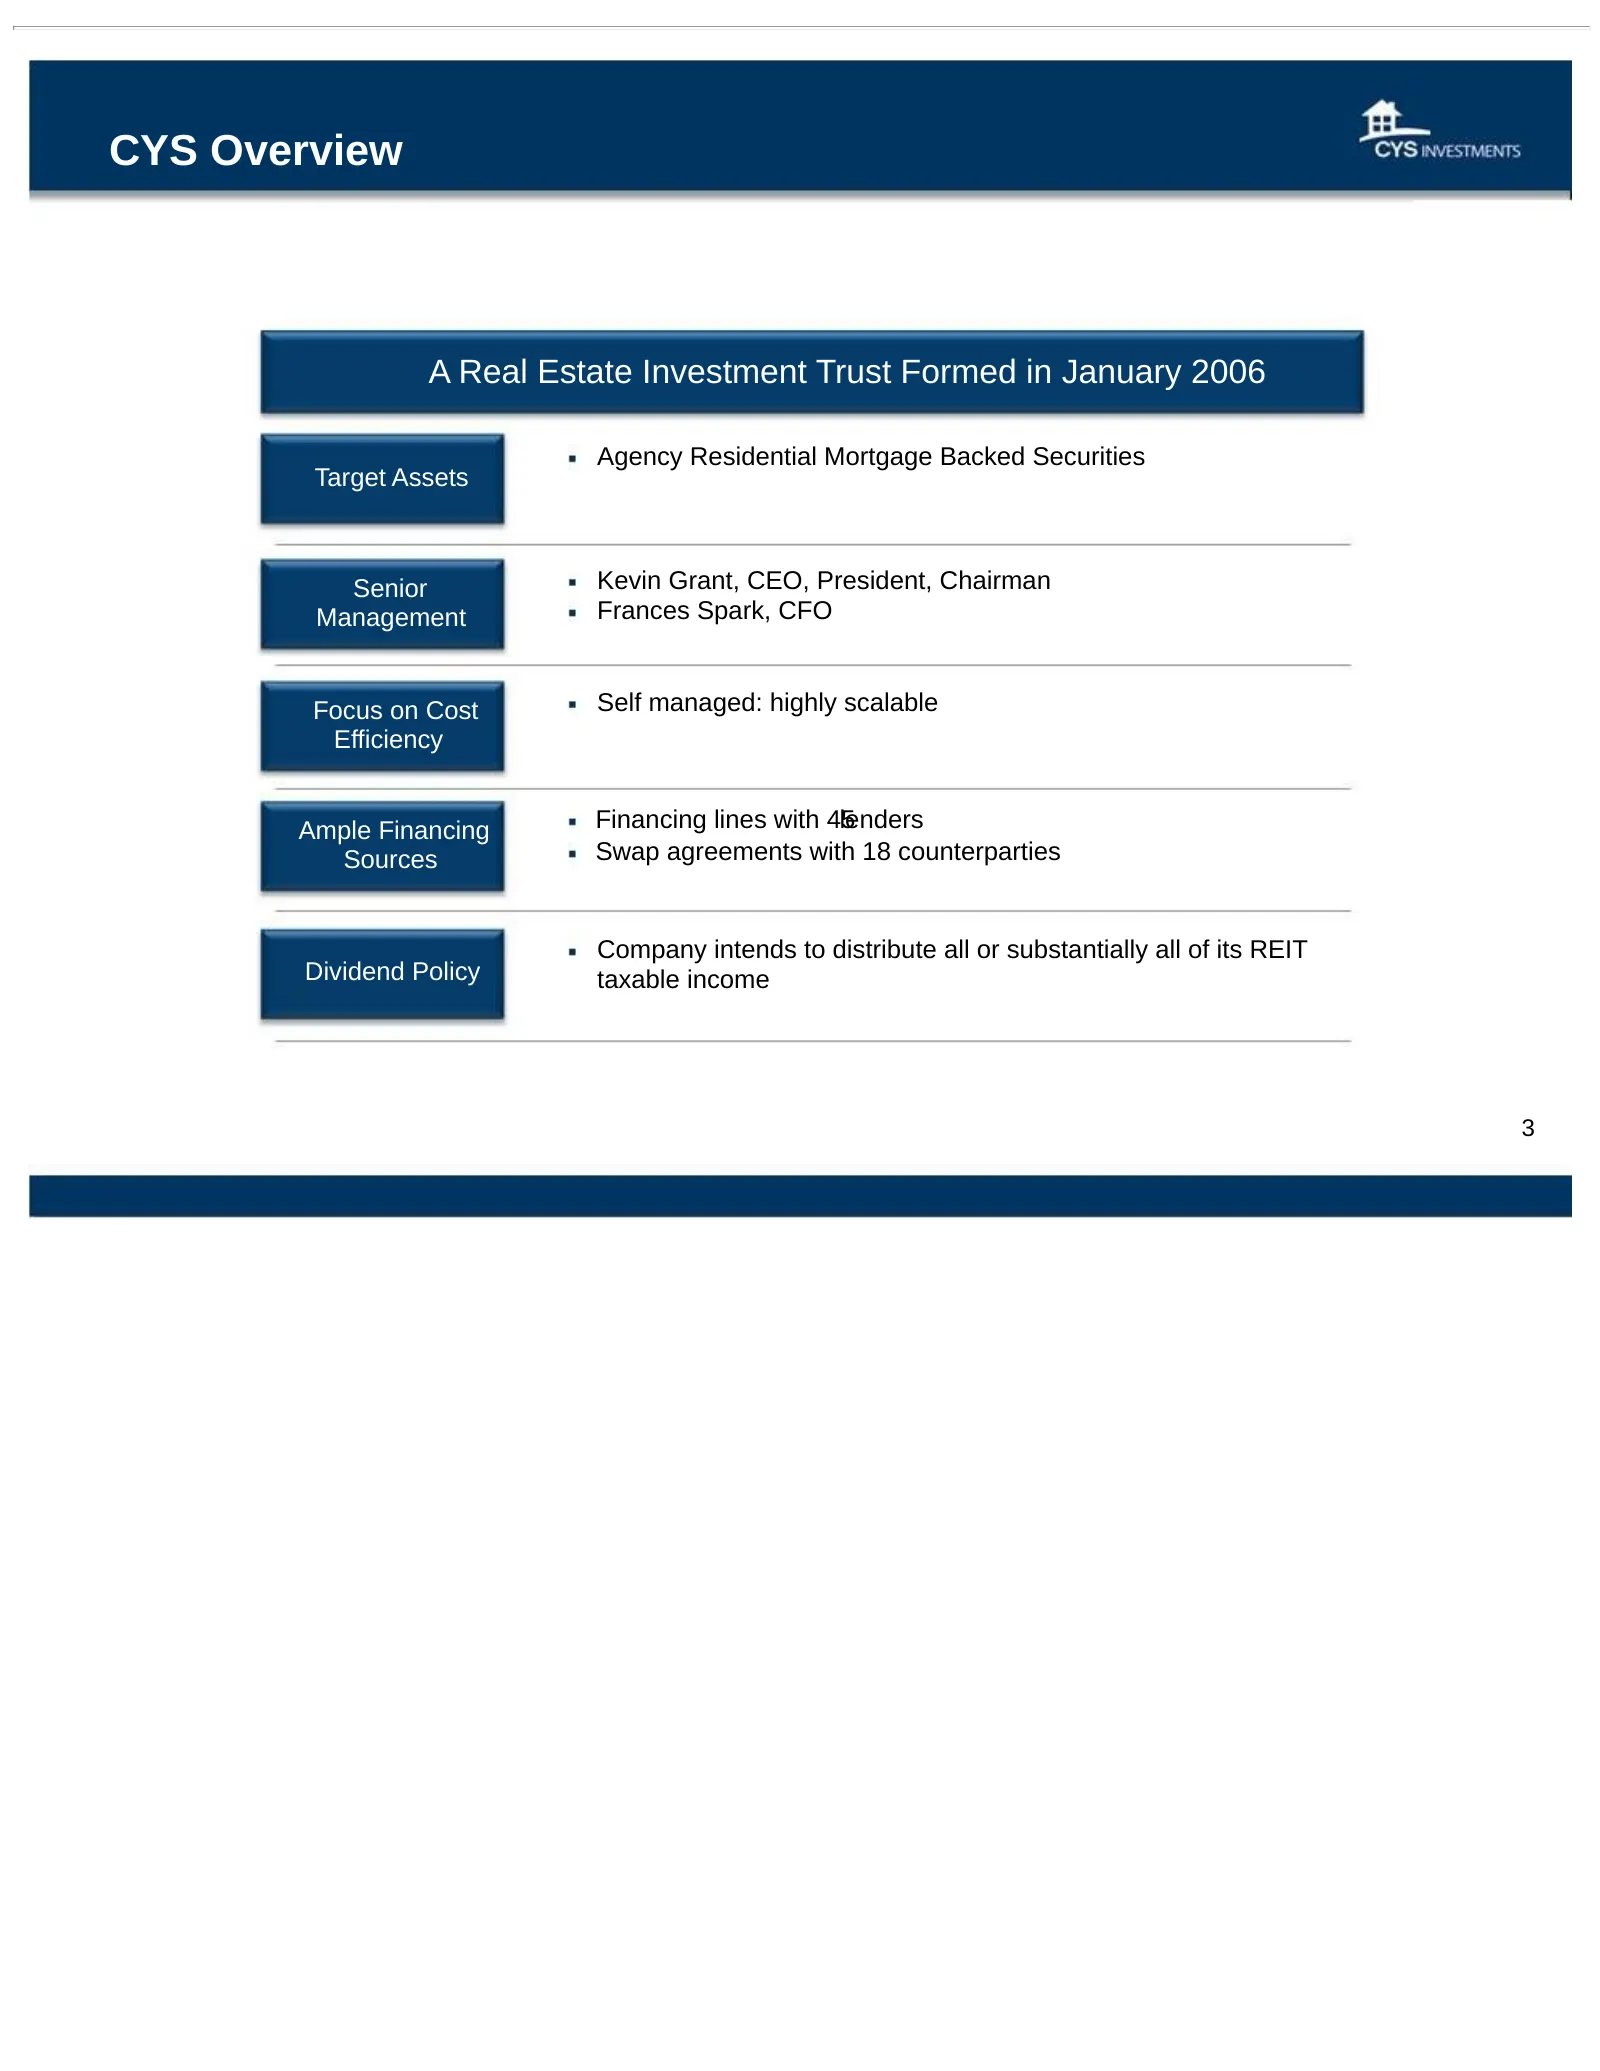
CYS Overview A Real Estate Investment Trust Formed in January 2006 Agency Residential Mortgage Backed Securities Target Assets Senior Kevin Grant, CEO, President, Chairman Management Frances Spark, CFO Focus on Cost Self managed: highly scalable Efficiency Ample Financing Financing lines with 45 len
Slide 4: Agency MBS Market Continues To See Strong Demand: 15 Year Hedged vs. Unhedged
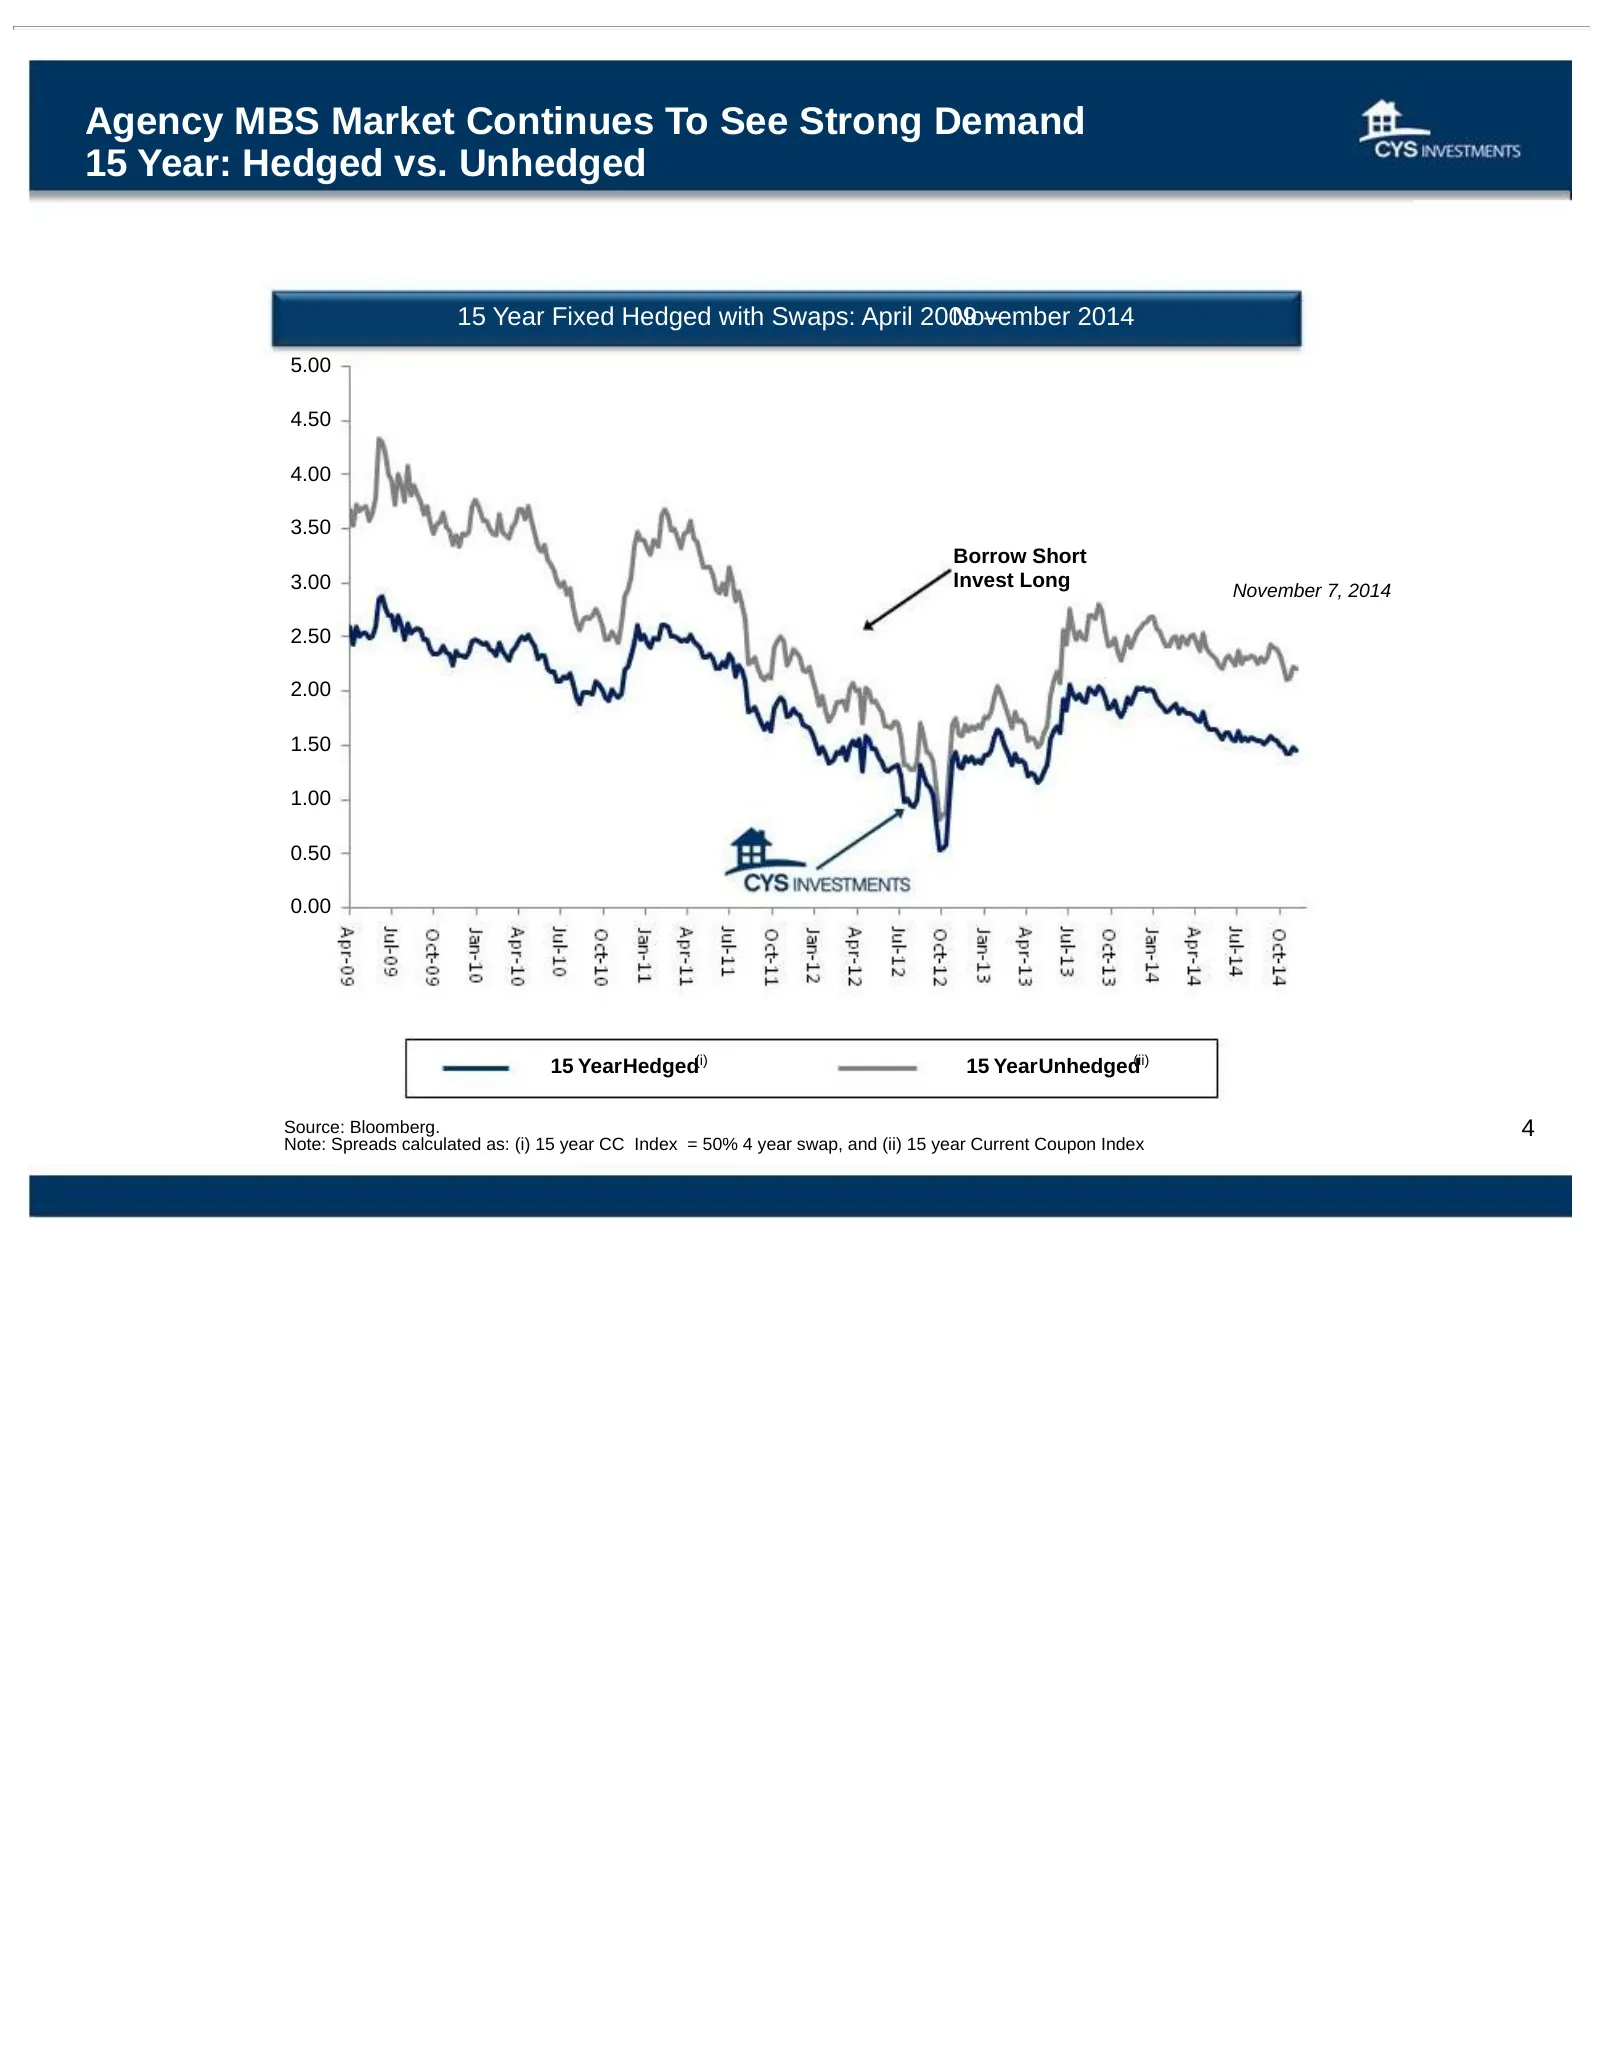
Agency MBS Market Continues To See Strong Demand 15 Year: Hedged vs. Unhedged 15 Year Fixed Hedged with Swaps: April 2009 November – 2014 5.00 4.50 4.00 3.50 Borrow Short 3.00 Invest Long November 7, 2014 2.50 2.00 1.50 1.00 0.50 0.00 15 YearHedged(i) 15 YearUnhedged(ii) Source: Bloomberg. 4 Note: S
Slide 5: Agency MBS Market Continues To See Strong Demand: 30 Year Hedged vs. Unhedged
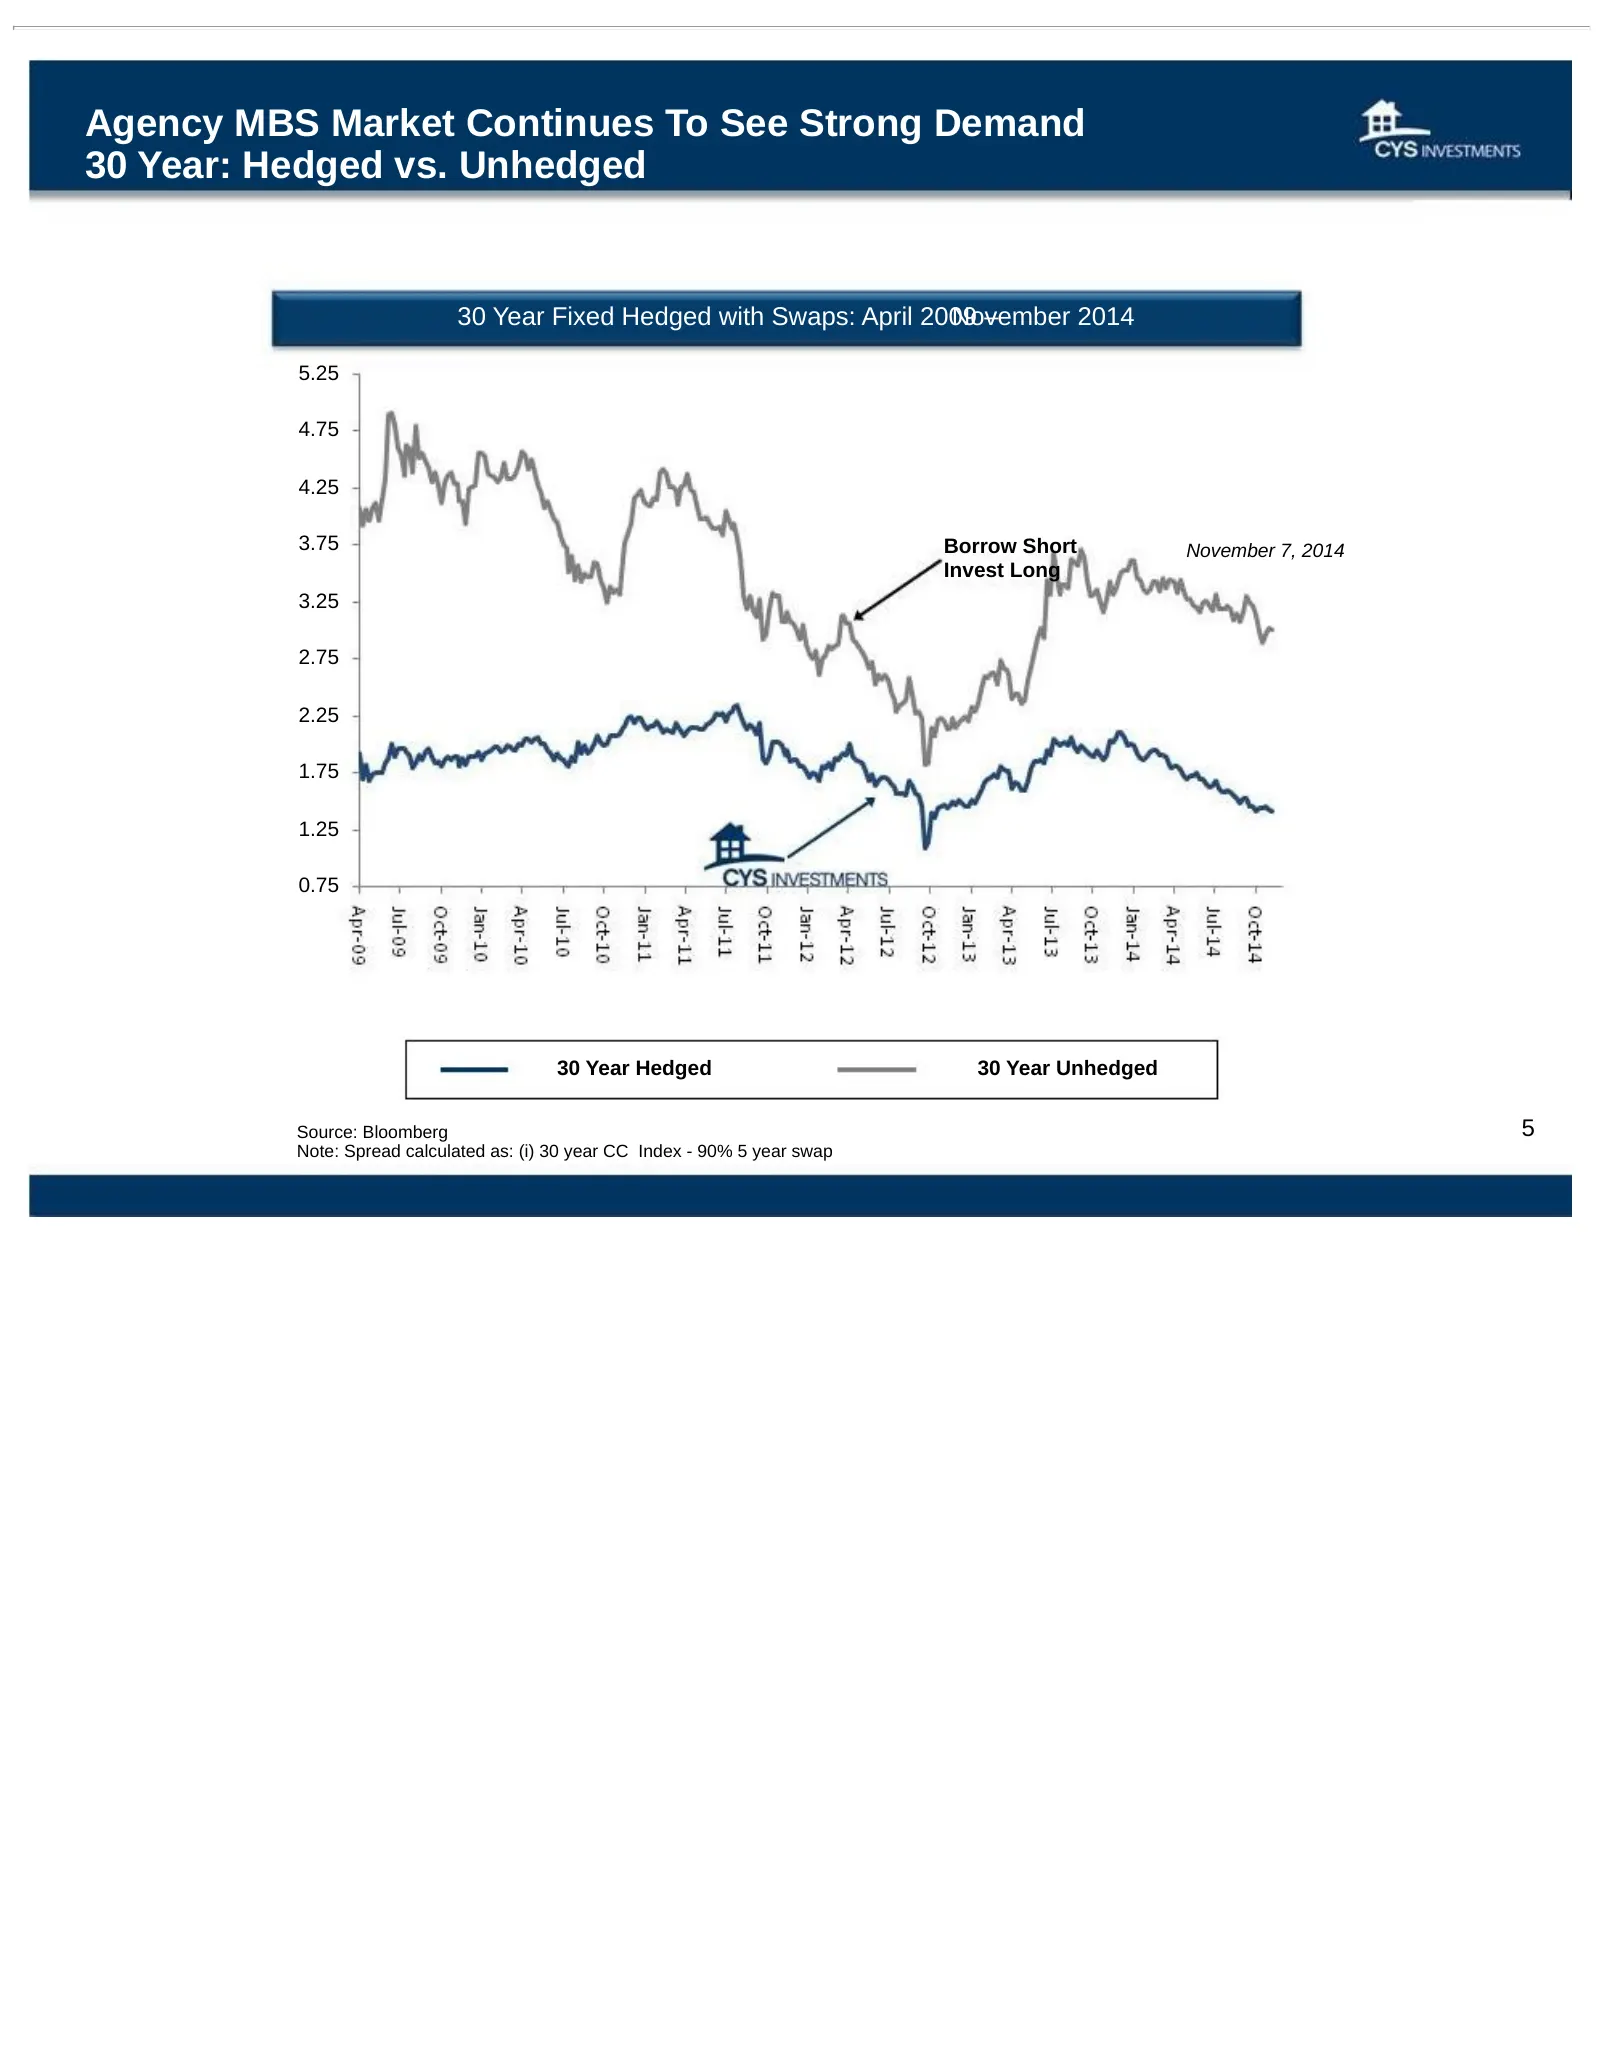
Agency MBS Market Continues To See Strong Demand 30 Year: Hedged vs. Unhedged 30 Year Fixed Hedged with Swaps: April 2009 November – 2014 5.25 4.75 4.25 3.75 Borrow Short November 7, 2014 Invest Long 3.25 2.75 2.25 1.75 1.25 0.75 30 Year Hedged 30 Year Unhedged Source: Bloomberg 5 Note: Spread calcu
Slide 6: End of QE Poses New Risks and New Opportunities
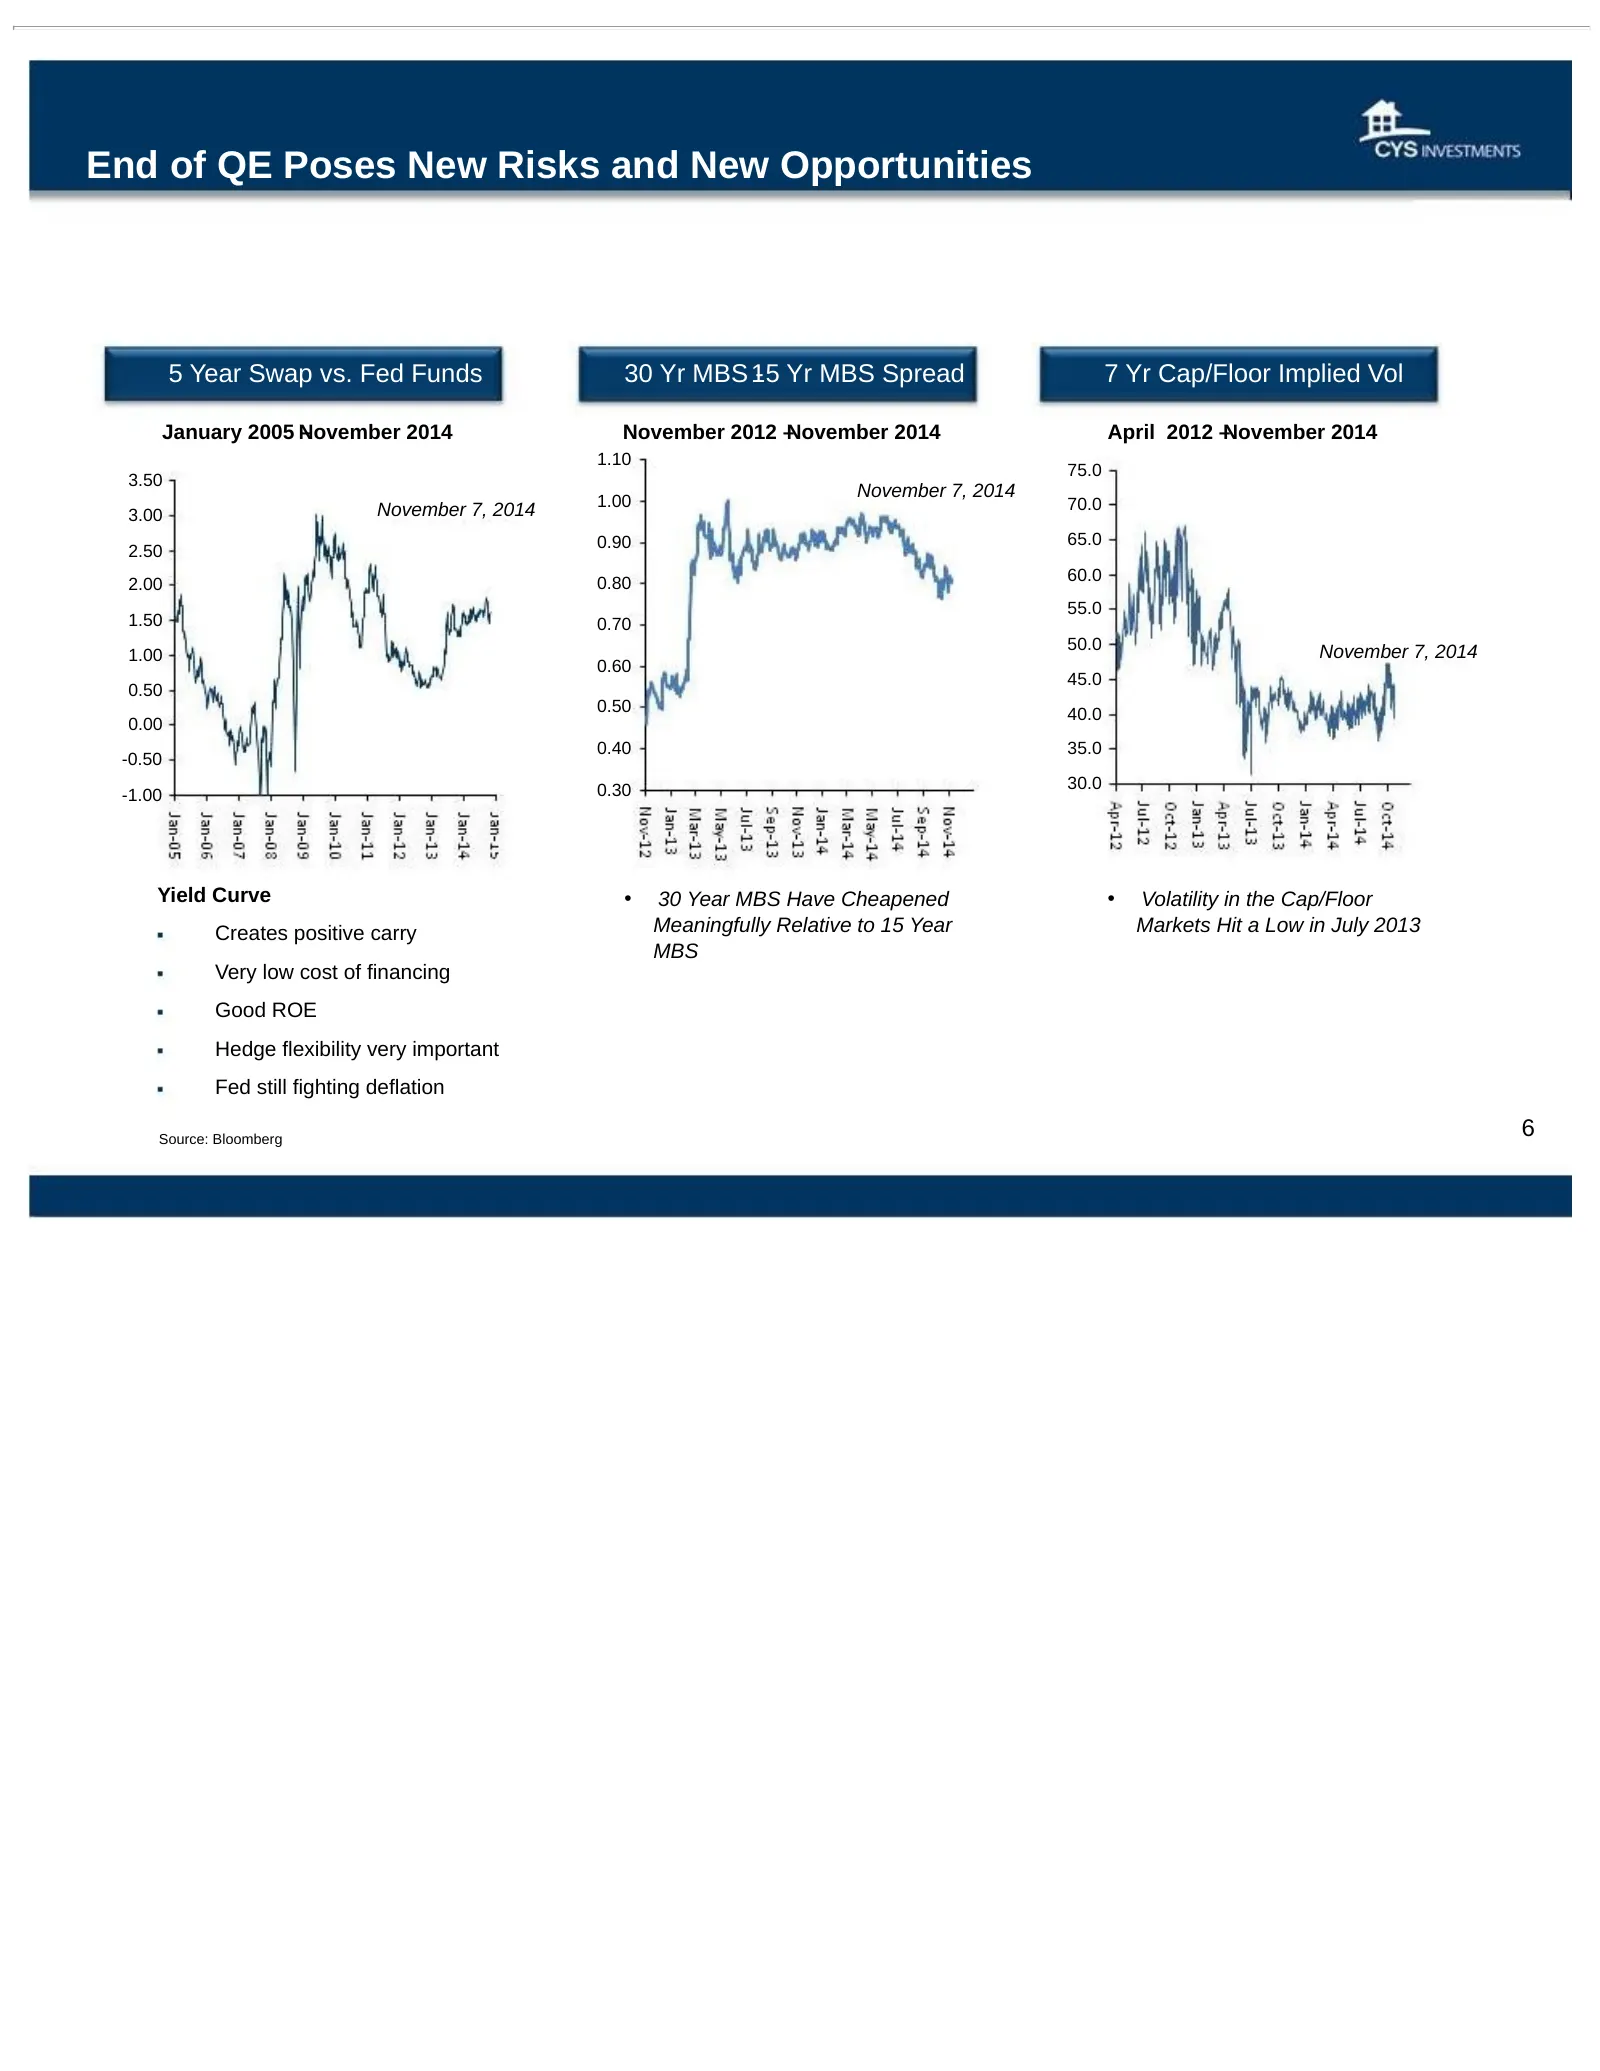
End of QE Poses New Risks and New Opportunities 5 Year Swap vs. Fed Funds 30 Yr MBS 15 - Yr MBS Spread 7 Yr Cap/Floor Implied Vol January 2005 N – ovember 2014 November 2012 –November 2014 April 2012 –November 2014 1.10 75.0 3.50 1.00 November 7, 2014 November 7, 2014 70.0 3.00 0.90 65.0 2.50 0.80 6
Slide 7: Global Ten Year Yields: Is U.S. Growth Out of Sync with Rest of World?
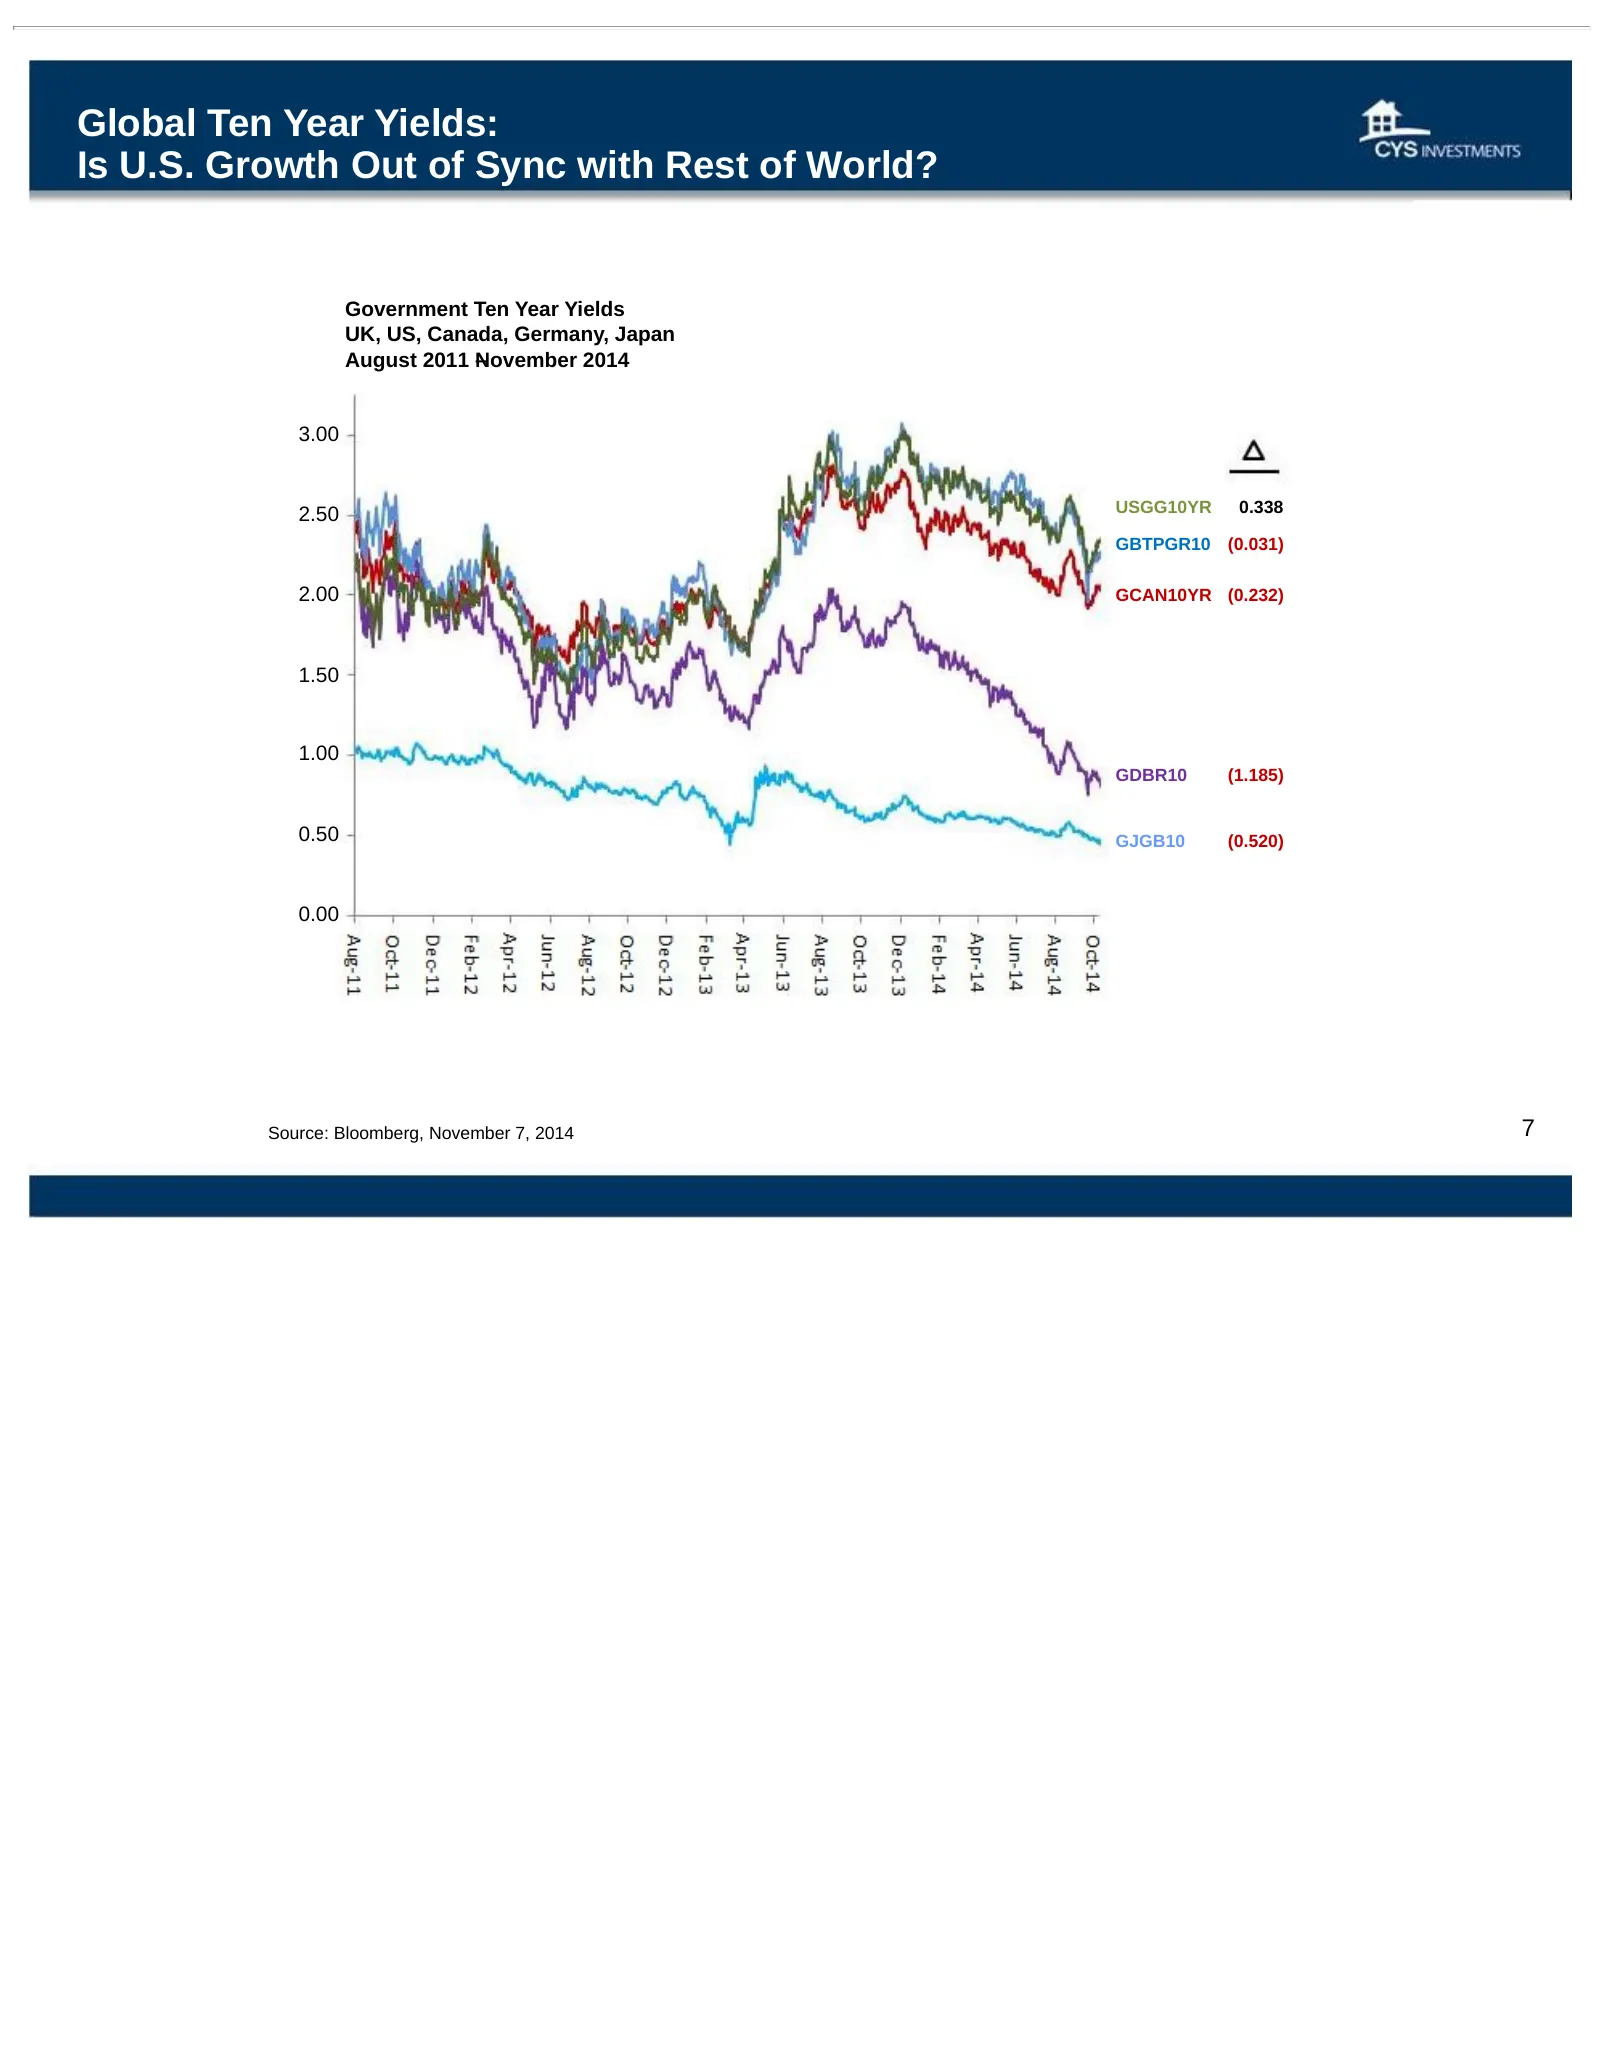
Global Ten Year Yields: Is U.S. Growth Out of Sync with Rest of World? Government Ten Year Yields UK, US, Canada, Germany, Japan August 2011 – November 2014 3.00 2.50 USGG10YR 0.338 GBTPGR10 (0.031) 2.00 GCAN10YR (0.232) 1.50 1.00 GDBR10 (1.185) 0.50 GJGB10 (0.520) 0.00 Source: Bloomberg, November 7
Slide 8: Actual Economic Performance: Sluggish vs. Fed Projections
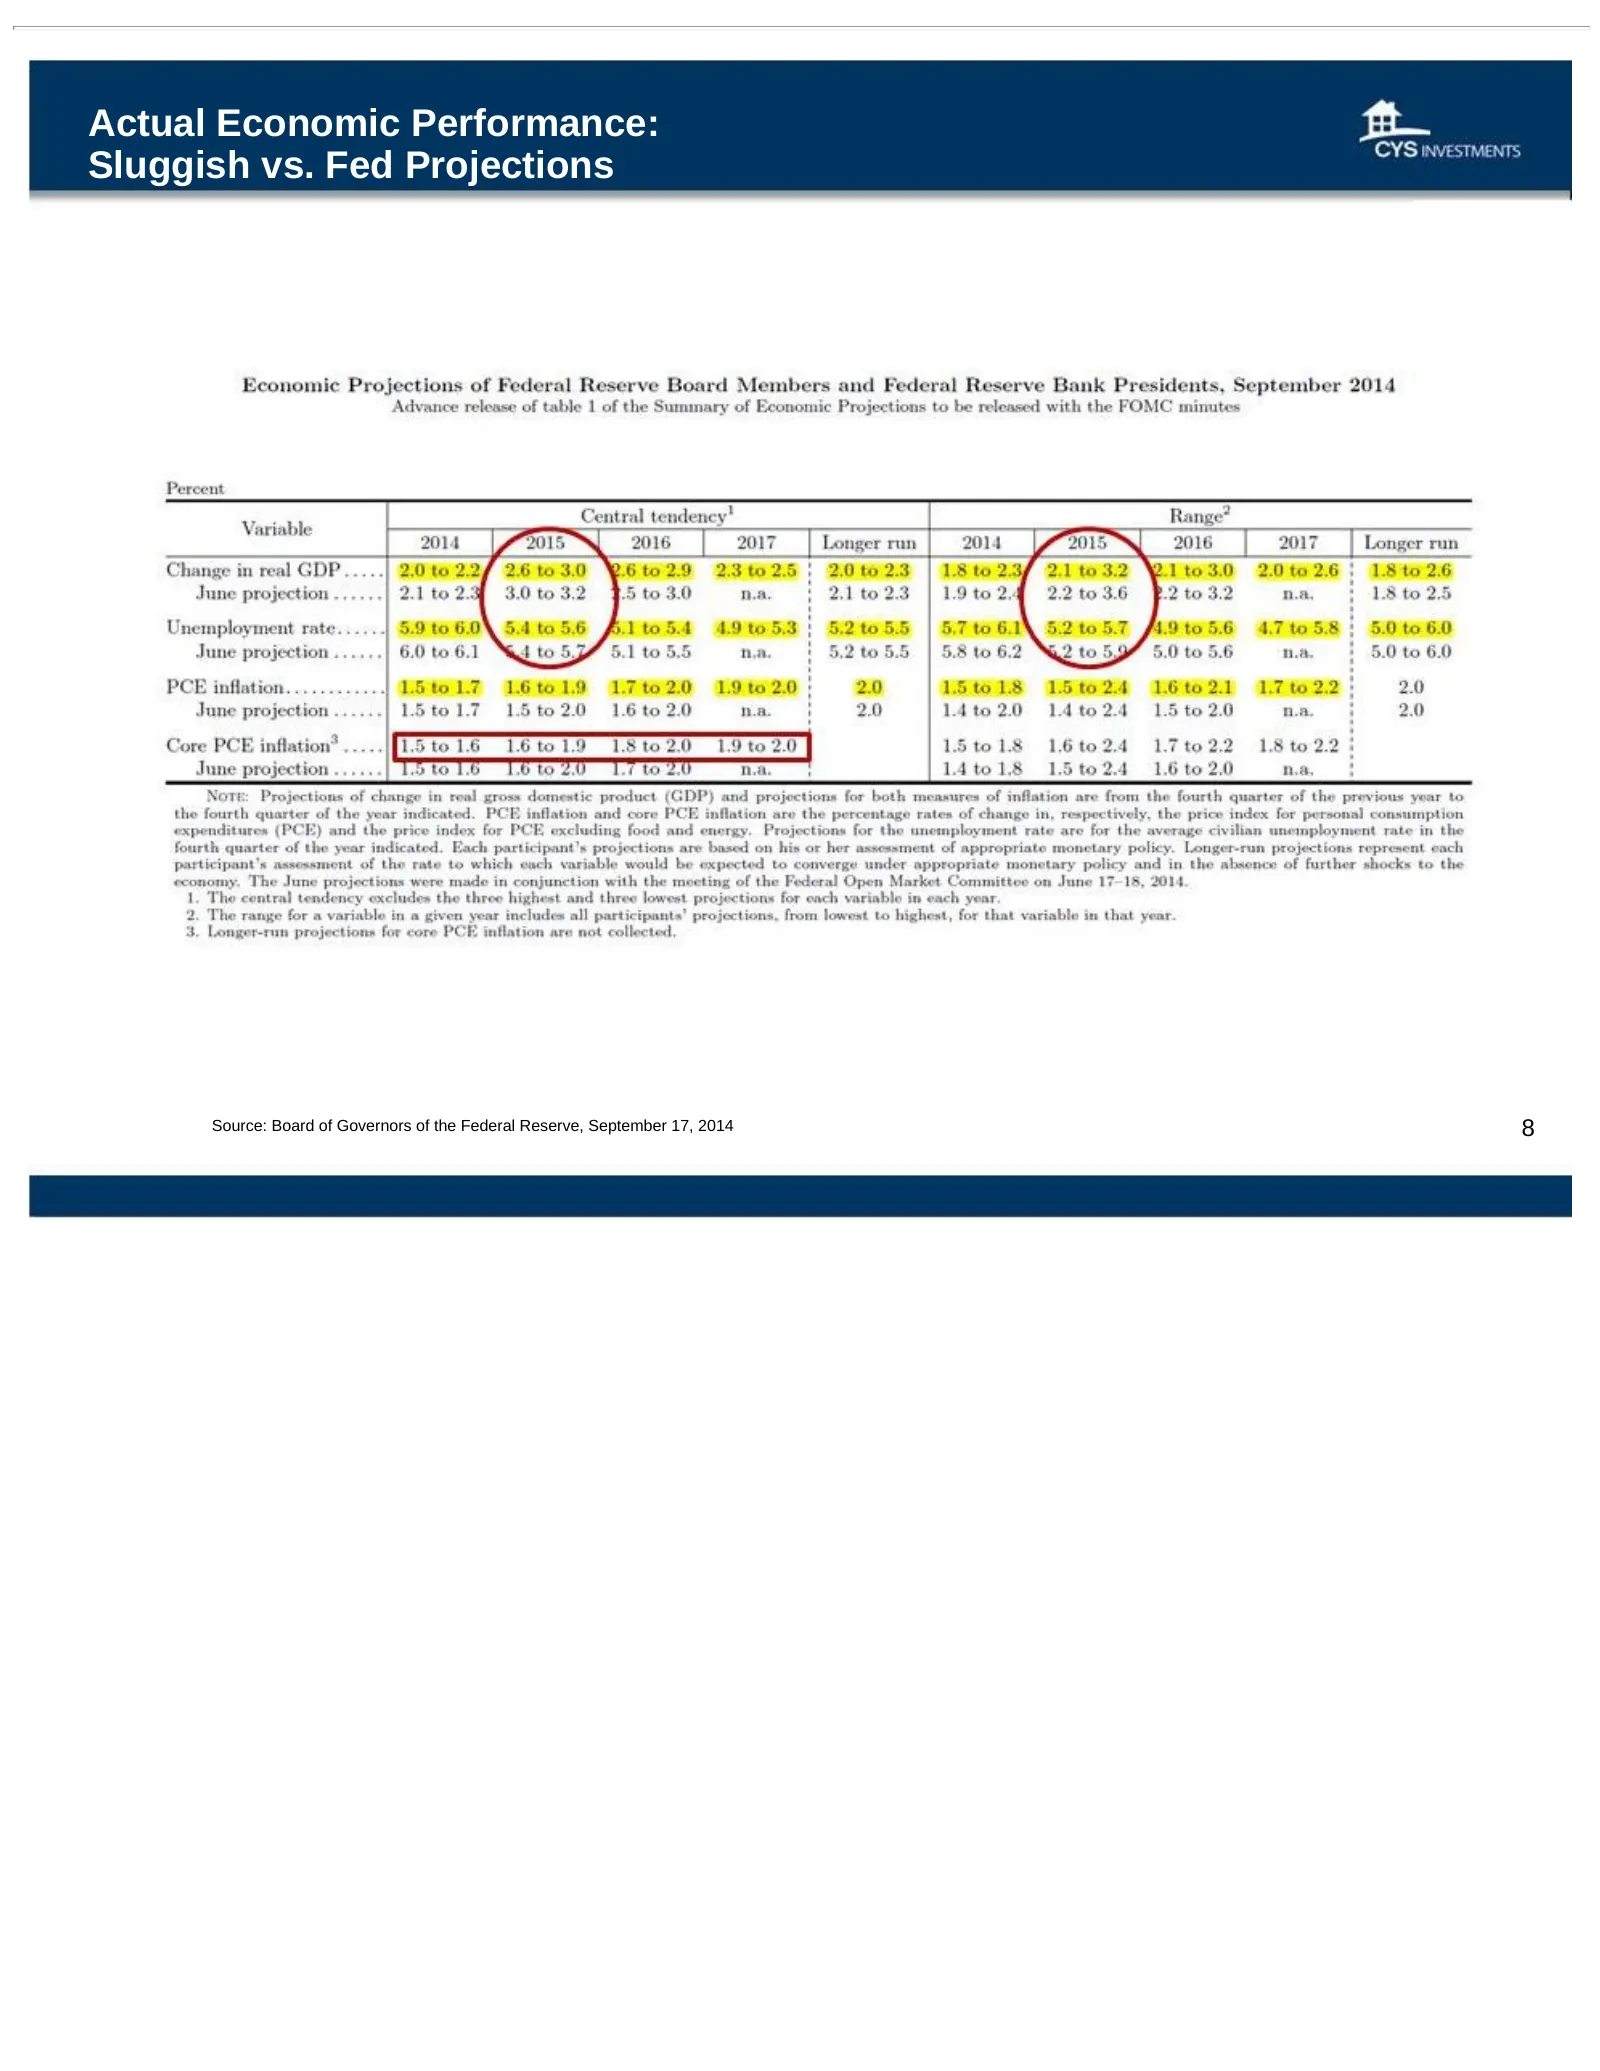
Actual Economic Performance: Sluggish vs. Fed Projections Source: Board of Governors of the Federal Reserve, September 17, 2014 8
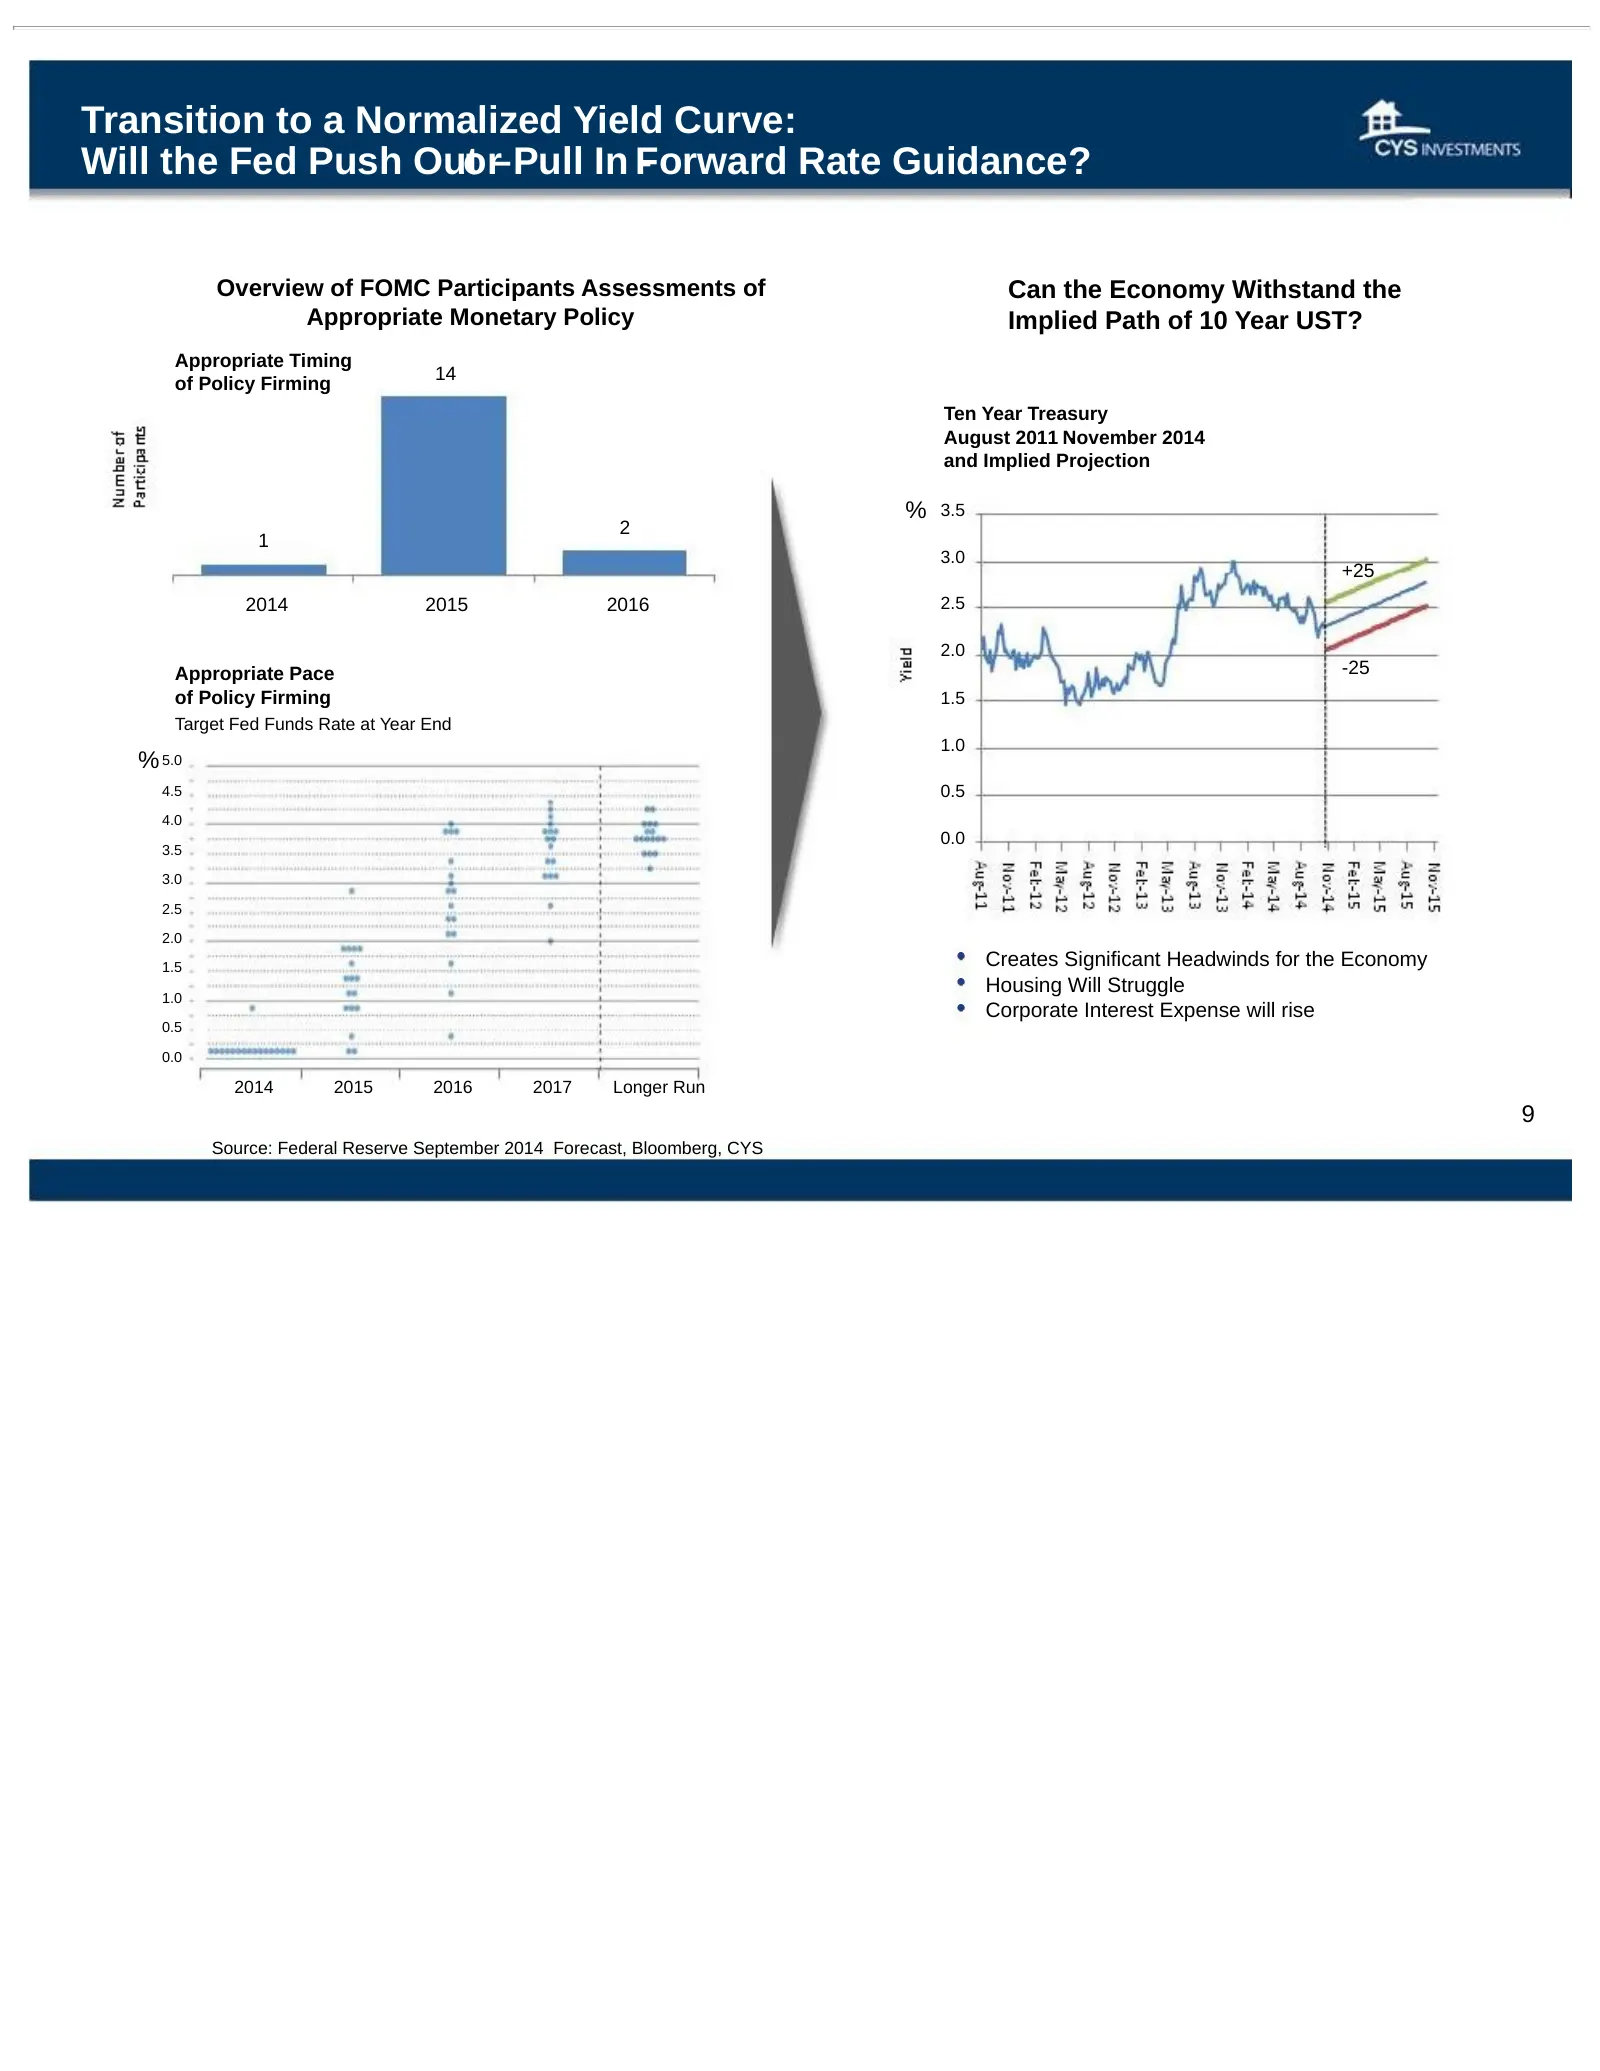
Slide 9: Transition to a Normalized Yield Curve: Will the Fed Push Out or Pull In Forward Rate Guidance?
Transition to a Normalized Yield Curve: Will the Fed Push Outor– Pull In F - orward Rate Guidance? Overview of FOMC Participants Assessments of Can the Economy Withstand the Appropriate Monetary Policy Implied Path of 10 Year UST? Appropriate Timing 14 of Policy Firming Ten Year Treasury August 2011
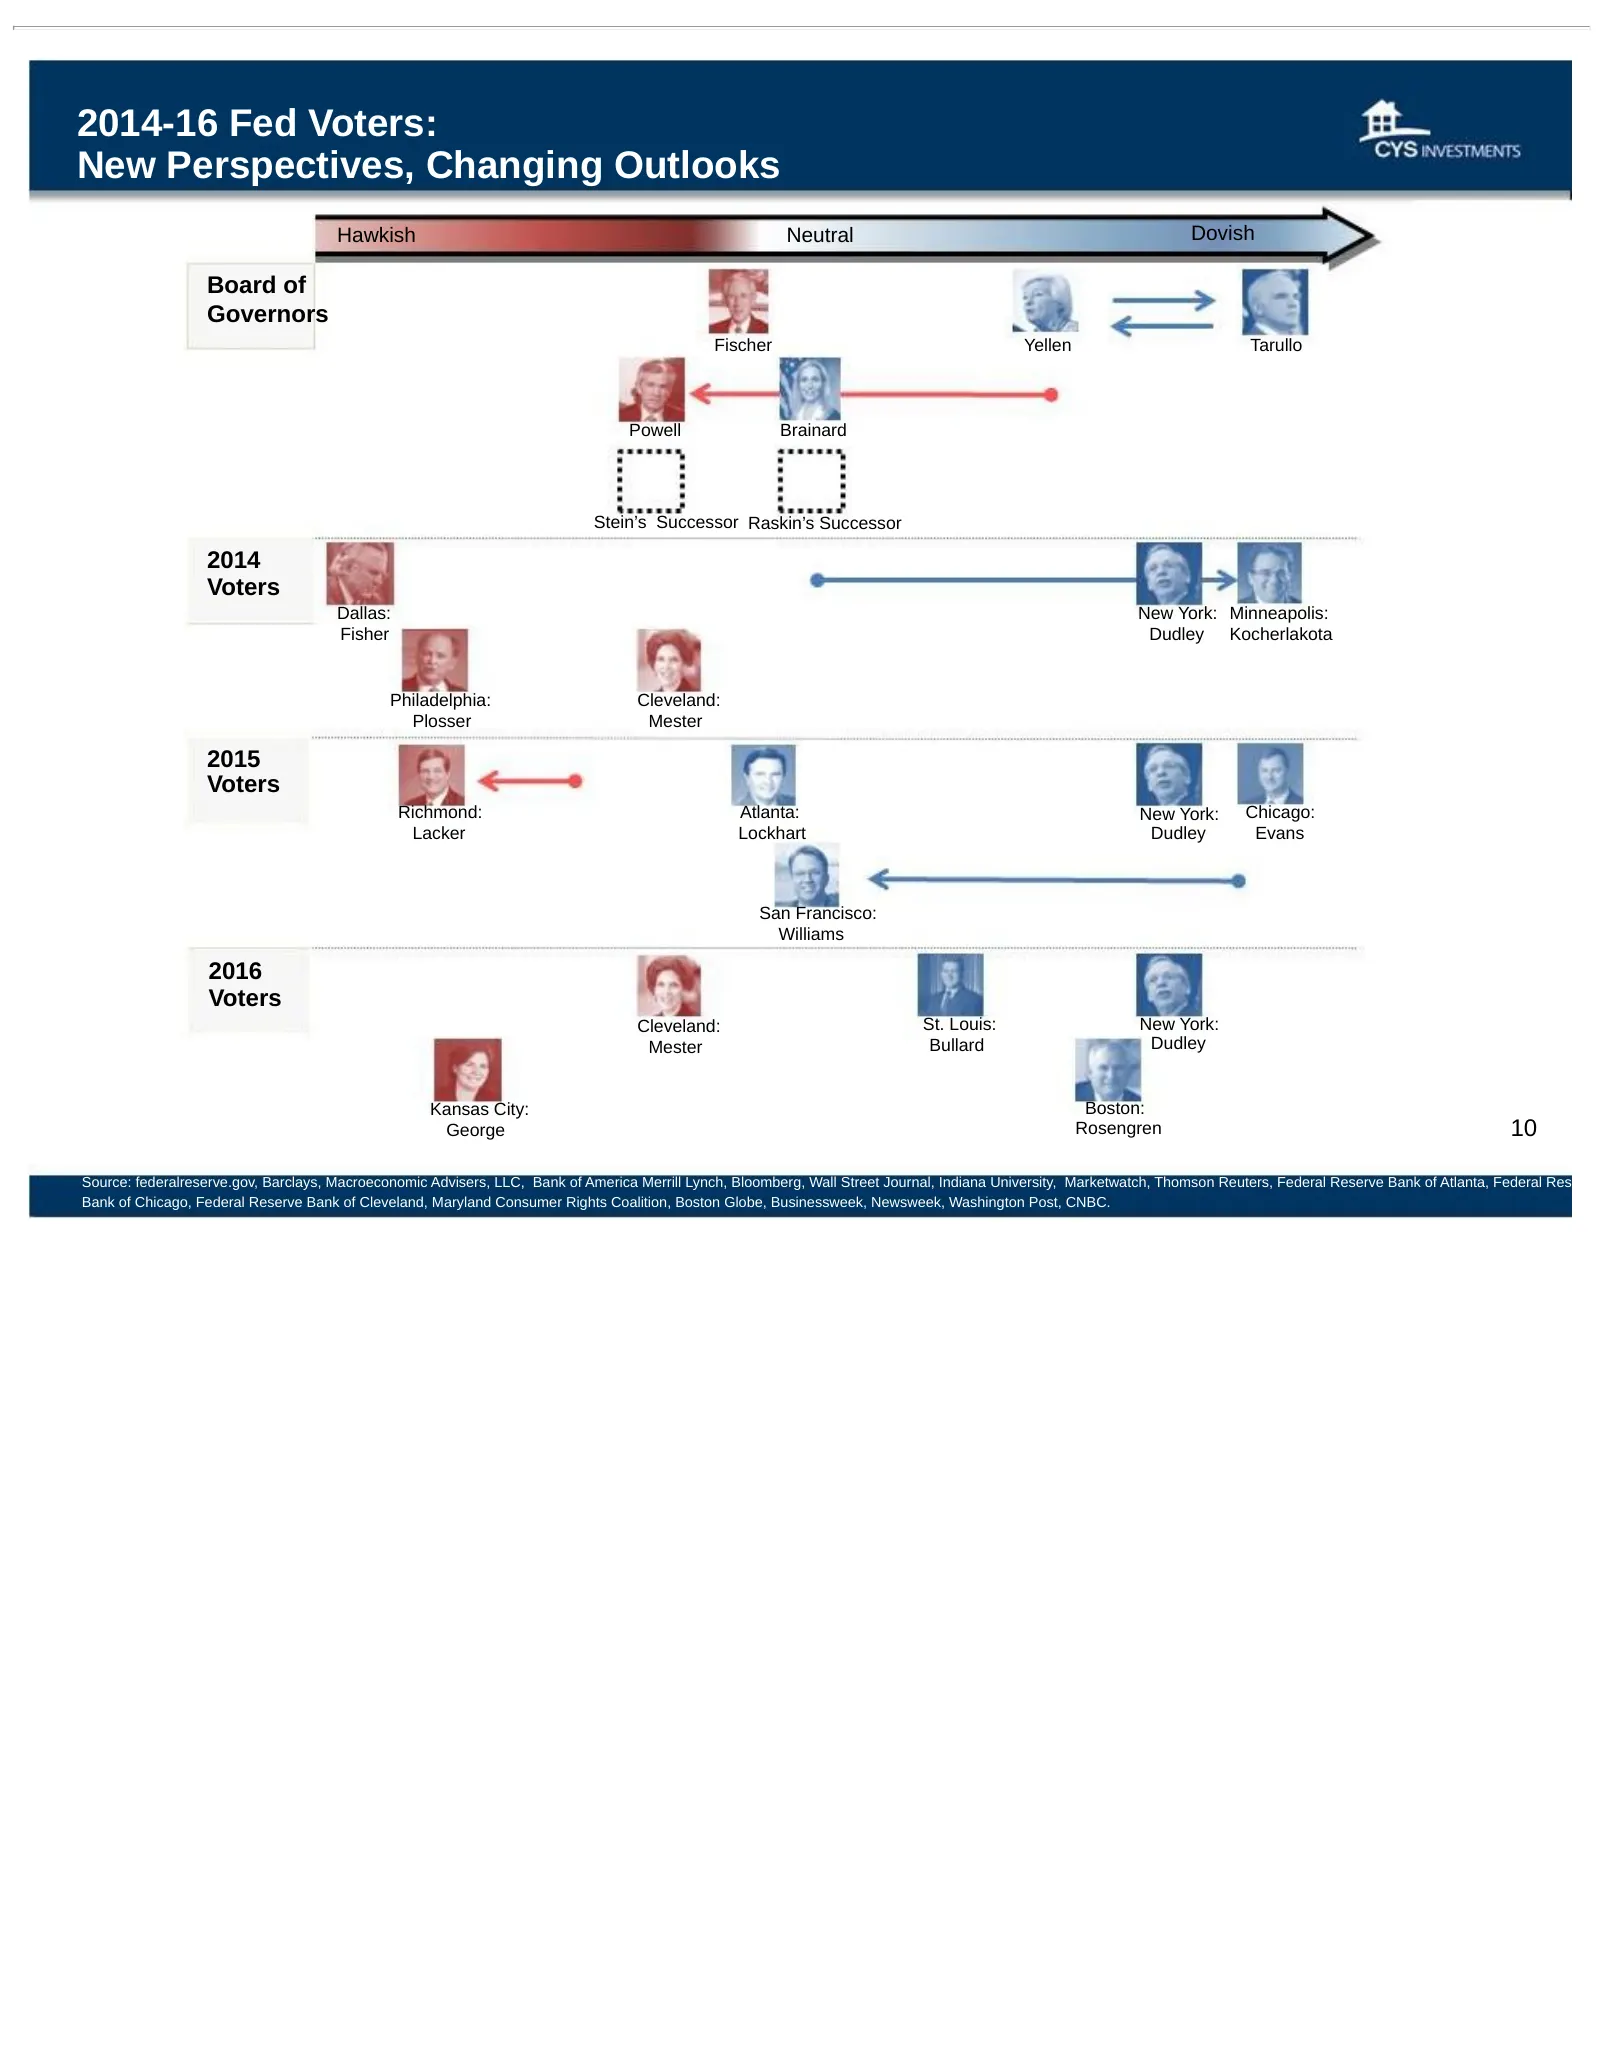
Slide 10: 2014-16 Fed Voters: New Perspectives, Changing Outlooks
2014-16 Fed Voters: New Perspectives, Changing Outlooks Hawkish Neutral Dovish Board of Governors Fischer Yellen Tarullo Powell Brainard Stein’s Successor Raskin’s Successor 2014 Voters Dallas: New York: Minneapolis: Fisher Dudley Kocherlakota Philadelphia: Cleveland: Plosser Mester 2015 Voters Rich
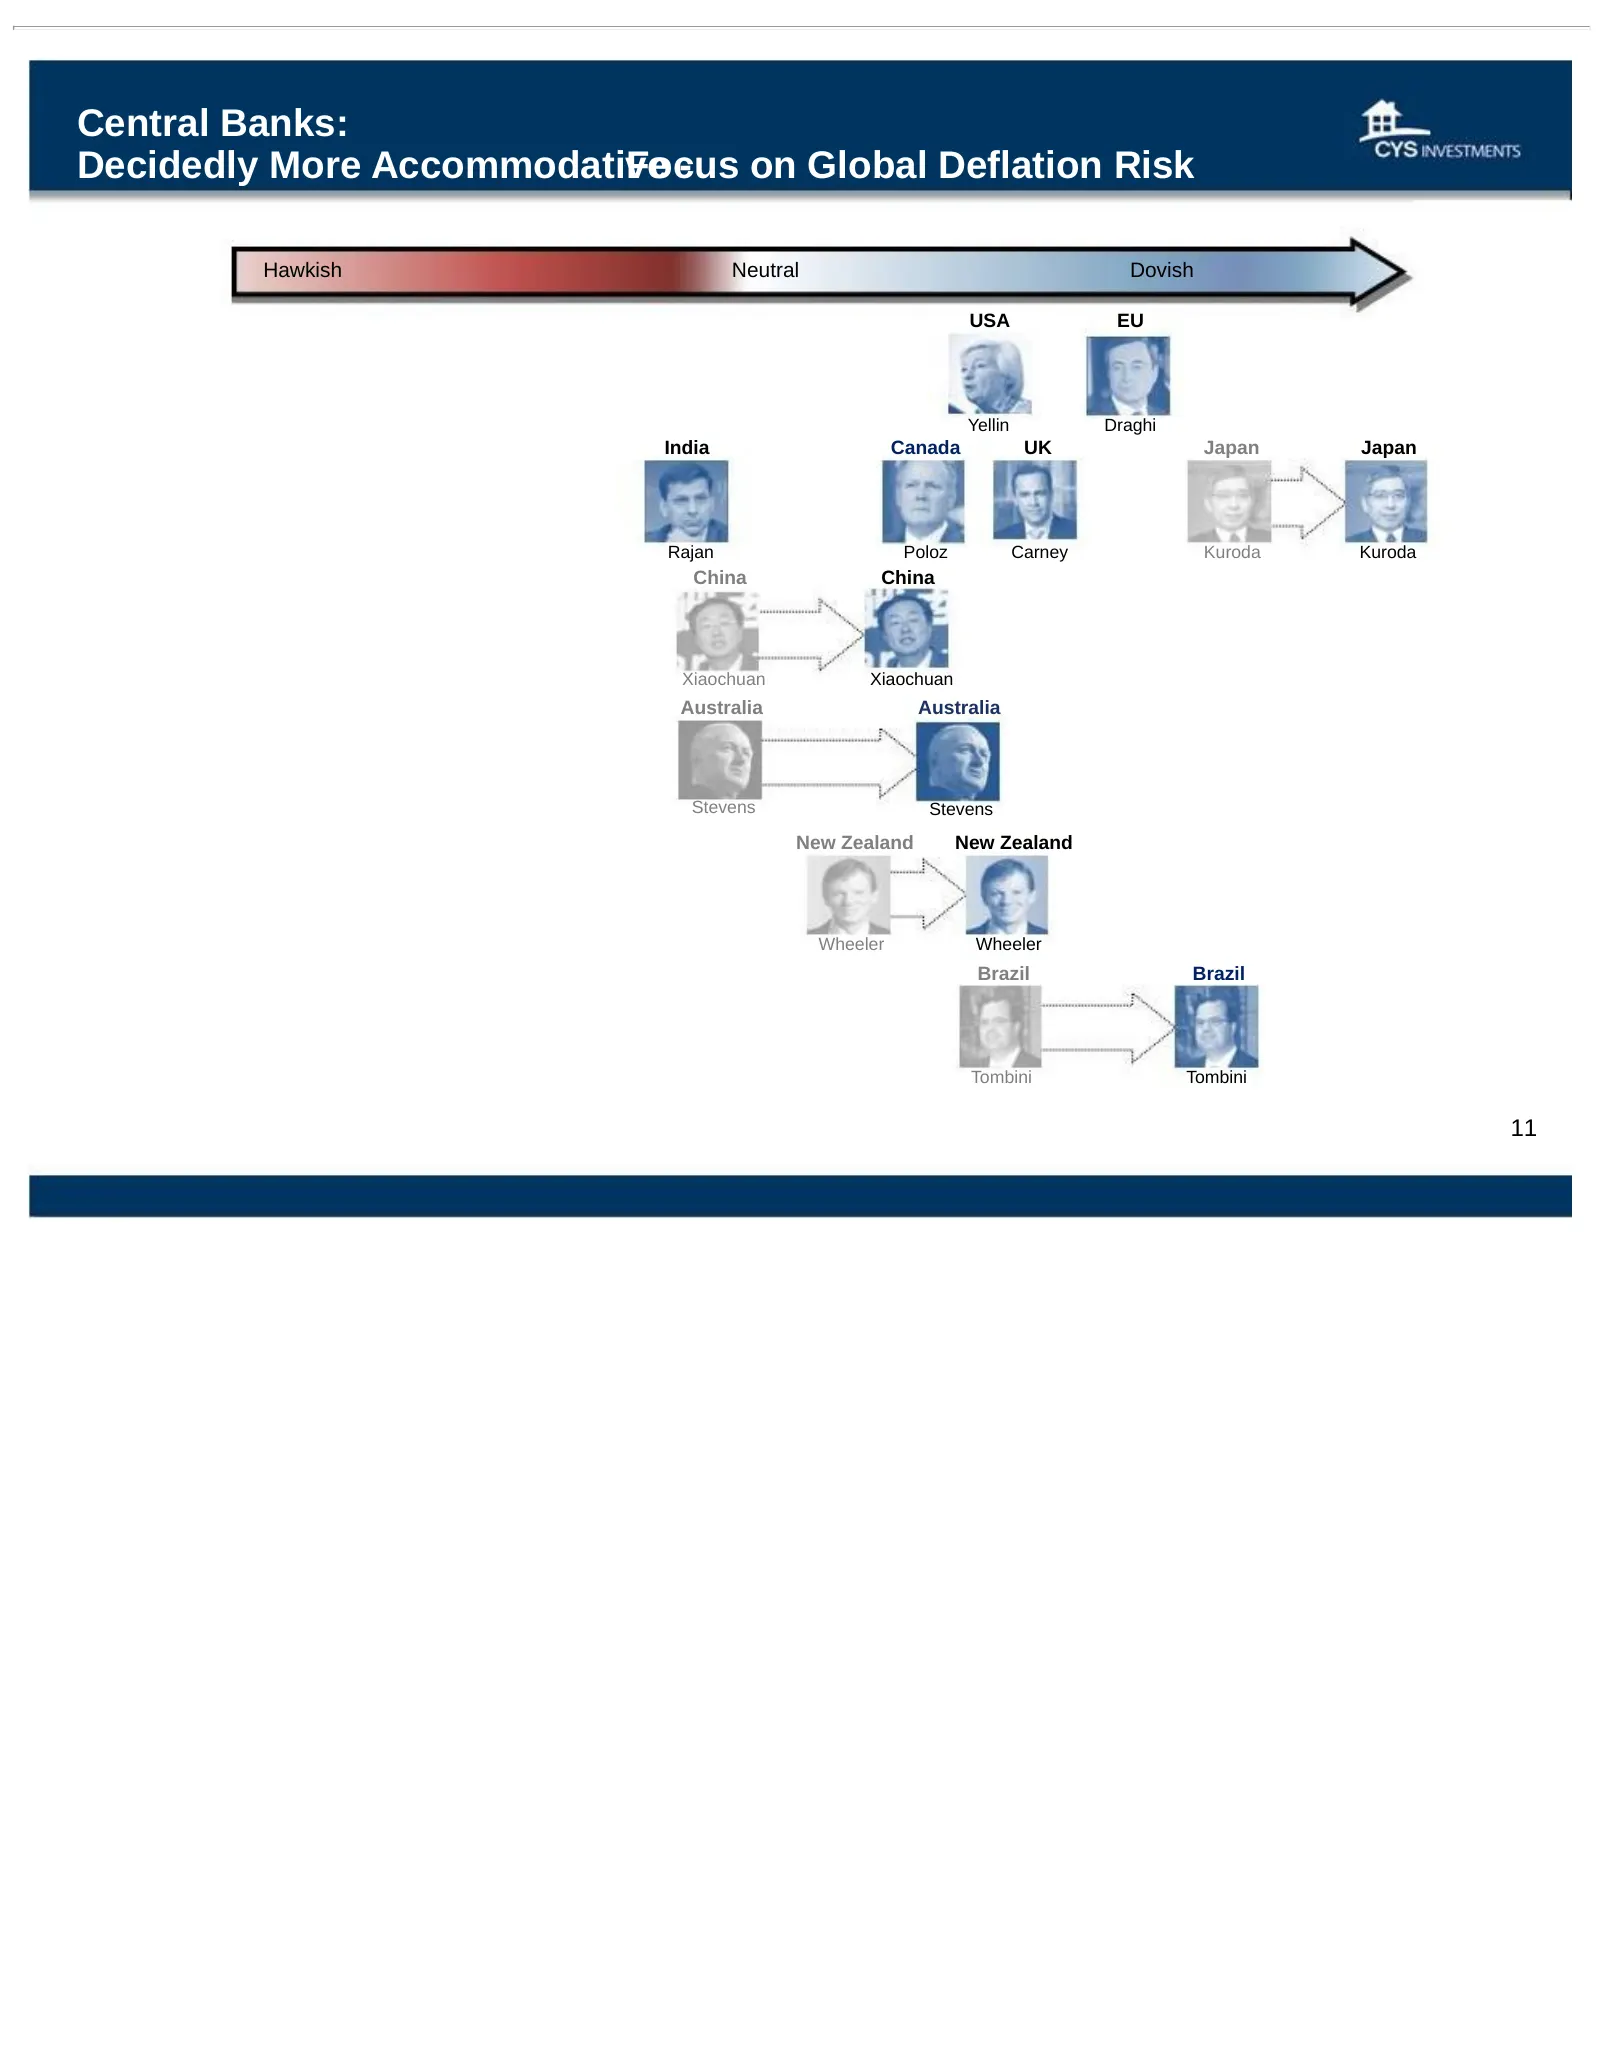
Slide 11: Central Banks: Decidedly More Accommodative Focus on Global Deflation Risk
Central Banks: Decidedly More Accommodative Focus - on Global Deflation Risk Hawkish Neutral Dovish USA EU Yellin Draghi India Canada UK Japan Japan Rajan Poloz Carney Kuroda Kuroda China China Xiaochuan Xiaochuan Australia Australia Stevens Stevens New Zealand New Zealand Wheeler Wheeler Brazil Bra
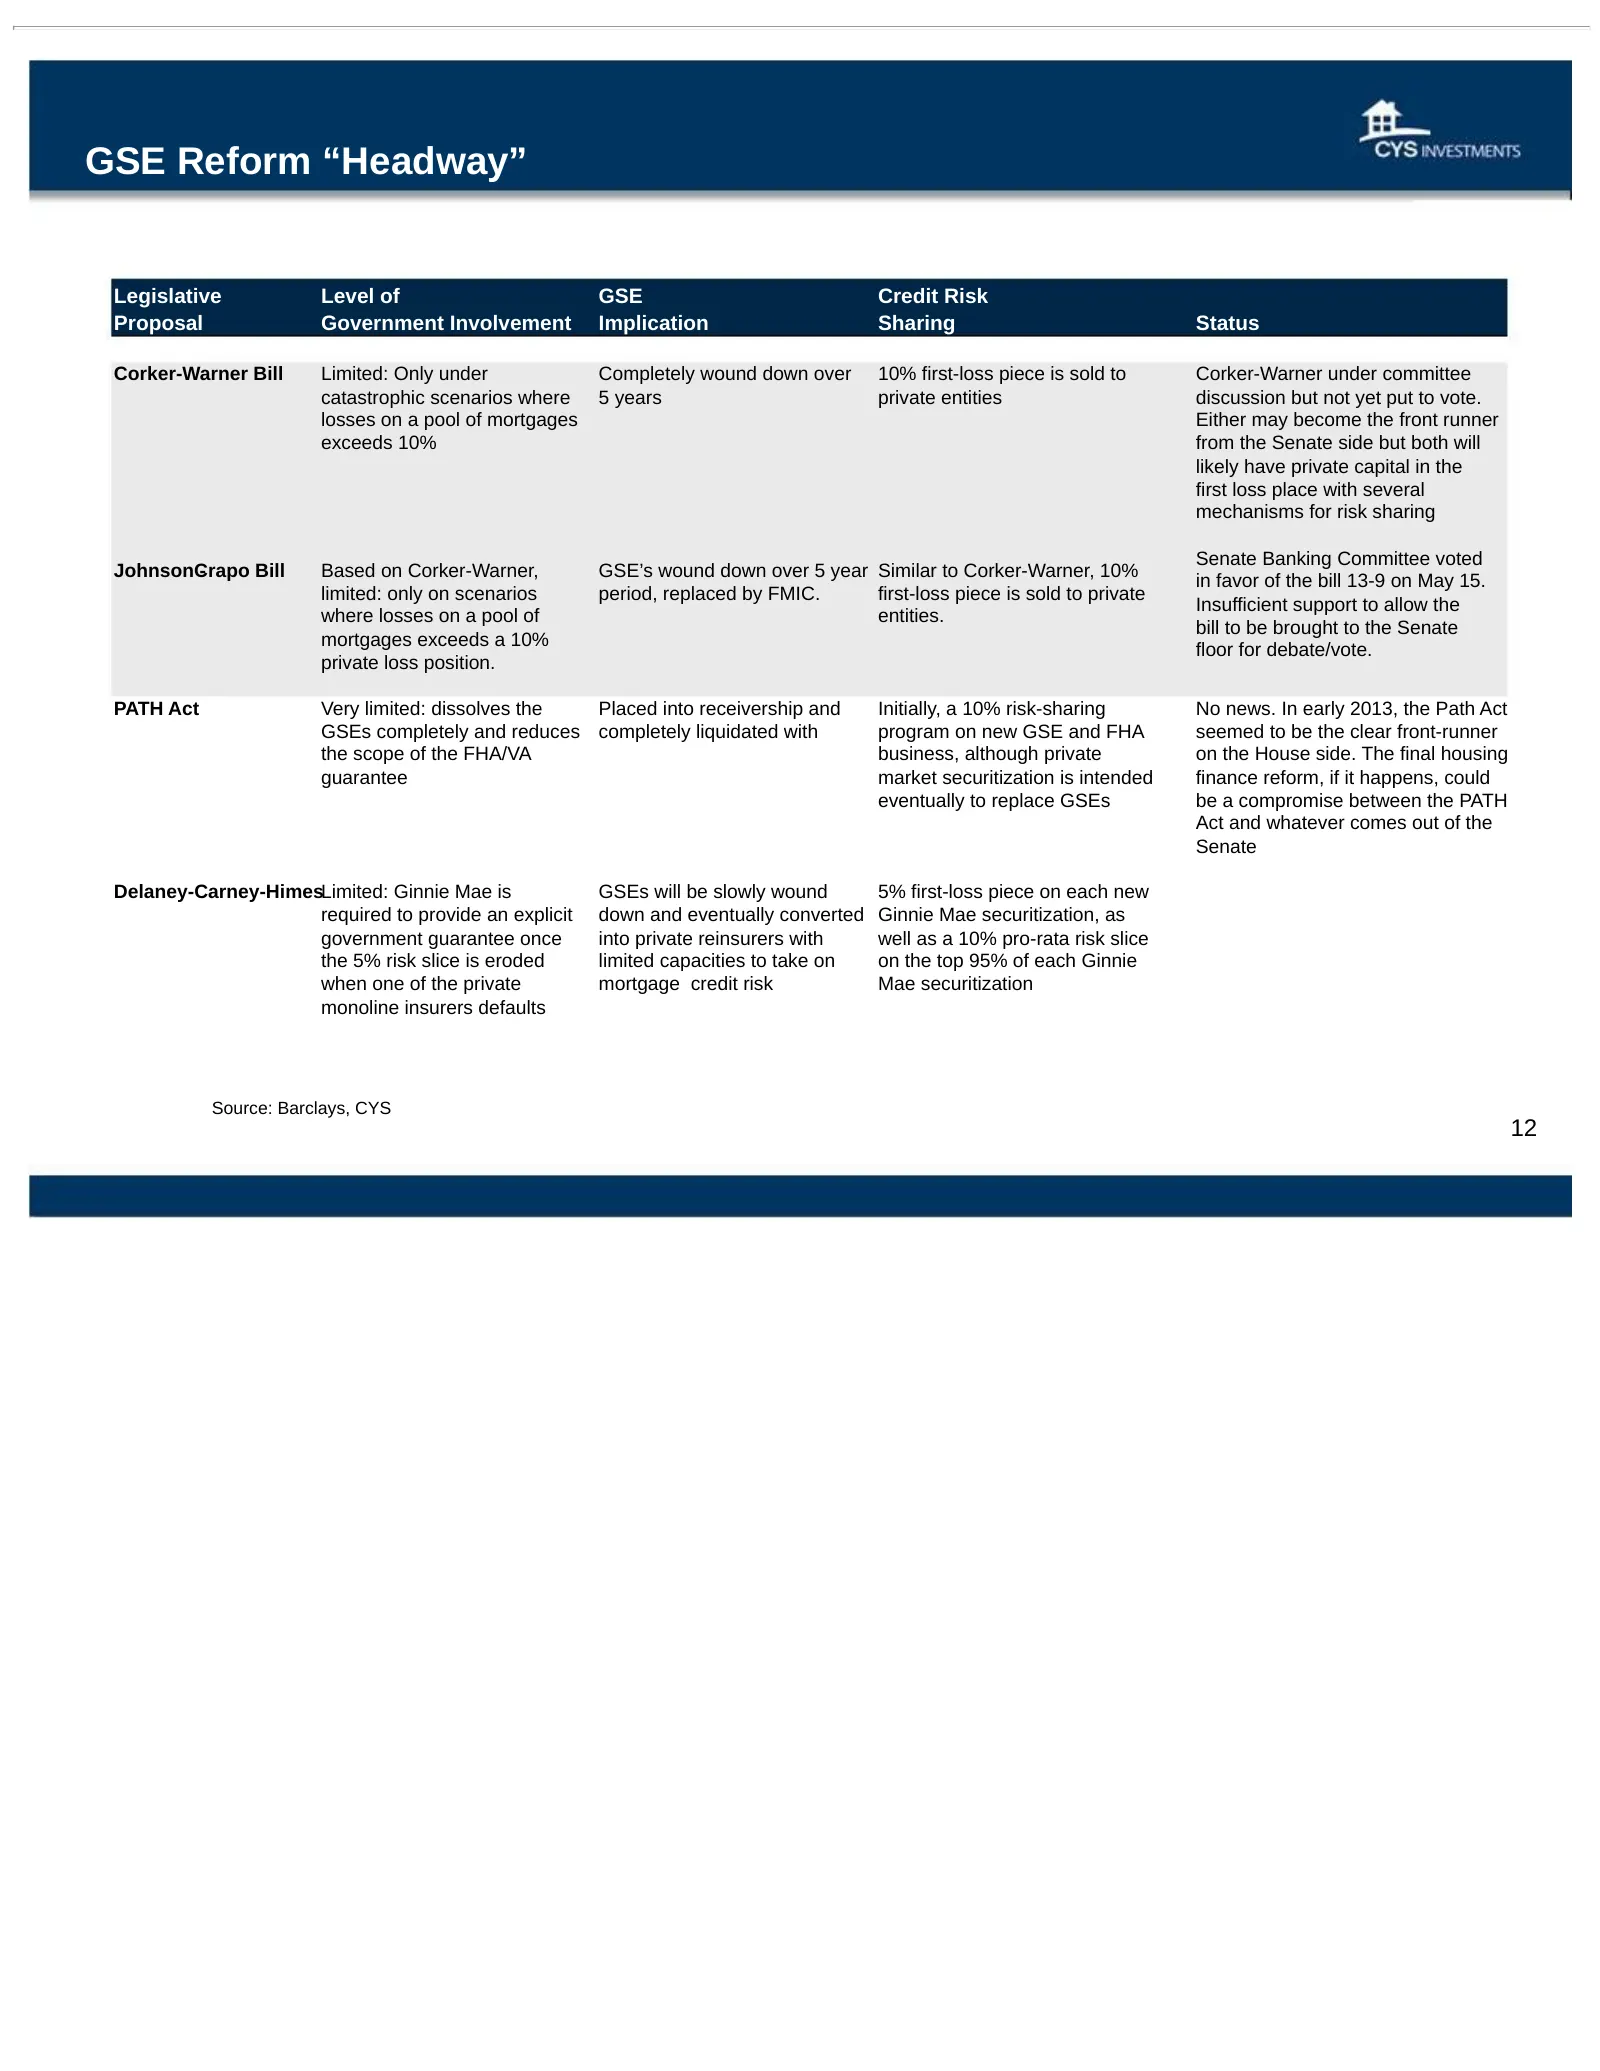
Slide 12: GSE Reform "Headway"
GSE Reform “Headway” Legislative Level of GSE Credit Risk Proposal Government Involvement Implication Sharing Status Corker-Warner Bill Limited: Only under Completely wound down over 10% first-loss piece is sold to Corker-Warner under committee catastrophic scenarios where 5 years private entities d
Slide 13: Economic Recovery Below Normal Pace
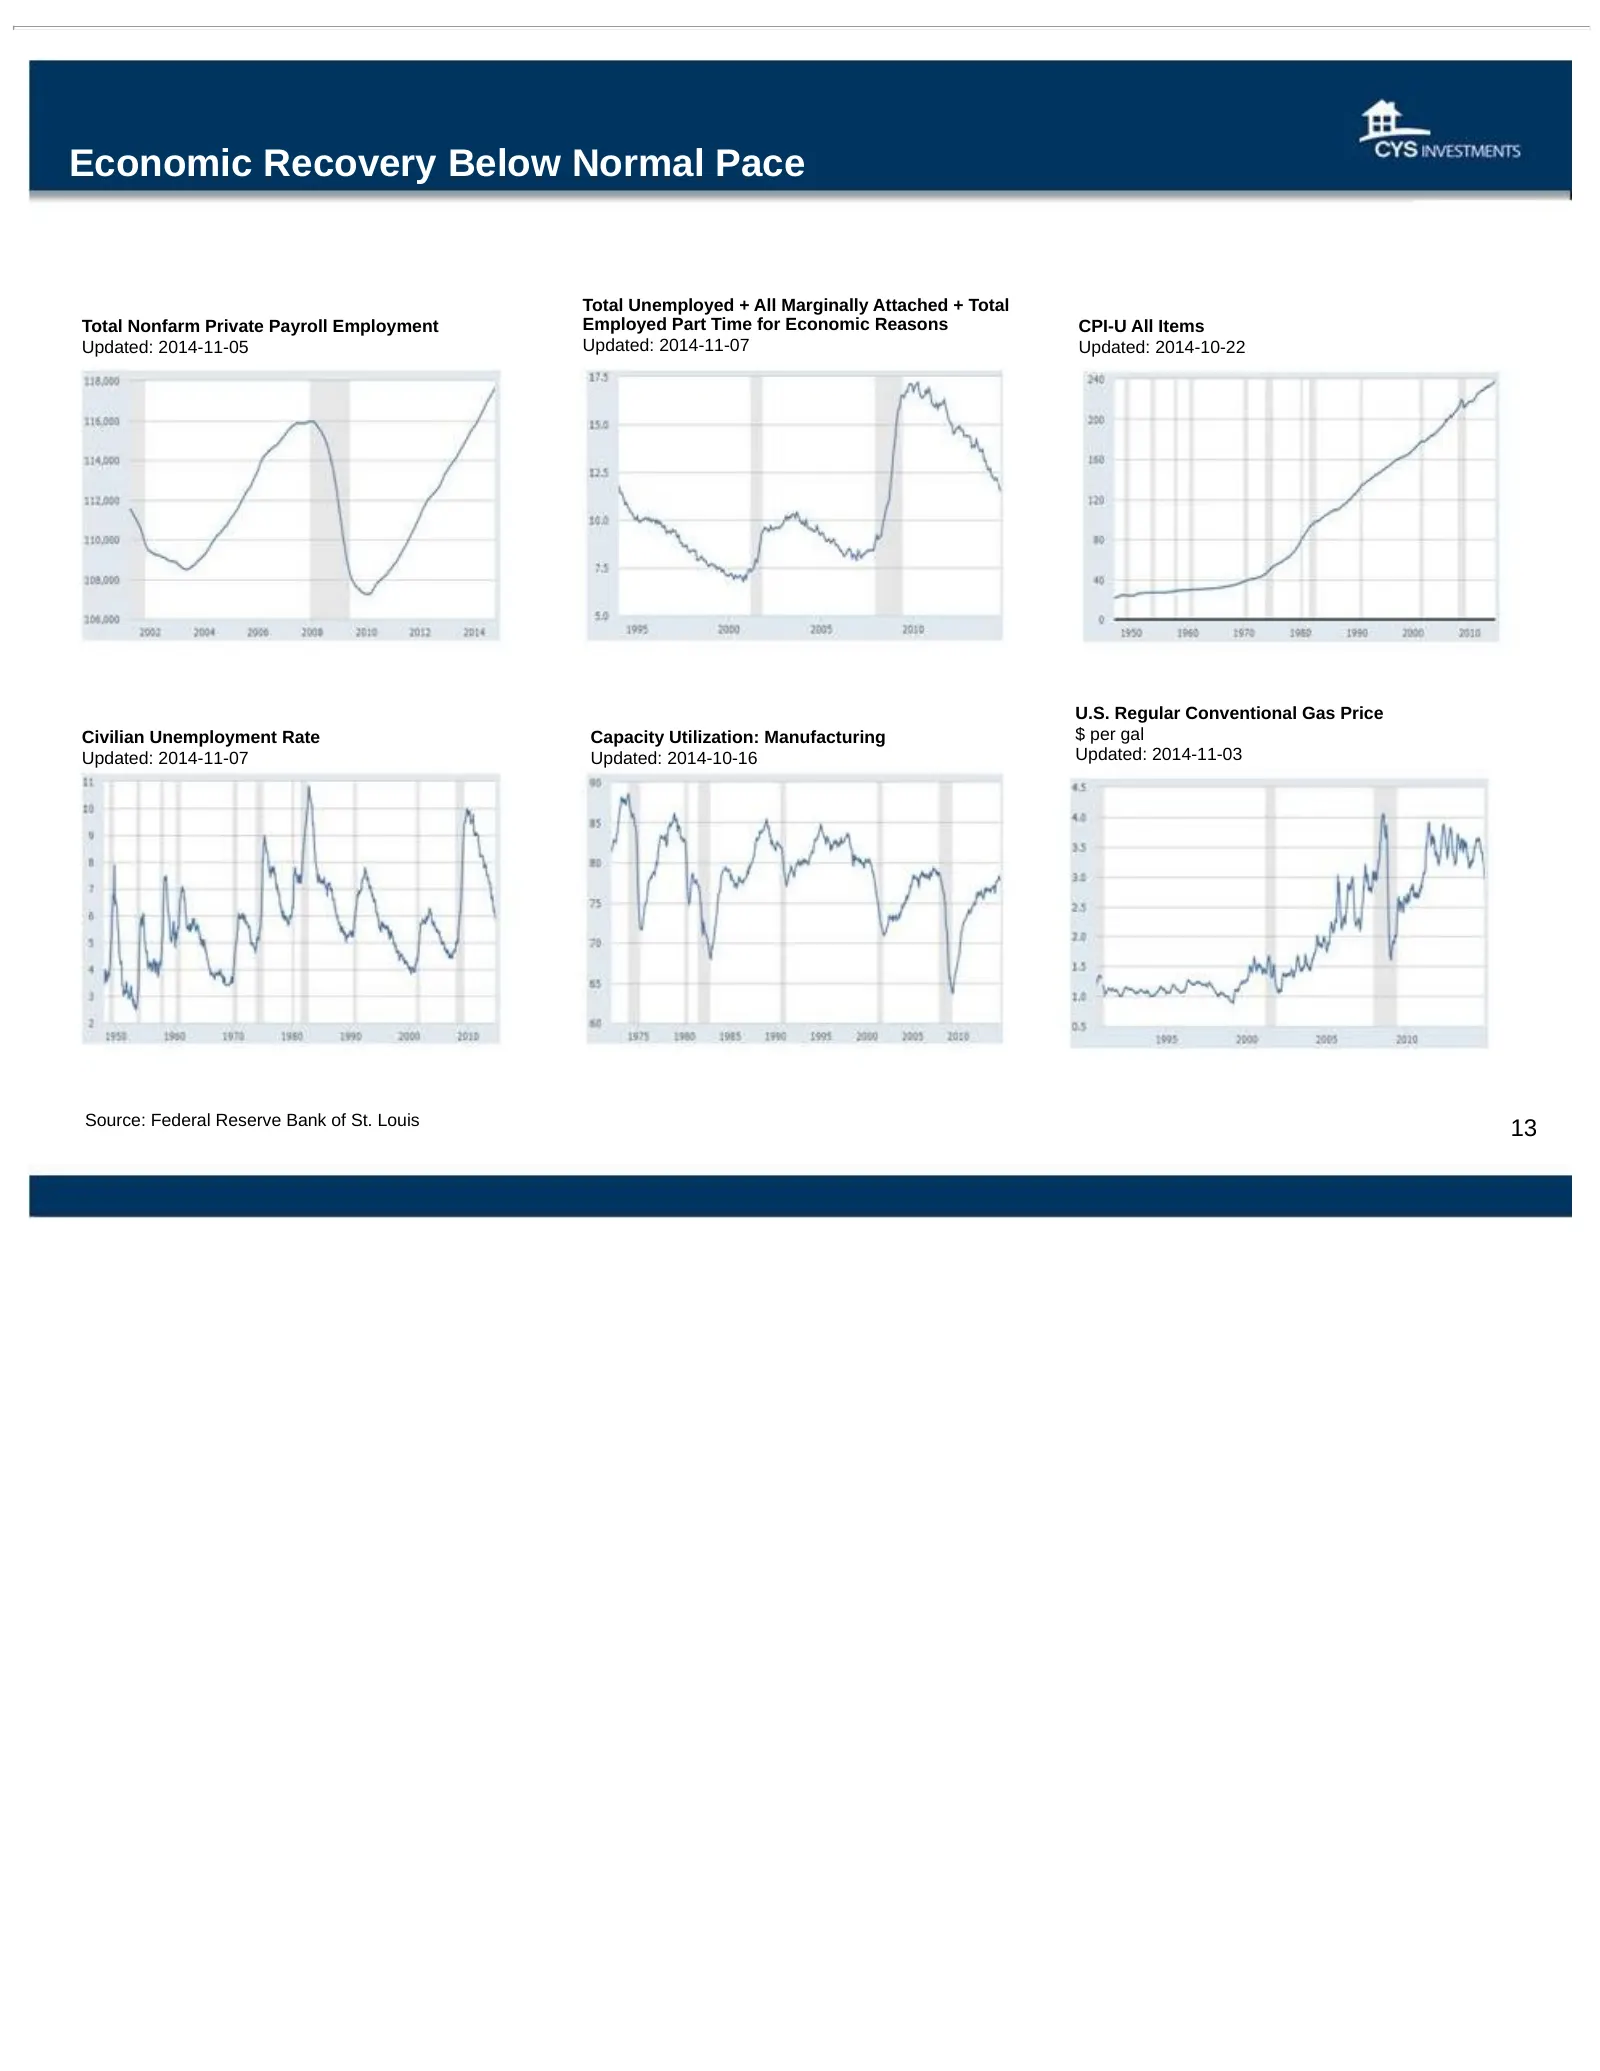
Economic Recovery Below Normal Pace Total Unemployed + All Marginally Attached + Total Total Nonfarm Private Payroll Employment Employed Part Time for Economic Reasons CPI-U All Items Updated: 2014-11-05 Updated: 2014-11-07 Updated: 2014-10-22 U.S. Regular Conventional Gas Price Civilian Unemploymen
Slide 14: Housing Finance Has Not Rebounded
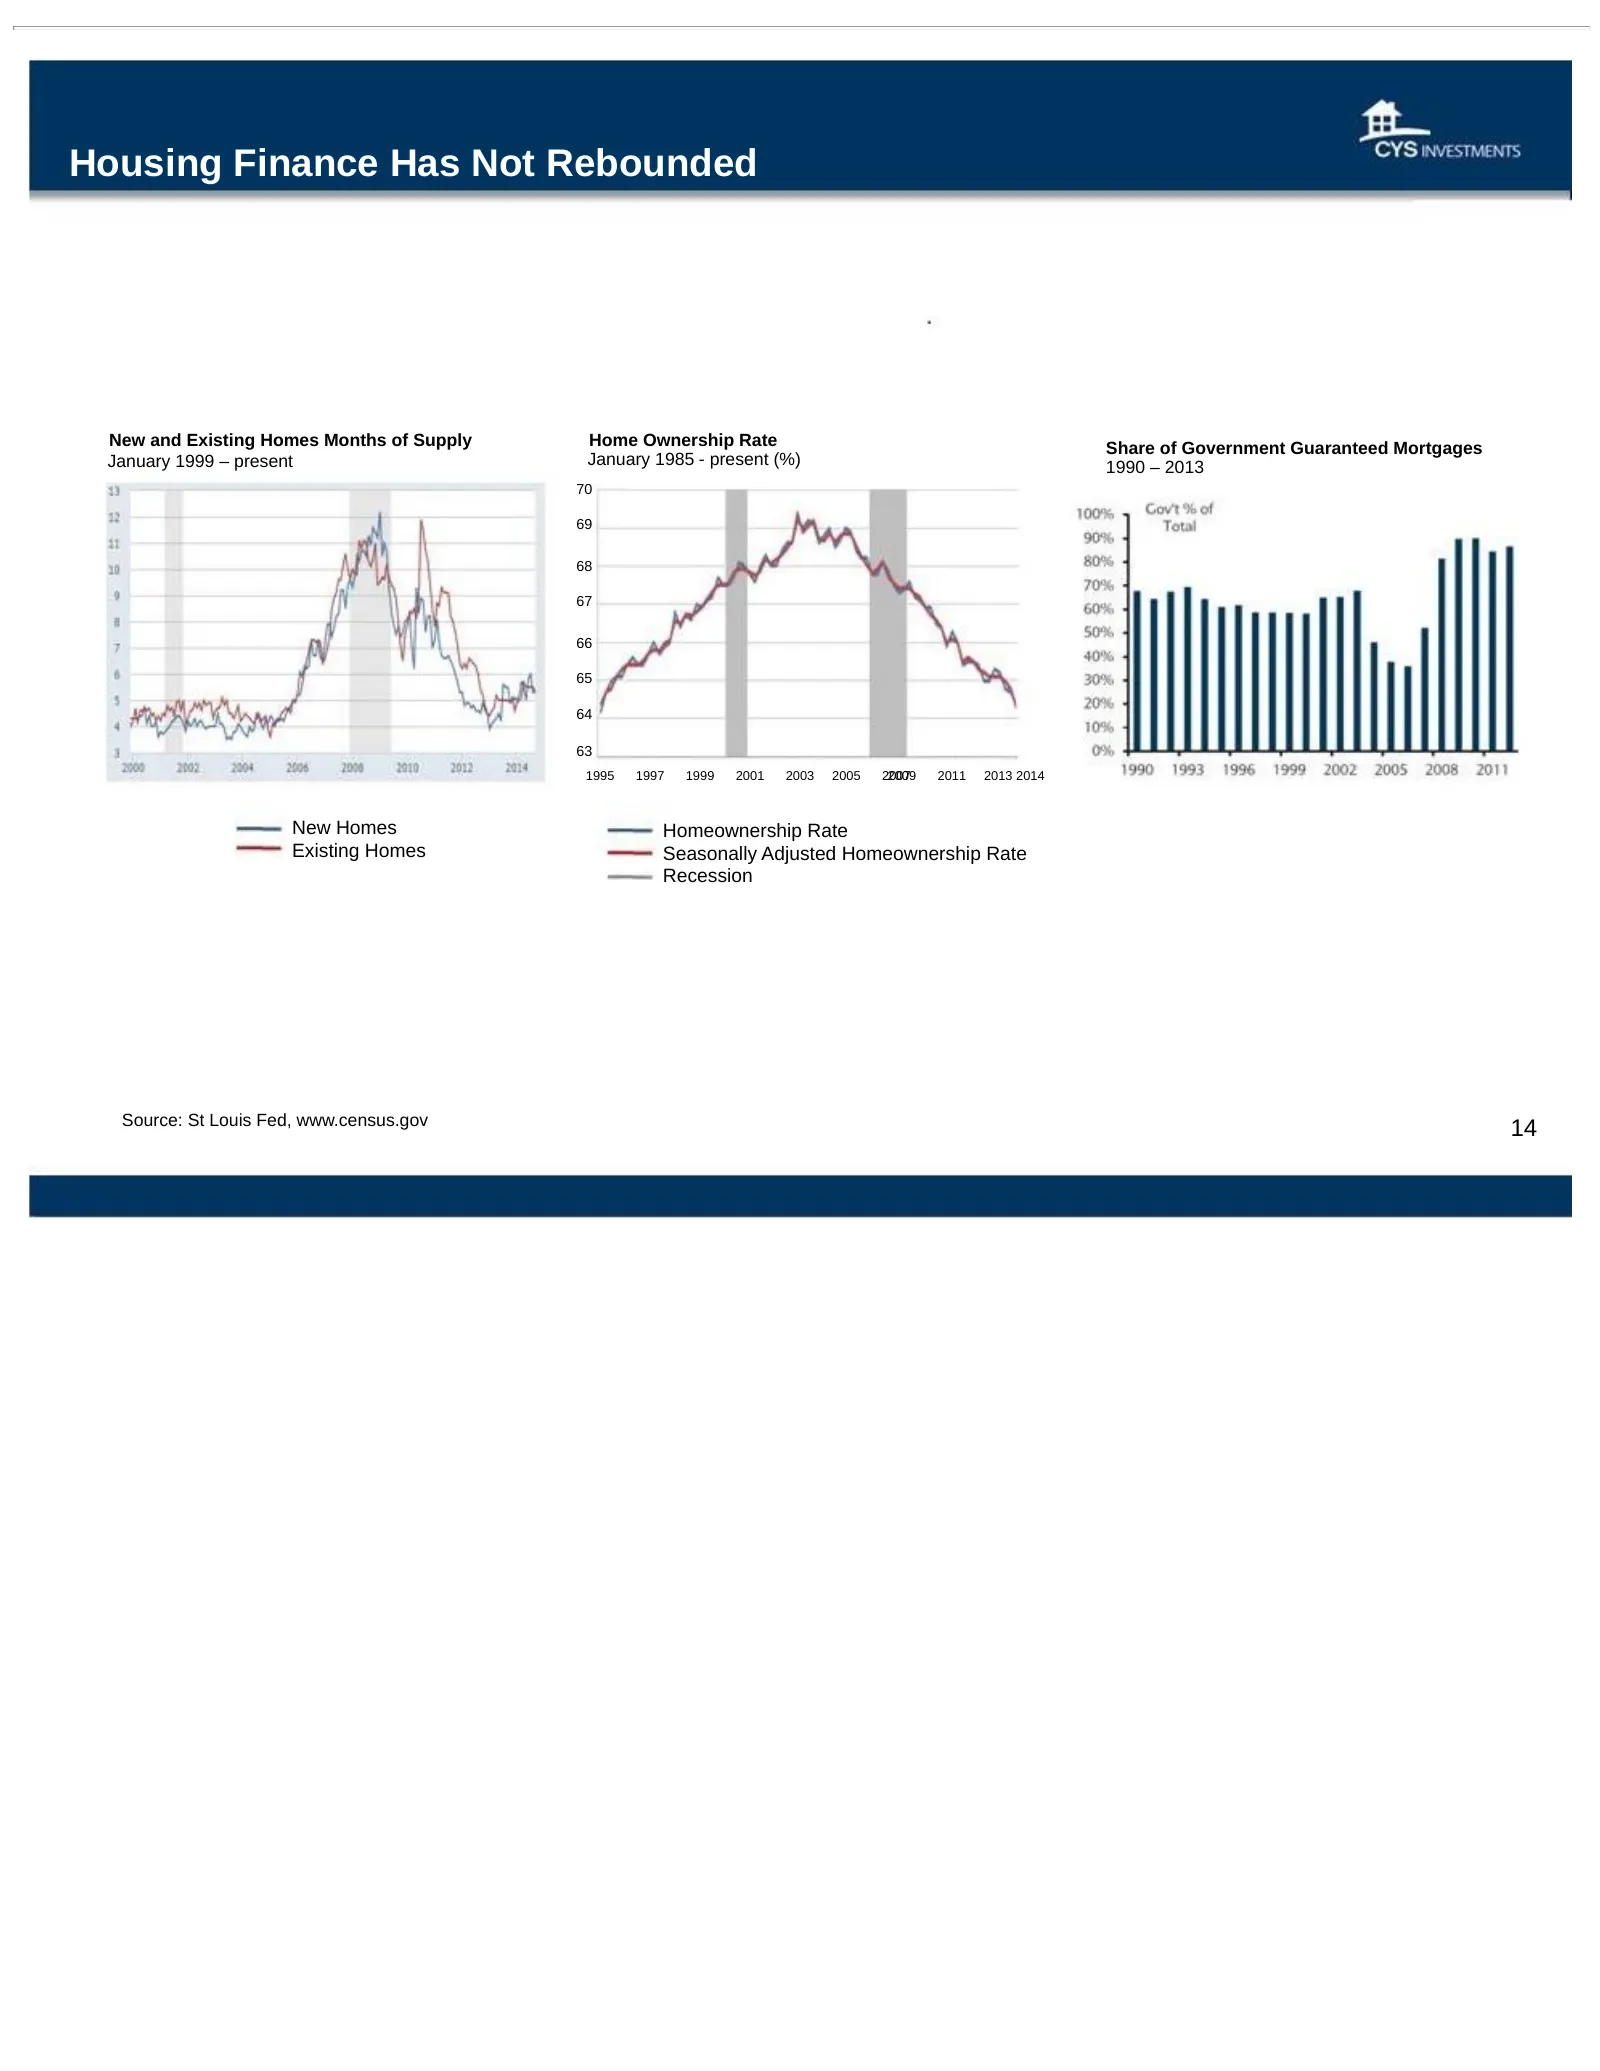
Housing Finance Has Not Rebounded New and Existing Homes Months of Supply Home Ownership Rate Share of Government Guaranteed Mortgages January 1999 – present January 1985 - present (%) 1990 – 2013 70 69 68 67 66 65 64 63 1995 1997 1999 2001 2003 2005 2007 2009 2011 2013 2014 New Homes Homeownership
Slide 15: Mortgage Market Shrinkage Likely to Continue
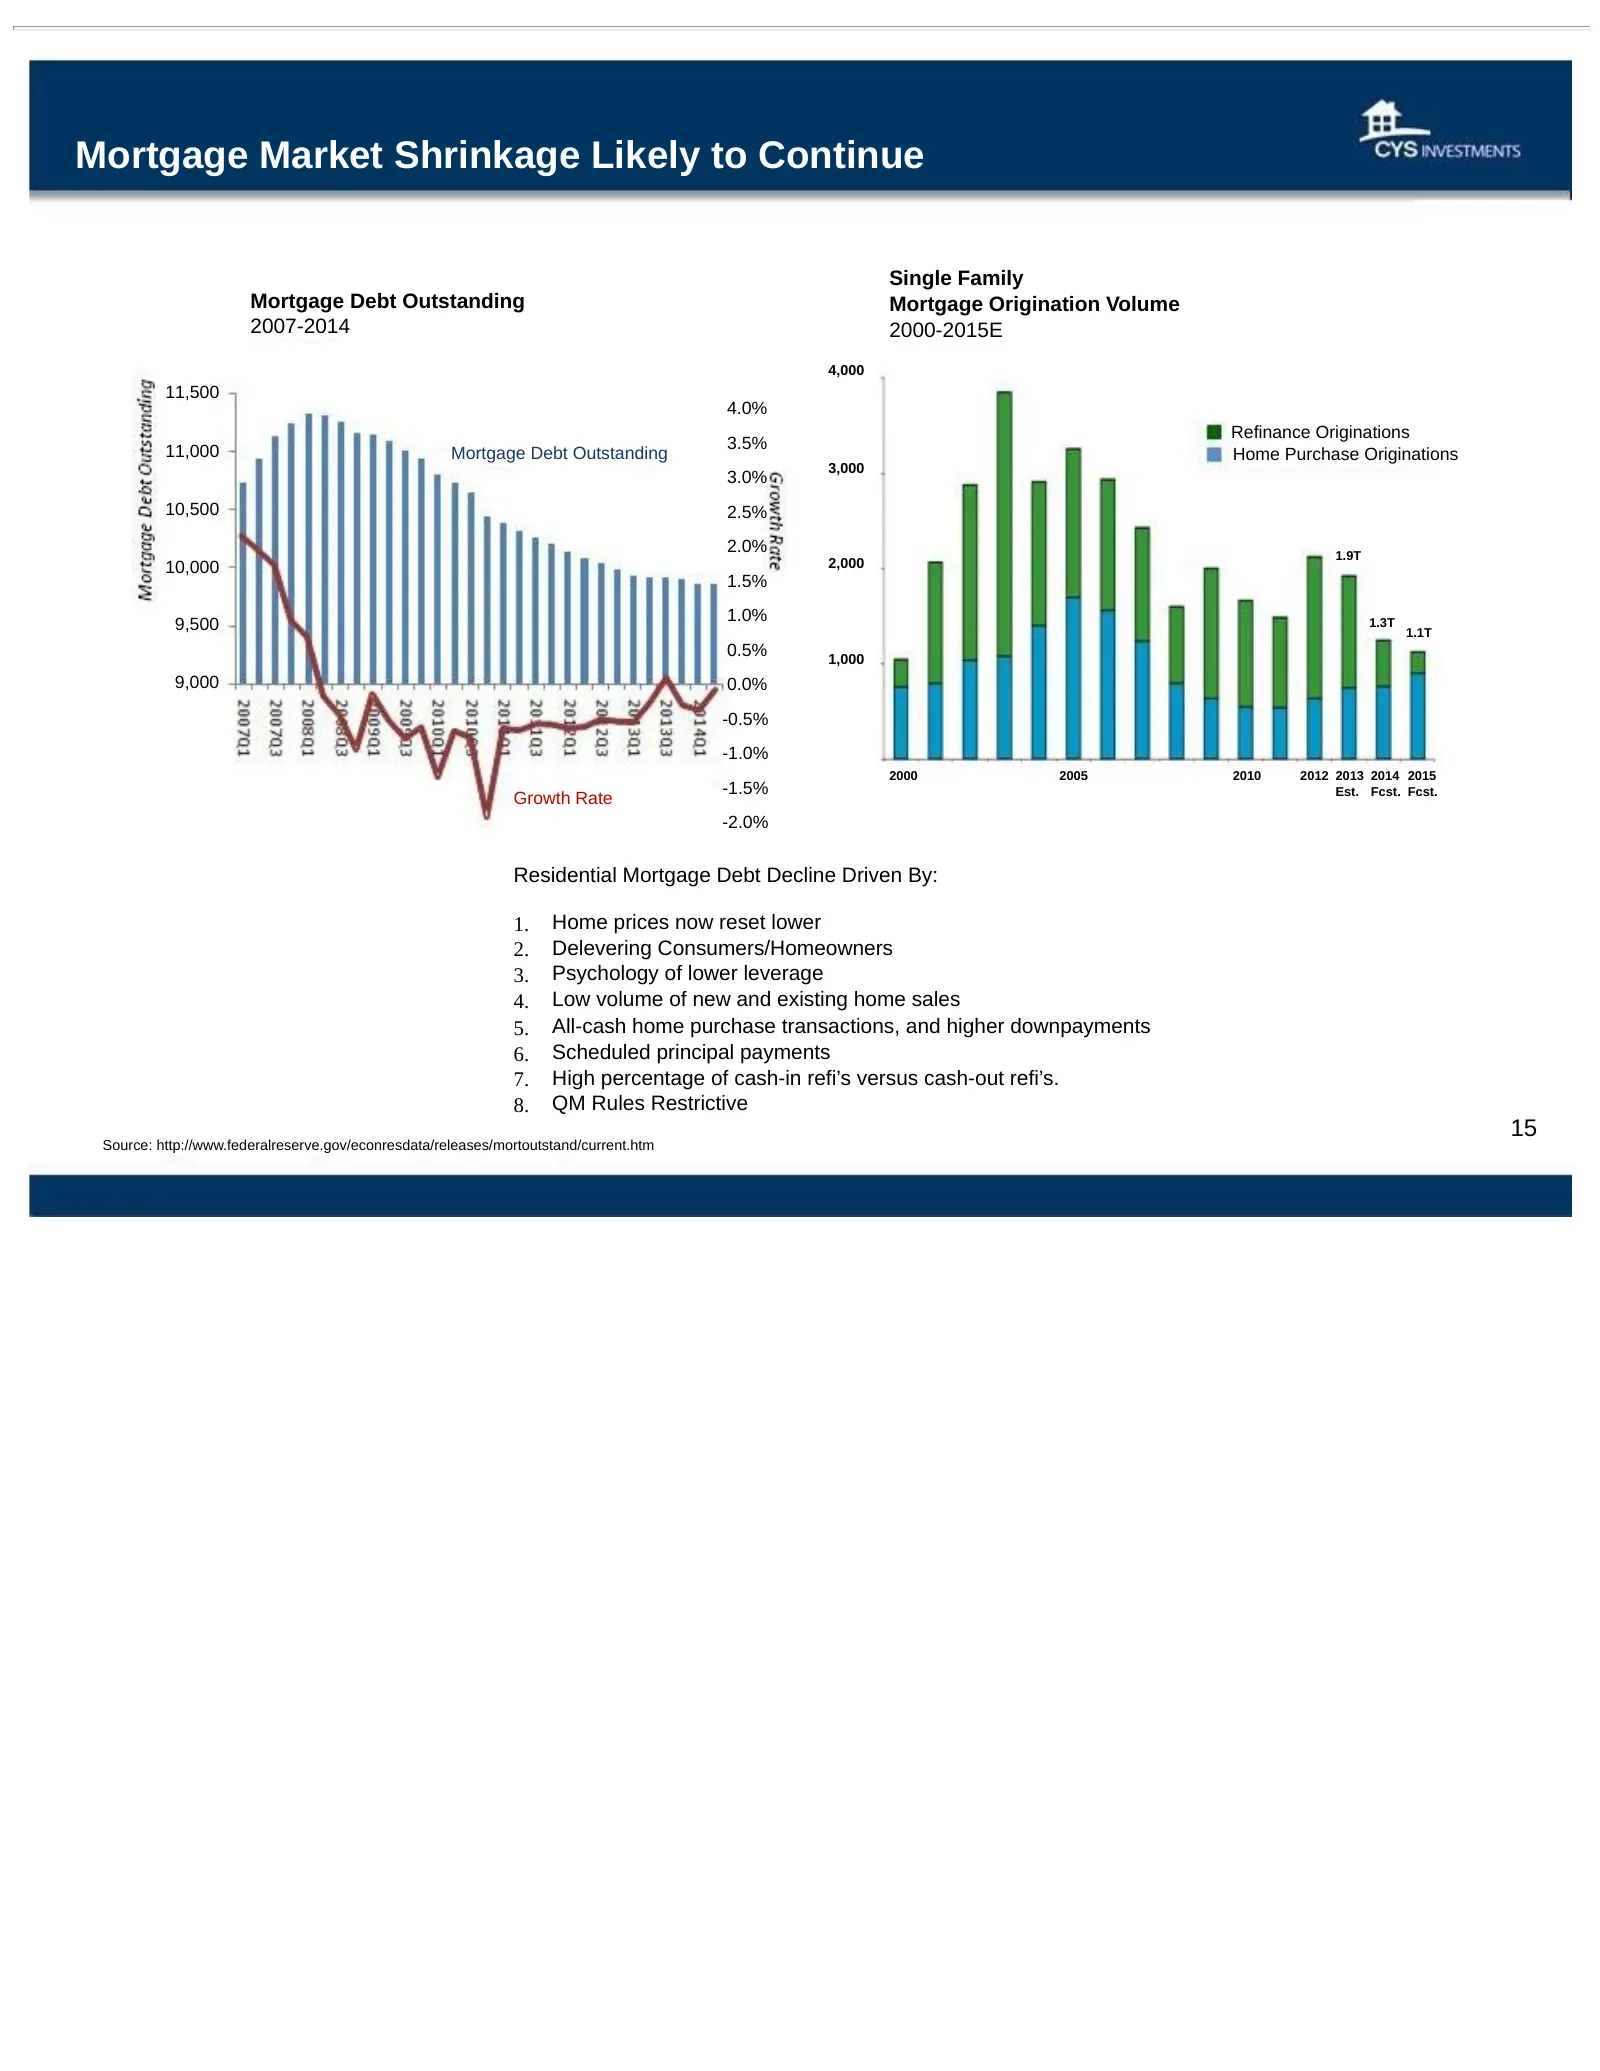
Mortgage Market Shrinkage Likely to Continue Single Family Mortgage Debt Outstanding Mortgage Origination Volume 2007-2014 2000-2015E 4,000 11,500 4.0% Refinance Originations 11,000 3.5% Mortgage Debt Outstanding Home Purchase Originations 3,000 3.0% 10,500 2.5% 2.0% 1.9T 10,000 2,000 1.5% 1.0% 9,50
Slide 16: Economics of Forward Purchase
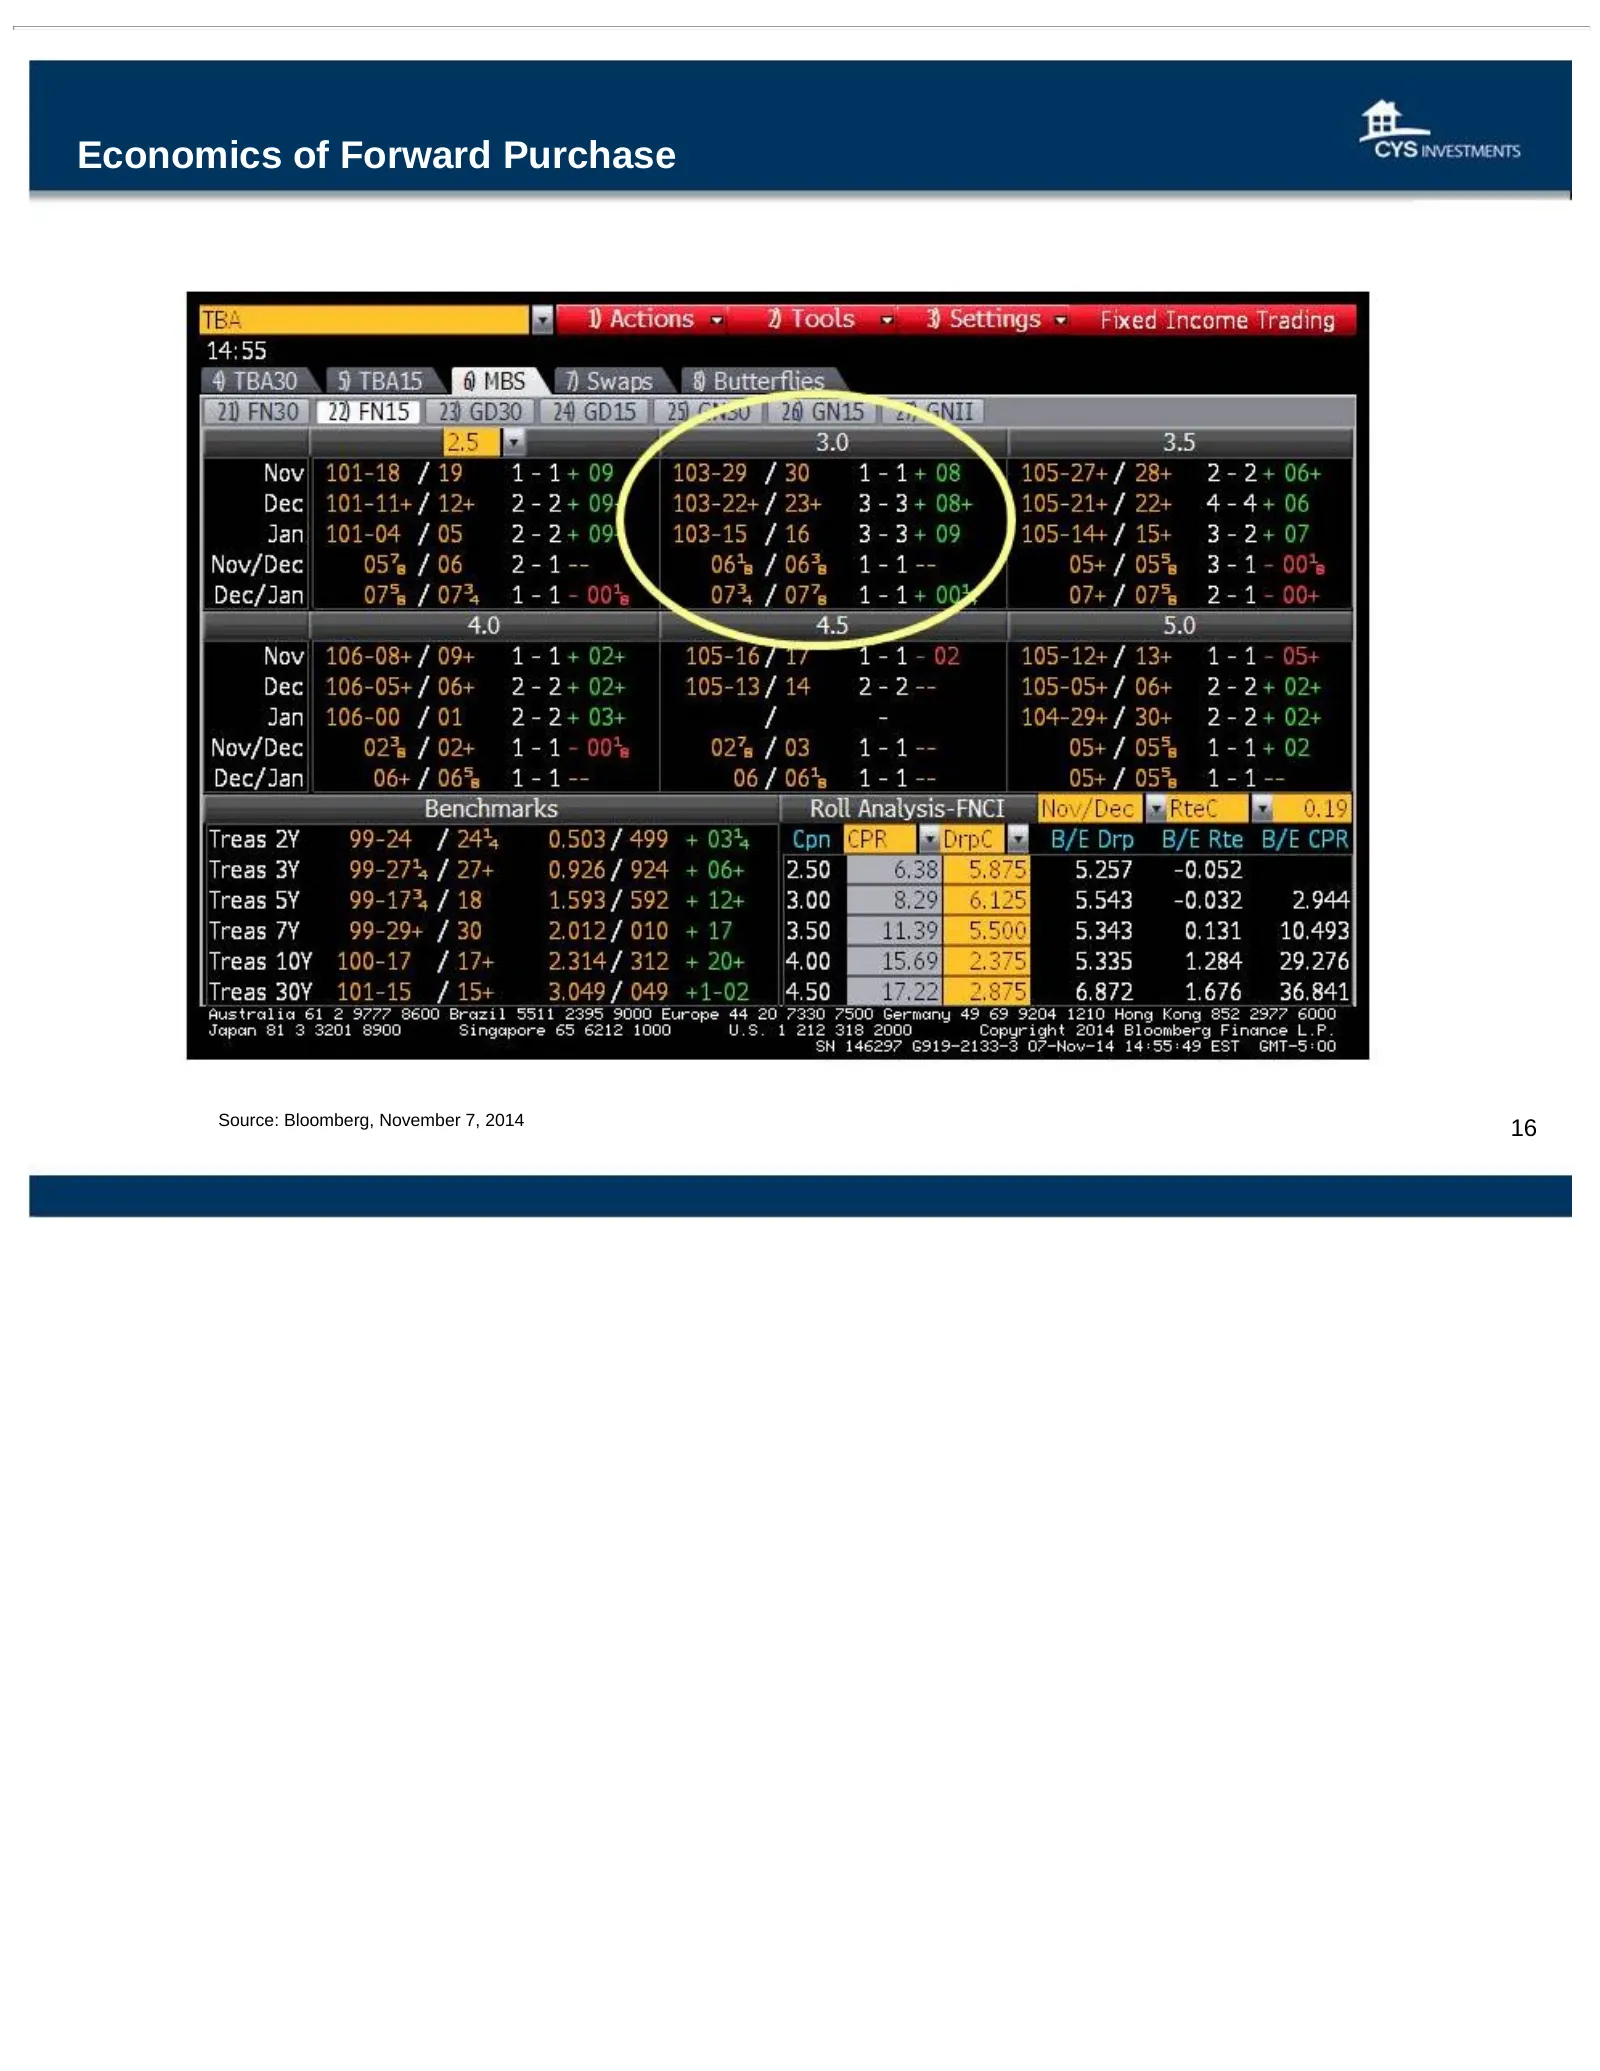
Economics of Forward Purchase Source: Bloomberg, November 7, 2014 16
Slide 17: Portfolio Composition and Dividends
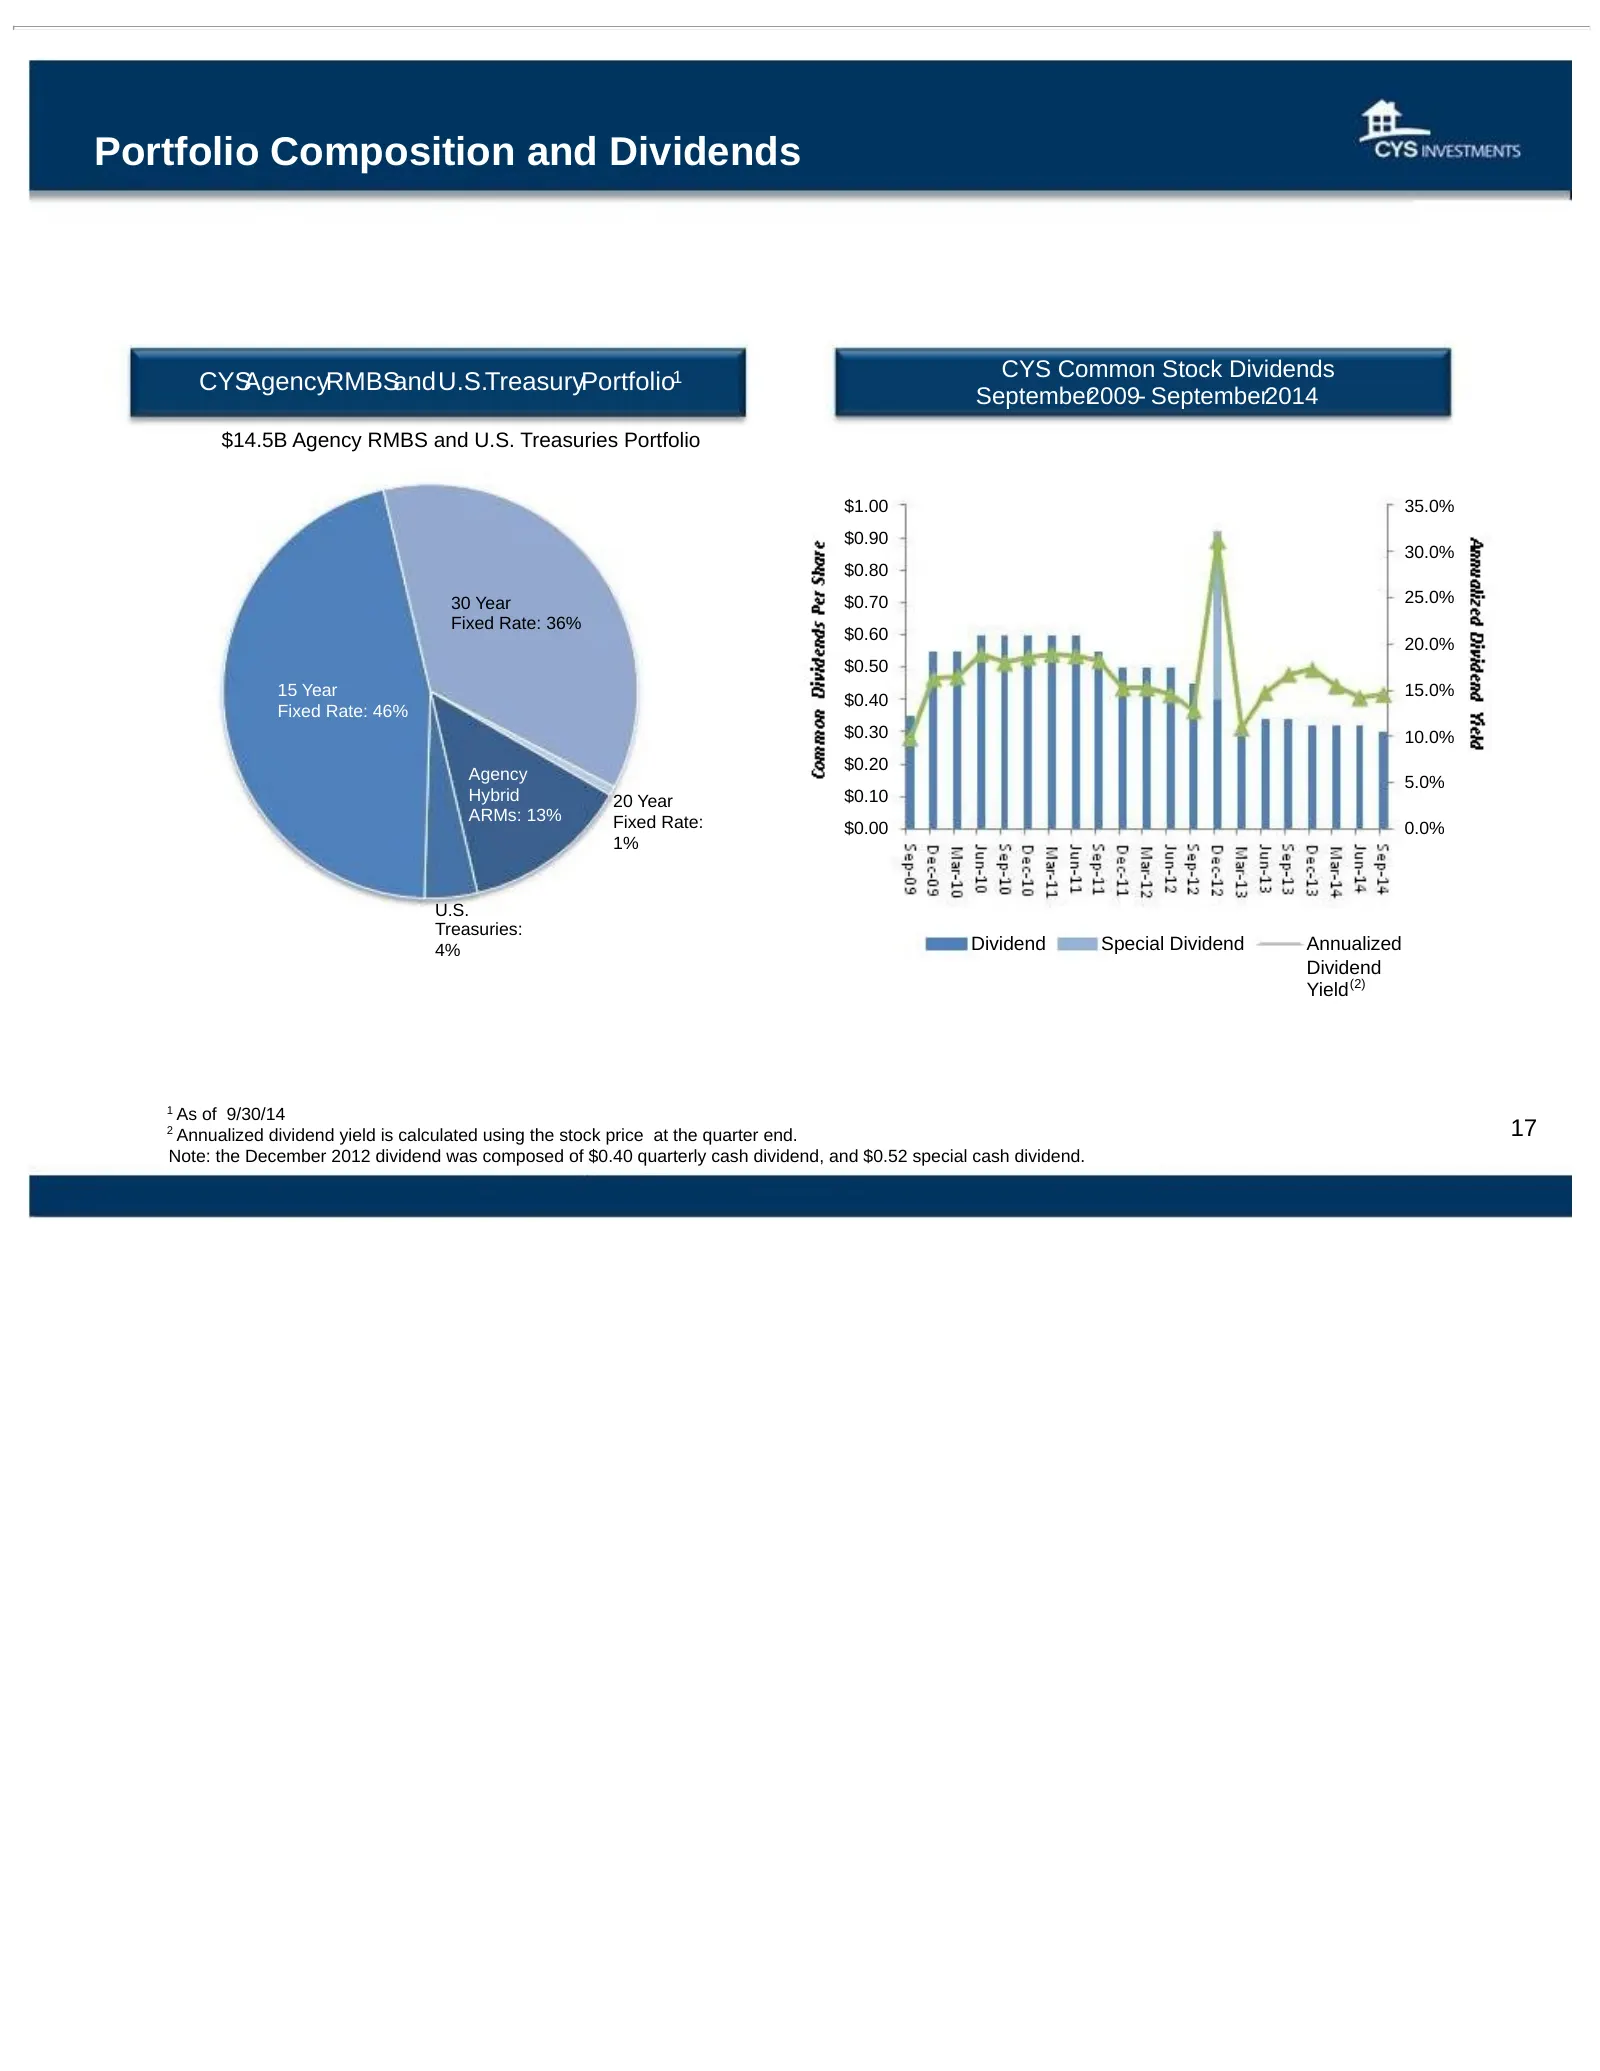
Portfolio Composition and Dividends CYS Common Stock Dividends CYSAgencyRMBSandU.S.TreasuryPortfolio1 September2009- September2014 $14.5B Agency RMBS and U.S. Treasuries Portfolio $1.00 35.0% $0.90 30.0% $0.80 30 Year $0.70 25.0% Fixed Rate: 36% $0.60 20.0% $0.50 15 Year 15.0% $0.40 Fixed Rate: 46%
Slide 18: Portfolio Characteristics
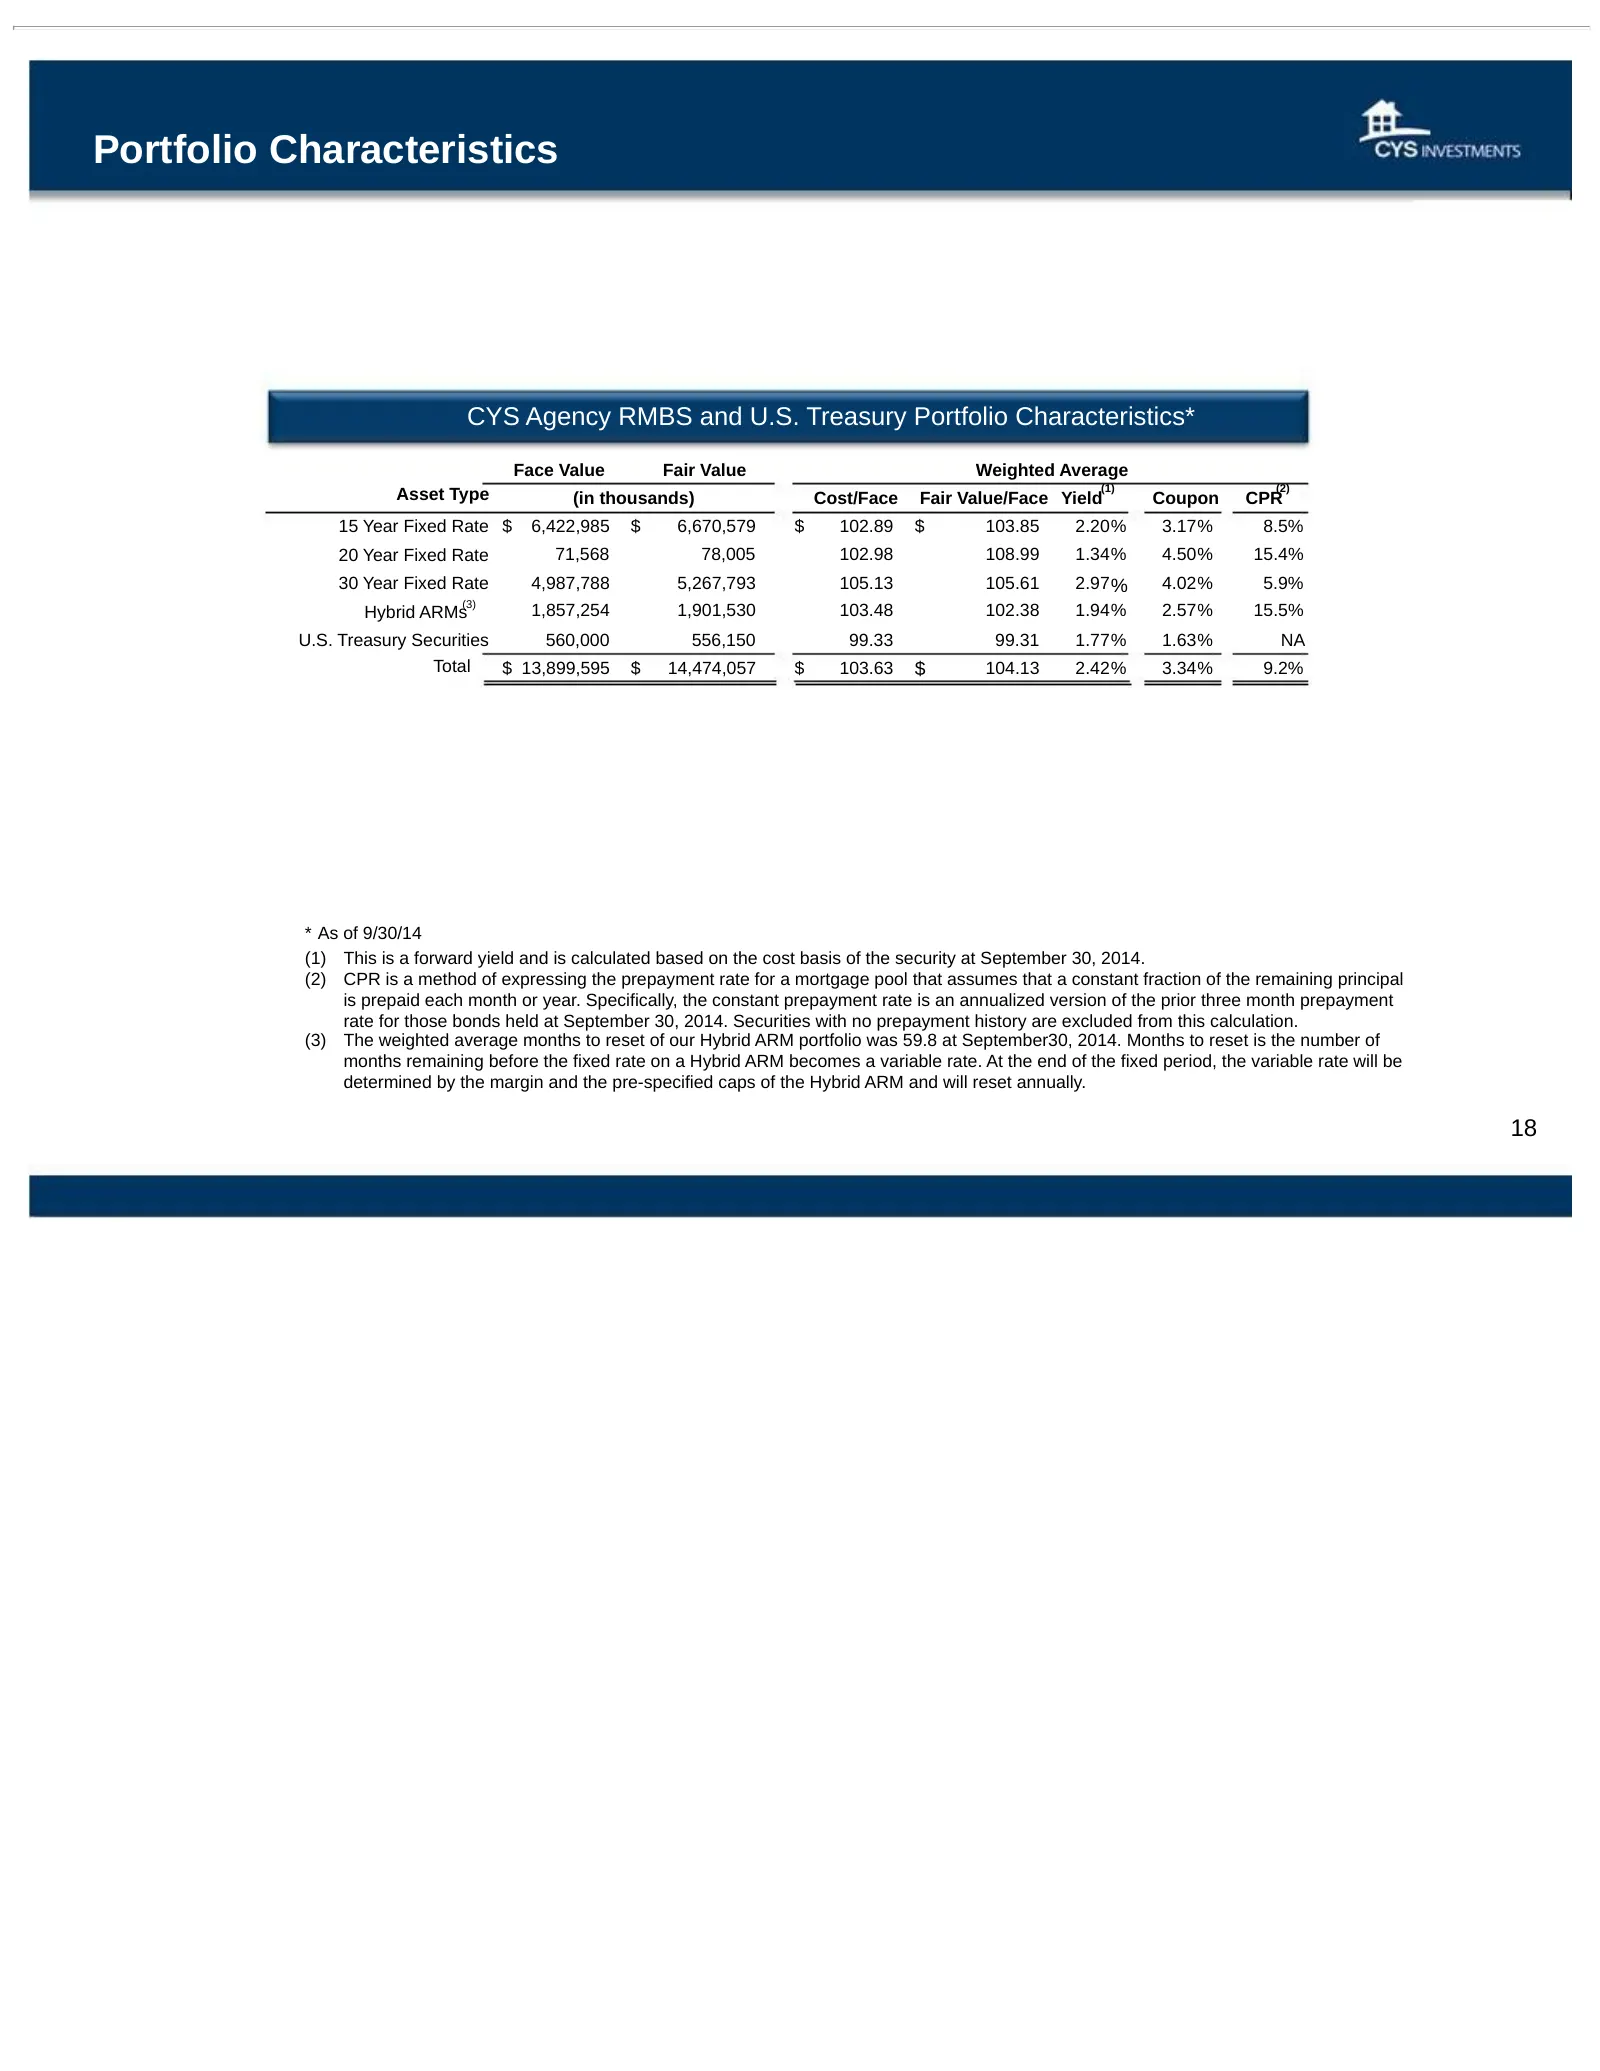
Portfolio Characteristics CYS Agency RMBS and U.S. Treasury Portfolio Characteristics* Face Value Fair Value Weighted Average (1) (2) Asset Type (in thousands) Cost/Face Fair Value/Face Yield Coupon CPR 15 Year Fixed Rate $ 6,422,985 $ 6,670,579 $ 102.89 $ 103.85 2.20% 3.17% 8.5% 20 Year Fixed Rate
Slide 19: Financial Information
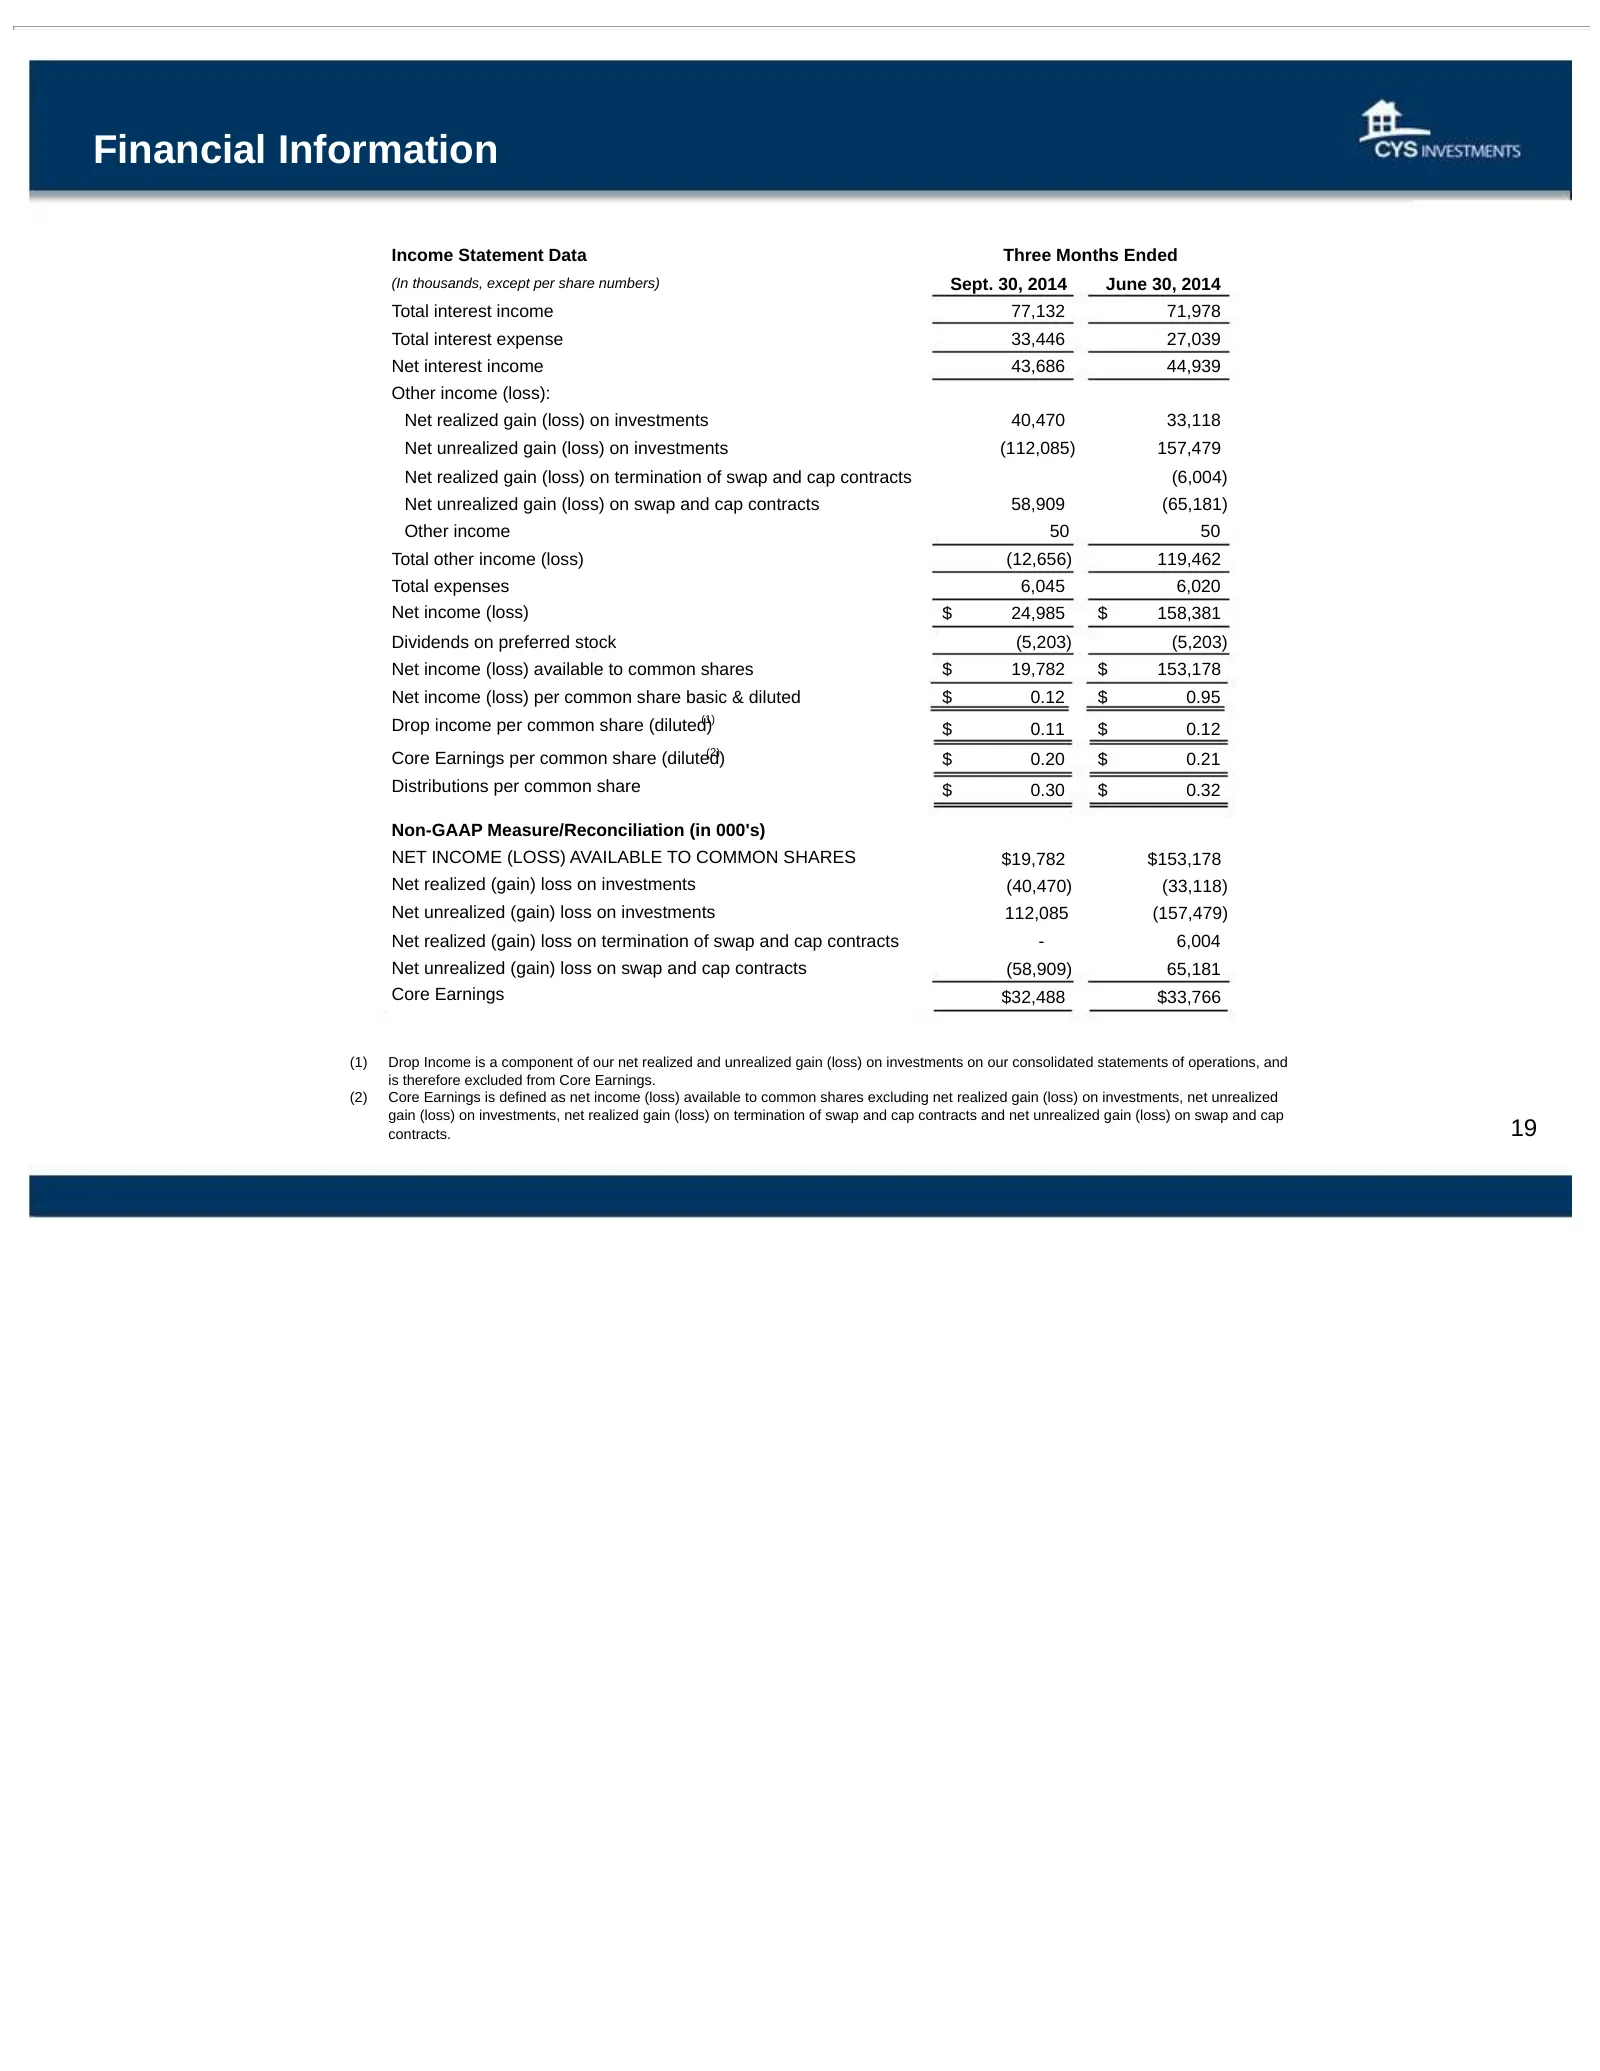
Financial Information Income Statement Data Three Months Ended (In thousands, except per share numbers) Sept. 30, 2014 June 30, 2014 Total interest income 77,132 71,978 Total interest expense 33,446 27,039 Net interest income 43,686 44,939 Other income (loss): Net realized gain (loss) on investments
Slide 20: Financial Information
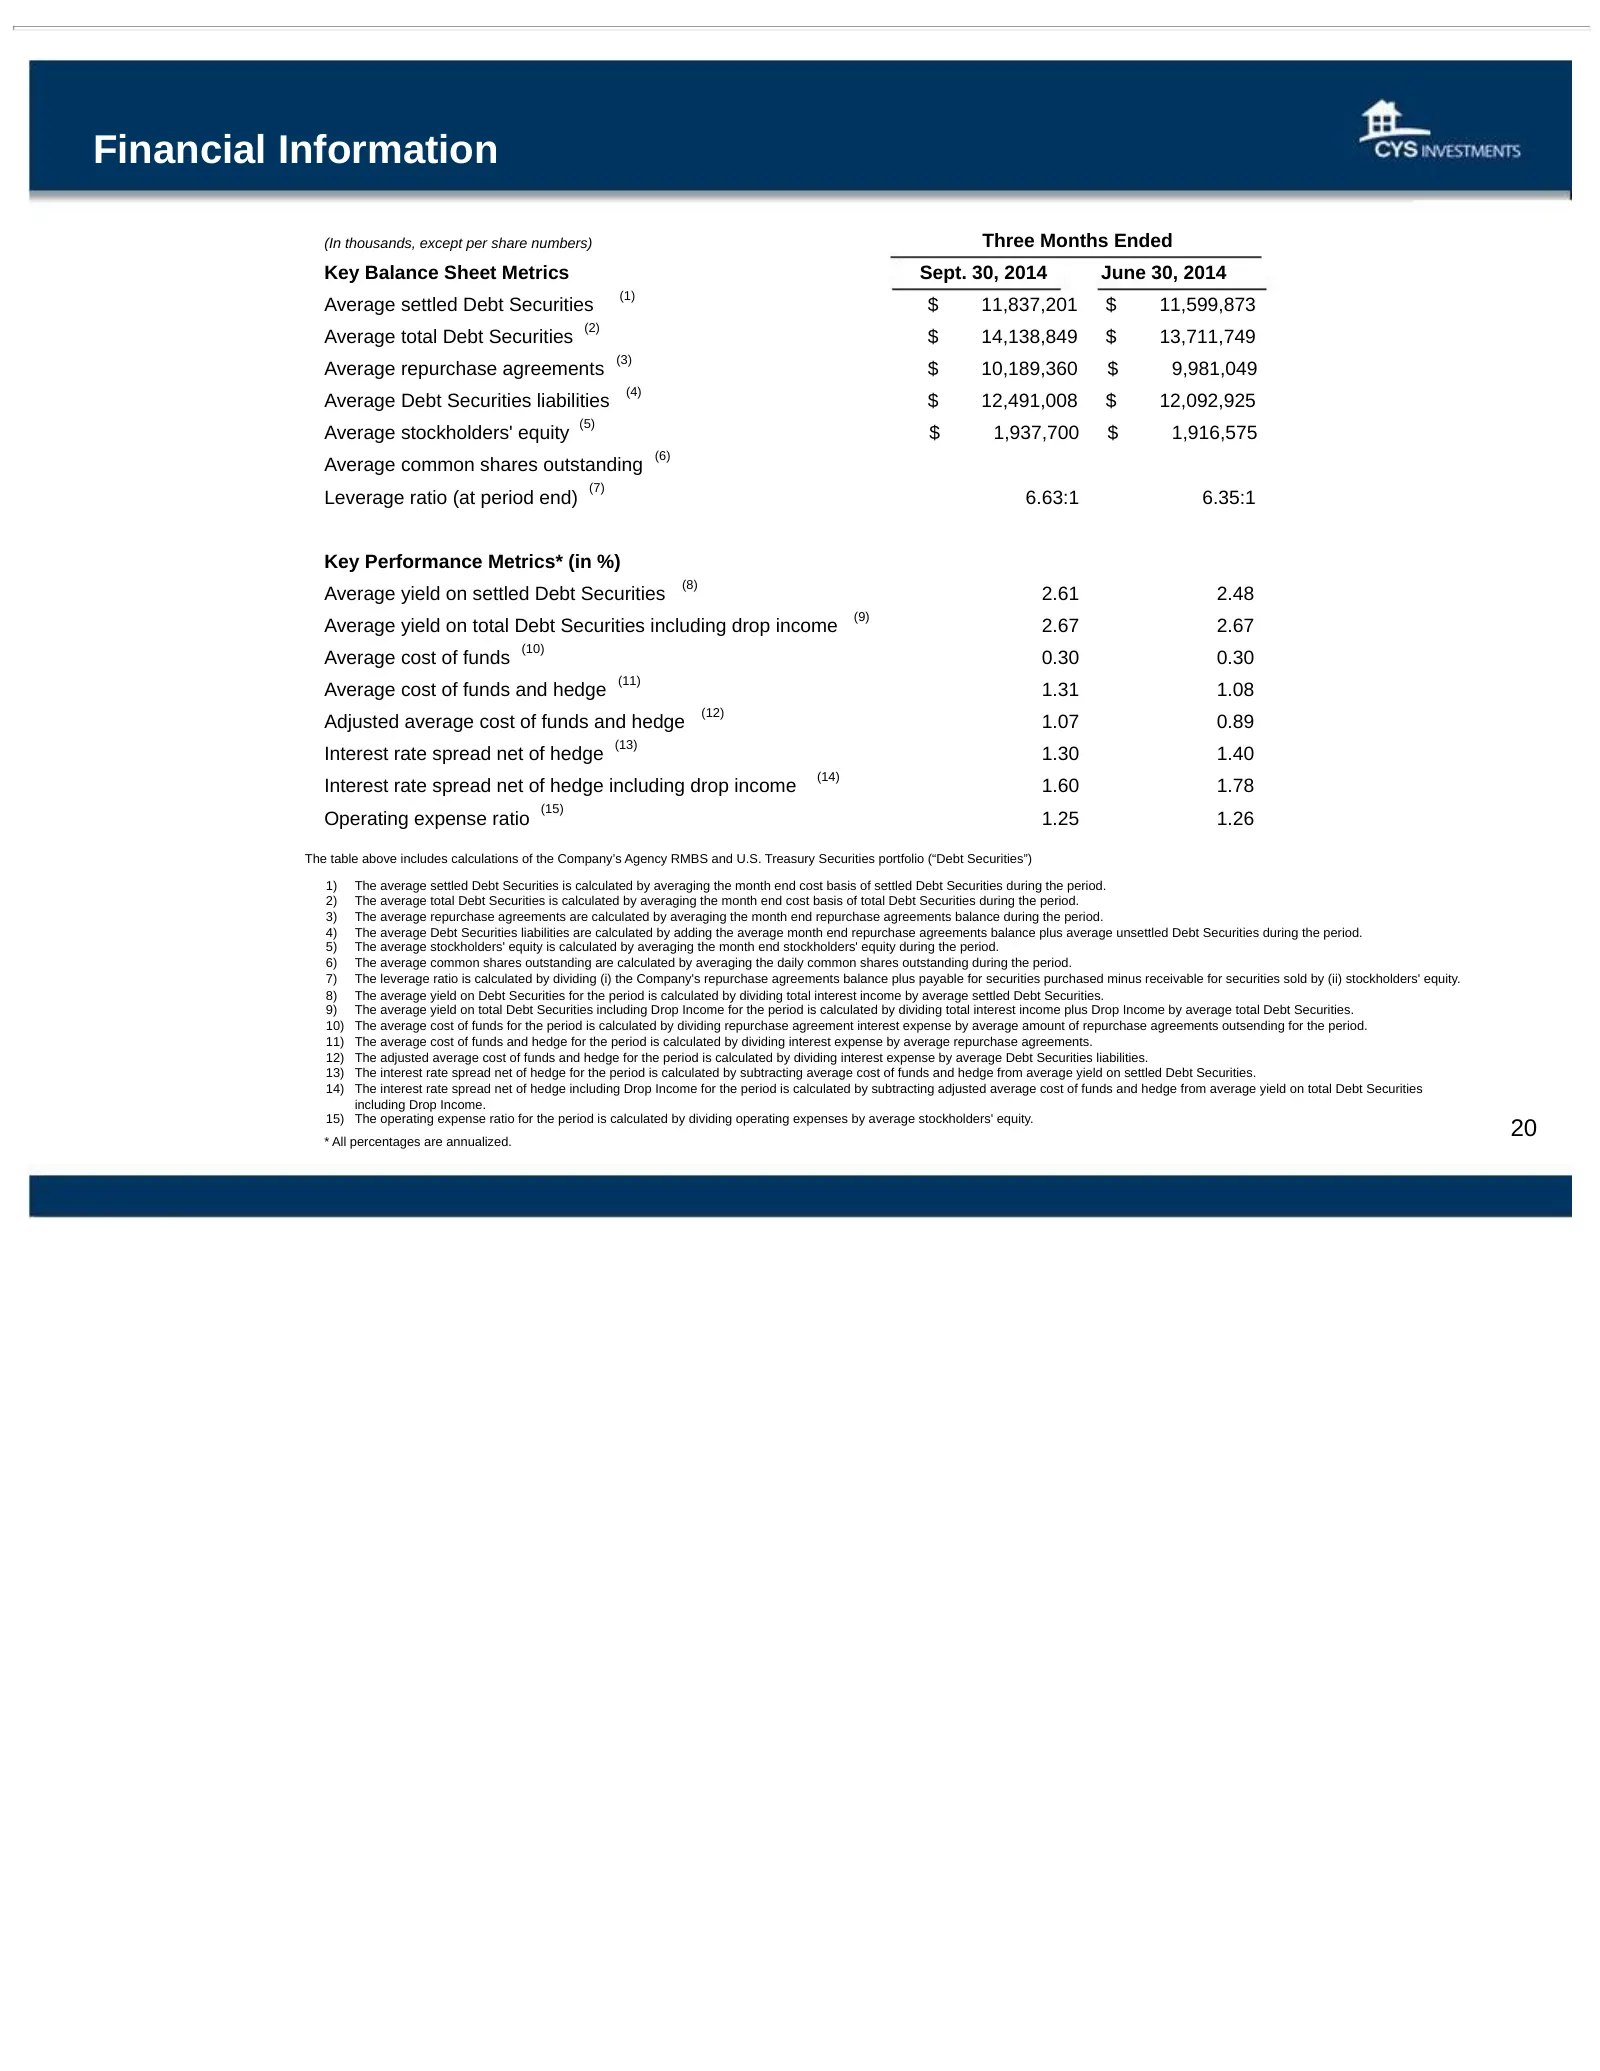
Financial Information (In thousands, except per share numbers) Three Months Ended Key Balance Sheet Metrics Sept. 30, 2014 June 30, 2014 (1) Average settled Debt Securities $ 11,837,201 $ 11,599,873 (2) Average total Debt Securities $ 14,138,849 $ 13,711,749 (3) Average repurchase agreements $ 10,18
Slide 21: Investment Outlook
Investment Outlook Kevin Grant Chief Executive Officer Banking and Financial Services Conference November 13, 2014
Source: SEC EDGAR · 8-K filed Nov 13, 2014
More decks from CYS Investments Inc
 Merger or Acquisition (April 2018)12 slides · Apr 26, 2018
 Barclays Global Financial Services Conference 201724 slides · Sep 11, 2017
 JMP Securities Financial Services and Real Estate Conference 201624 slides · Sep 27, 2016
 Barclays Global Financial Services Conference 201624 slides · Sep 12, 2016
 Proxy Contest (May 2016)8 slides · May 4, 2016
 JMP Securities Financial Services and Real Estate Conference 201522 slides · Sep 21, 2015