Hayes Lemmerz International Inc
Hayes Lemmerz International — FY2005 Earnings Presentation
20 slides from Hayes Lemmerz International's earnings presentation, Apr 21, 2006
Slide 1: 2005 Financials
2005 Financials April 19, 2006

Slide 2: Forward Looking Statements
Forward Looking Statements THIS PRESENTATION CONTAINS FORWARD LOOKING STATEMENTS WITHIN THE MEANING OF THE PRIVATE SECURITIES LITIGATION REFORM ACT OF 1995 WITH RESPECT TO THE FINANCIAL CONDITION, RESULTS OF OPERATIONS, AND BUSINESS OF THE COMPANY. THESE FORWARD LOOKING STATEMENTS INVOLVE CERTAIN RI

Slide 3: Financials
Financials HAYES LEMMERZ INTERNATIONAL, INC.
Slide 4: Summary - Fiscal 2005 vs. Fiscal 2004
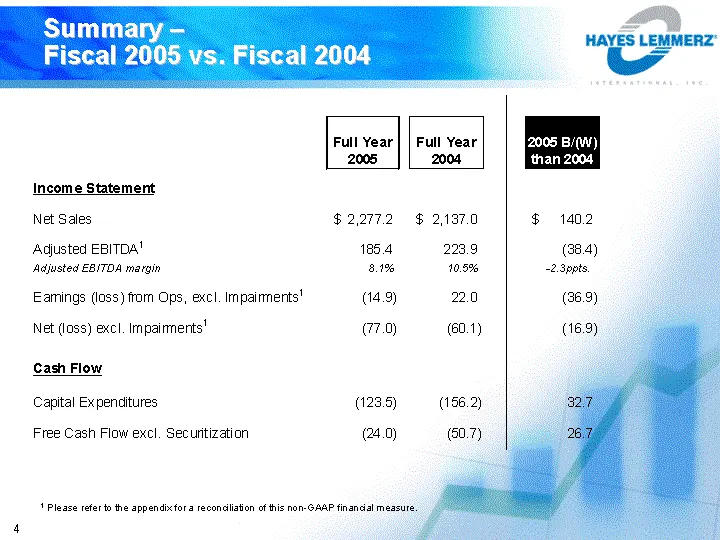
Summary - Fiscal 2005 vs. Fiscal 2004 1 Please refer to the appendix for a reconciliation of this non-GAAP financial measure. 4
Slide 5: 2005 Impairments
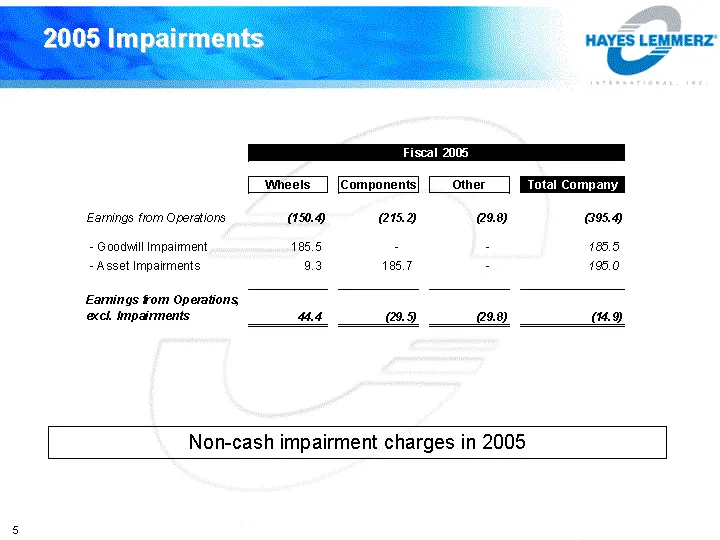
2005 Impairments Non-cash impairment charges in 2005
Slide 6: Fiscal 2005 vs. Fiscal 2004 Change in Net Sales
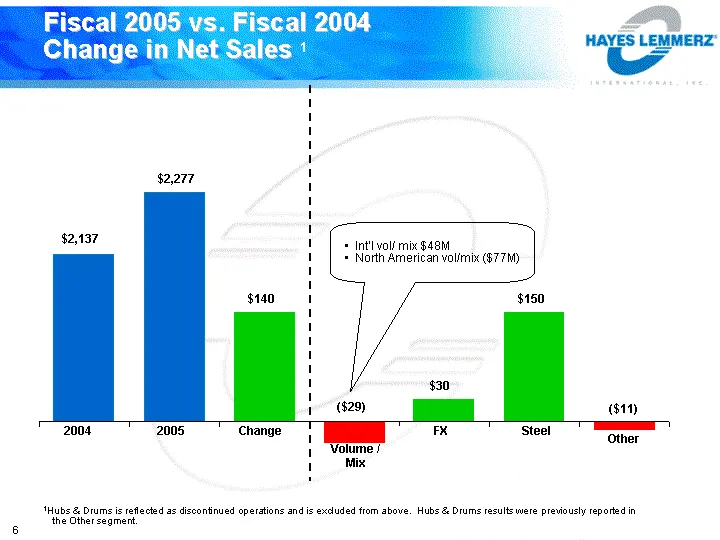
2004 2005 Change $2,137 $2,277 $140 Volume / Mix Steel FX Other ($29) $30 $150 ($11) Fiscal 2005 vs. Fiscal 2004 Change in Net Sales 1 Int'l vol/ mix $48M North American vol/mix ($77M) 1Hubs & Drums is reflected as discontinued operations and is excluded from above. Hubs & Drums results were previou
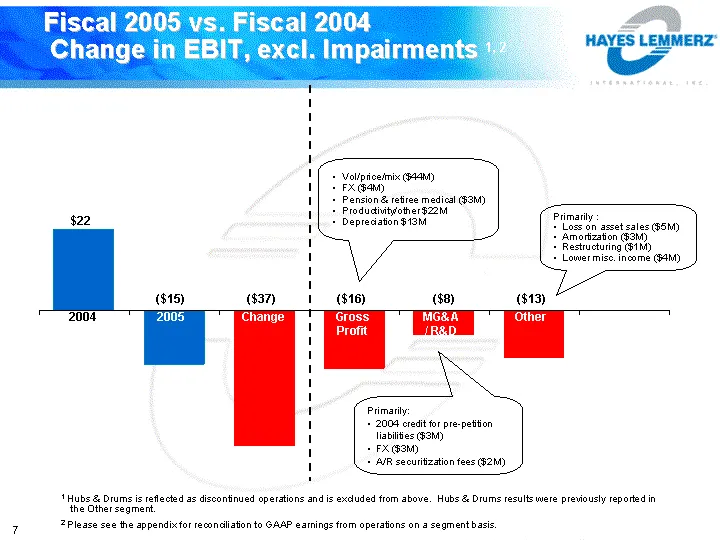
Slide 7: Fiscal 2005 vs. Fiscal 2004 Change in EBIT, excl. Impairments
2004 2005 Change ($15) $22 ($37) Gross Profit Other MG&A / R&D ($16) ($8) ($13) Fiscal 2005 vs. Fiscal 2004 Change in EBIT, excl. Impairments 1, 2 Vol/price/mix ($44M) FX ($4M) Pension & retiree medical ($3M) Productivity/other $22M Depreciation $13M Primarily: 2004 credit for pre-petition liabiliti
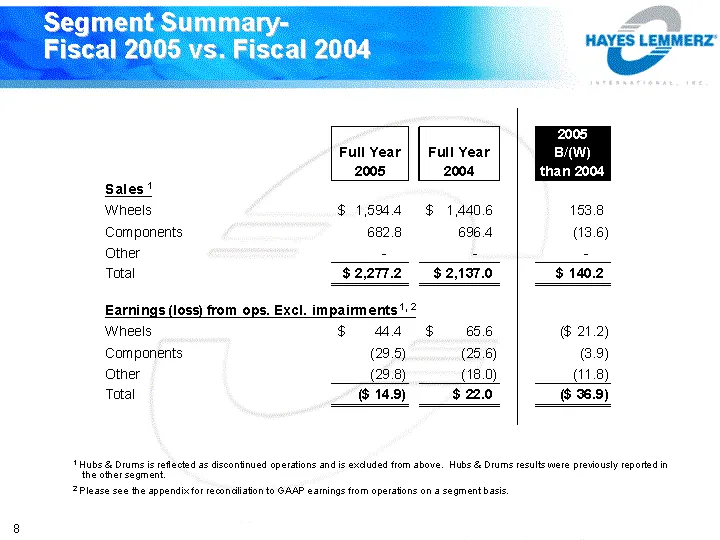
Slide 8: Segment Summary - Fiscal 2005 vs. Fiscal 2004
Segment Summary- Fiscal 2005 vs. Fiscal 2004 1 Hubs & Drums is reflected as discontinued operations and is excluded from above. Hubs & Drums results were previously reported in the other segment. 2 Please see the appendix for reconciliation to GAAP earnings from operations on a segment basis. 8
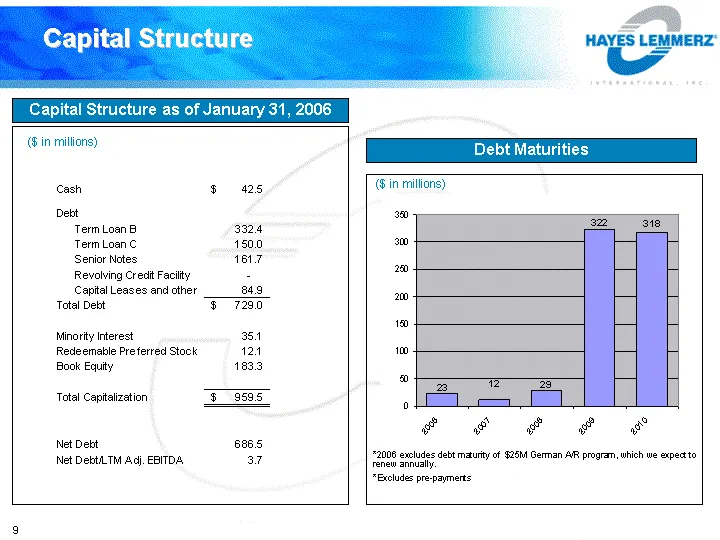
Slide 9: Capital Structure
Capital Structure Capital Structure as of January 31, 2006 Debt Maturities ($ in millions) ($ in millions) *2006 excludes debt maturity of $25M German A/R program, which we expect to renew annually. *Excludes pre-payments
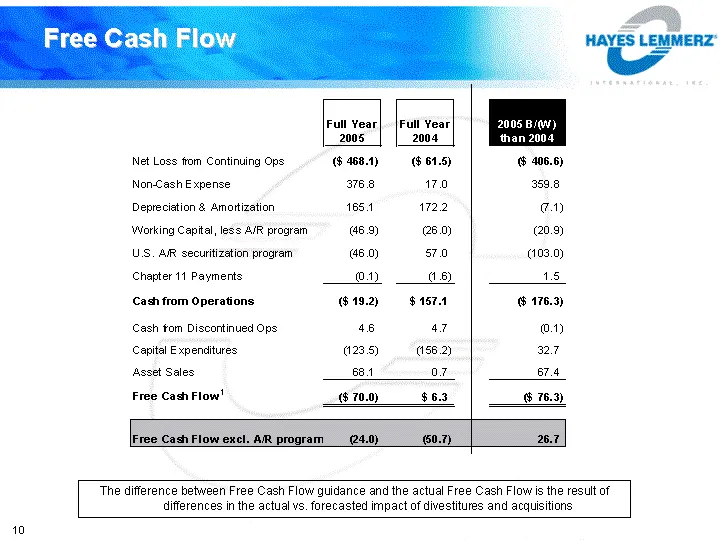
Slide 10: Free Cash Flow
Free Cash Flow The difference between Free Cash Flow guidance and the actual Free Cash Flow is the result of differences in the actual vs. forecasted impact of divestitures and acquisitions
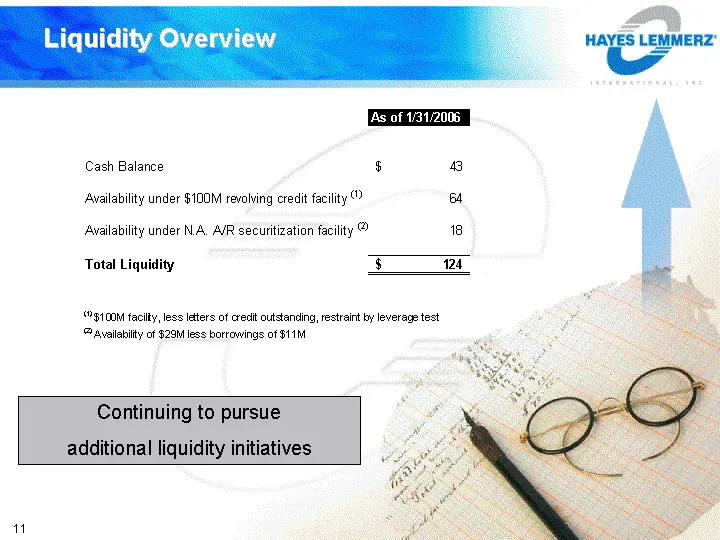
Slide 11: Liquidity Overview
Liquidity Overview Continuing to pursue additional liquidity initiatives 11
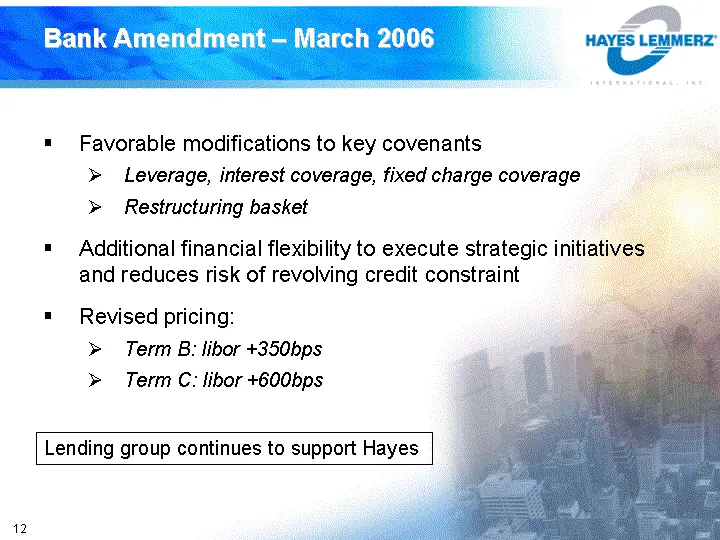
Slide 12: Bank Amendment - March 2006
Bank Amendment - March 2006 Favorable modifications to key covenants Leverage, interest coverage, fixed charge coverage Restructuring basket Additional financial flexibility to execute strategic initiatives and reduces risk of revolving credit constraint Revised pricing: Term B: libor +350bps Term C
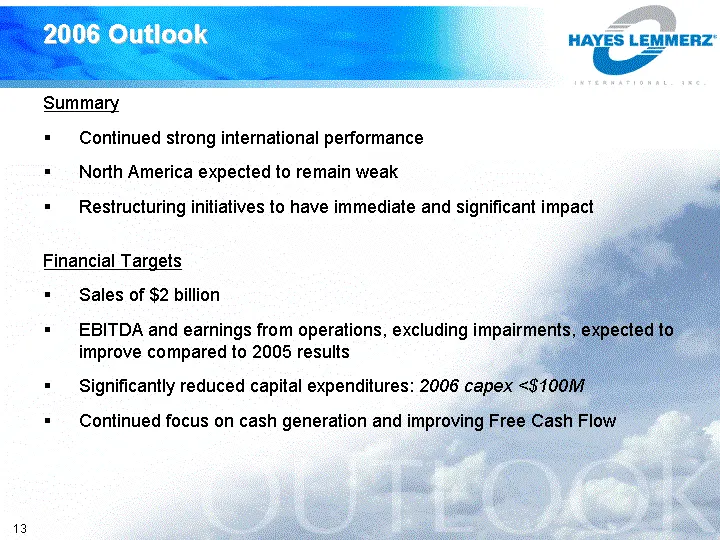
Slide 13: 2006 Outlook Summary
2006 Outlook Summary Continued strong international performance North America expected to remain weak Restructuring initiatives to have immediate and significant impact Financial Targets Sales of $2 billion EBITDA and earnings from operations, excluding impairments, expected to improve compared to 2
Slide 14: Appendix
Appendix HAYES LEMMERZ INTERNATIONAL, INC.
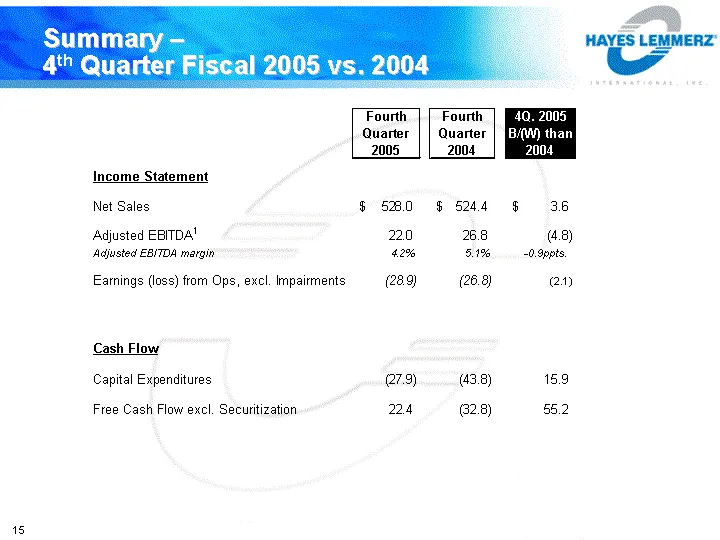
Slide 15: Summary - 4th Quarter Fiscal 2005 vs. 2004
Summary - 4th Quarter Fiscal 2005 vs. 2004
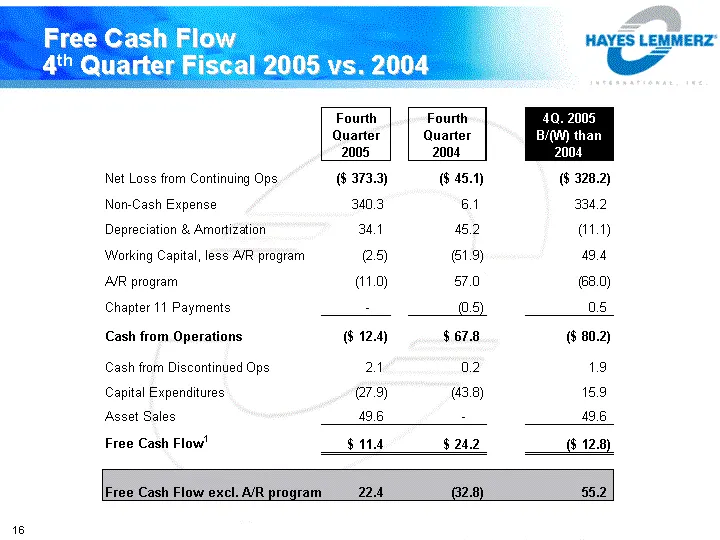
Slide 16: Free Cash Flow 4th Quarter Fiscal 2005 vs. 2004
Free Cash Flow 4th Quarter Fiscal 2005 vs. 2004
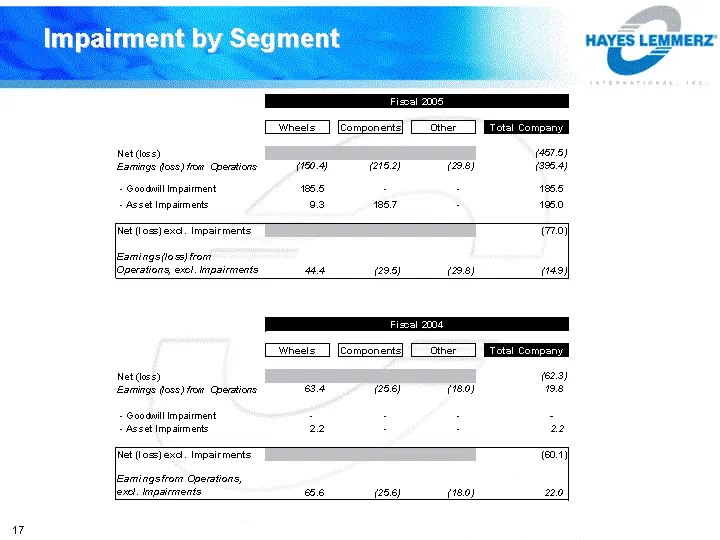
Slide 17: Impairment by Segment
7 Impairment by Segment ~~ HAYES LEMMERZ" Tota Net (ess) Eamings foss)tom Cparations (100.4) (216.2) (238) ‘Goodall Impairment 105.5 ‘Asset Impairments 23 1987 Ret Posey excl. Impairments 70] leamings;toss trom [Operations ext. kapaireents wa 295) 1298) (149) Net (kes) Eamings (oss) fom Goarations a
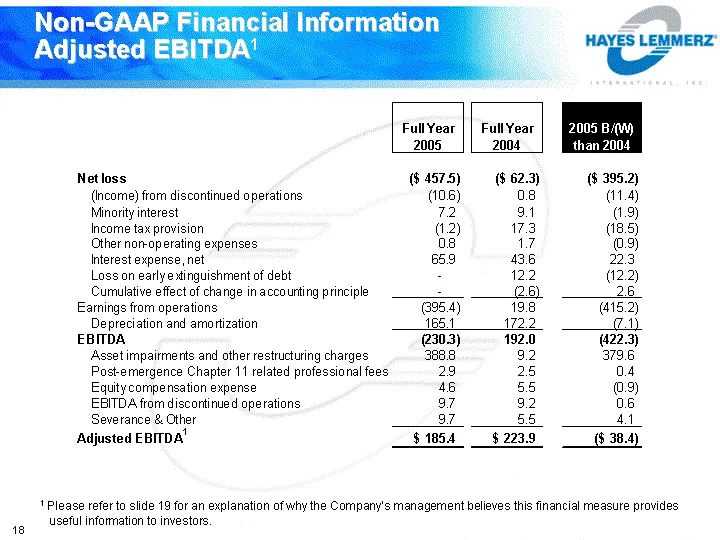
Slide 18: Non-GAAP Financial Information Adjusted EBITDA
Non-GAAP Financial Information Adjusted EBITDA1 1 Please refer to slide 19 for an explanation of why the Company's management believes this financial measure provides useful information to investors.
Slide 19: Financial Measures
Financial Measures Adjusted EBITDA: EBITDA, a measure used by management to measure operating performance, is defined as earnings from operations plus depreciation and amortization. Adjusted EBITDA is defined as EBITDA further adjusted to exclude: (i) asset impairment losses and other restructuring
Slide 20: Non-GAAP Financial Measures Free Cash Flow
Non - GAAP Financial Measures Free Cash Flow: Free cash flow is used by management as a non-GAAP financial measure because it identifies the amount of cash available to meet principal debt amortization requirements, pay dividends to stockholders, or make corporate investments.
Source: SEC EDGAR · 8-K filed Apr 21, 2006
More decks from Hayes Lemmerz International Inc
 Q3 2008 Earnings Presentation29 slides · Dec 4, 2008
 Q2 2008 Earnings Presentation34 slides · Sep 4, 2008
 Q1 2008 Earnings Presentation35 slides · Jun 5, 2008
 FY2007 Earnings Presentation35 slides · Apr 10, 2008
 Morgan Stanley Global Automotive Conference 200837 slides · Mar 19, 2008
 2008 Auto Analysts of New York Conference39 slides · Jan 16, 2008