Evonik Industries AG · XETR:EVK
Evonik Industries — Q3 2017 Earnings Presentation
31 slides from Evonik Industries's earnings presentation, Nov 3, 2017
Slide 1: Evonik Q3 2017 Earnings Conference Call
Evonik Power to create. Q3 2017 Earnings Conference Call 3 November 2017 Christian Kullmann, Chief Executive Officer Ute Wolf, Chief Financial Officer 1
Slide 2: Table of contents
Table of contents 1. Highlights Q3 2017 2. Financial performance Q3 2017 3. Outlook FY 2017 2 3 November 2017 | Evonik Q3 2017 Earnings Conference Call
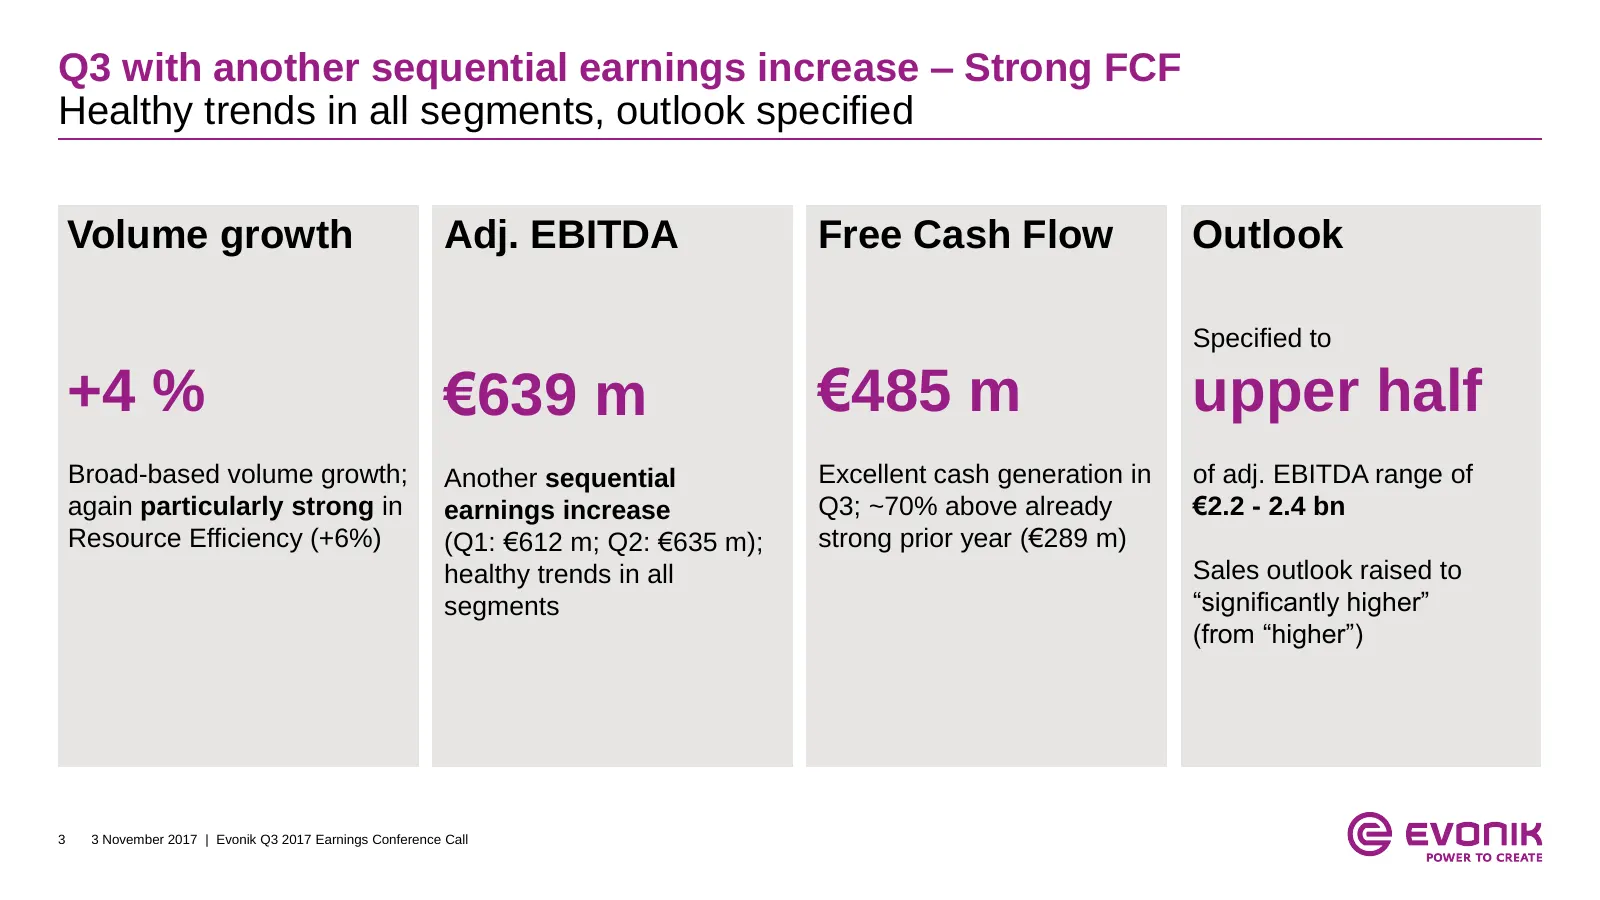
Slide 3: Q3 with another sequential earnings increase – Strong FCF
Q3 with another sequential earnings increase – Strong FCF Healthy trends in all segments, outlook specified Volume growth Adj. EBITDA Free Cash Flow Outlook Specified to +4 % €639 m €485 m upper half ) Broad-based volume growth; Another sequential Excellent cash generation in of adj. EBITDA range of
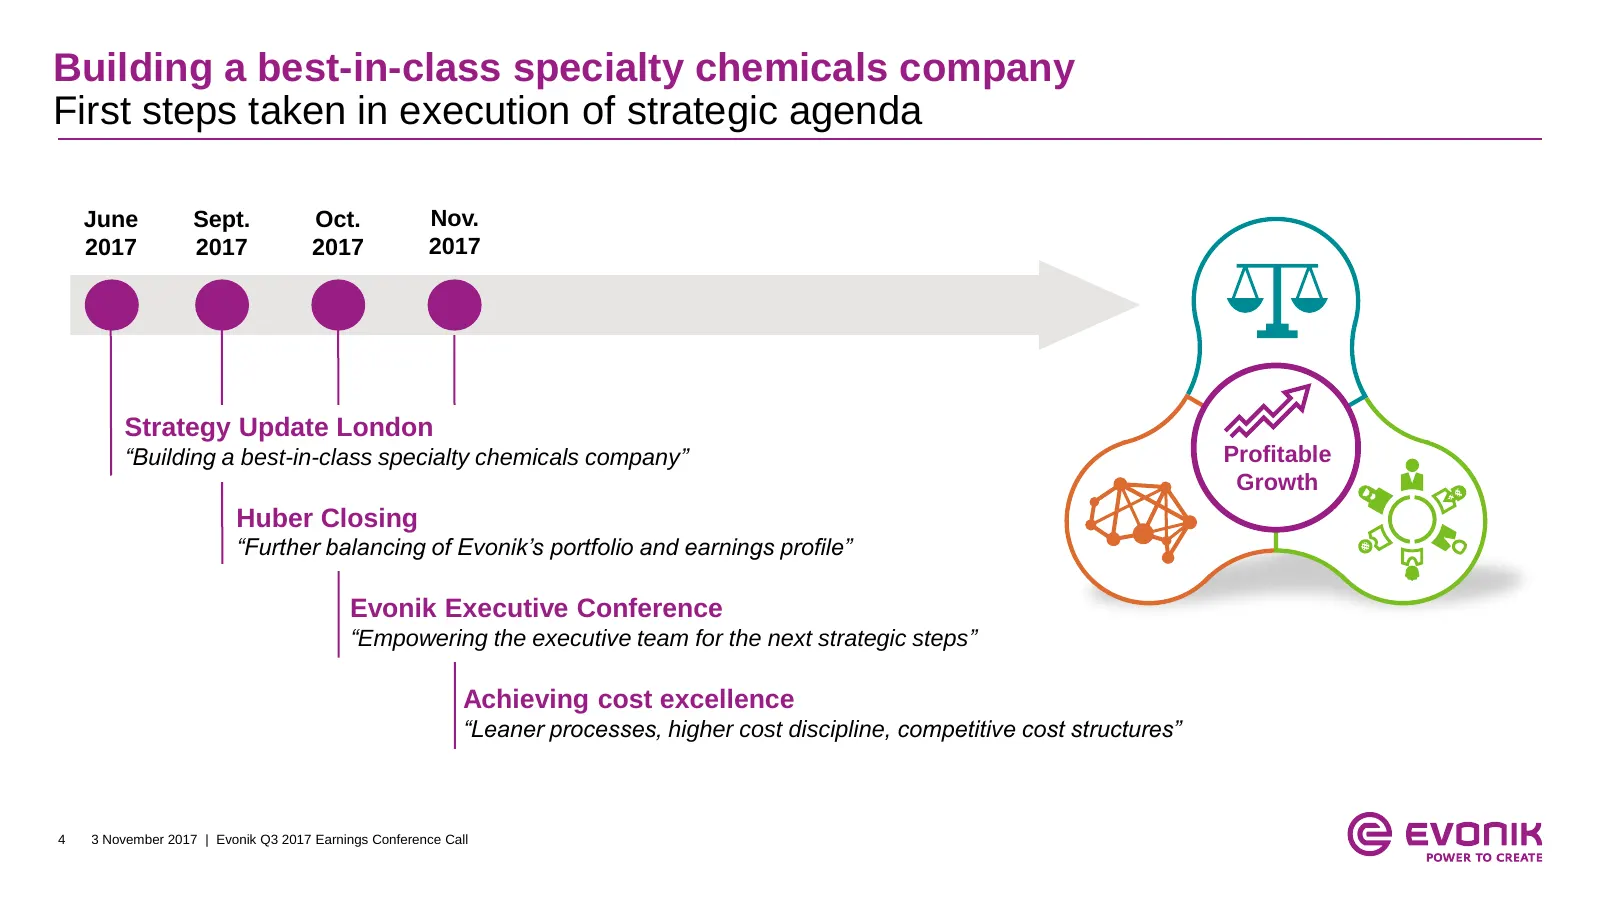
Slide 4: Building a best-in-class specialty chemicals company
Building a best-in-class specialty chemicals company First steps taken in execution of strategic agenda June Sept. Oct. Nov. 2017 2017 2017 2017 Strategy Update London “Building a best-in-class specialty chemicals company” Profitable Growth Huber Closing “Further balancing of Evonik’s portfolio and
Slide 5: Consistently executing levers for structural uplift in profitability and growth
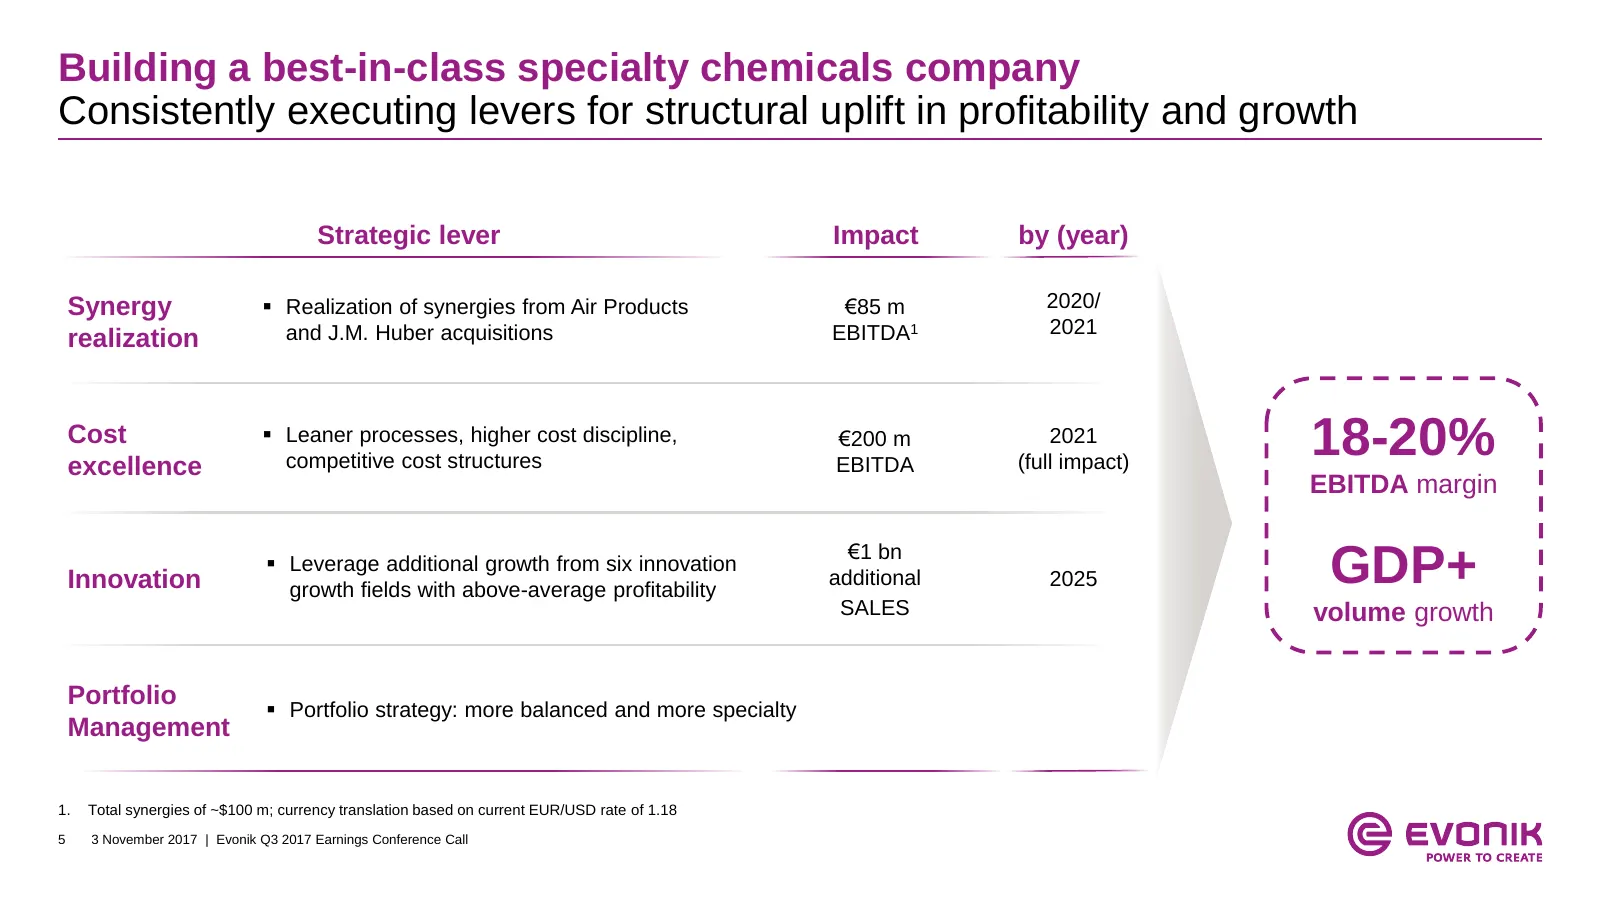
Building a best-in-class specialty chemicals company Consistently executing levers for structural uplift in profitability and growth Strategic lever Impact by (year) Synergy Realization of synergies from Air Products €85 m 2020/ and J.M. Huber acquisitions EBITDA1 2021 realization Cost excellence
Slide 6: Achieving cost excellence
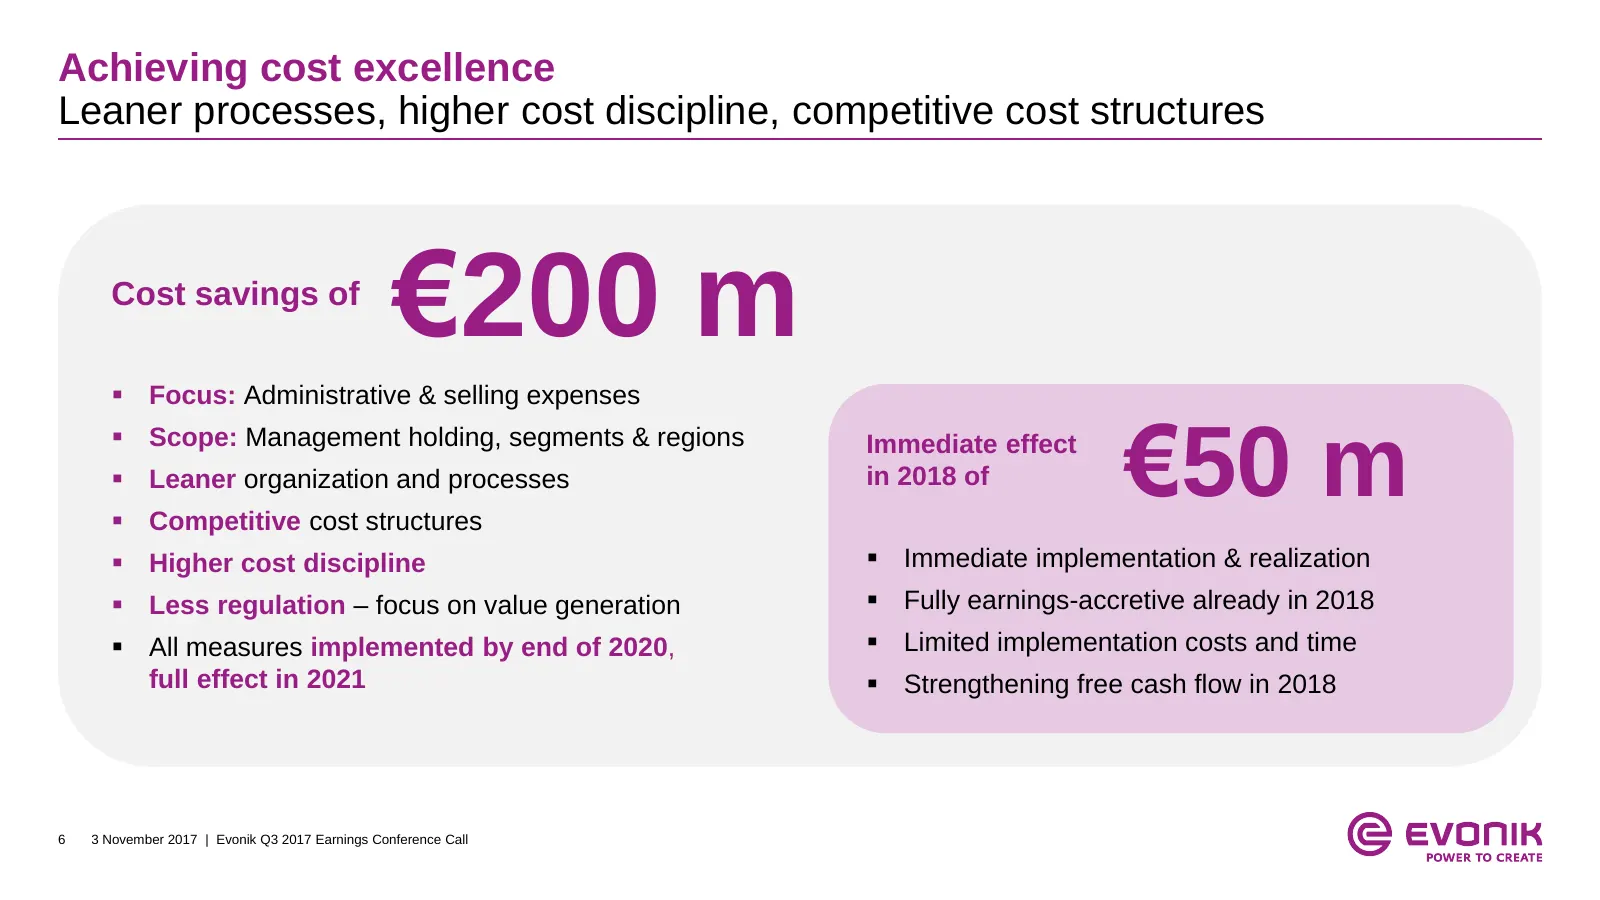
Achieving cost excellence Leaner processes, higher cost discipline, competitive cost structures Cost savings of €200 m Focus: Administrative & selling expenses €50 m Scope: Management holding, segments & regions Immediate effect Leaner organization and processes in 2018 of Competitive cost s
Slide 7: Table of contents
Table of contents 1. Highlights Q3 2017 2. Financial performance Q3 2017 3. Outlook FY 2017 7 3 November 2017 | Evonik Q3 2017 Earnings Conference Call
Slide 8: Financial highlights Q3 2017
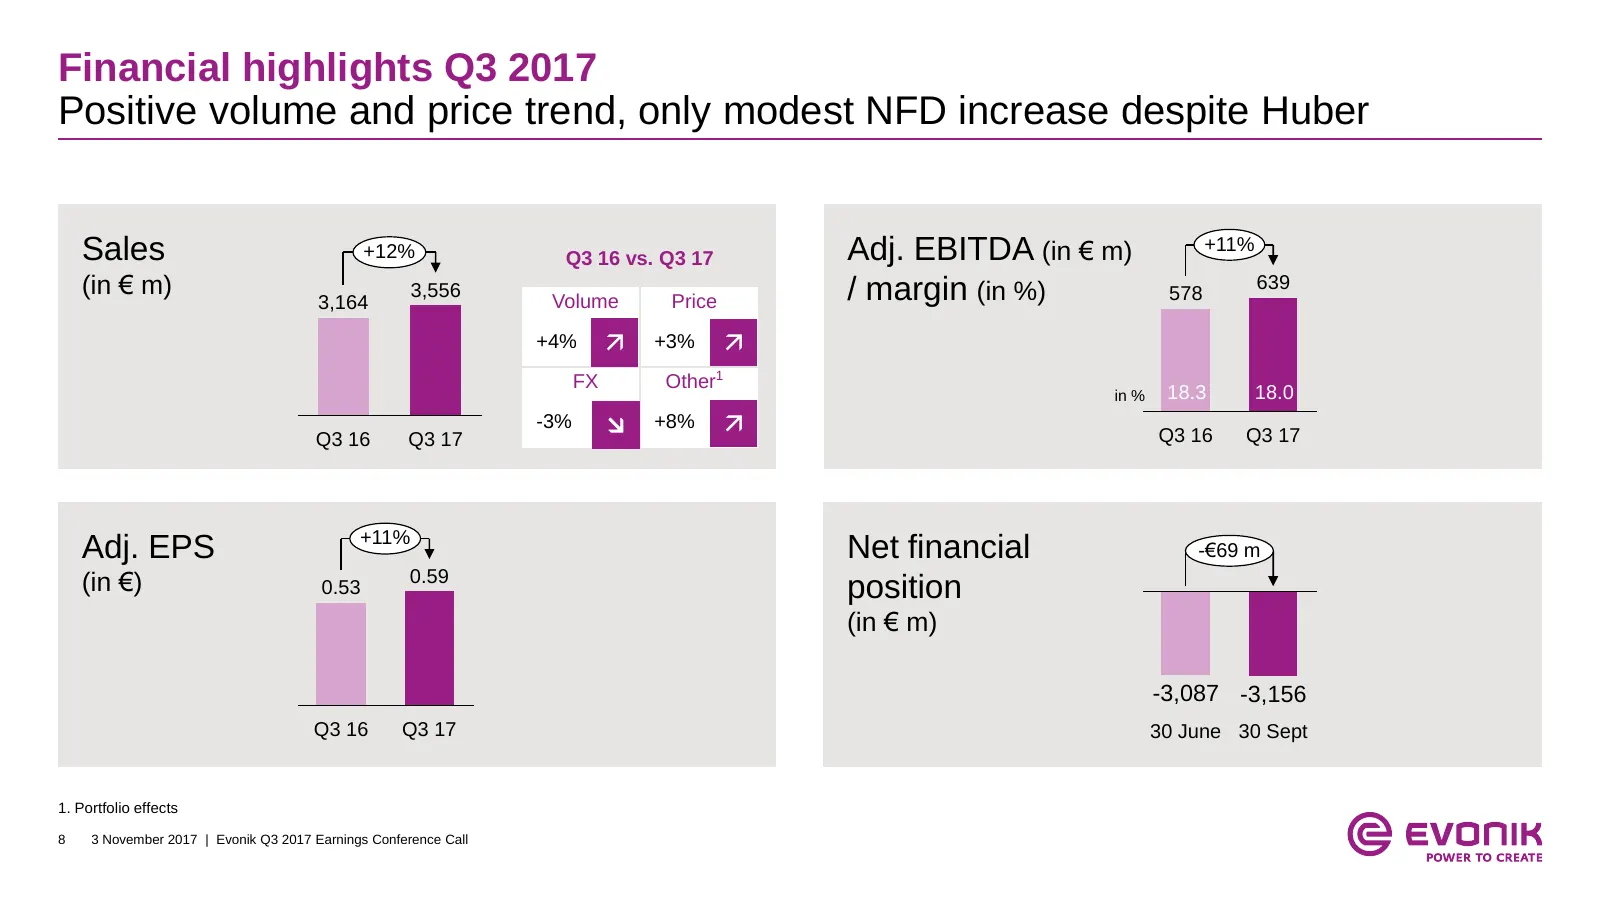
Financial highlights Q3 2017 Positive volume and price trend, only modest NFD increase despite Huber Sales +12% Q3 16 vs. Q3 17 Adj. EBITDA (in € m) +11% (in € m) 3,556 / margin (in %) 578 639 3,164 Volume Price +4% +3% FX Other1 in % 18.3 18.0 Q3 16 Q3 17 -3% +8% Q3 16 Q3 17 +11% Adj. E
Slide 9: Free cash flow Q3 2017
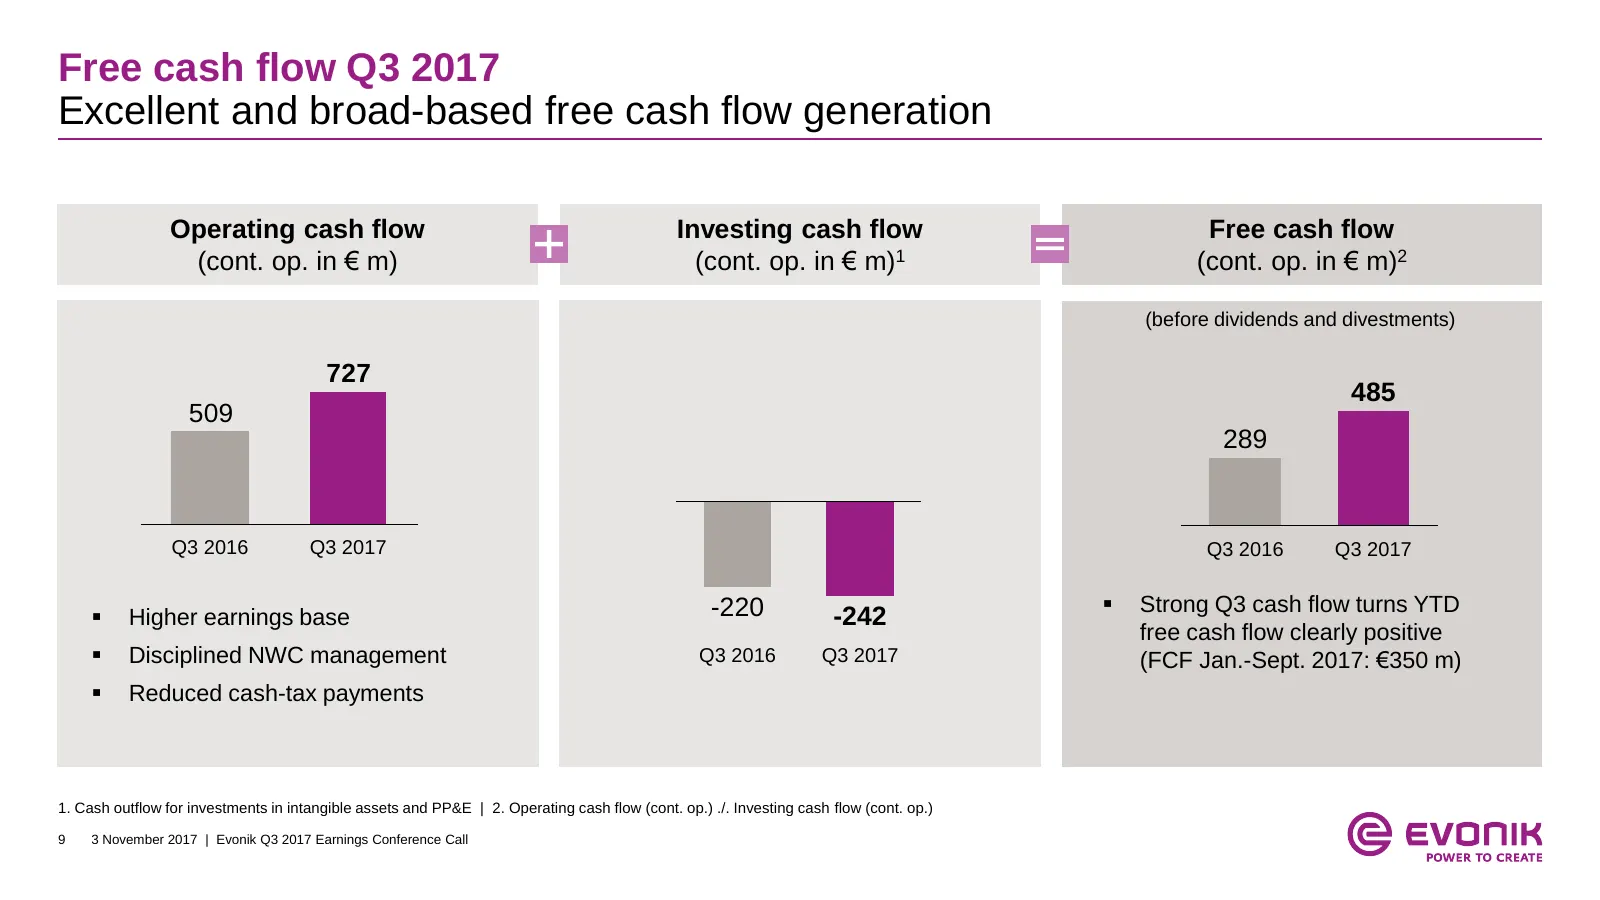
Free cash flow Q3 2017 Excellent and broad-based free cash flow generation Operating cash flow Investing cash flow Free cash flow (cont. op. in € m) (cont. op. in € m)1 (cont. op. in € m)2 (before dividends and divestments) 727 485 509 289 Q3 2016 Q3 2017 Q3 2016 Q3 2017 -220 Strong Q3 cash flow t
Slide 10: Resource Efficiency
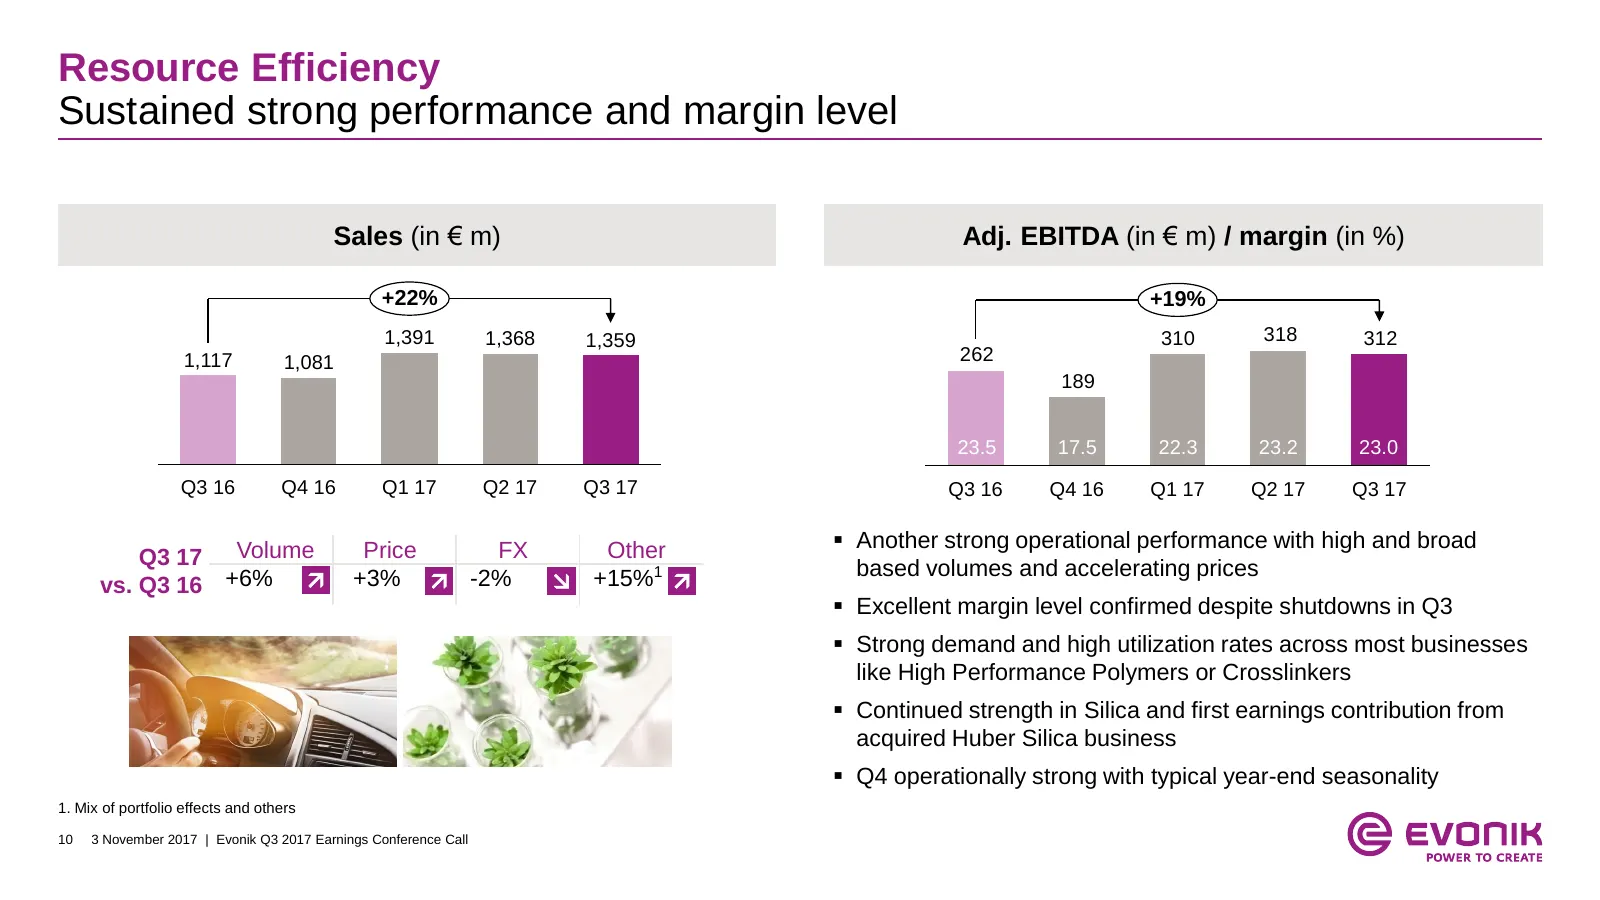
Resource Efficiency Sustained strong performance and margin level Sales (in € m) Adj. EBITDA (in € m) / margin (in %) +22% +19% 1,391 1,368 1,359 310 318 312 1,117 1,081 262 189 23.5 17.5 22.3 23.2 23.0 Q3 16 Q4 16 Q1 17 Q2 17 Q3 17 Q3 16 Q4 16 Q1 17 Q2 17 Q3 17 Another strong operational performa
Slide 11: Nutrition & Care
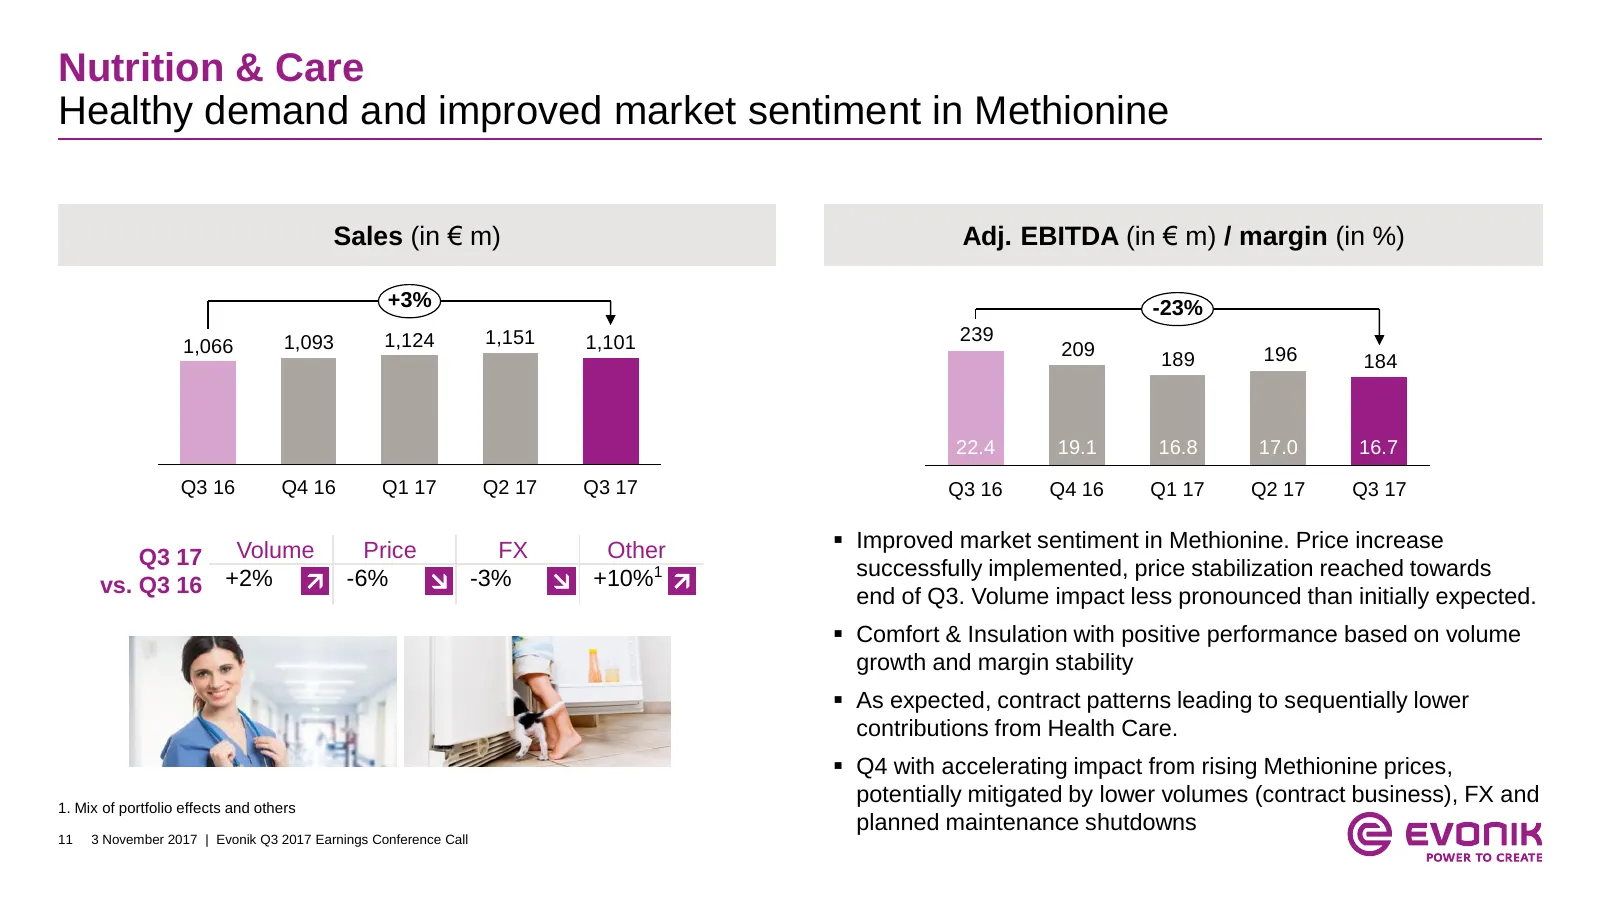
Nutrition & Care Healthy demand and improved market sentiment in Methionine Sales (in € m) Adj. EBITDA (in € m) / margin (in %) +3% -23% 1,093 1,124 1,151 1,101 239 1,066 209 196 189 184 22.4 19.1 16.8 17.0 16.7 Q3 16 Q4 16 Q1 17 Q2 17 Q3 17 Q3 16 Q4 16 Q1 17 Q2 17 Q3 17 Improved market sentiment
Slide 12: Performance Materials
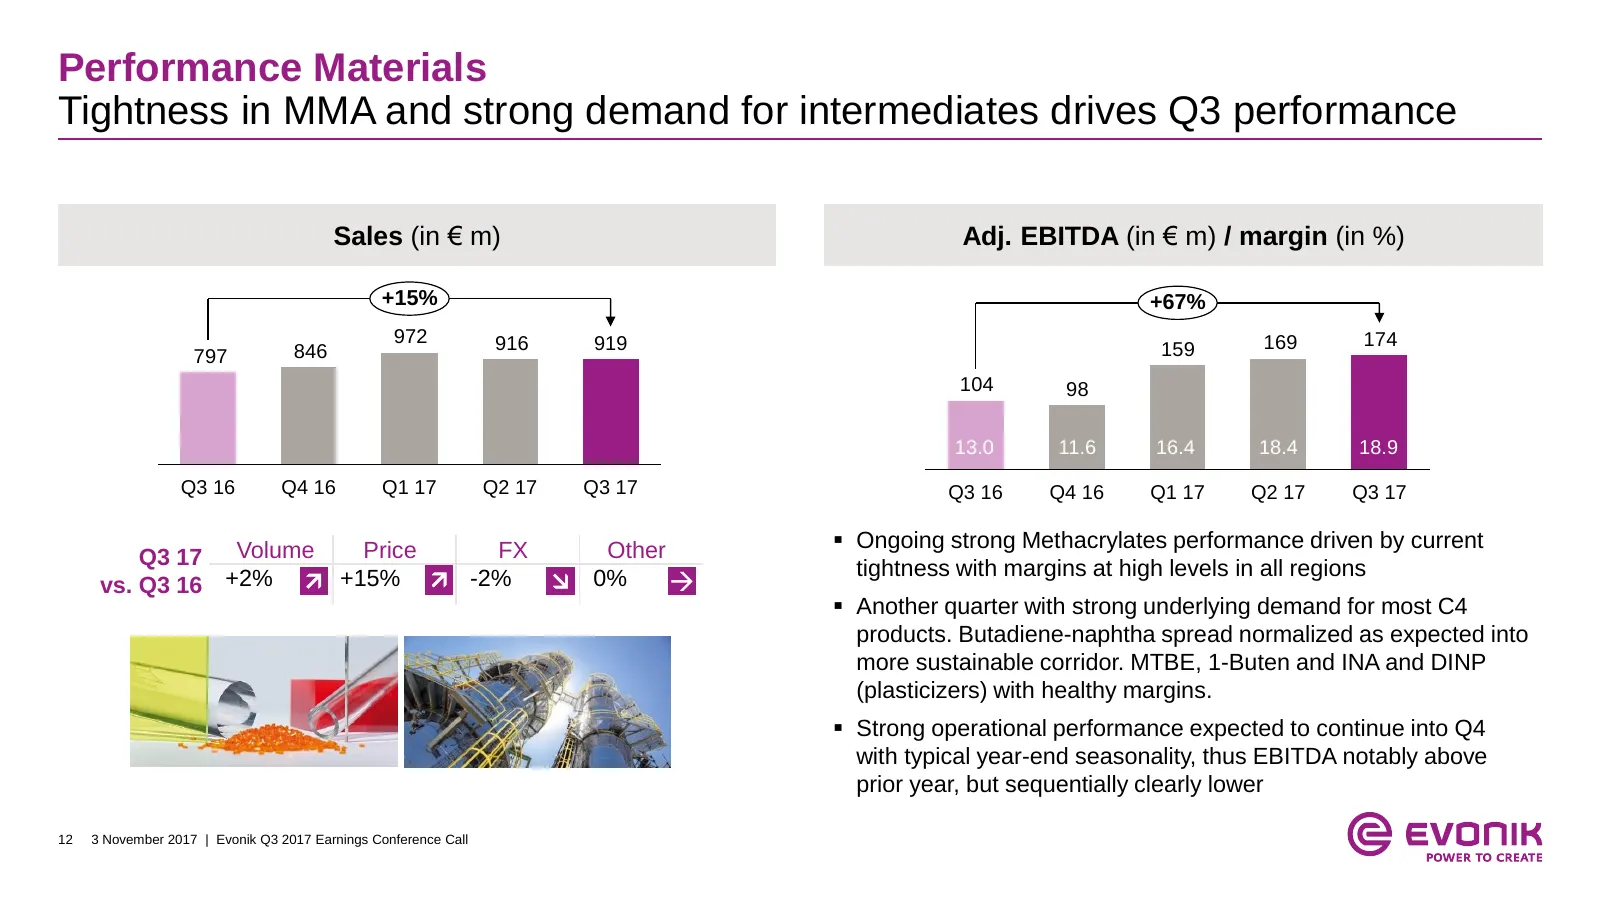
Performance Materials Tightness in MMA and strong demand for intermediates drives Q3 performance Sales (in € m) Adj. EBITDA (in € m) / margin (in %) +15% +67% 972 916 919 169 174 797 846 159 104 98 13.0 11.6 16.4 18.4 18.9 Q3 16 Q4 16 Q1 17 Q2 17 Q3 17 Q3 16 Q4 16 Q1 17 Q2 17 Q3 17 Ongoing strong
Slide 13: Table of contents
Table of contents 1. Highlights Q3 2017 2. Financial performance Q3 2017 3. Outlook FY 2017 13 3 November 2017 | Evonik Q3 2017 Earnings Conference Call
Slide 14: Outlook for 2017 specified
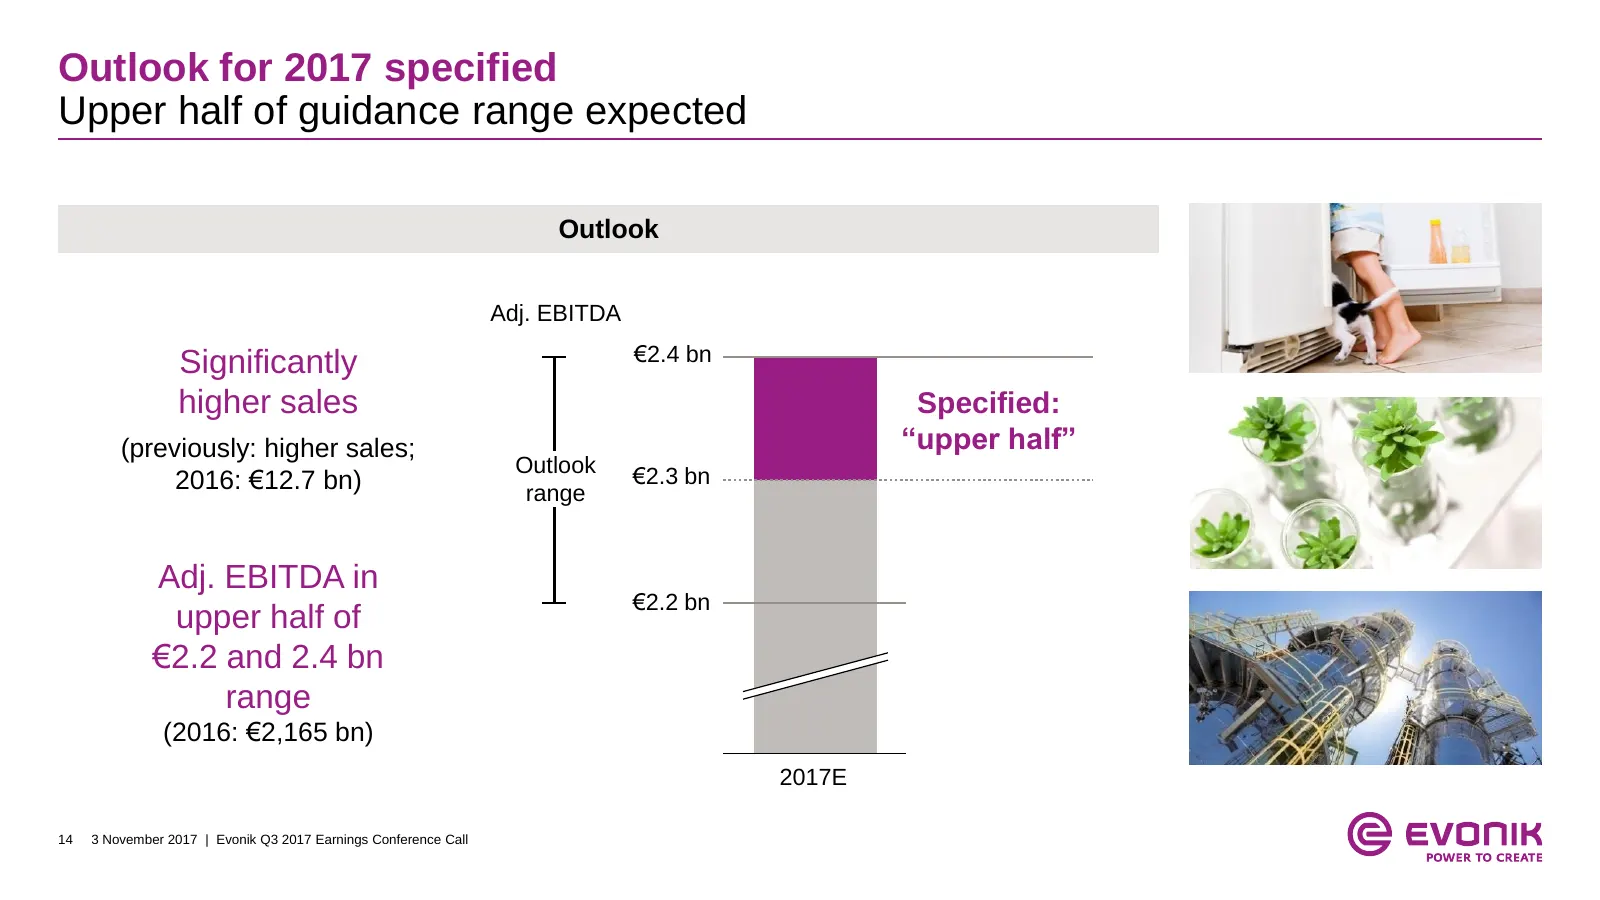
Outlook for 2017 specified Upper half of guidance range expected Outlook Adj. EBITDA Significantly €2.4 bn higher sales Specified: (previously: higher sales; “upper half” Outlook €2.3 bn 2016: €12.7 bn) range Adj. EBITDA in €2.2 bn upper half of €2.2 and 2.4 bn range (2016: €2,165 bn) 2017E 14 3 Nov
Slide 15: © evonik
© evonik
Slide 16: Additional indications for 2017
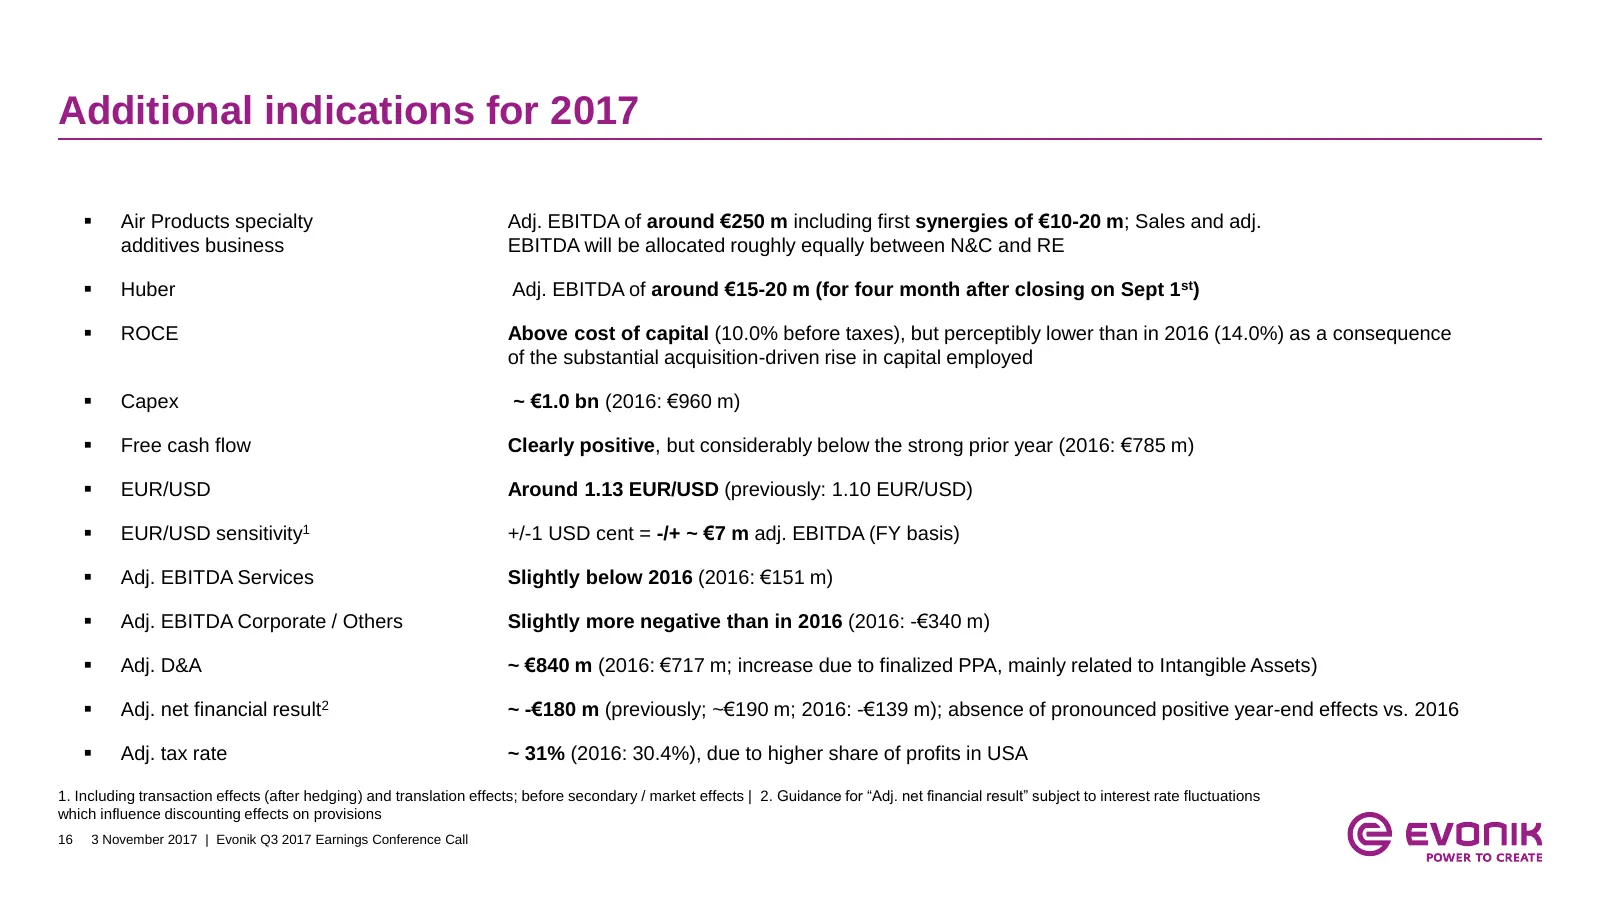
Additional indications for 2017 Air Products specialty Adj. EBITDA of around €250 m including first synergies of €10-20 m; Sales and adj. additives business EBITDA will be allocated roughly equally between N&C and RE Huber Adj. EBITDA of around €15-20 m (for four month after closing on Sept 1st)
Slide 17: Air Products specialty additives integration status
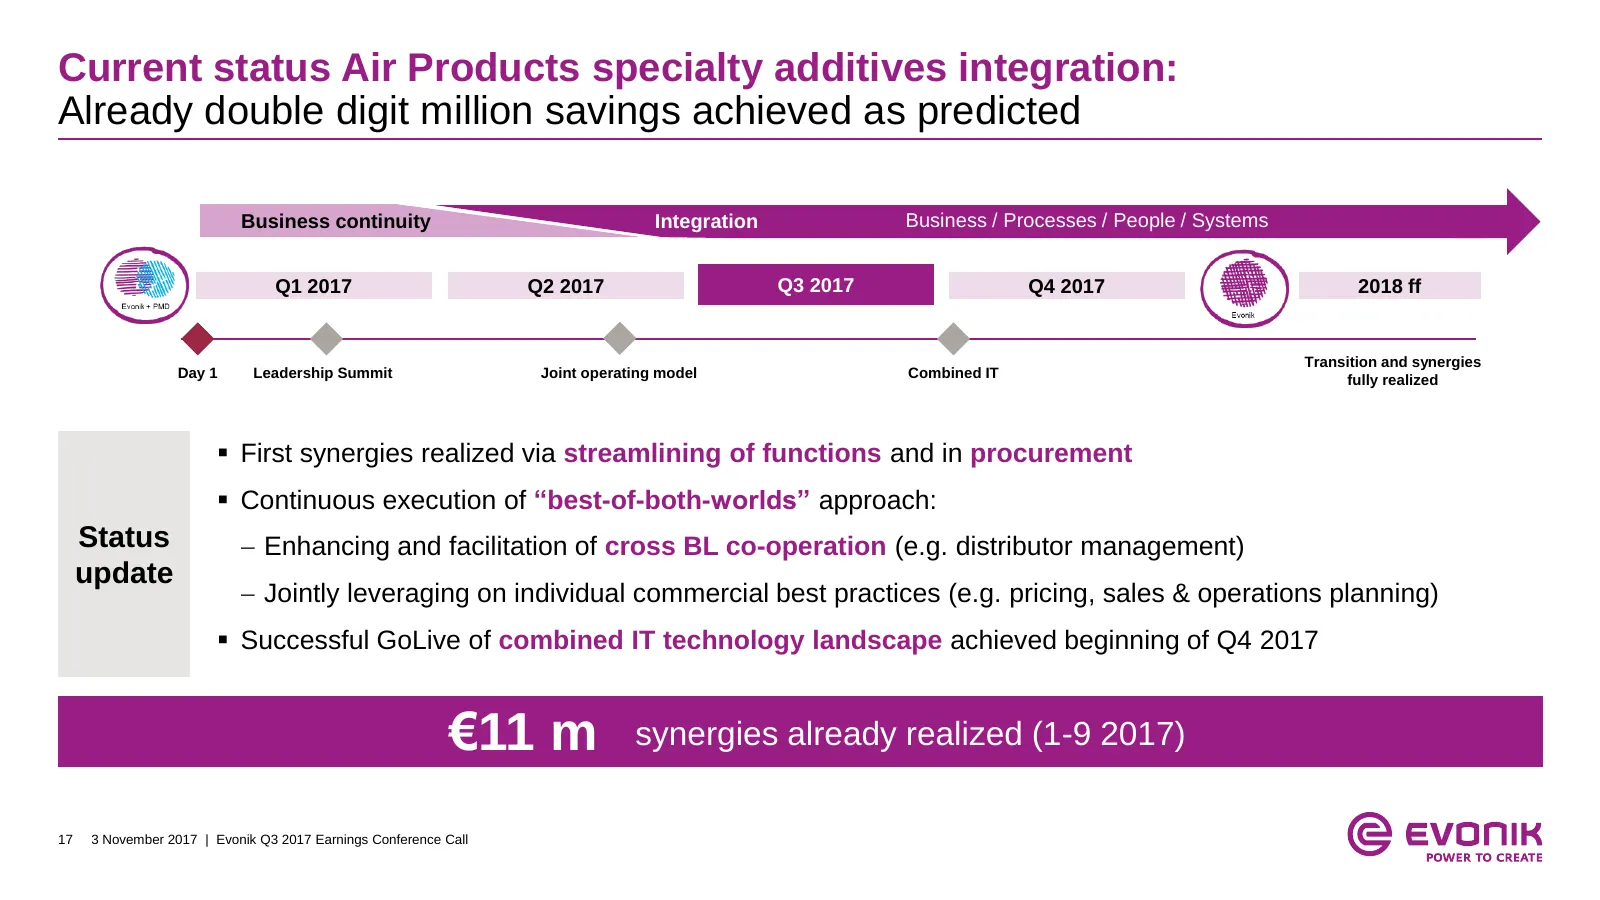
Current status Air Products specialty additives integration: Already double digit million savings achieved as predicted Business continuity Integration Business / Processes / People / Systems Q1 2017 Q2 2017 Q3 2017 Q4 2017 2018 ff Transition and synergies Day 1 Leadership Summit Joint operating mod
Slide 18: Huber Silica integration status
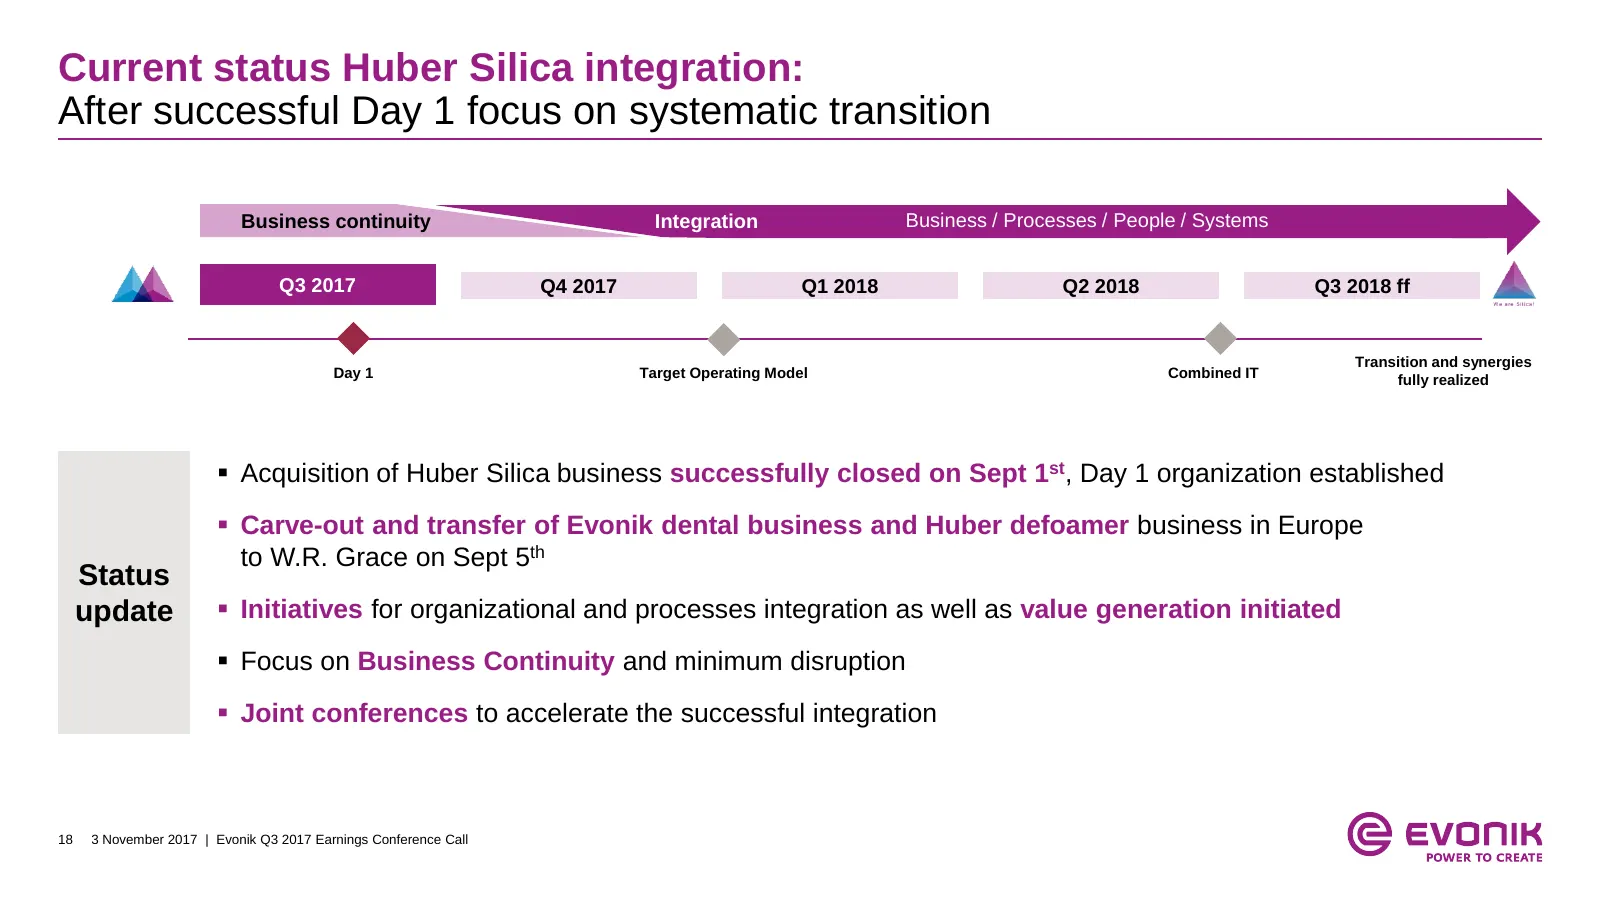
Current status Huber Silica integration: After successful Day 1 focus on systematic transition Business continuity Integration Business / Processes / People / Systems Q3 2017 Q4 2017 Q1 2018 Q2 2018 Q3 2018 ff Transition and synergies Day 1 Target Operating Model Combined IT fully realized Acquisi
Slide 19: Implementation schedule for acquisition synergies
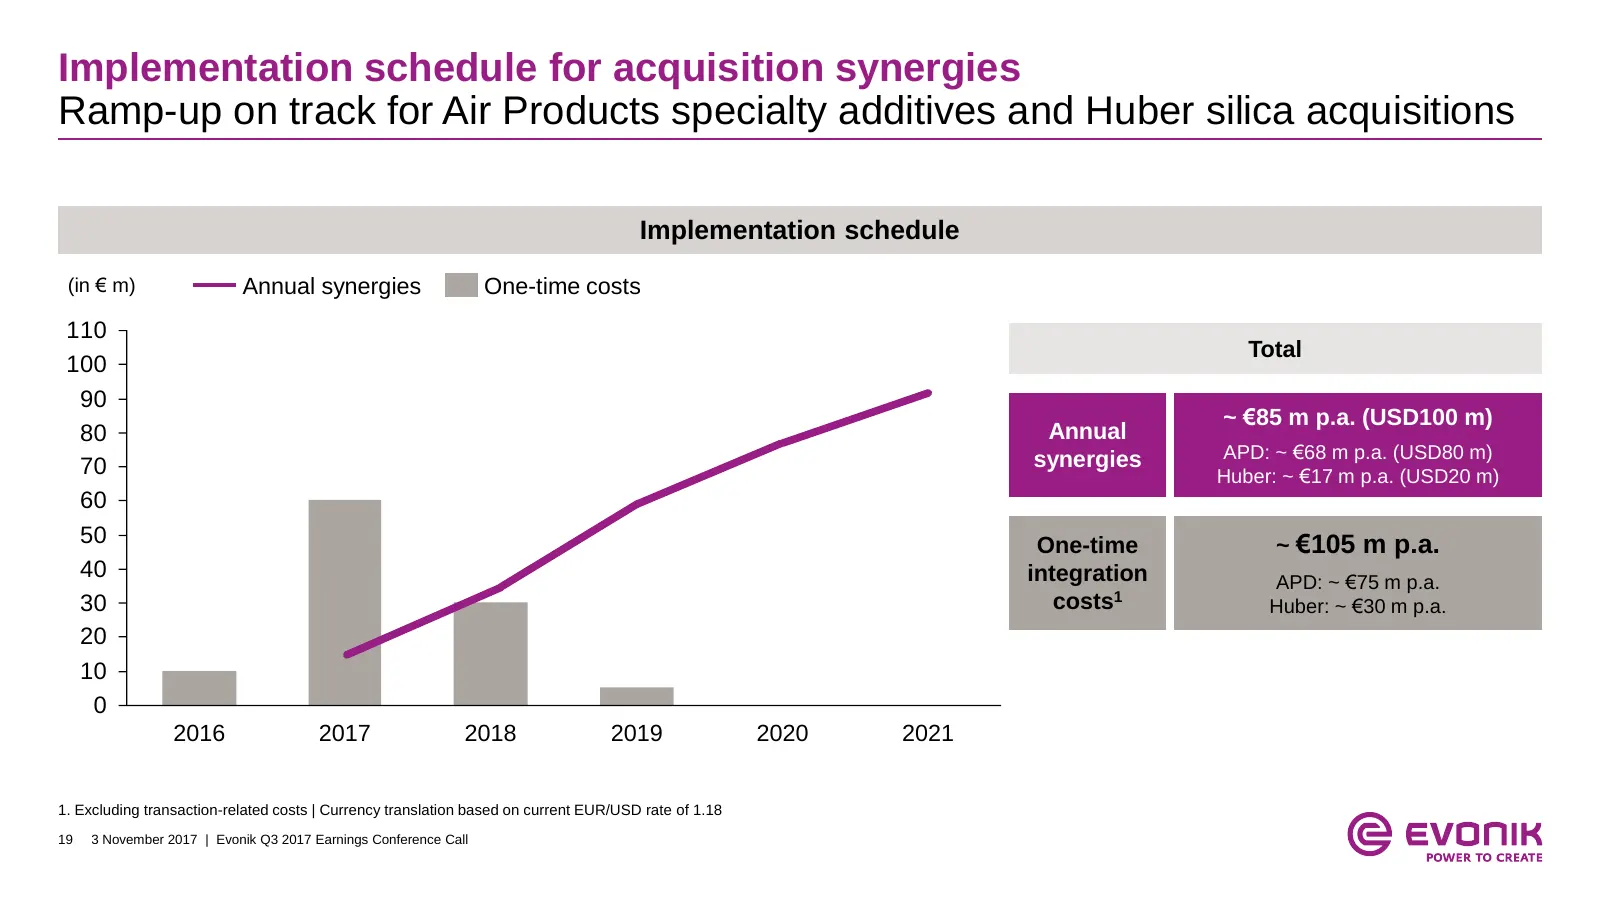
Implementation schedule for acquisition synergies Ramp-up on track for Air Products specialty additives and Huber silica acquisitions Implementation schedule (in € m) Annual synergies One-time costs 110 Total 100 90 ~ €85 m p.a. (USD100 m) 80 Annual synergies APD: ~ €68 m p.a. (USD80 m) 70 Huber: ~
Slide 20: Resource Efficiency Q3 2017 Business Line comments
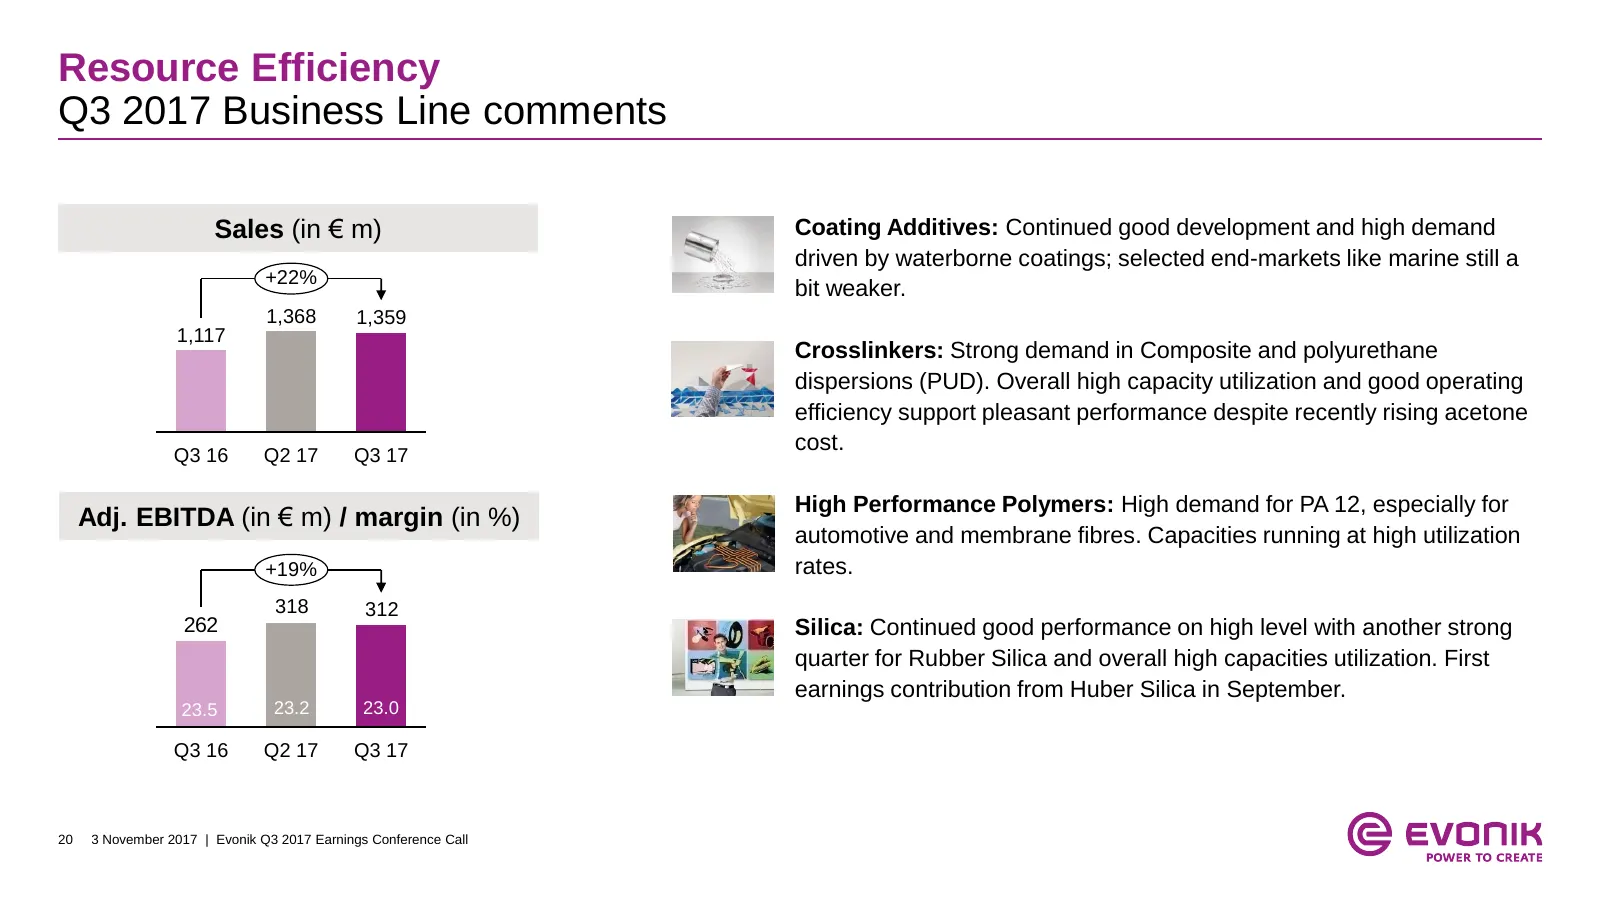
Resource Efficiency Q3 2017 Business Line comments Sales (in € m) Coating Additives: Continued good development and high demand driven by waterborne coatings; selected end-markets like marine still a +22% bit weaker. 1,368 1,359 1,117 Crosslinkers: Strong demand in Composite and polyurethane dispers
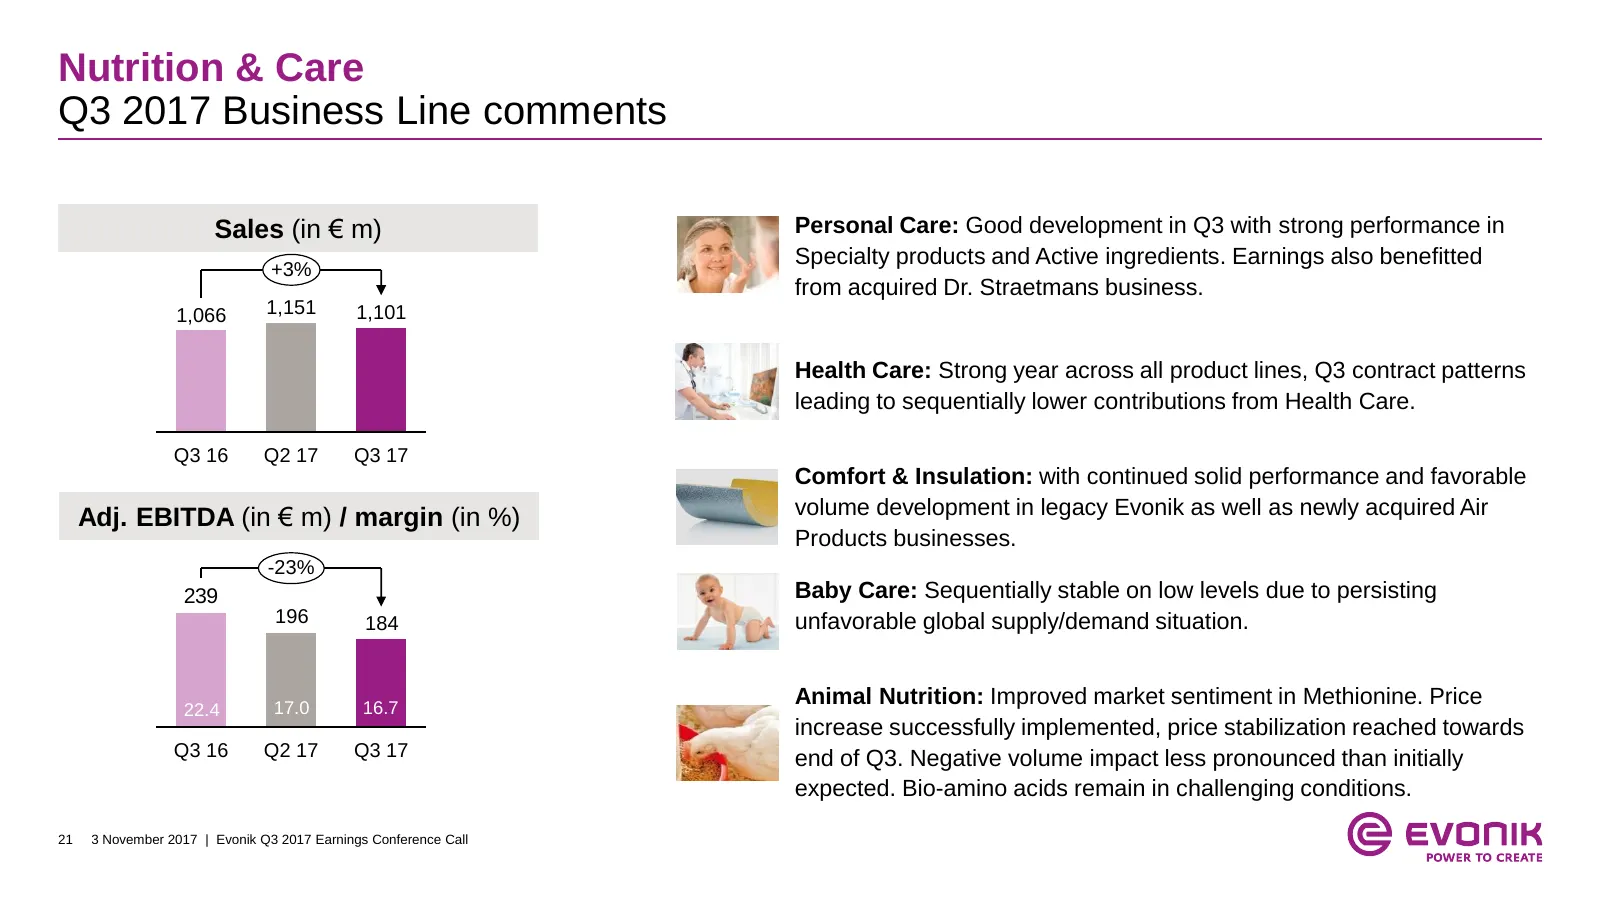
Slide 21: Nutrition & Care Q3 2017 Business Line comments
Nutrition & Care Q3 2017 Business Line comments Sales (in € m) Personal Care: Good development in Q3 with strong performance in +3% Specialty products and Active ingredients. Earnings also benefitted from acquired Dr. Straetmans business. 1,066 1,151 1,101 Health Care: Strong year across all product
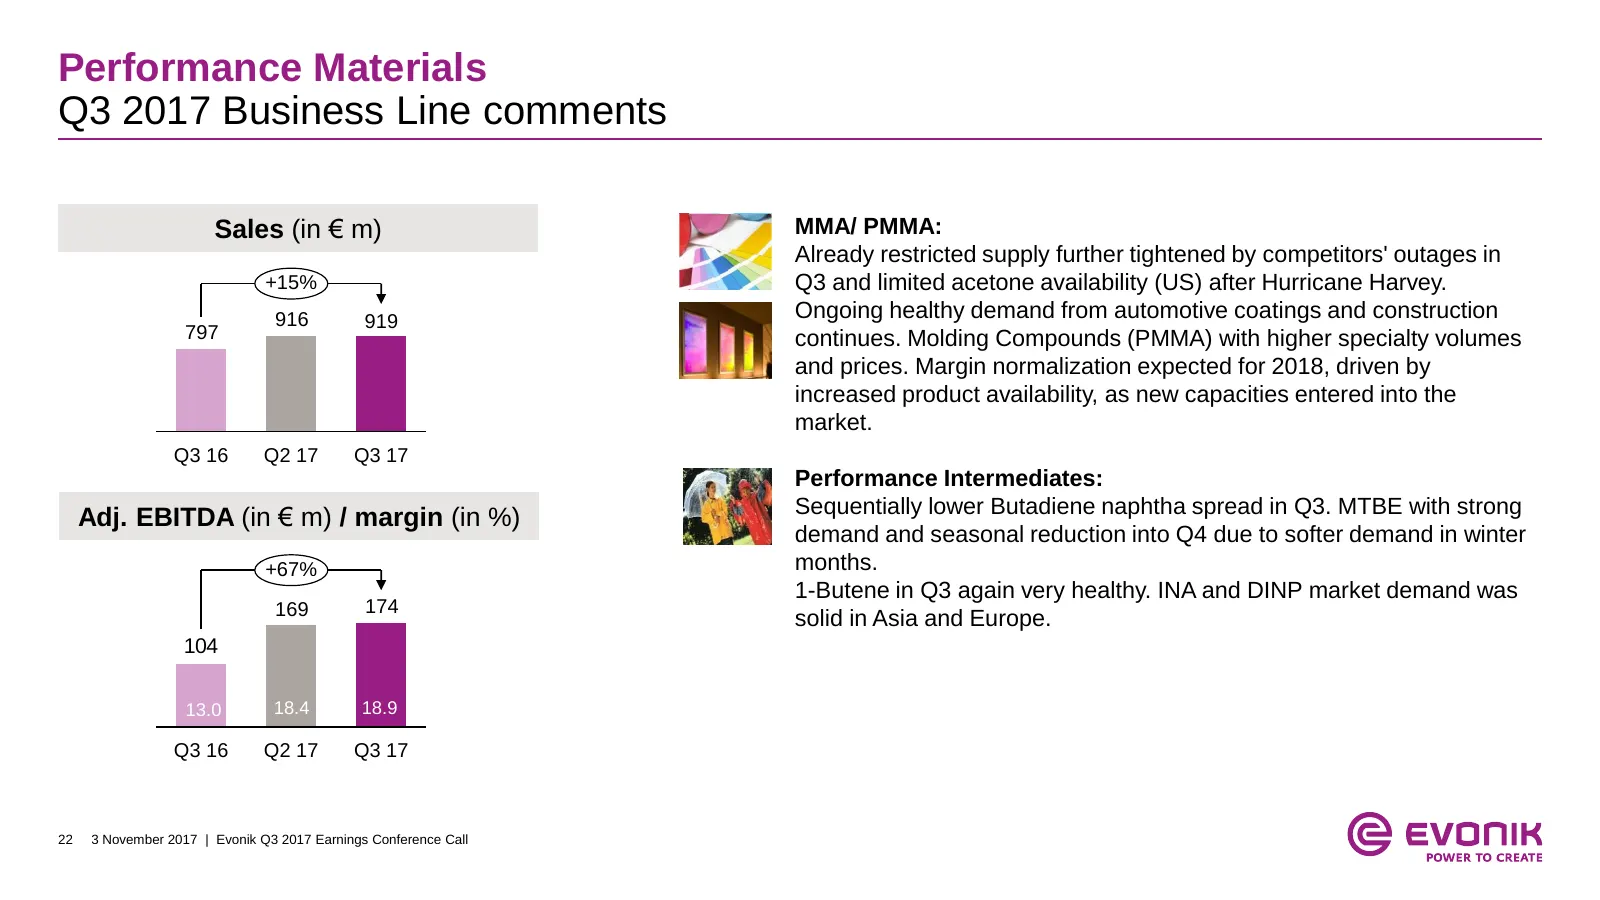
Slide 22: Performance Materials Q3 2017 Business Line comments
Performance Materials Q3 2017 Business Line comments Sales (in € m) MMA/ PMMA: Already restricted supply further tightened by competitors' outages in +15% Q3 and limited acetone availability (US) after Hurricane Harvey. 916 919 Ongoing healthy demand from automotive coatings and construction 797 con
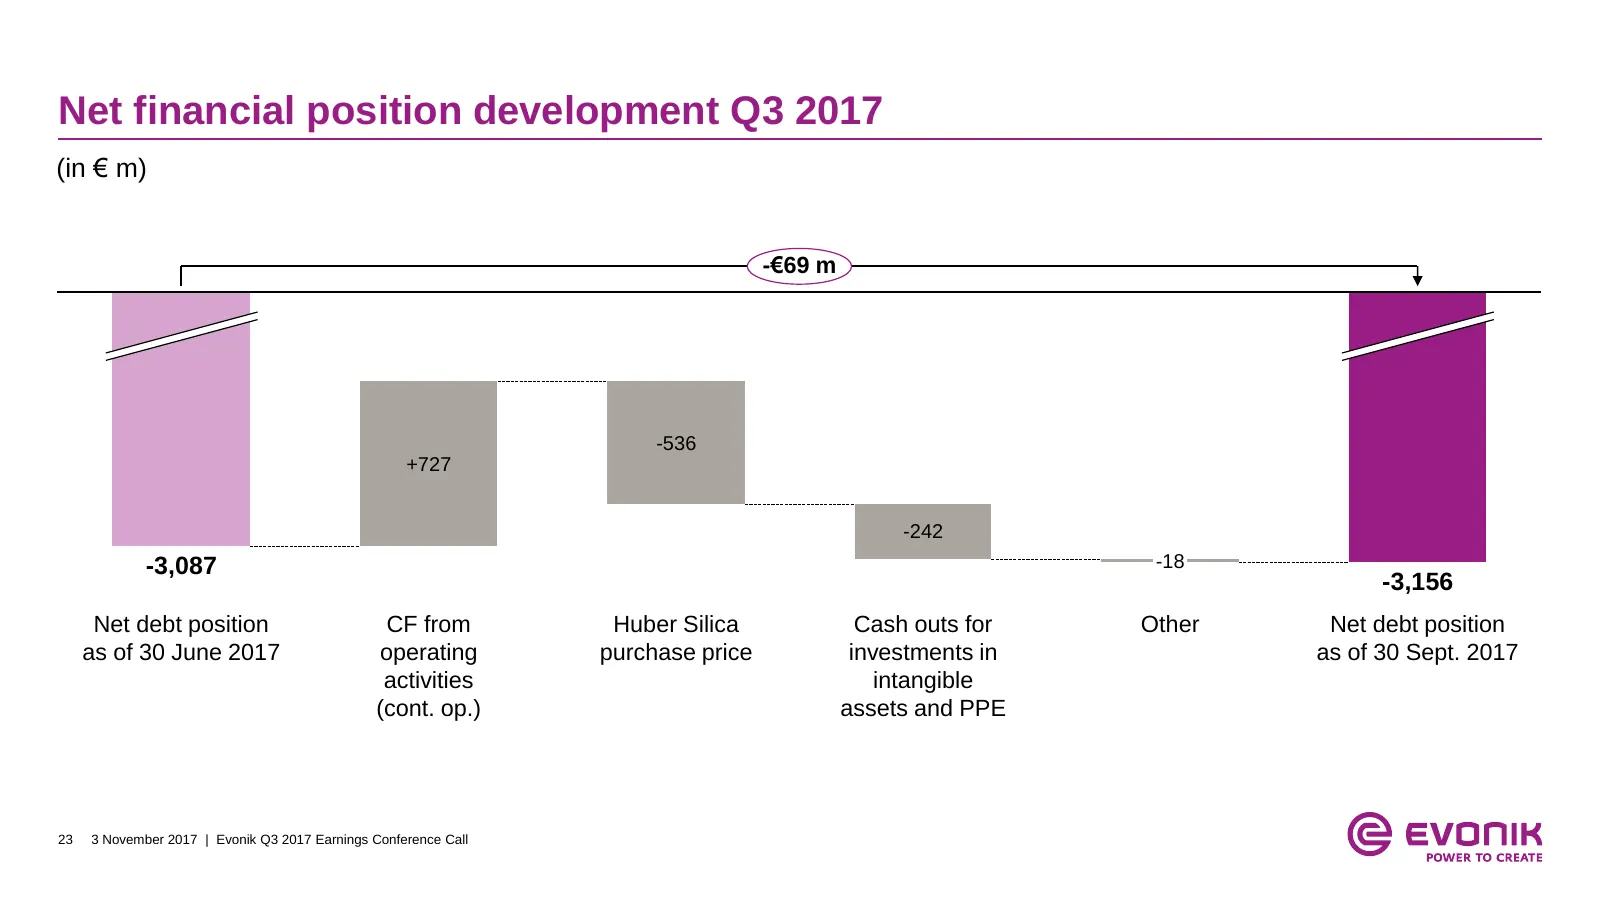
Slide 23: Net financial position development Q3 2017
Net financial position development Q3 2017 (in € m) -€69 m -536 +727 -242 -3,087 -18 -3,156 Net debt position CF from Huber Silica Cash outs for Other Net debt position as of 30 June 2017 operating purchase price investments in as of 30 Sept. 2017 activities intangible (cont. op.) assets and PPE 23
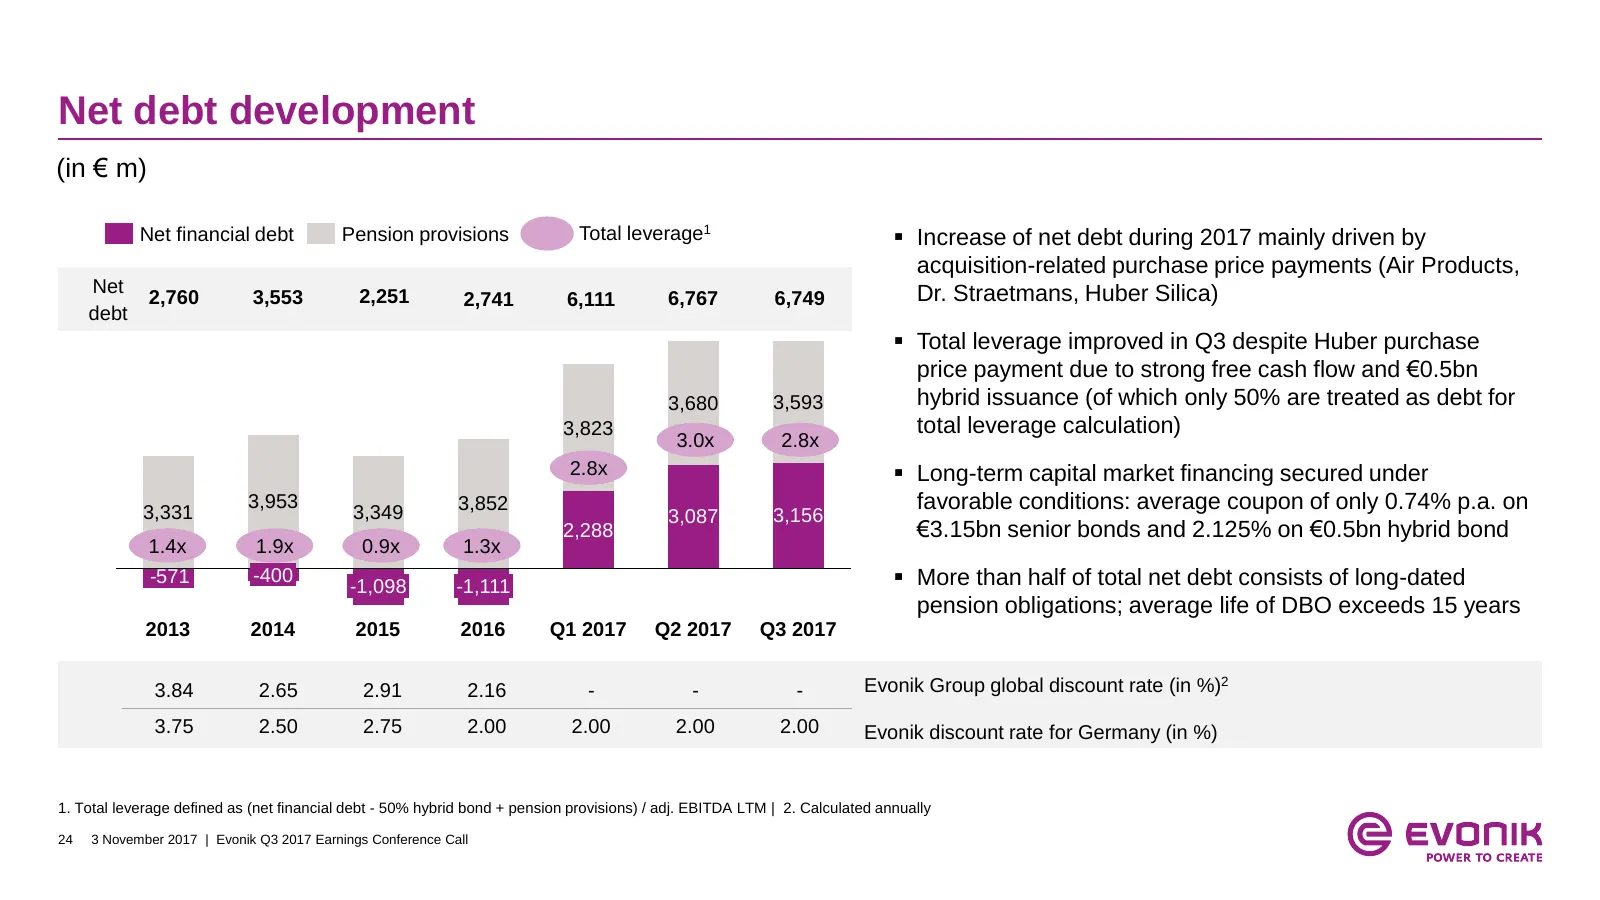
Slide 24: Net debt development
Net debt development (in € m) Net financial debt Pension provisions Total leverage1 Increase of net debt during 2017 mainly driven by acquisition-related purchase price payments (Air Products, Net 2,251 Dr. Straetmans, Huber Silica) 2,760 3,553 2,741 6,111 6,767 6,749 debt Total leverage improve
Slide 25: Adjusted income statement Q3 2017
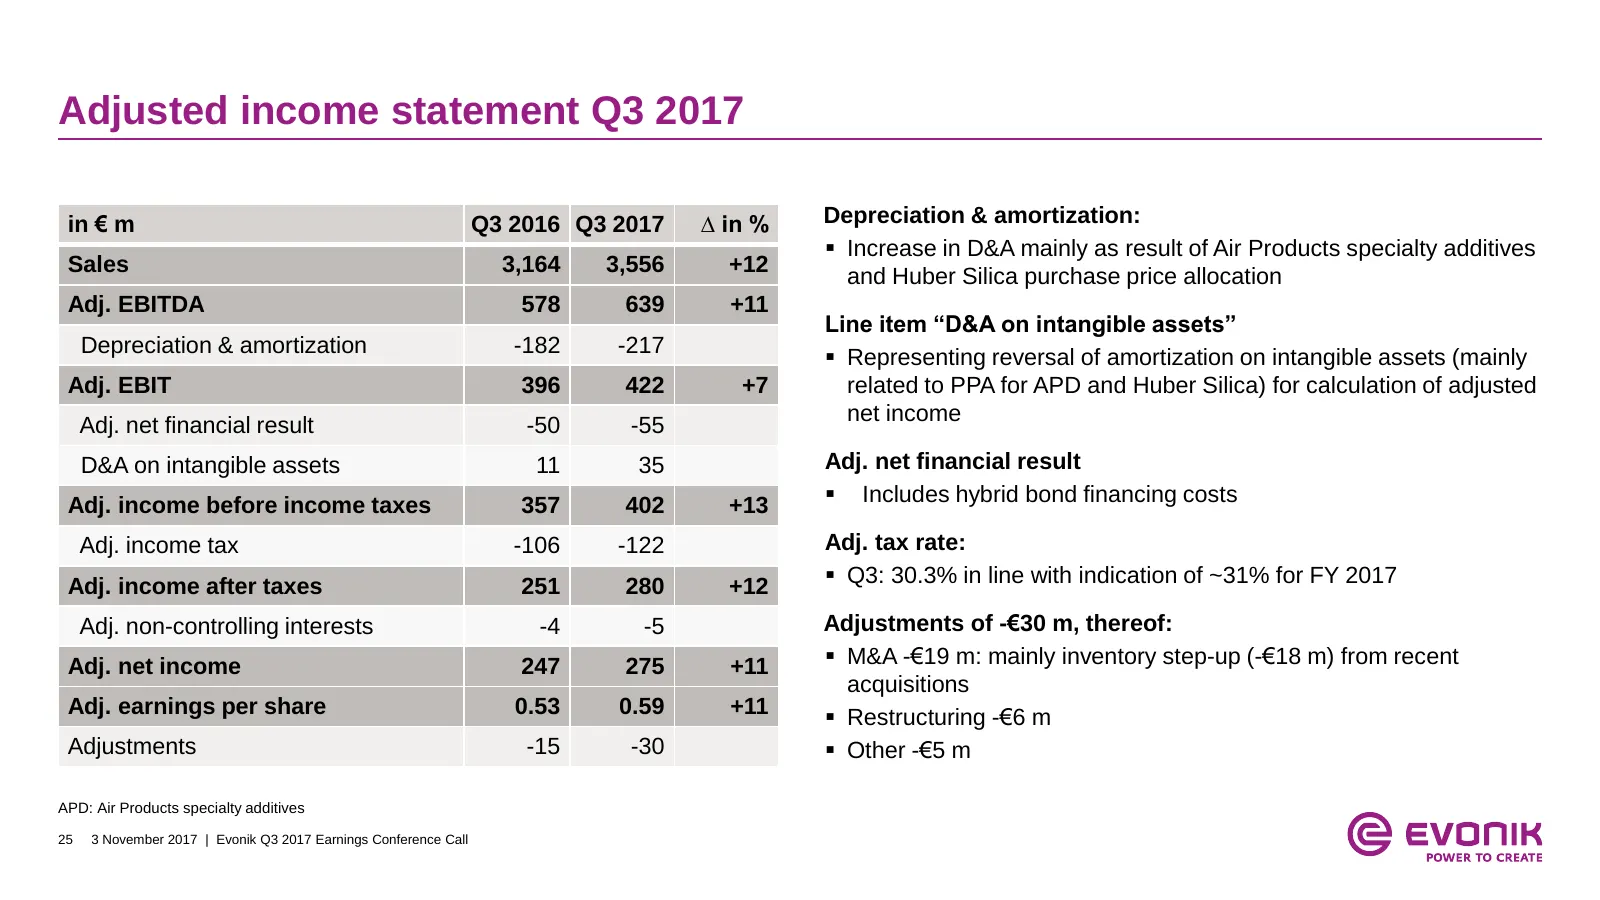
Adjusted income statement Q3 2017 in € m Q3 2016 Q3 2017 ∆ in % Depreciation & amortization: Increase in D&A mainly as result of Air Products specialty additives Sales 3,164 3,556 +12 and Huber Silica purchase price allocation Adj. EBITDA 578 639 +11 Line item “D&A on intangible assets” Depreciati
Slide 26: Cash flow statement Q3 2017
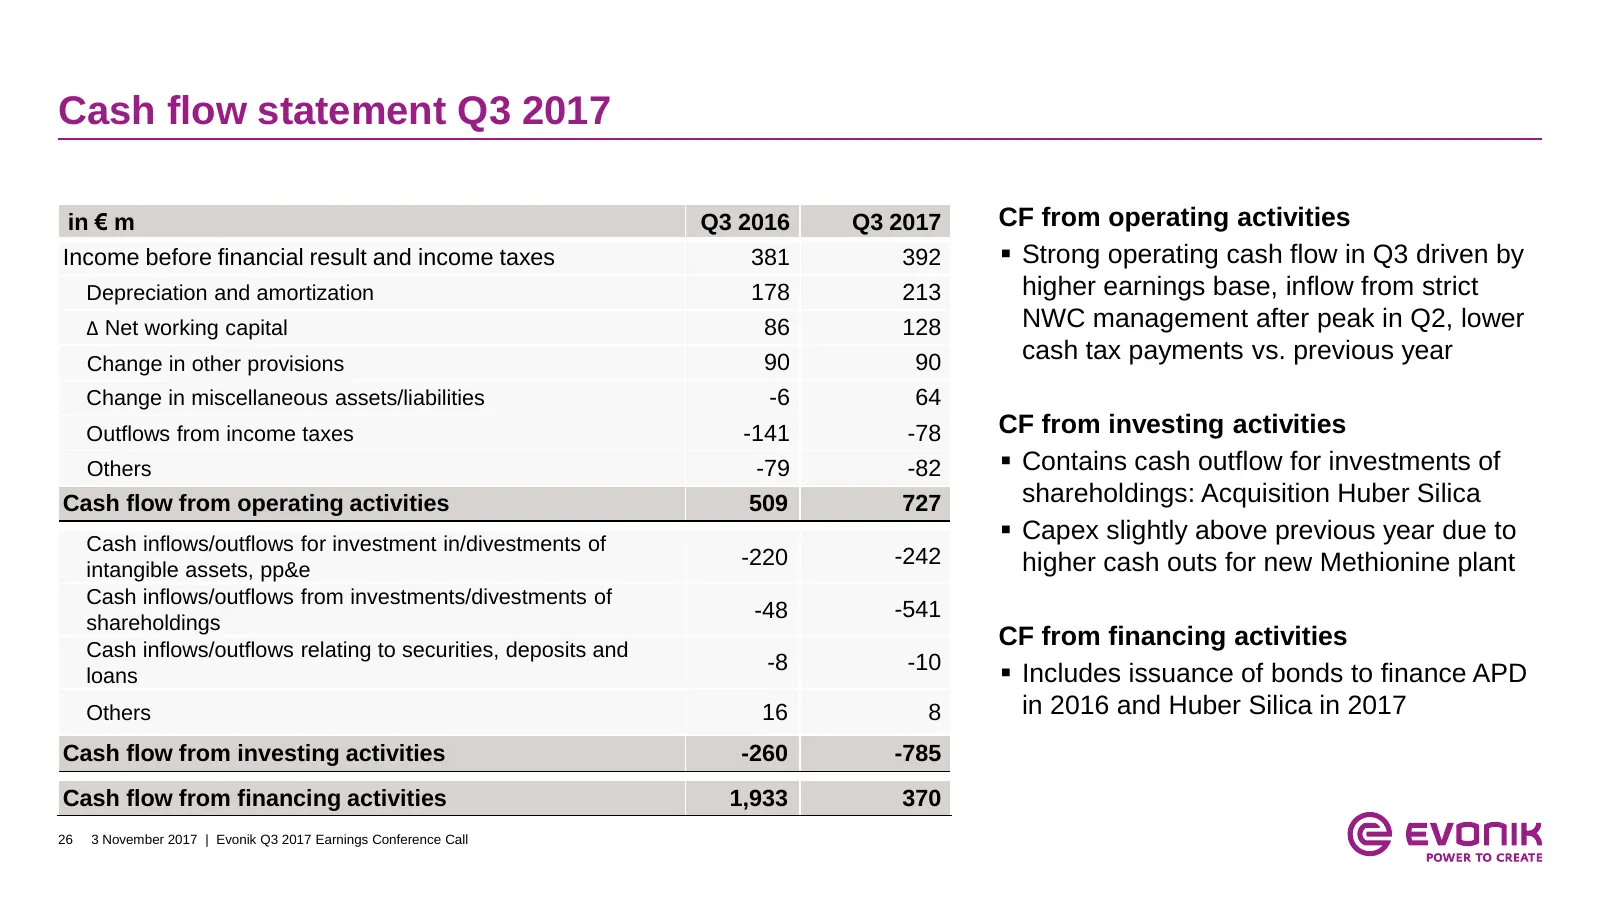
Cash flow statement Q3 2017 in € m Q3 2016 Q3 2017 CF from operating activities Income before financial result and income taxes 381 392 Strong operating cash flow in Q3 driven by Depreciation and amortization 178 213 higher earnings base, inflow from strict ∆ Net working capital 86 128 NWC managem
Slide 27: Segment overview by quarter
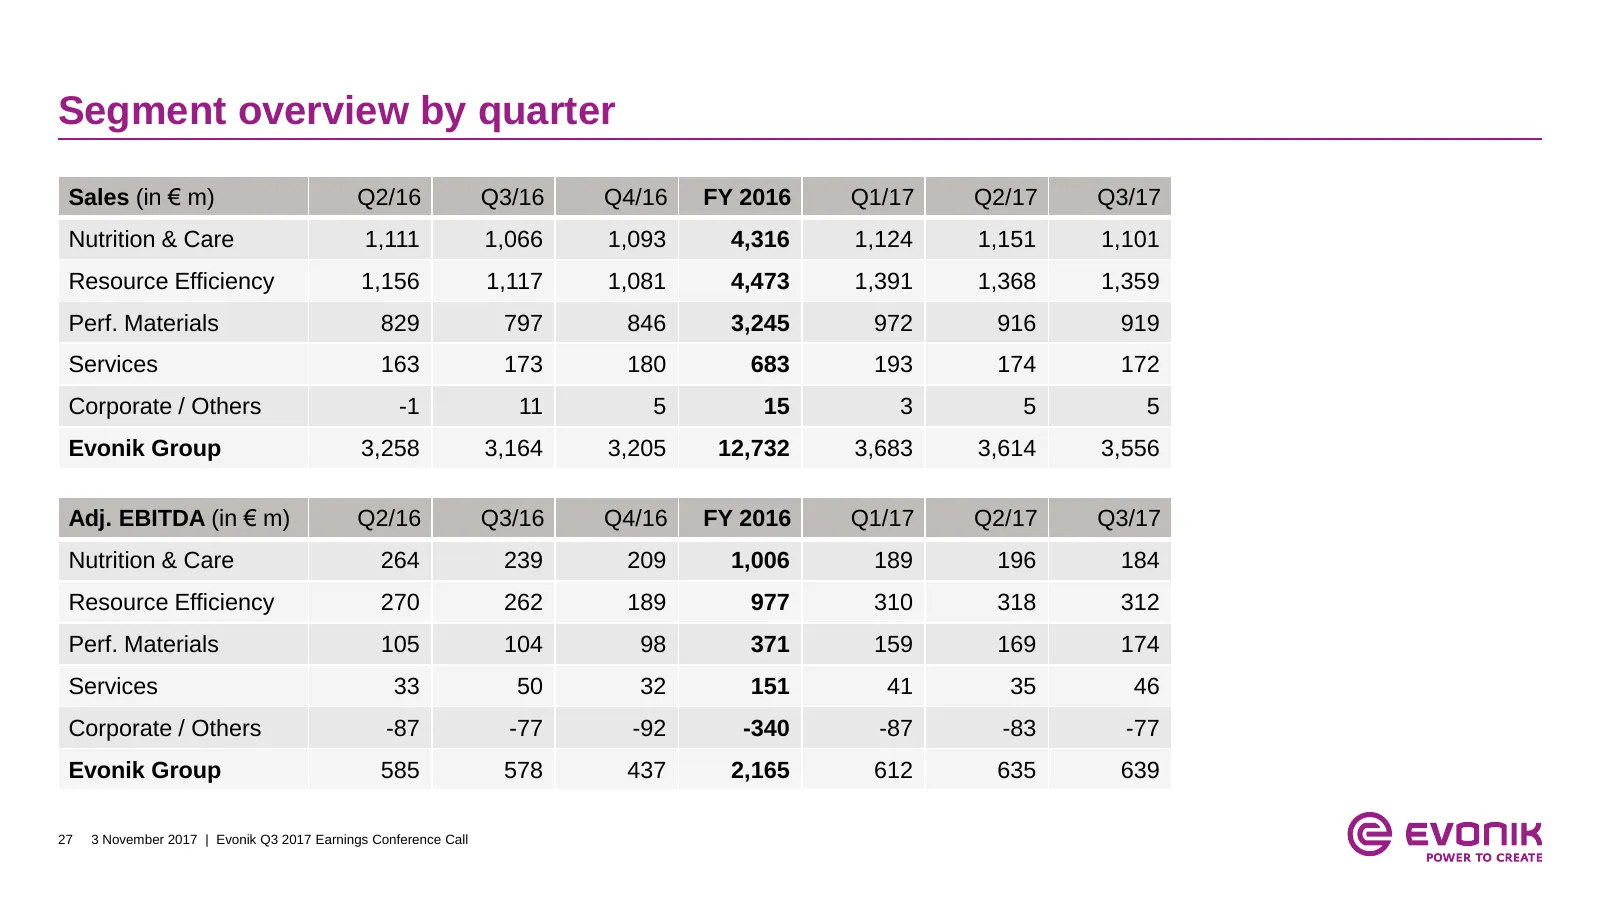
Segment overview by quarter Sales (in € m) Q2/16 Q3/16 Q4/16 FY 2016 Q1/17 Q2/17 Q3/17 Nutrition & Care 1,111 1,066 1,093 4,316 1,124 1,151 1,101 Resource Efficiency 1,156 1,117 1,081 4,473 1,391 1,368 1,359 Perf. Materials 829 797 846 3,245 972 916 919 Services 163 173 180 683 193 174 172 Corporate
Slide 28: Upcoming IR events
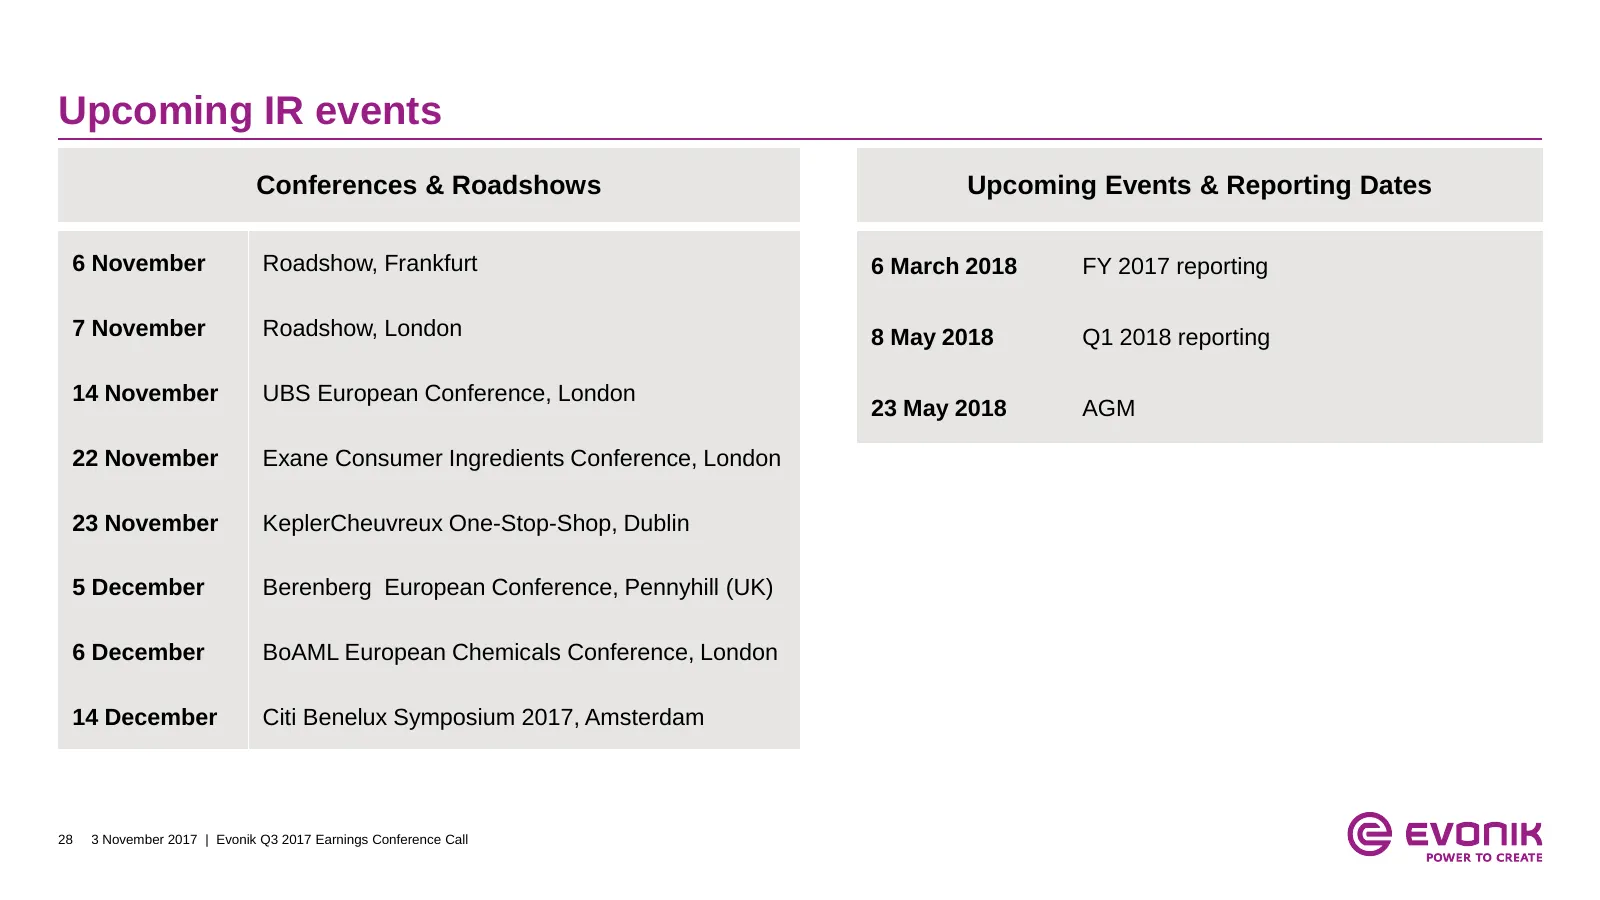
Upcoming IR events Conferences & Roadshows Upcoming Events & Reporting Dates 6 November Roadshow, Frankfurt 6 March 2018 FY 2017 reporting 7 November Roadshow, London 8 May 2018 Q1 2018 reporting 14 November UBS European Conference, London 23 May 2018 AGM 22 November Exane Consumer Ingredients Confe
Slide 29: Evonik Investor Relations team
Evonik Investor Relations team Tim Lange Janine Kanotowsky Head of Investor Relations Team Assistant +49 201 177 3150 +49 201 177 3146 tim.lange@evonik.com janine.kanotowsky@evonik.com Eva Frerker Daniel Györy Kai Kirchhoff Investor Relations Manager Investor Relations Manager Investor Relations Man
Slide 30: Disclaimer
Disclaimer In so far as forecasts or expectations are expressed in this presentation or where our statements concern the future, these forecasts, expectations or statements may involve known or unknown risks and uncertainties. Actual results or developments may vary, depending on changes in the oper
Slide 31: © evonik
© evonik
Source: Internet Archive copy of corporate.evonik.de
More decks from Evonik Industries AG
 Q3 2026 Earnings Presentation34 slides · Nov 3, 2026
 Q2 2026 Earnings Presentation27 slides · Aug 4, 2026
 Q2 2026 Earnings Presentation39 slides · August 2026
 Q1 2026 Earnings Presentation26 slides · May 8, 2026
 Q4 2025 Earnings Presentation44 slides · Feb 5, 2026
 Q3 2025 Earnings Presentation35 slides · Nov 4, 2025