American Railcar Industries Inc
American Railcar Industries — Q1 2014 Earnings Presentation
30 slides from American Railcar Industries's earnings presentation, May 8, 2014
Slide 1: American Railcar Industries, Inc.
Slide 2: Forward Looking Disclaimer
Forward Looking Disclaimer ‘Safe Harbor Statement id backl growth lati The payment of if 1d the thereof, Strategic pl financial it cable | ifany, Le. health, safet otherwise.
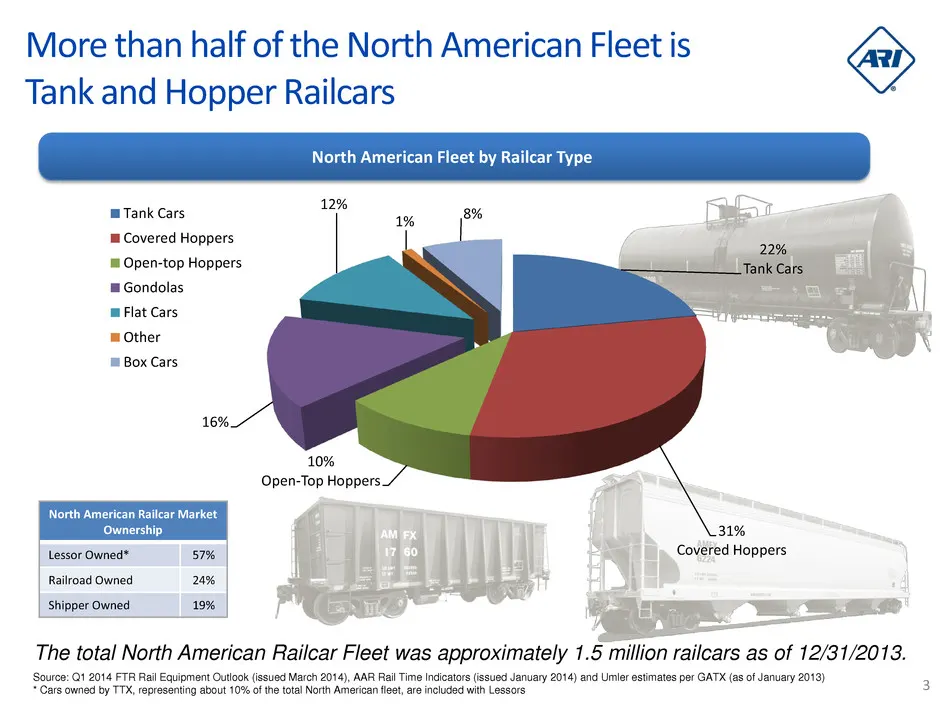
Slide 3: More than half of the North American Fleet is Tank and Hopper Railcars
More than half of the North American Fleet is & Tank and Hopper Railcars North American Fleet by Railcar Type mi Tank Cars m Covered Hoppers Open-top Hoppers ™ Gondolas m Flat Cars m Other = Box Cars North American Railcar Market hi 31% Lessor Owned* 57% Covered Hoppers Railroad Owned Shipper Owned
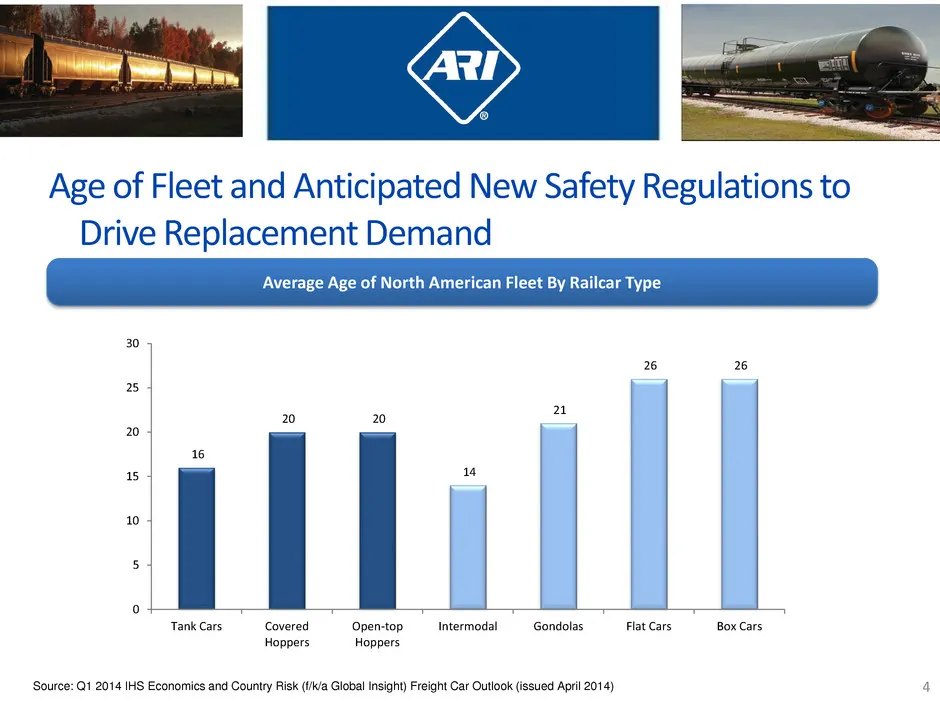
Slide 4: Age of Fleet and Anticipated New Safety Regulations to Drive Replacement Demand
Age of Fleet and Anticipated New Safety Regulations to Drive Replacement Demand 30 25 | 20 26 26 20 20 = 16 1s 4 10 | | 5 ° — Tank Cars Covered Open-top Intermodal ~—-Gondolas. Flat Cars Box Cars Hoppers Hoppers Average Age of North American Fleet By Railcar Type Source: Q1 i q
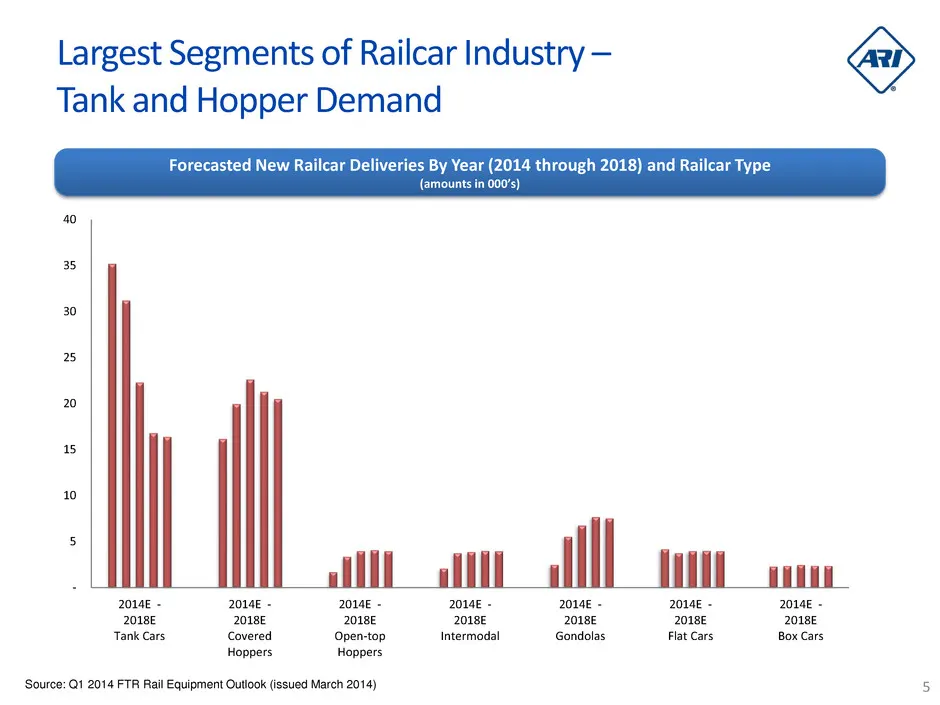
Slide 5: Largest Segments of Railcar Industry — Tank and Hopper Demand
Largest Segments of Railcar Industry — Tank and Hopper Demand Forecasted New Railcar Deliveries By Year (2014 through 2018) and Railcar Type (amount: s) 40 35 30 25 20 15 10 5 2014 - 2014 - 2014 - 20148 - 2014 2014 - 2018 2018 2018 20186 2018 2018 Tank Cars Covered Open-top Intermodal Gondolas Flat
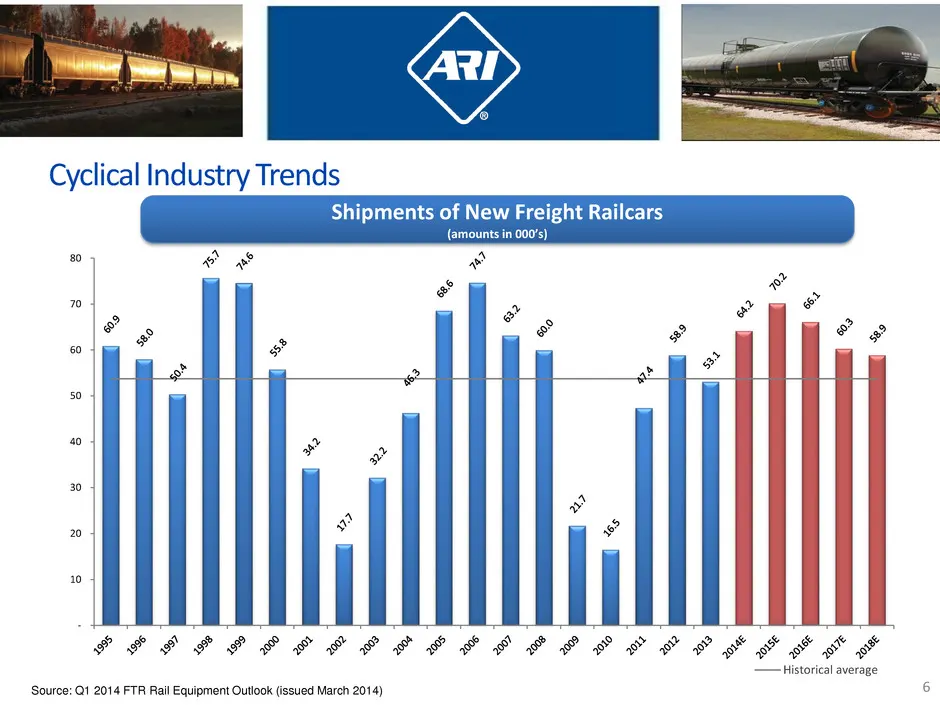
Slide 6: FES FLIES EEL E ES IFES PSP SS SS SK
FES FLIES EEL E ES IFES PSP SS SS SK — historical average Source: Qt 2014 FTR Rall Equipment Outlook (issued March 2014) 6
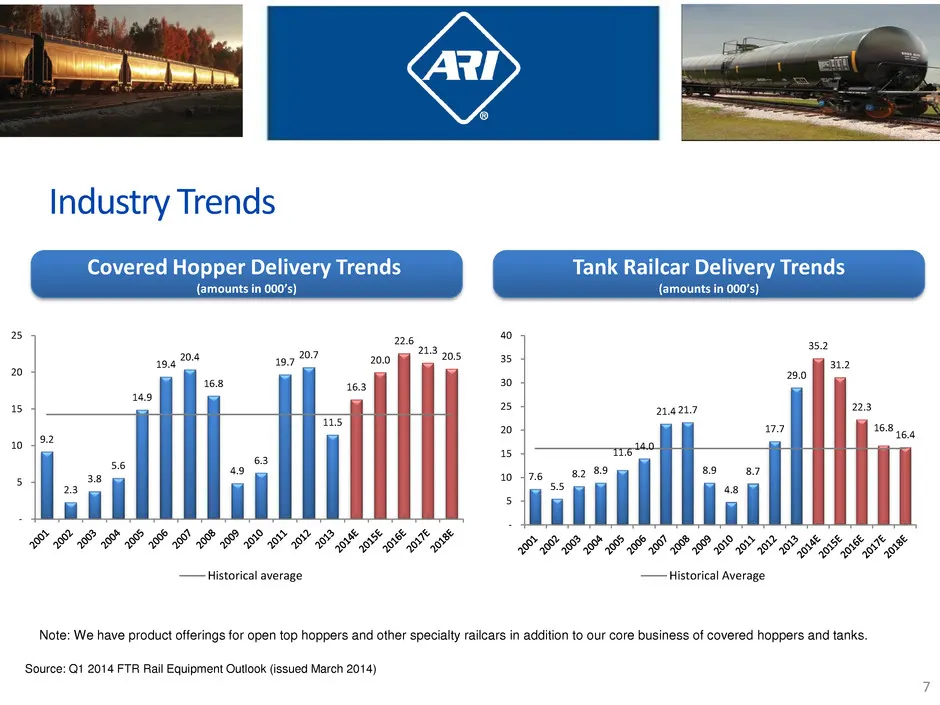
Slide 7: Industry Trends
Industry Trends Covered Hopper Delivery Trends Tank Railcar Delivery Trends {amounts in 000’s) (amounts in 000’s) Se ae Maly SPE ELESE SES Se eas Ssh FESS LES LLL PS Ss SS Ss — Historical average — Historical Average Note: per spe ly dition t 1d tanks ‘Source: Q1 2014 FTR Rail Equipment Outlook issu
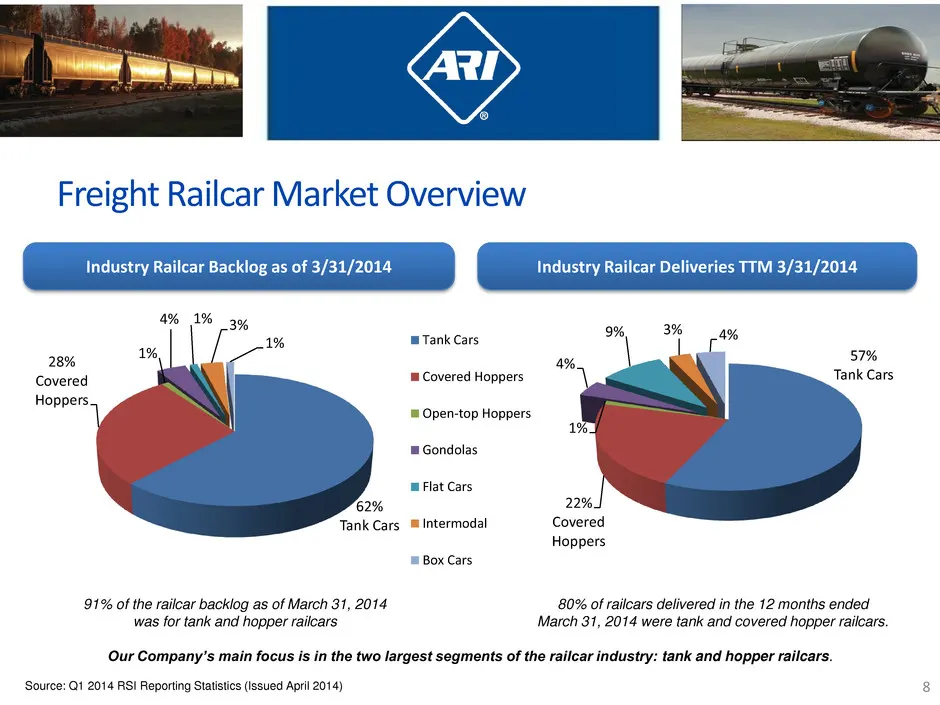
Slide 8: Freight Railcar Market Overview
Freight Railcar Market Overview Industry Railcar Backlog as of 3/31/2014 Industry Railcar Deliveries TTM 3/31/2014 4% 1% 3% % Tank Cars 5% 28% 4%, abs overall Covered Hoppers Tank Cars Hoppers. = Open-top Hoppers Gondolas ‘Flat Cars 2% 22%, Tank Cars ® Intermodal Covered Hoppers Box Cars 91% of | pe
Slide 9: ARI Key Railcar Markets
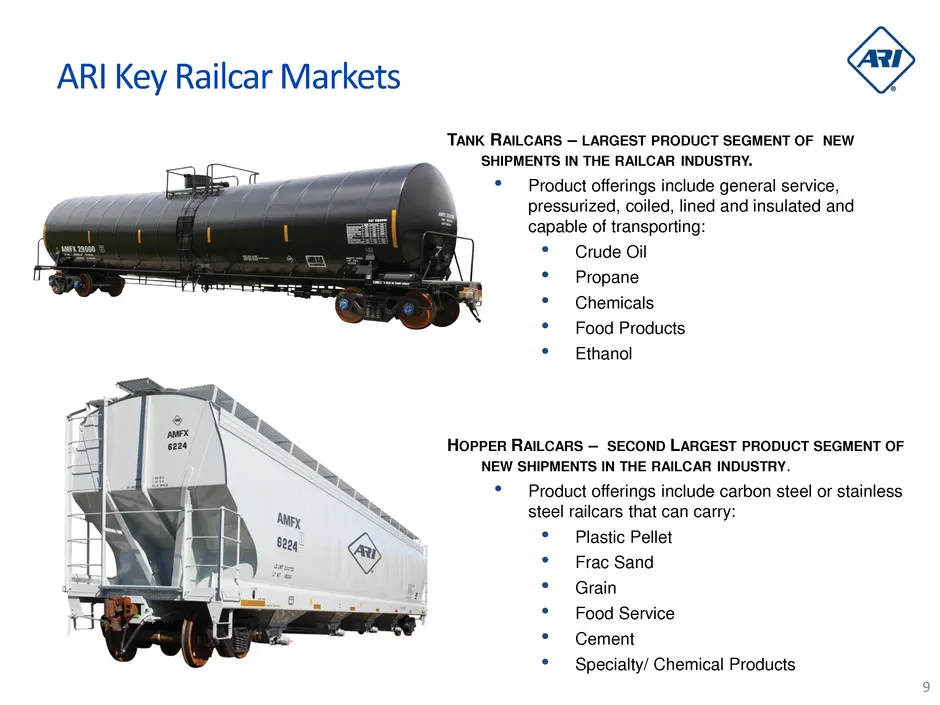
ARI Key Railcar Markets TANK RAILCARS — LARGEST PRODUCT SEGMENT OF NEW SHIPMENTS IN THE RAILCAR INDUSTRY. * Product offerings include general service, pressurized, coiled, ee and insulated and capable of transportin * Crude Oil * Propane * Chemicals * — Food Products * — Ethanol HOPPER RAILCARS — SE
Slide 10: Food (Pressureaide) and Iron Ore Railcars
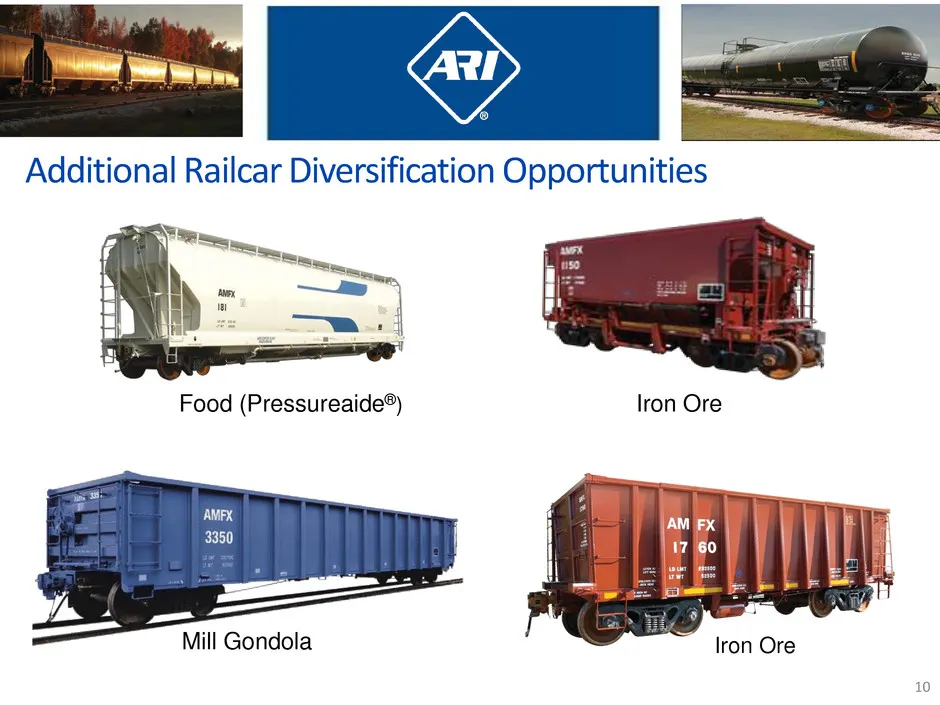
Food (Pressureaide®) lron Ore Iron Ore
Slide 11: ARI Locations
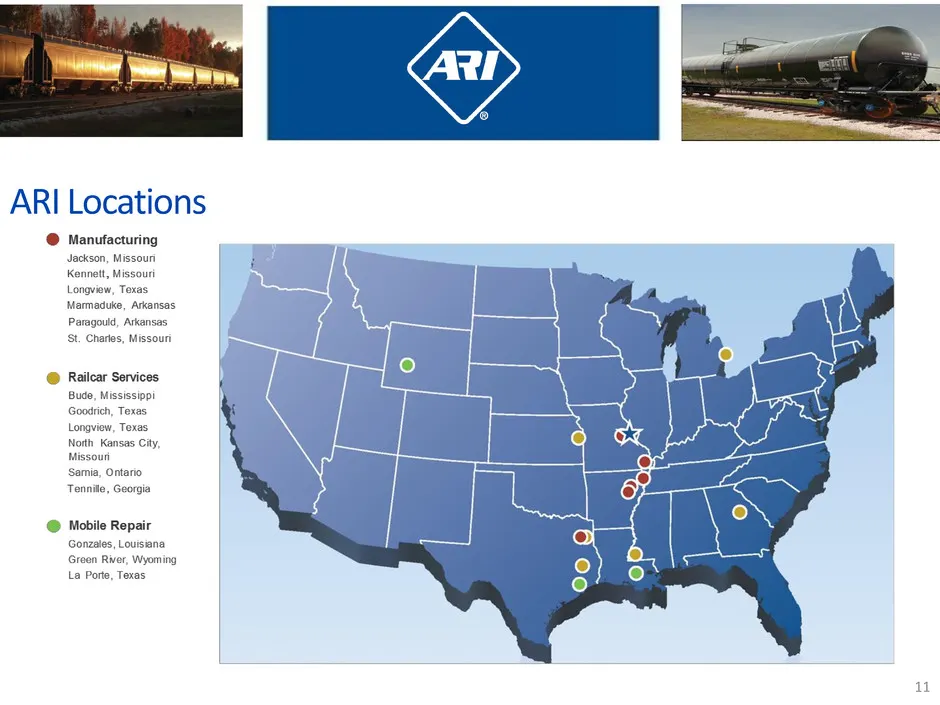
ARI Locations @ Manufacturing Jackson, Missoun Paragould, Arkansas Samia, Ontario Tennile, Georgia @ Mobile Repair Gonzales, Louisiana Green River, Wyoming Porte, Texas
Slide 12: Flexible Manufacturing Plants
Flexible Manufacturing Plants Strategic locations lear customers and major rail lines Flexible and vertically integrated facilities + Produce multiple railcar types with minimal change-over time * Painting/lining capabilities * Rolling mill and fabrication plants * Non-union workforce at railcar man
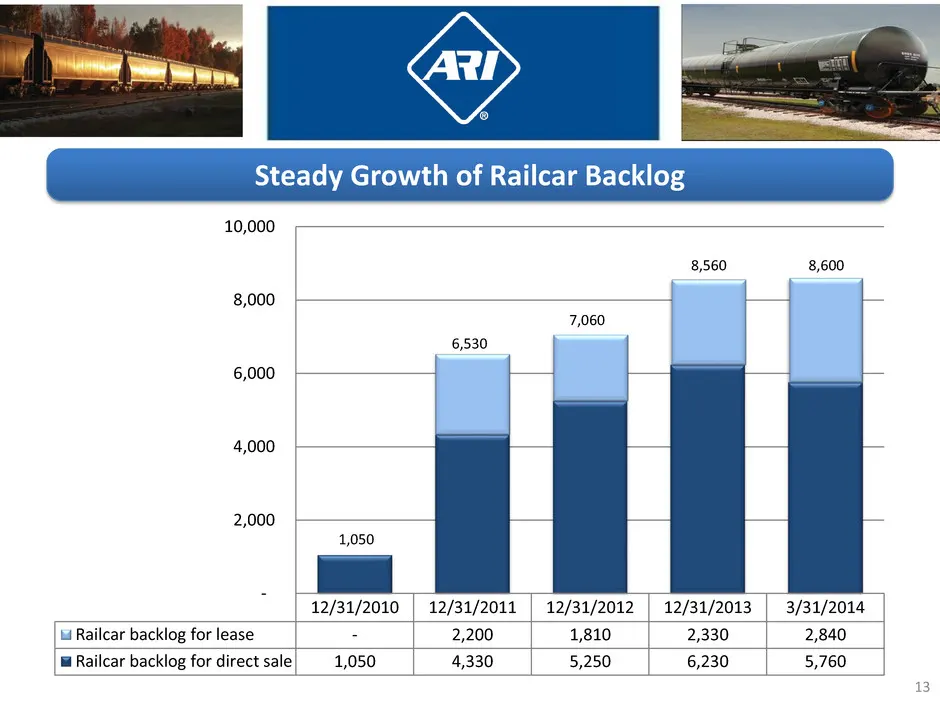
Slide 13: Steady Growth of Railcar Backlog
Steady Growth of Railcar Backlog 10,000 8,560 8,600 8,000 6,000 4,000 2,000 12/31/2010 | 12/31/2011 | 12/31/2012 | 12/31/2013 | 3/31/2014 | tu Railcar backlog for lease - | 2,200 1,810 2,330 | 2,840, wRailcar backlog for direct sale| 1,050 | 4,330—«|~—*5,250 6,230. | 5,760
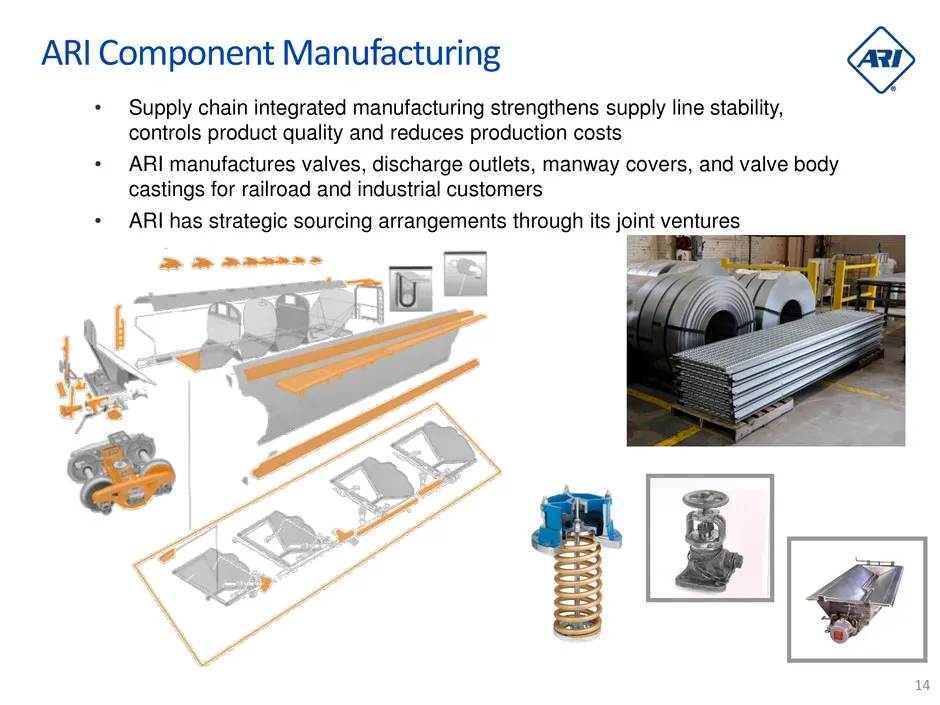
Slide 14: ARI Component Manufacturing
ARI Component Manufacturing Supply chain integrated manufacturing strengthens supply line stability, controls product quality and reduces production costs ARI manufactures valves, discharge outlets, manway covers, and valve body castings for railroad and industrial customers ARI has strategic sourci
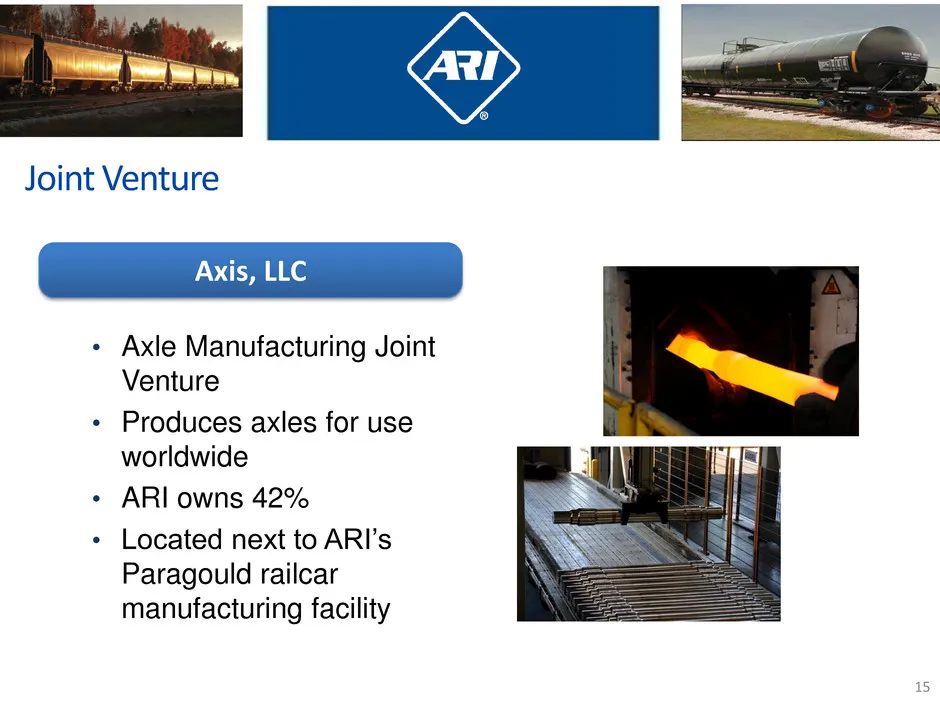
Slide 15: Axle Manufacturing Joint Venture
* Axle Manufacturing Joint + Produces axles for use . - Located next to ARI’s Venture worldwide ARI owns 42% Paragould railcar manufacturing facility
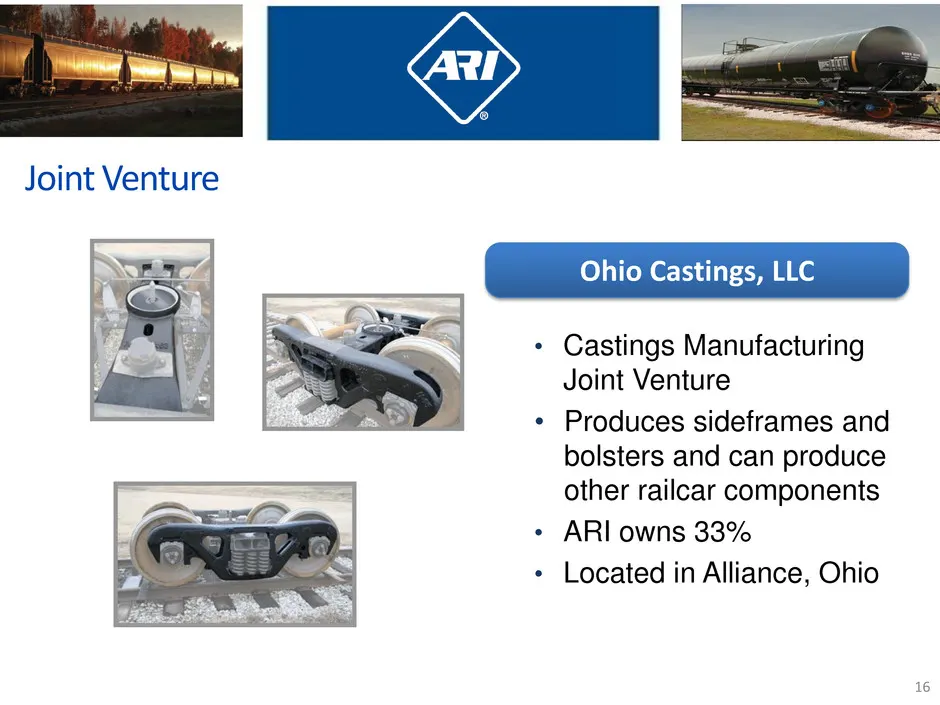
Slide 16: Castings Manufacturing Joint Venture
Joint Venture | SNe iy Castings, LLC Castings Manufacturing Joint Venture Produces sideframes and bolsters and can produce other railcar components ARI owns 33% Located in Alliance, Ohio
Slide 17: Railcar Lease Fleet
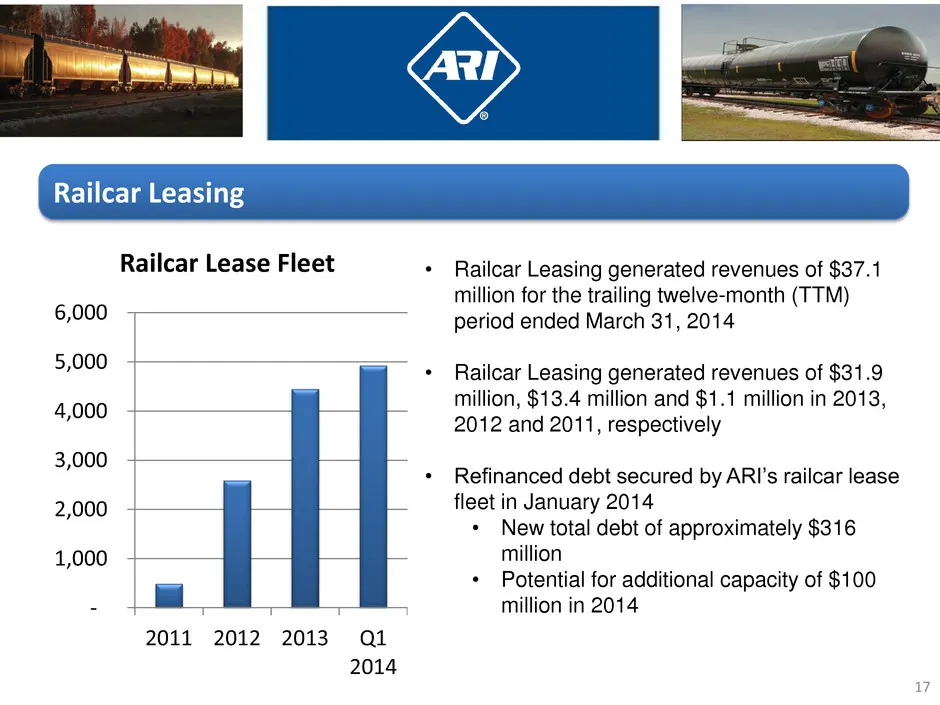
Railcar Lease Fleet 2011 2012 2013 Q 2014 Railcar Leasing generated revenues of $37.1 million for the trailing twelve-month (TTM) period ended March 31, 2014 Railcar Leasing generated revenues of $31.9 million, $13.4 million and $1.1 million in 2013, 2012 and 2011, respectively Refinanced debt secur
Slide 18: Railcar Services Diversify Revenue
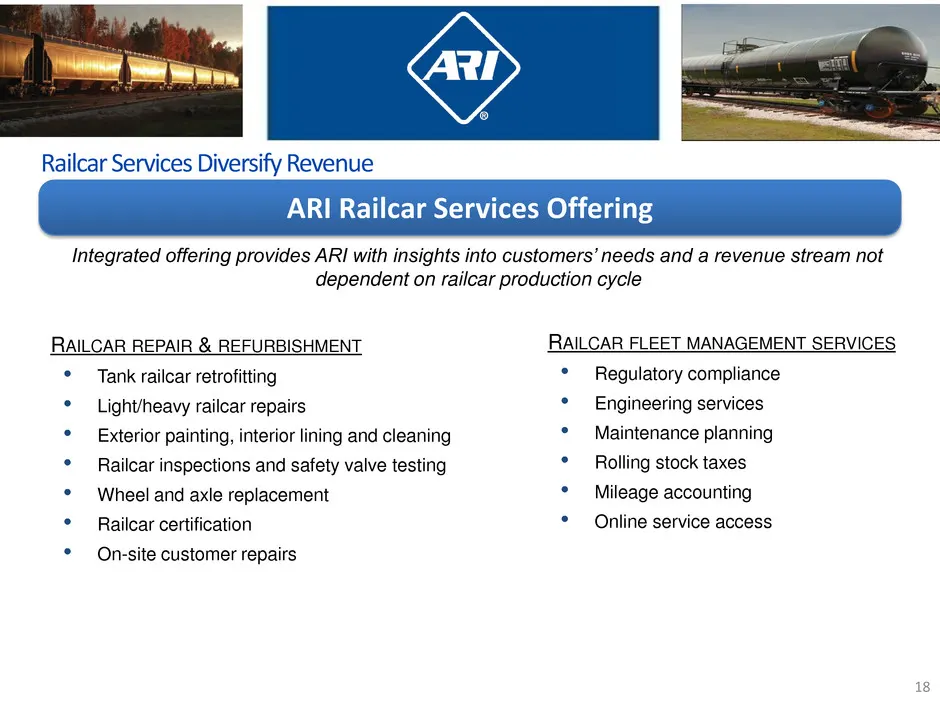
Railcar Services Diversify Revenue ARIR Integrated offering provides ARI with insights into customers’ needs and a revenue stream not dependent on railcar production cycle RAILCAR REPAIR & REFURBISHMENT ° ° ° ° . Tank railcar retrofitting Light/heavy railcar repairs Exterior painting, interior linin
Slide 19: Railcar Services Diversify Revenue
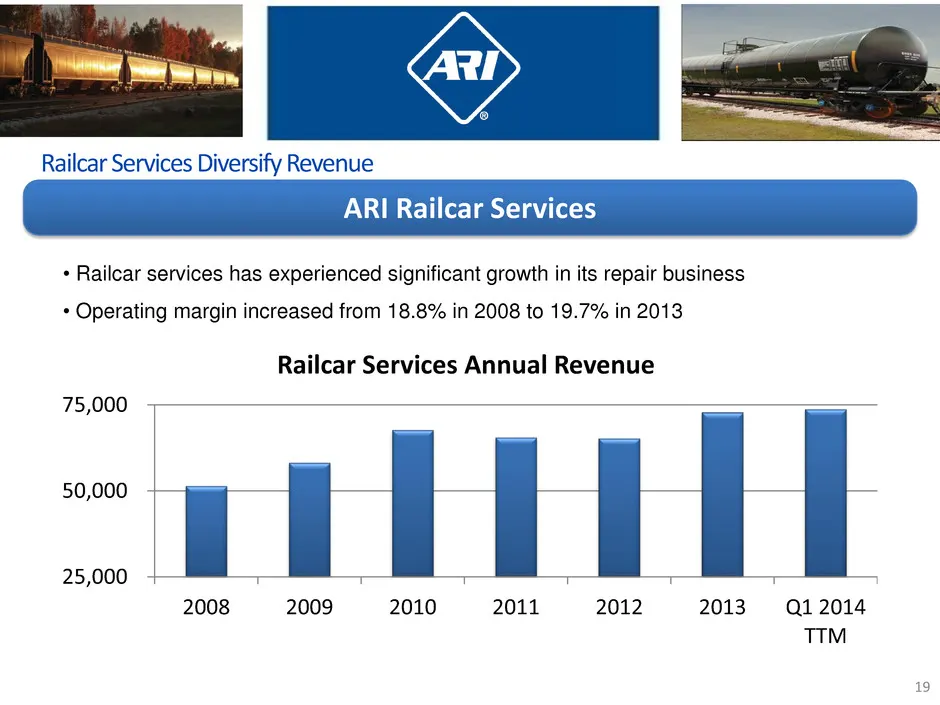
Railcar Services Diversify Revenue + Railcar services has experienced significant growth in its repair business * Operating margin increased from 18.8% in 2008 to 19.7% in 2013 Railcar Services Annual Revenue 75,000 — 50,000 25,000 2008 2009 2010 2011 2012 2013, Q12014 TM
Slide 20: Possible Upgrades for Older DOT-111 Tank Railcars
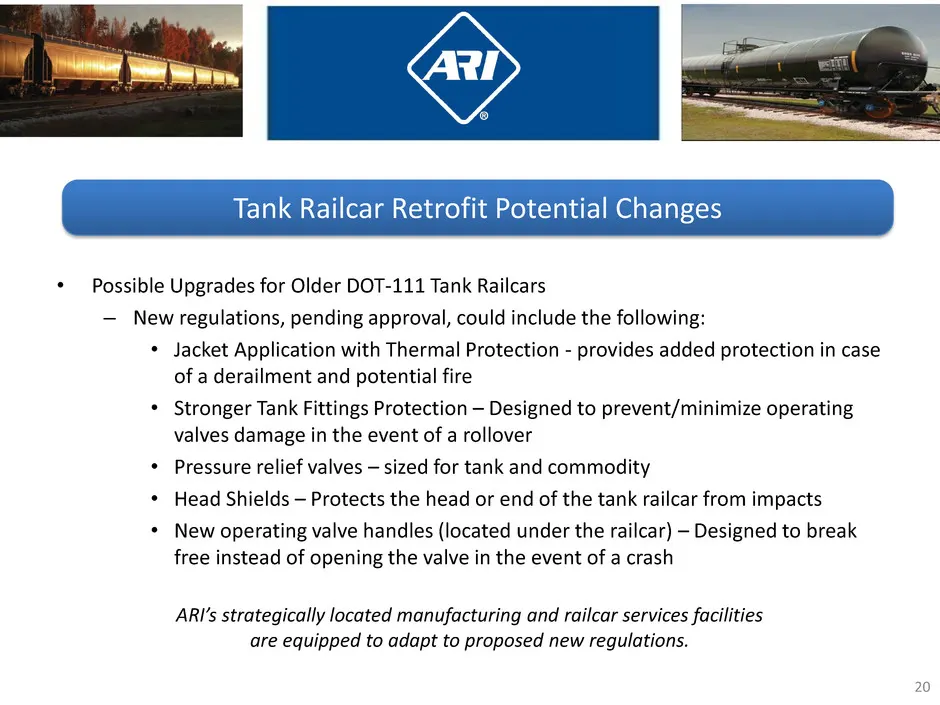
Possible Upgrades for Older DOT-111 Tank Railcars — New regulations, pending approval, could include the following: Jacket Application with Thermal Protection - provides added protection in case of a derailment and potential fire Stronger Tank Fittings Protection — Designed to prevent/minimize opera
Slide 21: Growth History
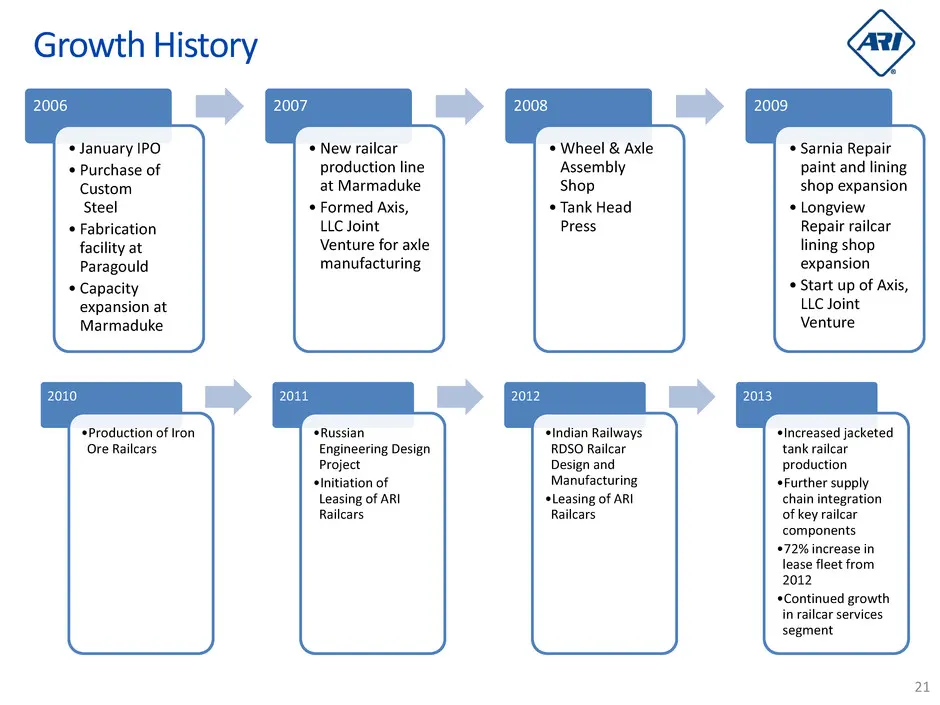
Growth History * January IPO ‘= New railcar + Wheel & Axle * Sarnia Repair Purchase of production tine Assembly paint and lining Custom at Man Shop shop expansion Steel : Fred a + Tank Head * Fabrication Press * Longview LUC Joi Repair railcar Venture for axe lining shop manufacturing Marmaduke *Pro
Slide 22: Major Historical Projects
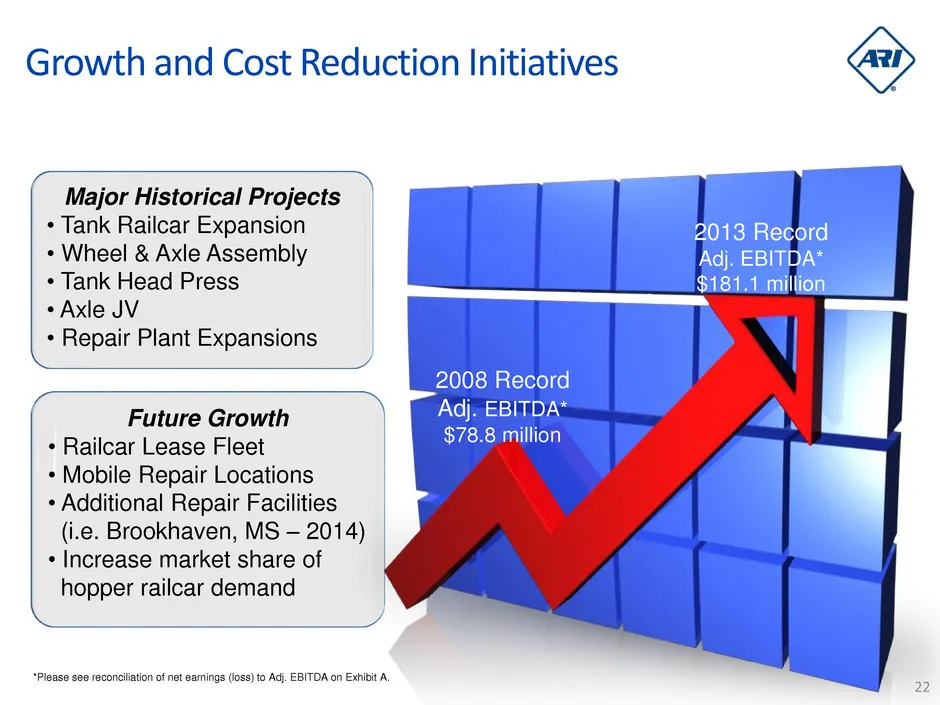
Major Historical Projects + Tank Railcar Expansion + Wheel & Axle Assembly + Tank Head Press + Axle JV | * Repair Plant Expansions Future Growth + Railcar Lease Fleet lik Mobile Repair Locations + Additional Repair Facilities | (i.e. Brookhaven, MS — 2014) + Increase market share of hopper railcar d
Slide 23: Objectives and Long-Term Strategies
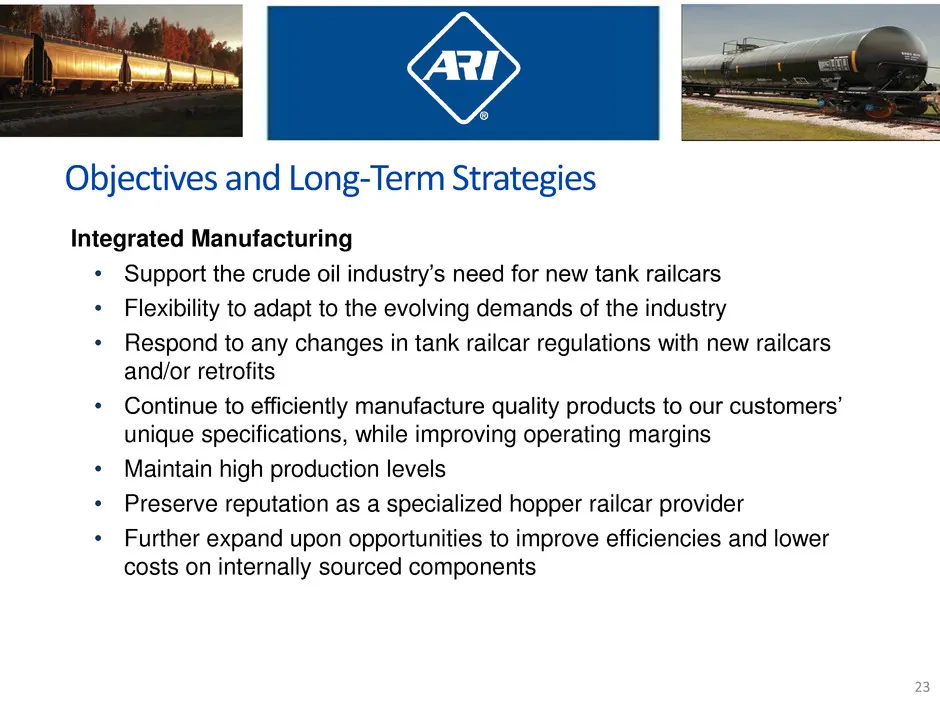
fo Objectives and Long-Term Strategies Integrated Manufacturing Support the crude oil industry’s need for new tank railcars Flexibility to adapt to the evolving demands of the industry Respond to any changes in tank railcar regulations with new railcars and/or retrofits Continue to efficiently manuf
Slide 24: Objectives and Long-Term Strategies (continued)
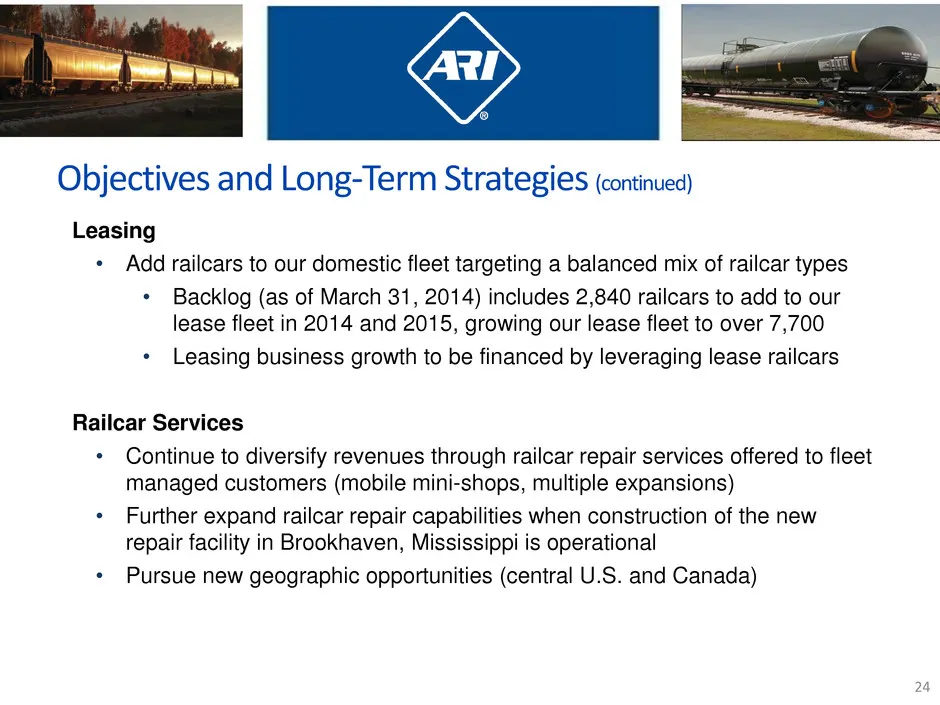
Objectives and Long-Term Strategies (continued) Leasing « Add railcars to our domestic fleet targeting a balanced mix of railcar types + Backlog (as of March 31, 2014) includes 2,840 railcars to add to our lease fleet in 2014 and 2015, growing our lease fleet to over 7,700 * Leasing business growth
Slide 25: Strong Financial Profile
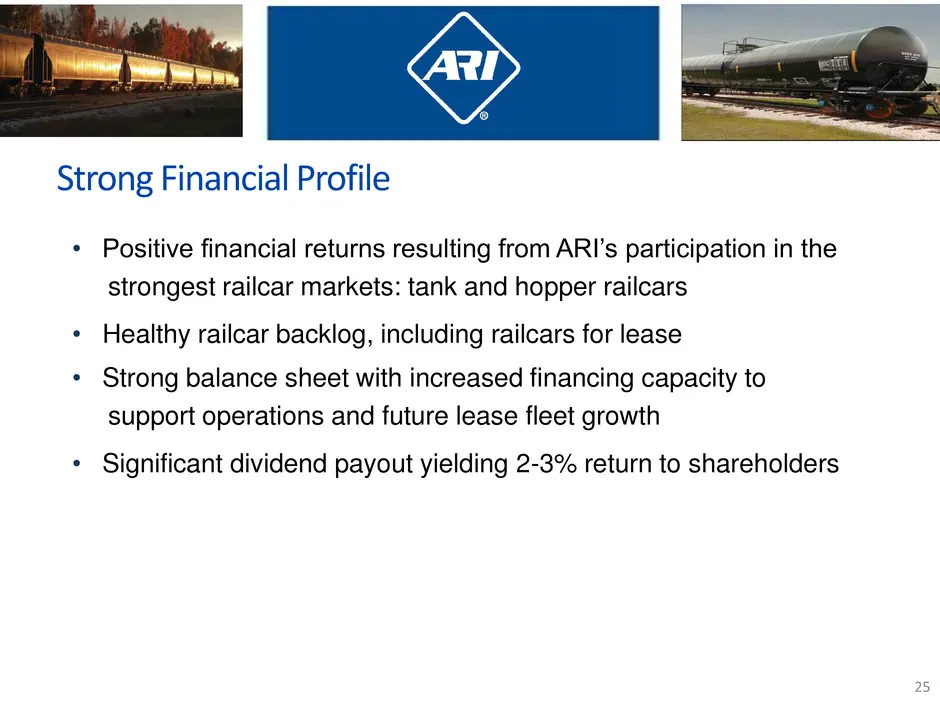
Strong Financial Profile . ° Positive financial returns resulting from ARI’s participation in the strongest railcar markets: tank and hopper railcars Healthy railcar backlog, including railcars for lease Strong balance sheet with increased financing capacity to support operations and future lease fl
Slide 26: Our Financial History
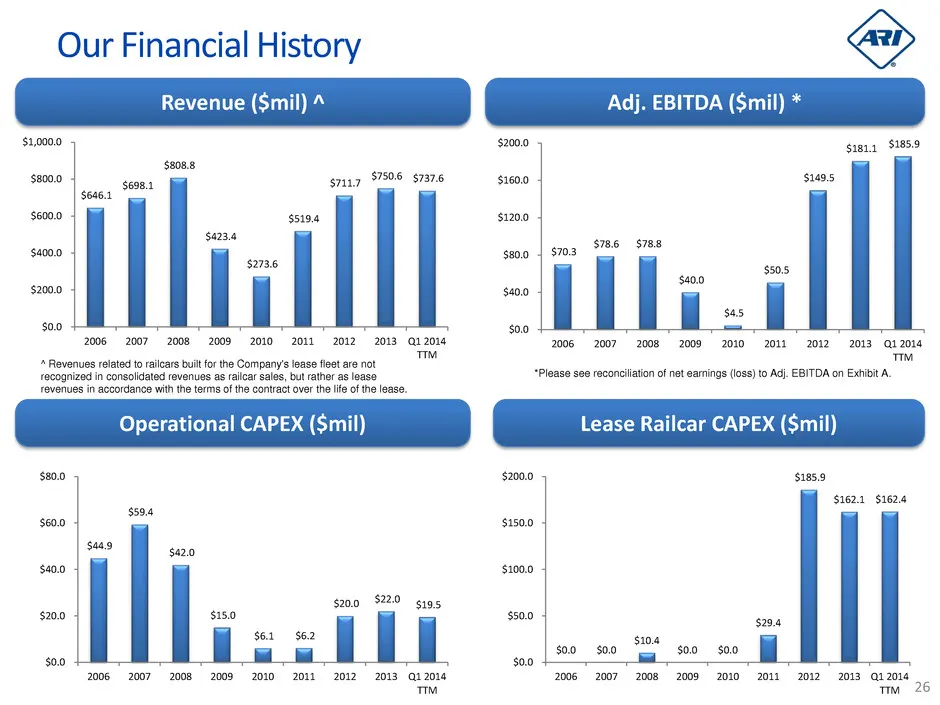
Our Financial History 31,0000 sriiz 7506 $7376 2006 2007 2008 2009-2010 2011-2012 «2013 ai2014 T™, recognized in consolidated revenues as railcar sales, but rather as lease revenues in accordance withthe terms of the contrat over the life ofthe lease. Operational CAPEX (Smil) $200 $20 sigs 2008 2007
Slide 27: Quarterly Financial Comparison
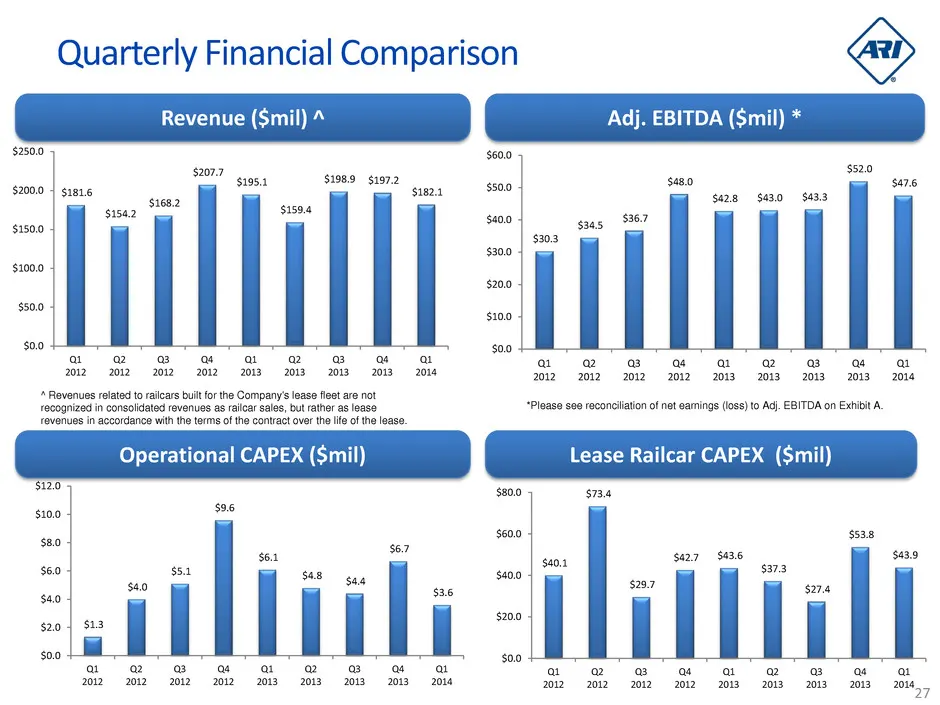
$2500 $200.0 $150.0 $100.0 $500 $00 Quarterly Financial Comparison $2077 oo5.1 $1989 $1972 $1816 sig2a —_ in $1504 $40.0 $300 $200 $100 aaa soo 4 “a a me me me mR mm O28 Operational CAPEX ($mil) Lease Railcar CAPEX (Smil) ey $800 $100 | a @ @ a a @ o@ a a 2012220122012 2012«-2013,«2012_ 91320132014
Slide 28: Exhibit A EBITDA Reconciliation
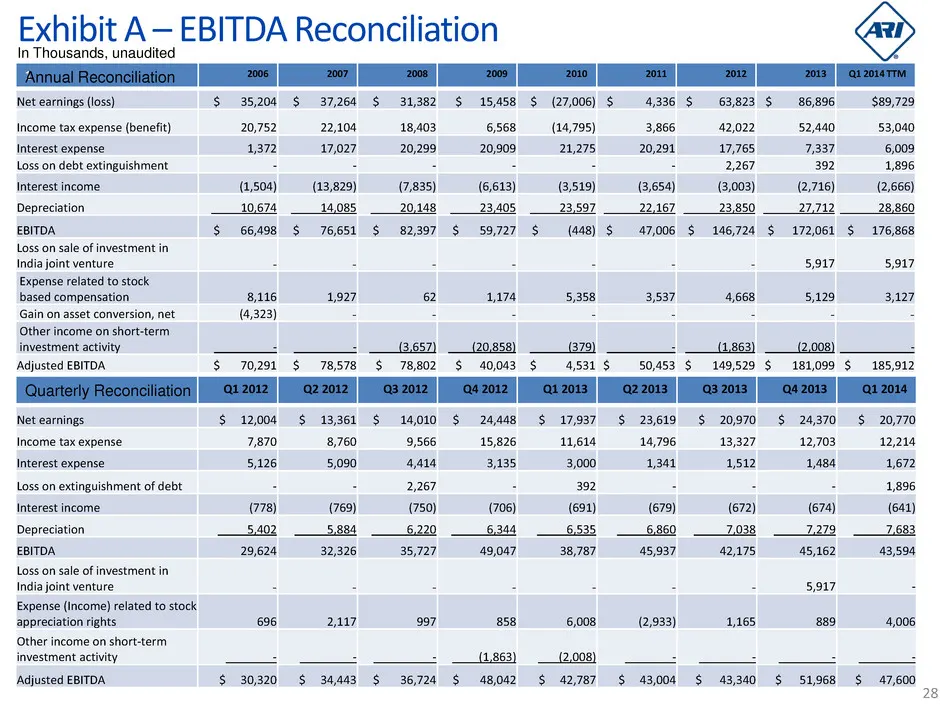
Exhibit A 7 EBITDA Reconciliation In Thousands, unaudite Net earnings (loss) $ 35204 $ 37,264 $ 31,382 $ 15,458 $ (27,006) $ 4,336 $ 63,823 $86,896 $89,729 Income tax expense (benefit) 20,752 22,104 18,403 6568 (14,795) 3,866 42,022 52,440 53,040 Interest & 1372 17,027 20,299 20,909 21,275 20,291 a
Slide 29: Exhibit A — EBITDA Reconciliation
SE Exhibit A— EBITDA Reconciliation EBITDA represents net one (loss) sae income be lanitag a big ete (income), loss on debt extinguishment and depreciation of property, plant and equipment. The iy believes seful to investors in evaluating ARI's operating performance compared to that of other compan
Slide 30: AGILE
AGILE NO A Ro:
Source: SEC EDGAR · 8-K filed May 8, 2014
More decks from American Railcar Industries Inc
 Q3 2018 Earnings Presentation19 slides · Oct 30, 2018
 Investor Presentation (August 2018)26 slides · Aug 24, 2018
 Q2 2018 Earnings Presentation19 slides · Aug 1, 2018
 Q1 2018 Earnings Presentation18 slides · May 1, 2018
 Q4 2017 Earnings Presentation19 slides · Feb 23, 2018
 Cowen conference 201824 slides · Feb 6, 2018