Alpine Select AG · SIX:ALPN
Alpine Select — Investor Presentation (August 2020)
16 slides from Alpine Select's investor presentation, Aug 31, 2020
Slide 1: Corporate Presentation
Corporate Presentation as per 31 August 2020
Slide 2: About Alpine Select
About Alpine Select 2 • Alpine Select is an independent, SIX-listed • Alpine Select also takes positions and exploits company located in Switzerland advocating an opportunities in special situations (significant active and value driven investment management transactional events such as spin-offs, st
Slide 3: Investment Rationale
Investment Rationale 3 • Pooling of investors’ interest through investment • Investment possibility via: policy and business credo Permanent capital (equity of Alpine Select AG) • Access the investment capabilities of the with instant liquidity through exchange listing; experienced Alpine Select i
Slide 4: Company Characteristics (I/II)
Company Characteristics (I/II) 4 Investment Policy Business Credo • Absolute return target: CHF 6 – 8% p.a. above • Alignment of investors’ and company’s interest CHF risk free rate • No performance fee: Performance belongs to • Partner with specialized Hedge Fund managers to stakeholders! compose a
Slide 5: Company Characteristics (II/II)
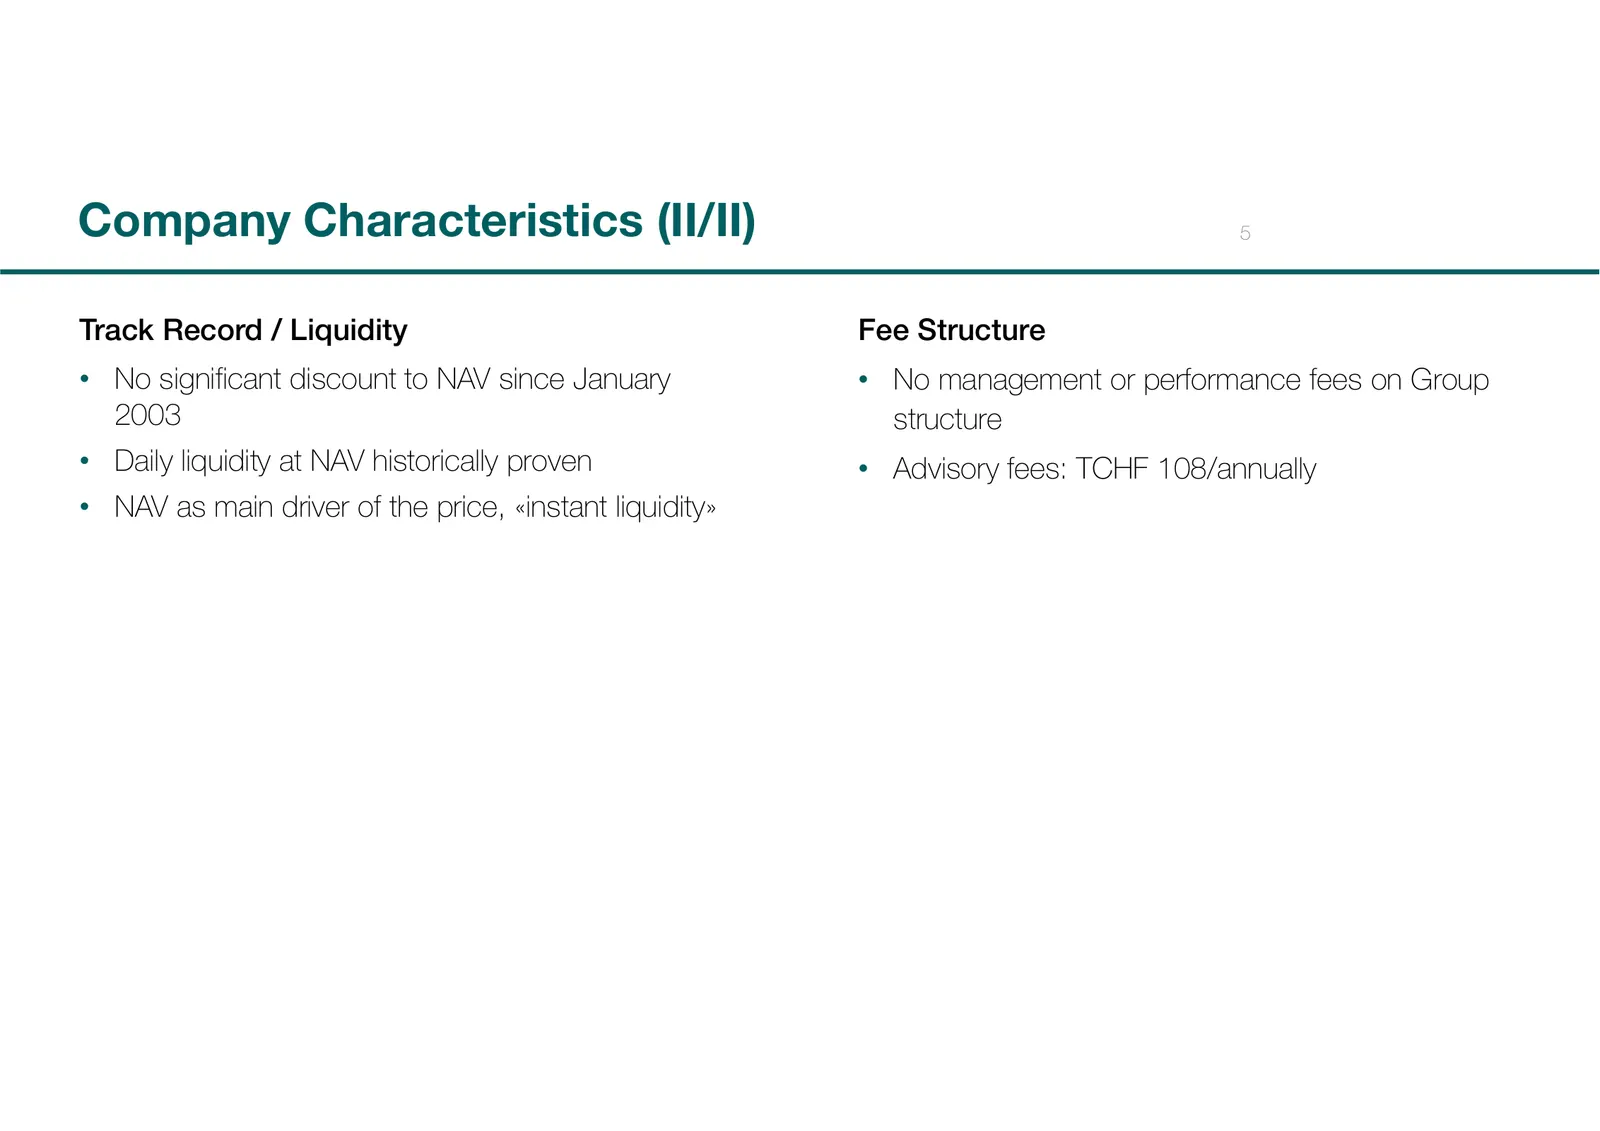
Company Characteristics (II/II) 5 Track Record / Liquidity Fee Structure • No significant discount to NAV since January • No management or performance fees on Group 2003 structure • Daily liquidity at NAV historically proven • Advisory fees: TCHF 108/annually • NAV as main driver of the price, «inst
Slide 6: Members of the Board of Directors
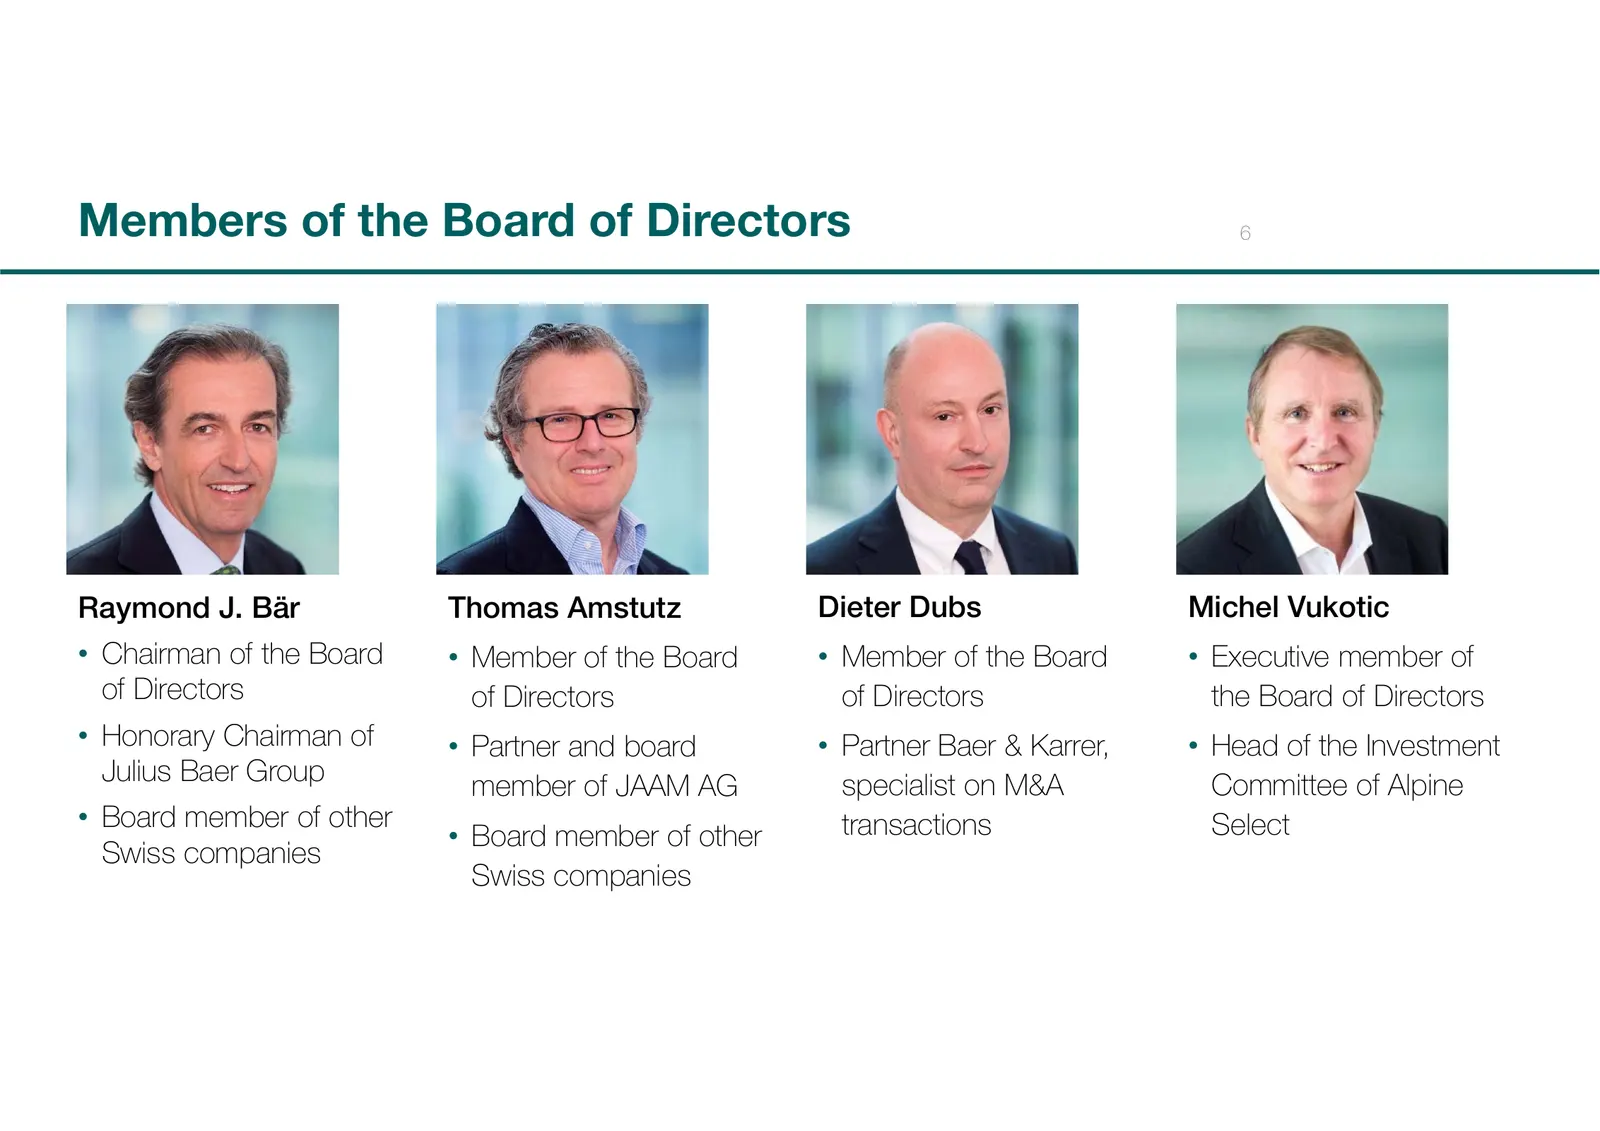
Members of the Board of Directors 6 Raymond J. Bär Thomas Amstutz Dieter Dubs Michel Vukotic • Chairman of the Board • Member of the Board • Member of the Board • Executive member of of Directors of Directors of Directors the Board of Directors • Honorary Chairman of • Partner and board • Partner Ba
Slide 7: Members of the Management
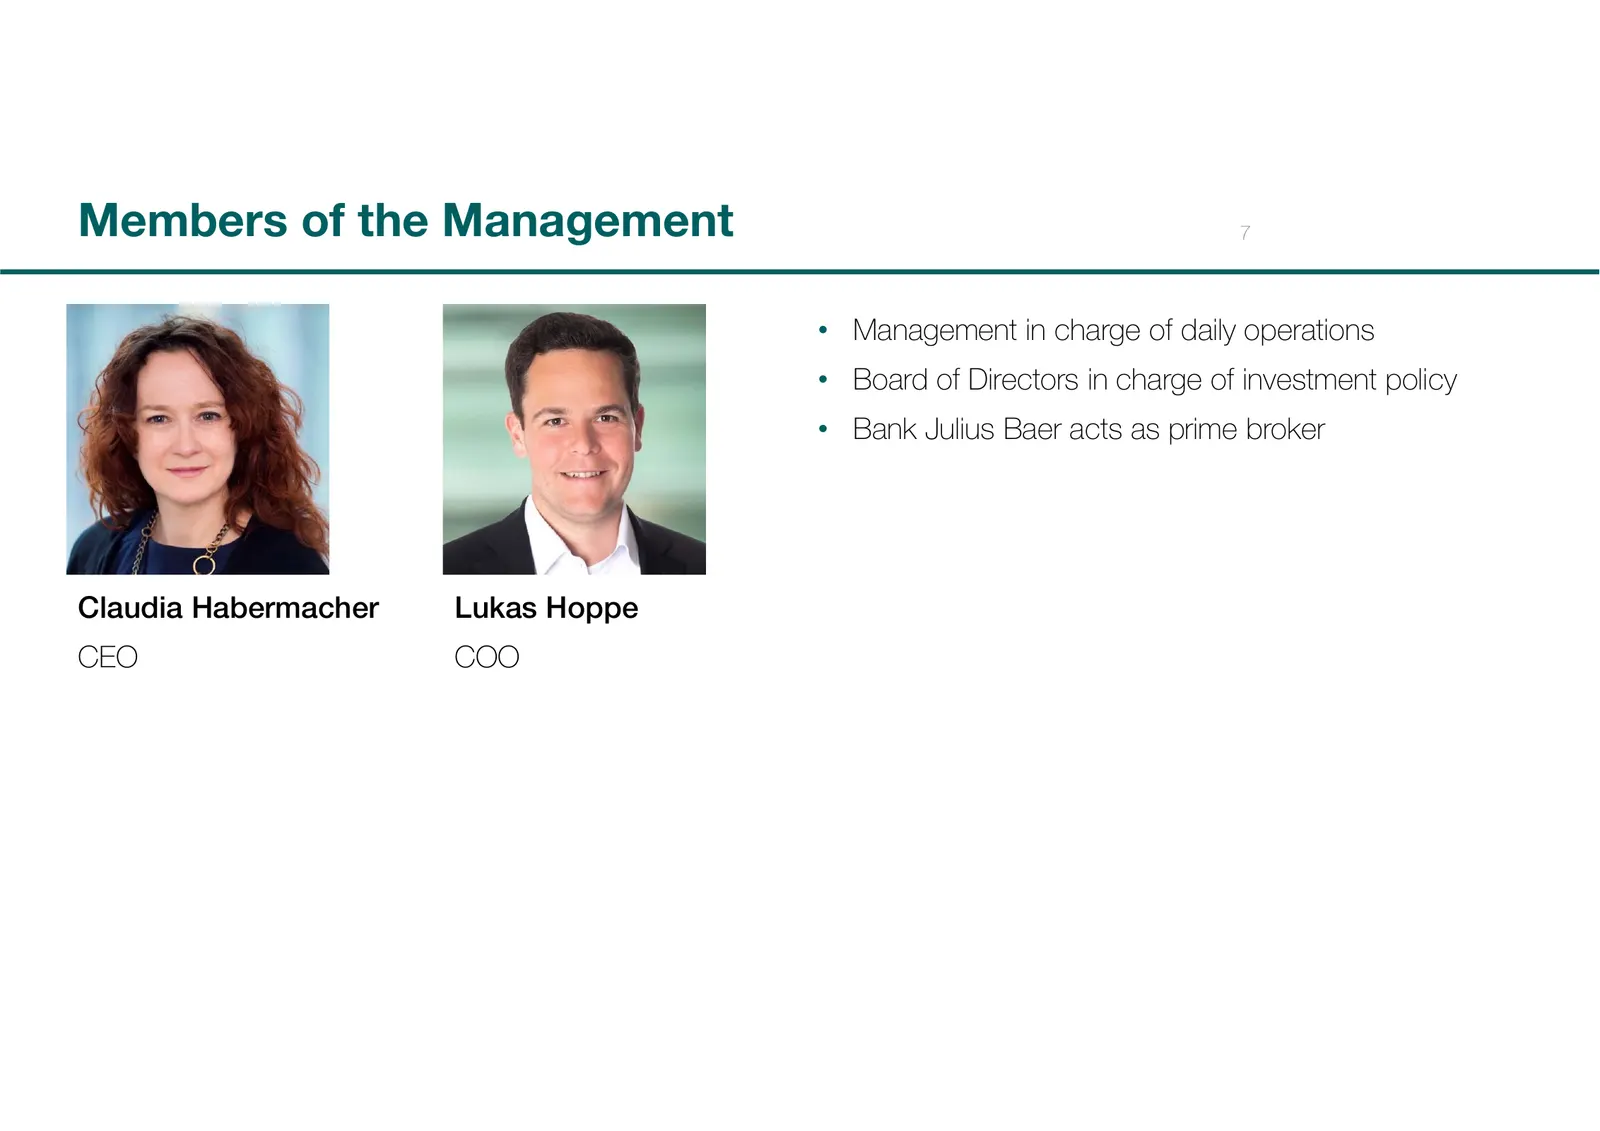
Members of the Management 7 • Management in charge of daily operations • Board of Directors in charge of investment policy • Bank Julius Baer acts as prime broker Claudia Habermacher Lukas Hoppe CEO COO
Slide 8: Performance
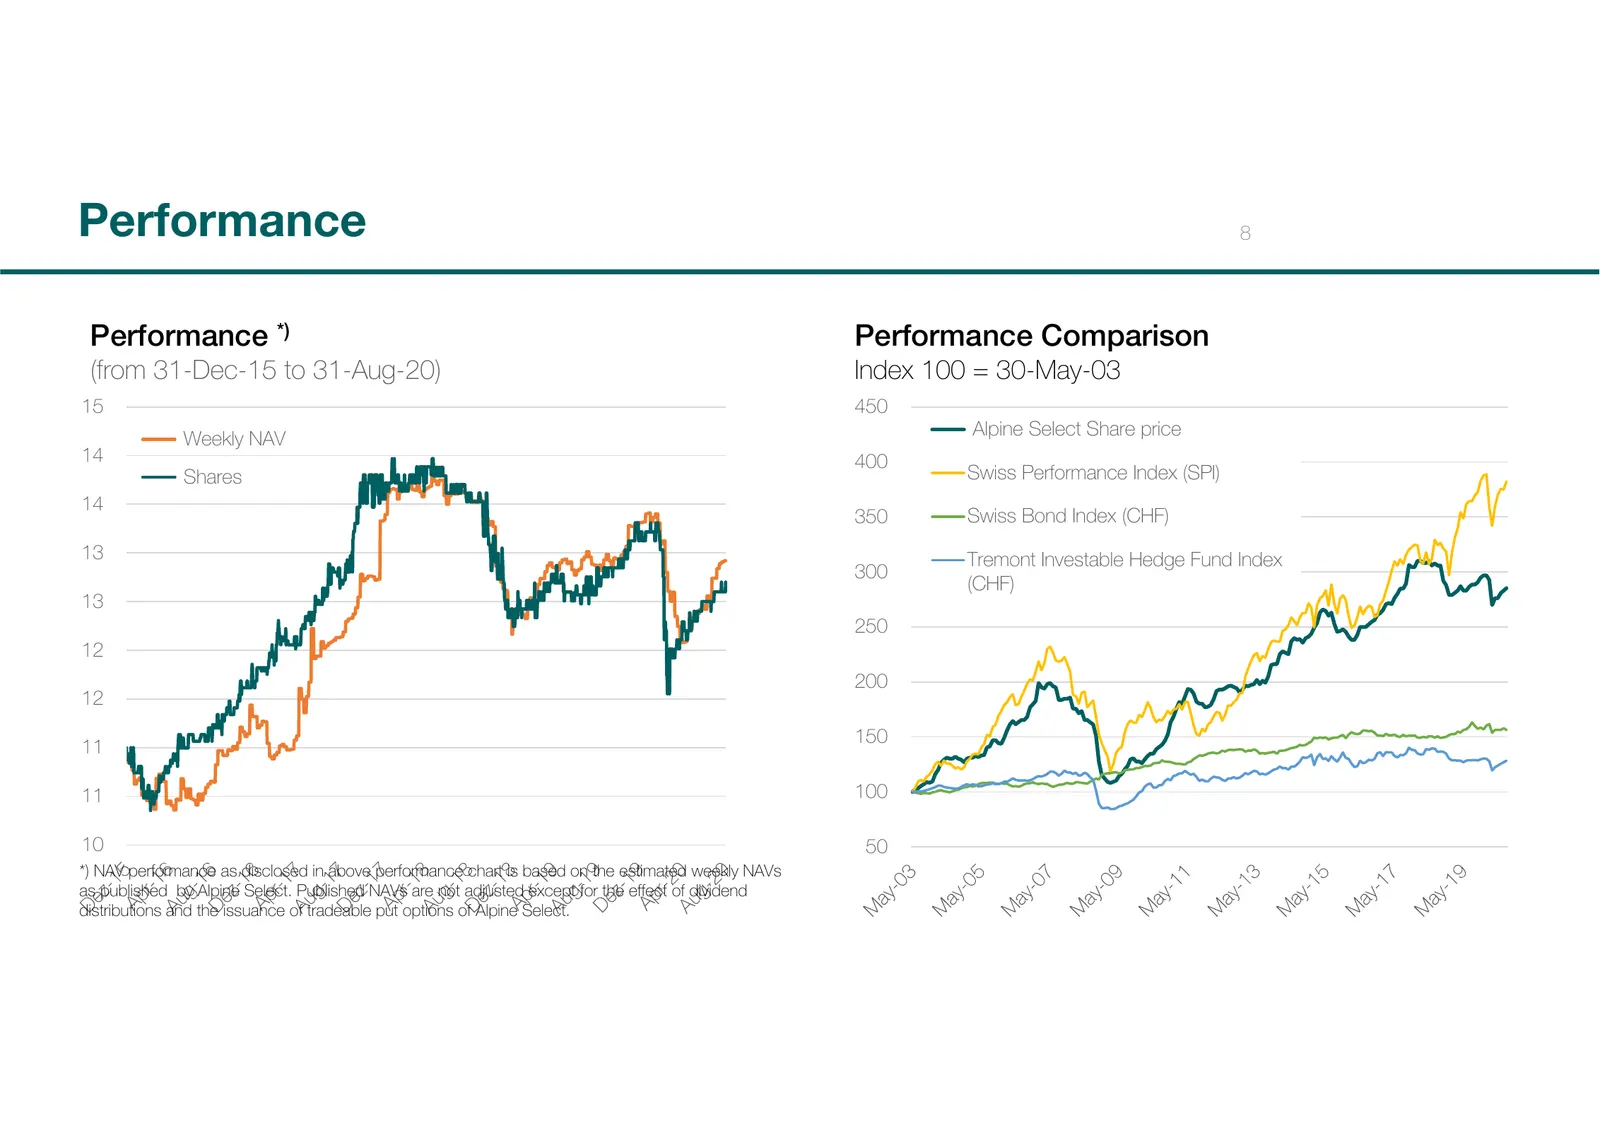
Performance 8 Performance *) Performance Comparison (from 31-Dec-15 to 31-Aug-20) Index 100 = 30-May-03 15 450 Alpine Select Share price Weekly NAV 14 400 Shares Swiss Performance Index (SPI) 14 350 Swiss Bond Index (CHF) 13 Tremont Investable Hedge Fund Index 300 (CHF) 13 250 12 200 12 150 11 11 10
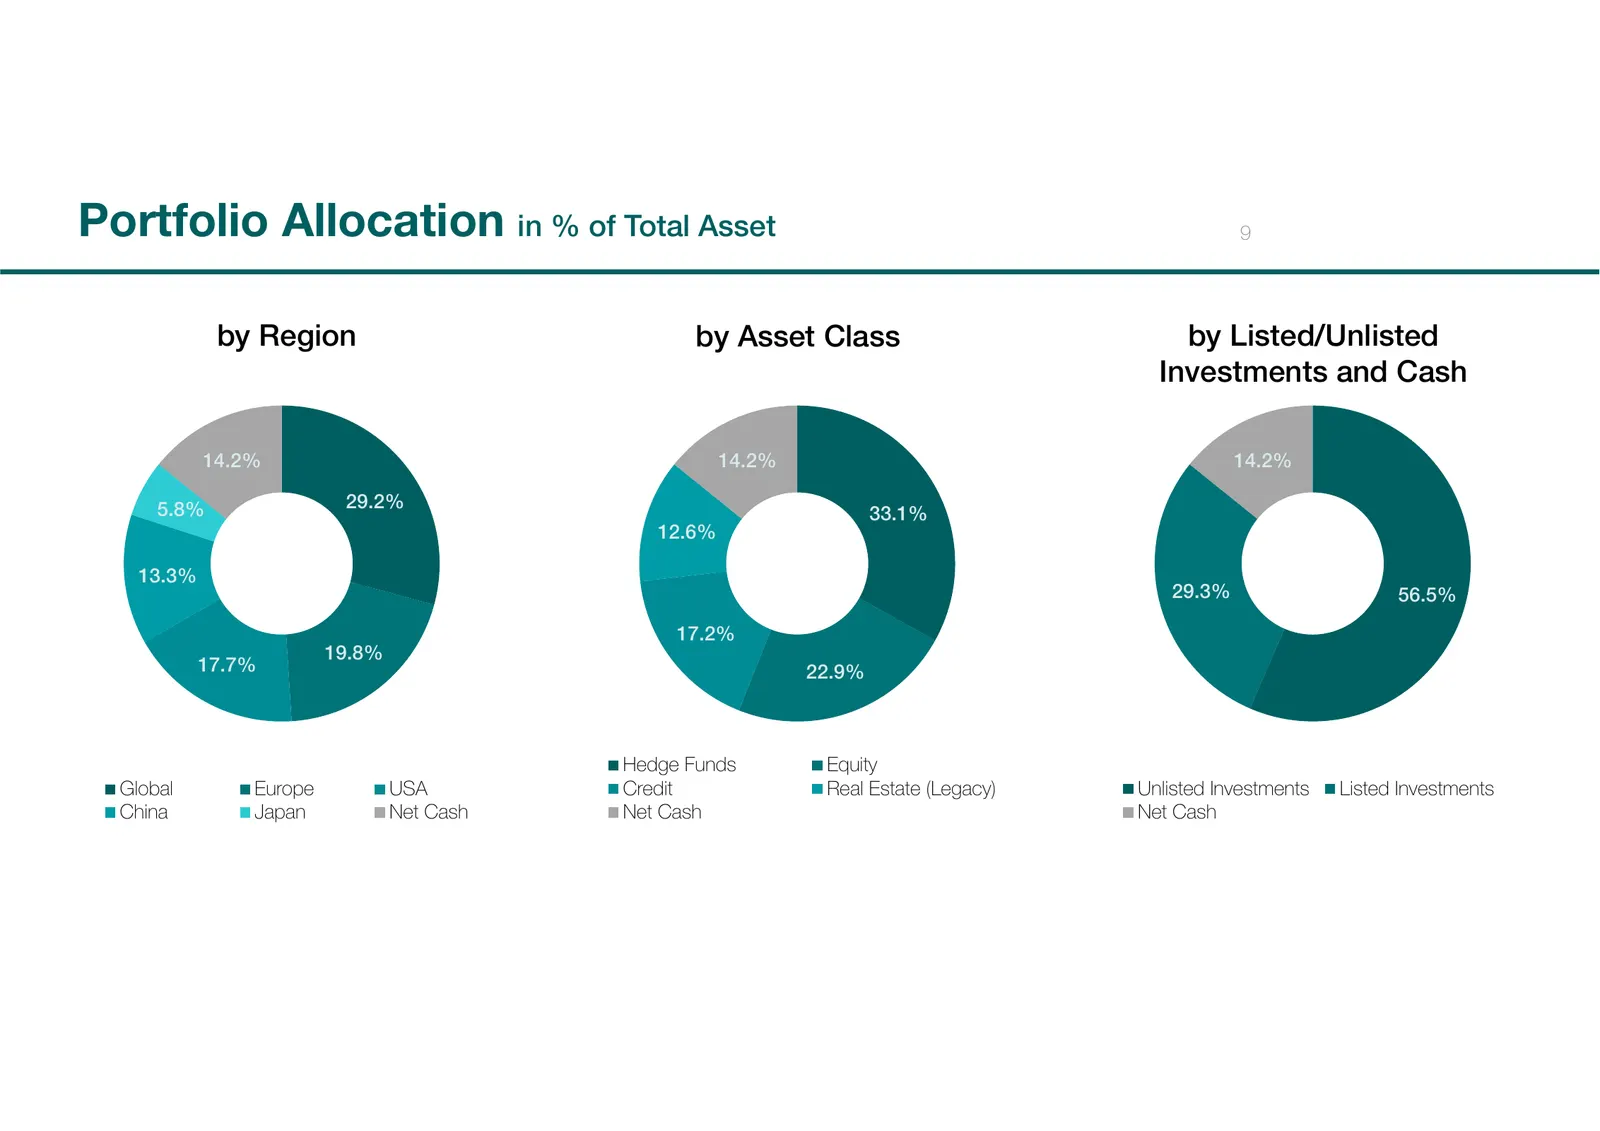
Slide 9: Portfolio Allocation in % of Total Asset
Portfolio Allocation in % of Total Asset 9 by Region by Asset Class by Listed/Unlisted Investments and Cash 14.2% 14.2% 14.2% 5.8% 29.2% 33.1% 12.6% 13.3% 29.3% 56.5% 17.2% 19.8% 17.7% 22.9% Hedge Funds Equity Global Europe USA Credit Real Estate (Legacy) Unlisted Investments Listed Investments Chin
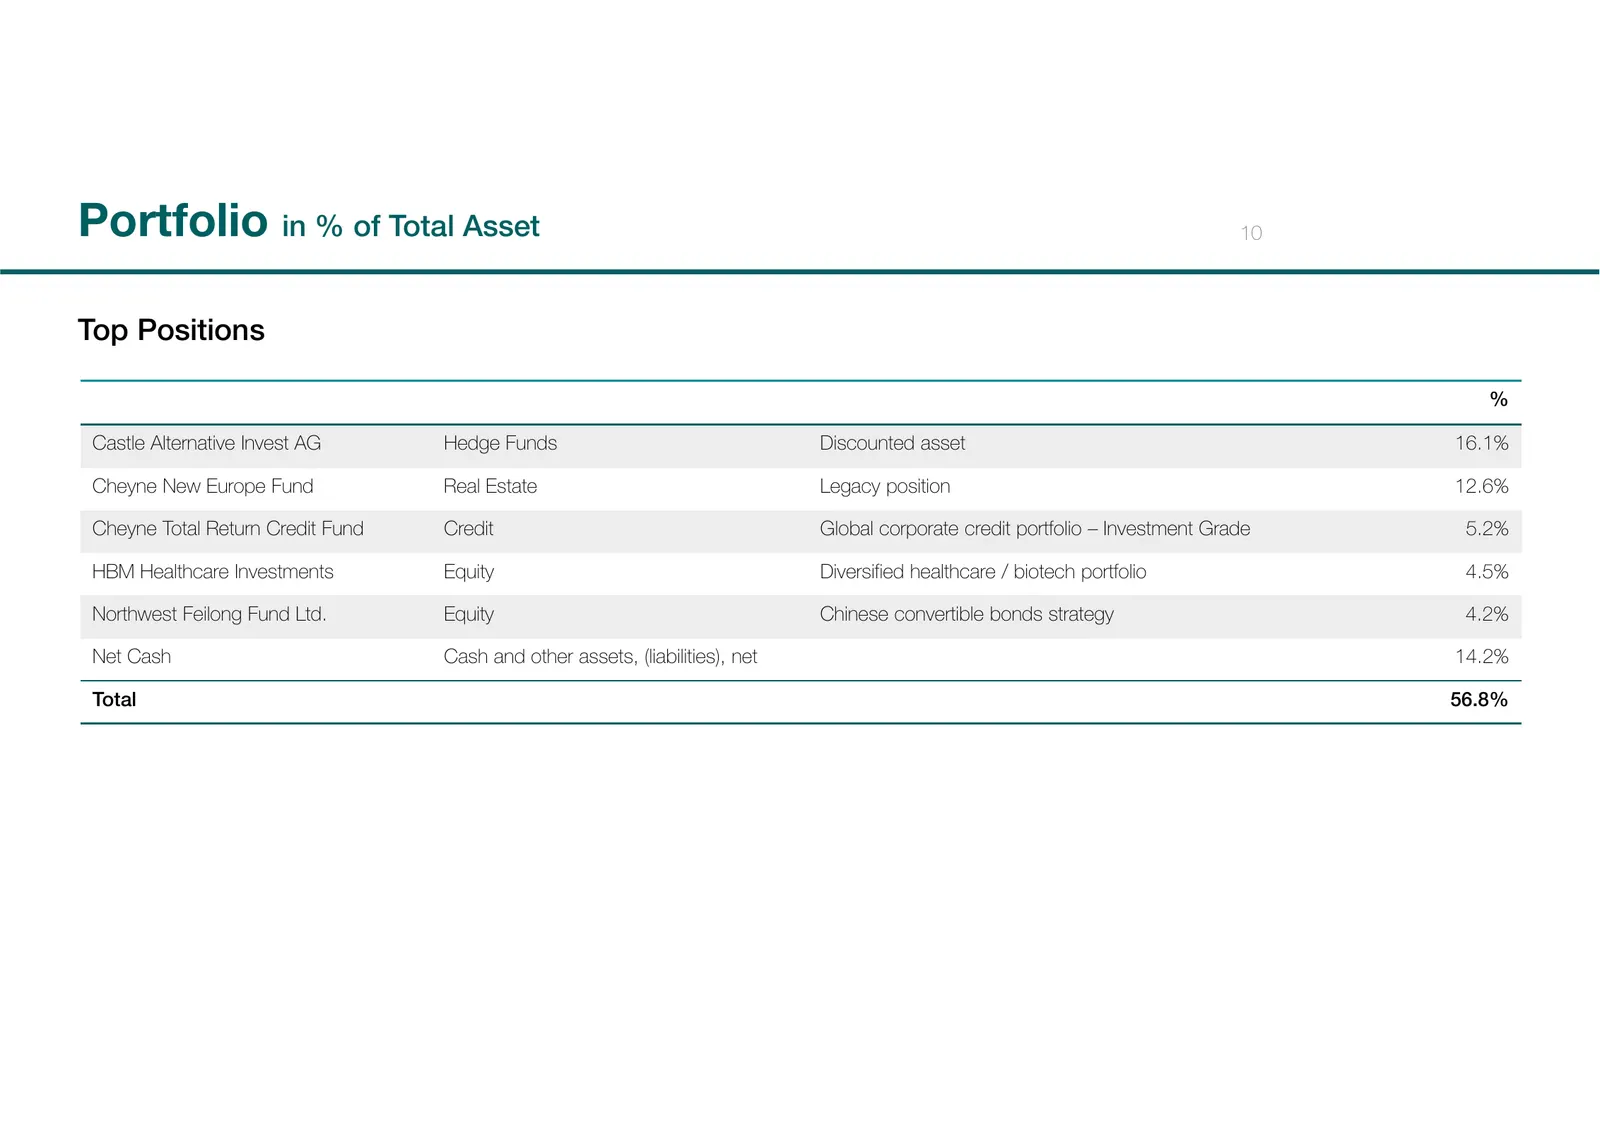
Slide 10: Portfolio in % of Total Asset
Portfolio in % of Total Asset 10 Top Positions % Castle Alternative Invest AG Hedge Funds Discounted asset 16.1% Cheyne New Europe Fund Real Estate Legacy position 12.6% Cheyne Total Return Credit Fund Credit Global corporate credit portfolio – Investment Grade 5.2% HBM Healthcare Investments Equity
Slide 11: Appendix
Appendix As per 31 August 2020
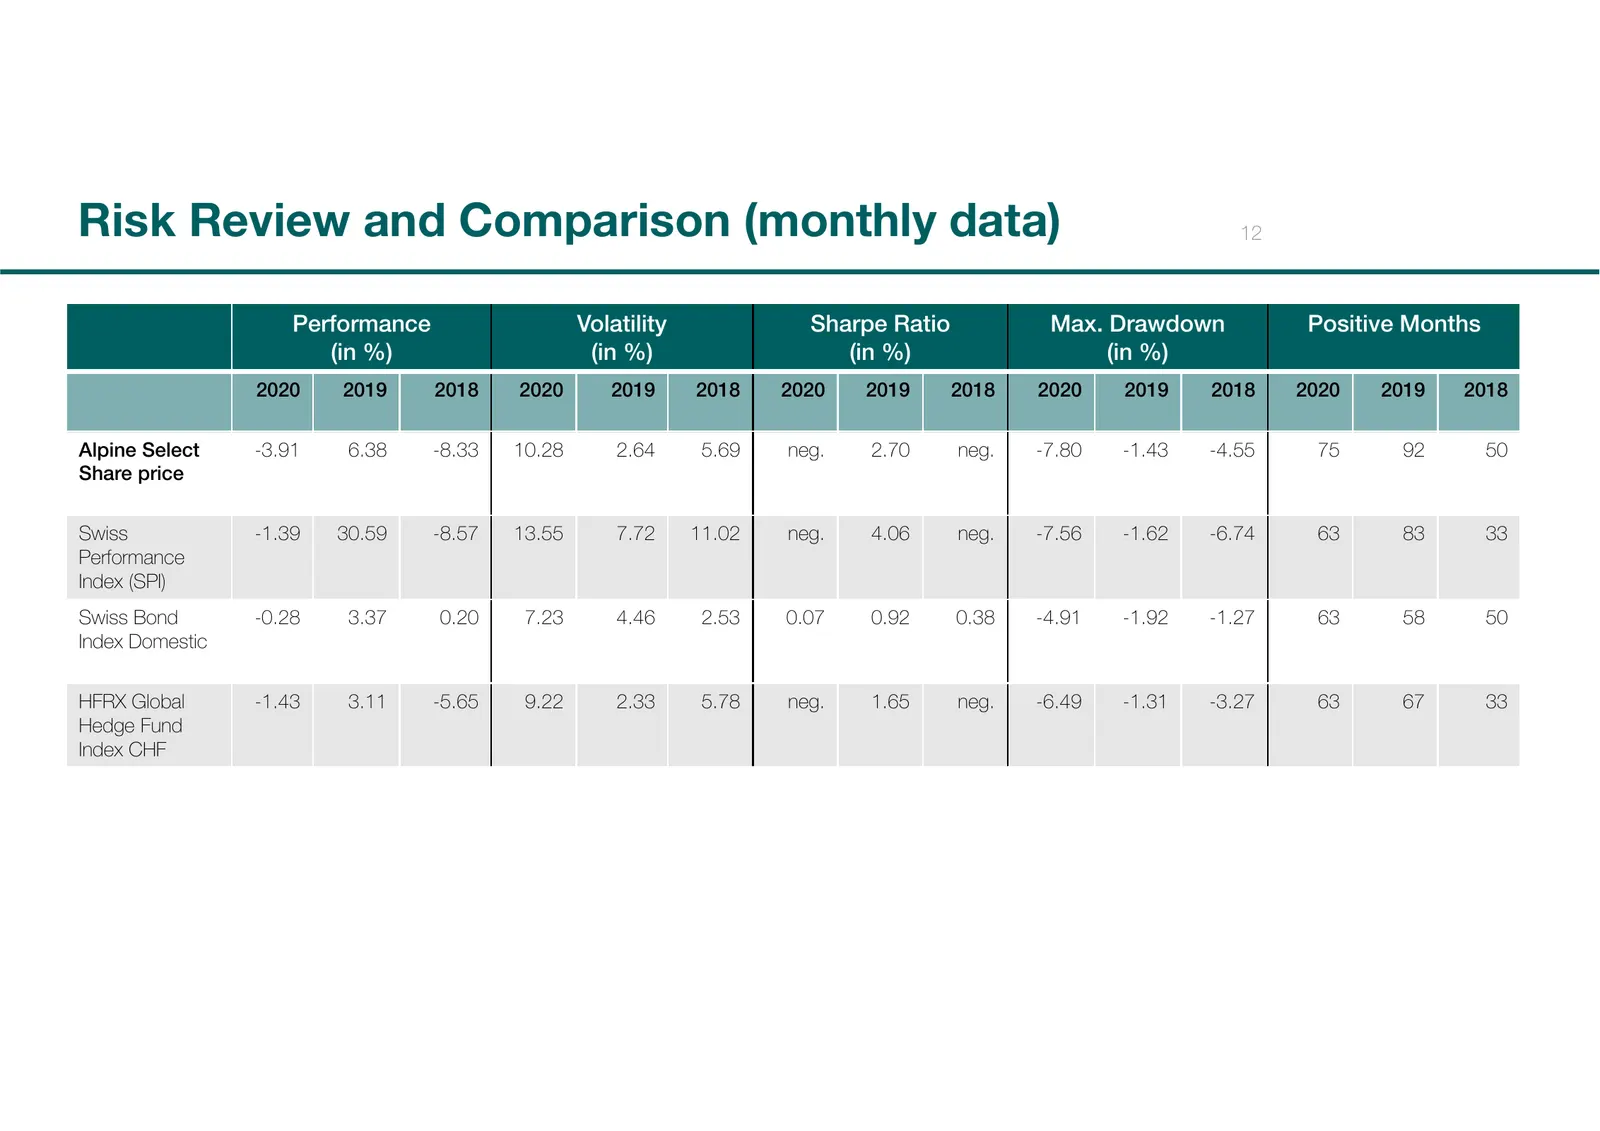
Slide 12: Risk Review and Comparison (monthly data)
Risk Review and Comparison (monthly data) 12 Performance Volatility Sharpe Ratio Max. Drawdown Positive Months (in %) (in %) (in %) (in %) 2020 2019 2018 2020 2019 2018 2020 2019 2018 2020 2019 2018 2020 2019 2018 Alpine Select -3.91 6.38 -8.33 10.28 2.64 5.69 neg. 2.70 neg. -7.80 -1.43 -4.55 75 92
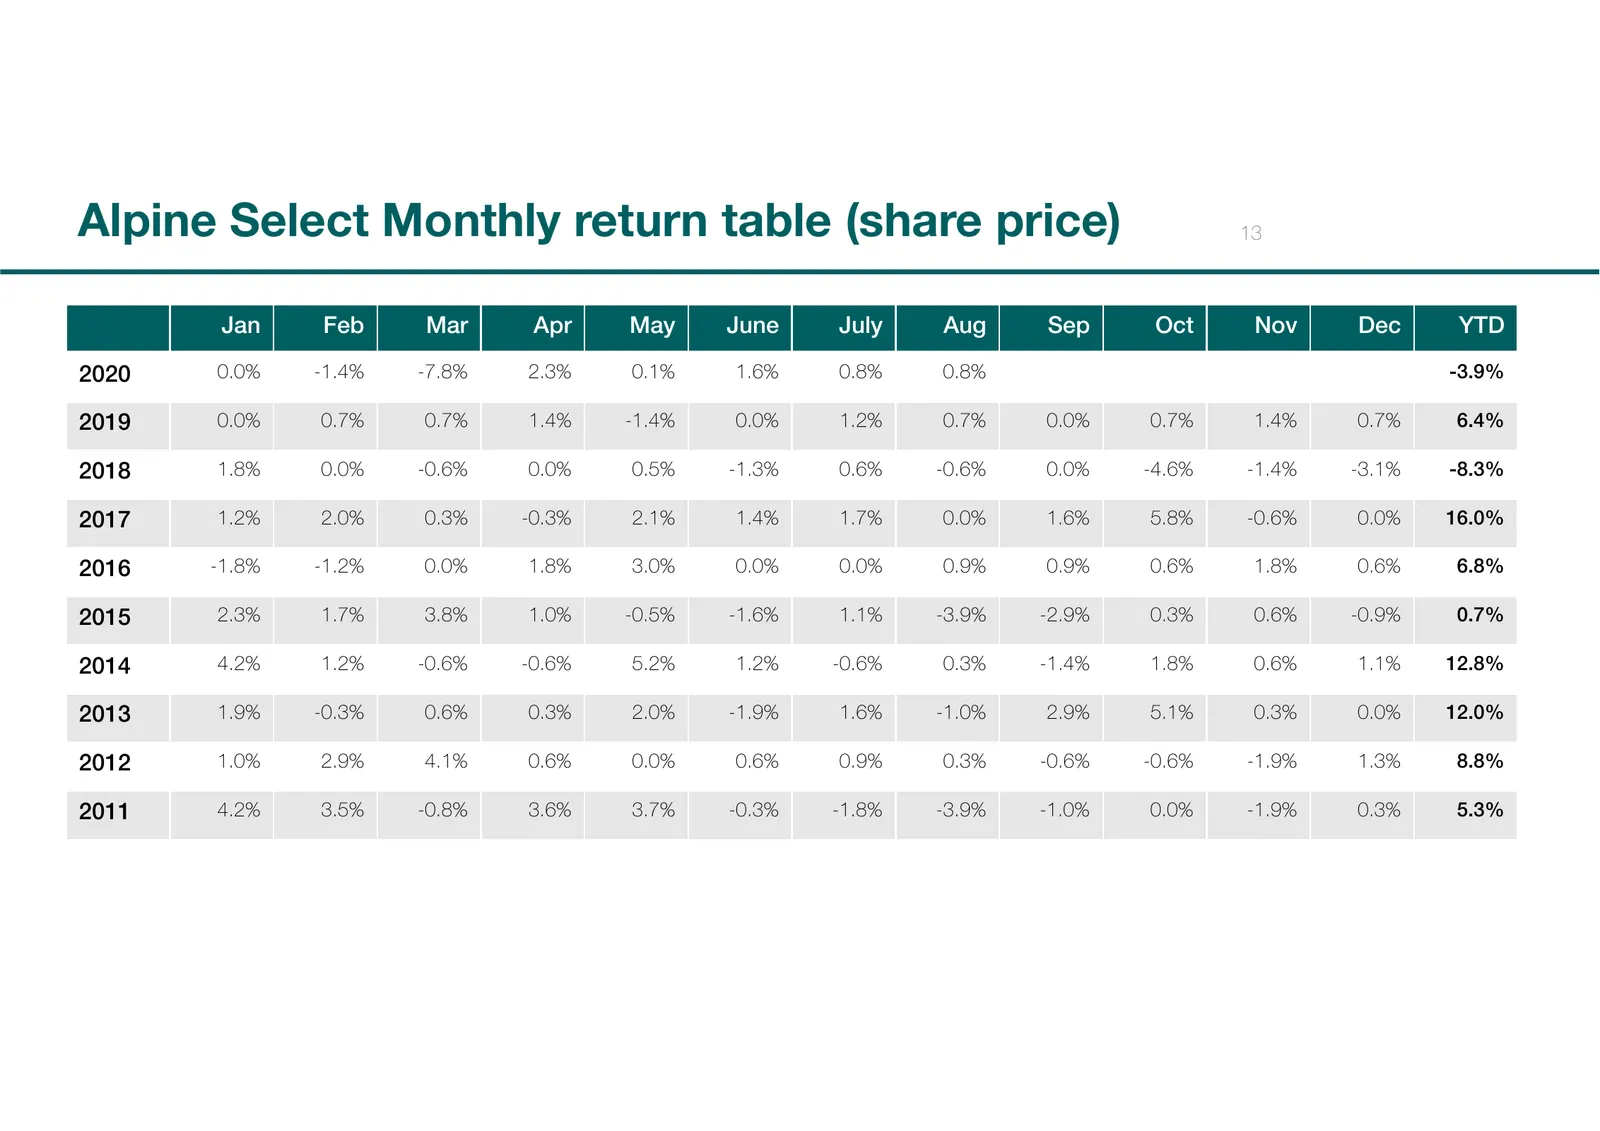
Slide 13: Alpine Select Monthly return table (share price)
Alpine Select Monthly return table (share price) 13 Jan Feb Mar Apr May June July Aug Sep Oct Nov Dec YTD 2020 0.0% -1.4% -7.8% 2.3% 0.1% 1.6% 0.8% 0.8% -3.9% 2019 0.0% 0.7% 0.7% 1.4% -1.4% 0.0% 1.2% 0.7% 0.0% 0.7% 1.4% 0.7% 6.4% 2018 1.8% 0.0% -0.6% 0.0% 0.5% -1.3% 0.6% -0.6% 0.0% -4.6% -1.4% -3.1%
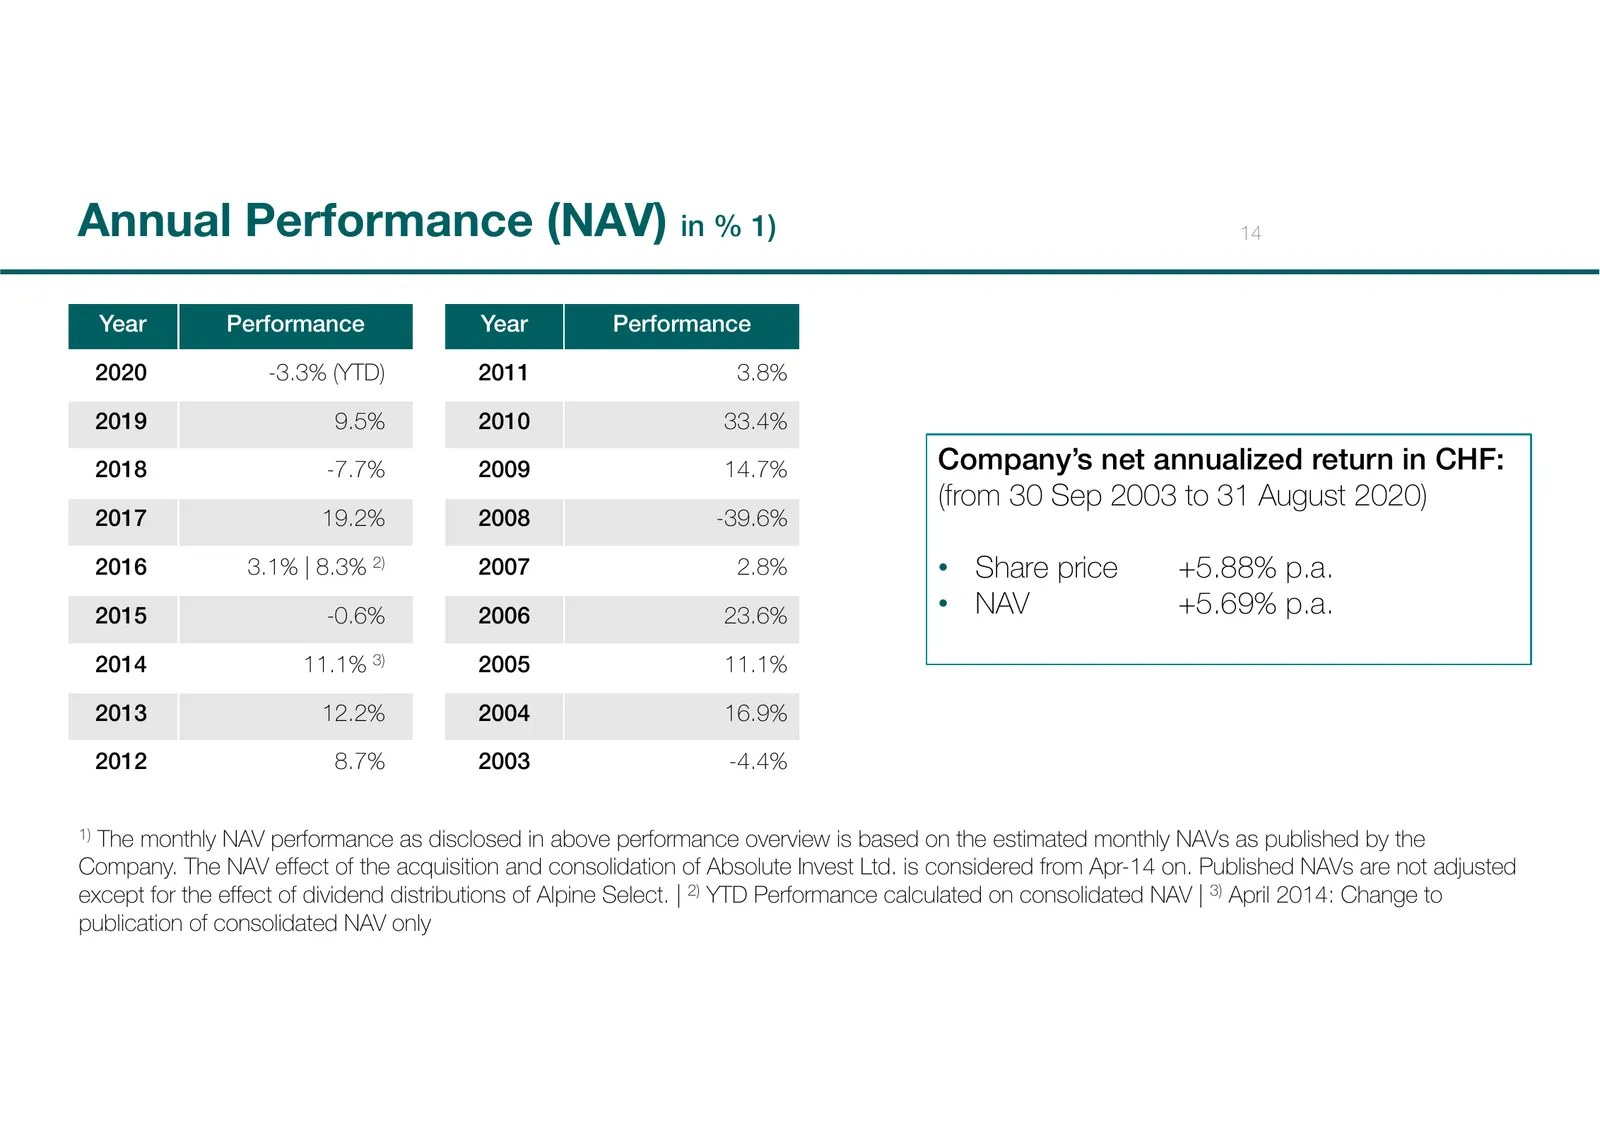
Slide 14: Annual Performance (NAV) in %
Annual Performance (NAV) in % 1) 14 Year Performance Year Performance 2020 -3.3% (YTD) 2011 3.8% 2019 9.5% 2010 33.4% 2018 -7.7% 2009 14.7% Company’s net annualized return in CHF: (from 30 Sep 2003 to 31 August 2020) 2017 19.2% 2008 -39.6% 2016 3.1% | 8.3% 2) 2007 2.8% • Share price +5.88% p.a. 2015
Slide 15: Contact
Contact Alpine Select AG Gotthardstrasse 31 CH-6300 Zug investorrelations@alpine-select.ch +41 41 720 44 11
Slide 16: General information
General information 16 • This document is intended for information purposes only. All material is provided "as is" or "as available“ to the user without express or implied warranties, guarantee or representation of any kind including those of merchantability, originality, accuracy, completeness or f
Source: Internet Archive copy of alpine-select.ch
More decks from Alpine Select AG
 Investor Presentation (October 2026)16 slides · Oct 31, 2026
 Investor Presentation (September 2026)16 slides · Sep 30, 2026
 Investor Presentation (June 2025)16 slides · Jun 30, 2025
 Investor Presentation (October 2024)16 slides · Oct 31, 2024
 Investor Presentation (February 2023)16 slides · Feb 28, 2023
 Shareholder Meeting (May 2015)40 slides · May 2015