Benihana — Investor Conference (February 2012)
48 slides from Benihana's conference presentation, Feb 29, 2012

Slide 1: Management Presentation Investor Conference
Management Presentation Investor Conference
Slide 2: Forward-Looking Statements
Forward-Looking Statements Statements made in this presentation, other than those concerning historical financial information, may be considered “forward-looking statements,” which are made pursuant to the safe harbor provisions of the Private Securities Litigation Reform Act of 1995 and based upon
Slide 3: Company Overview
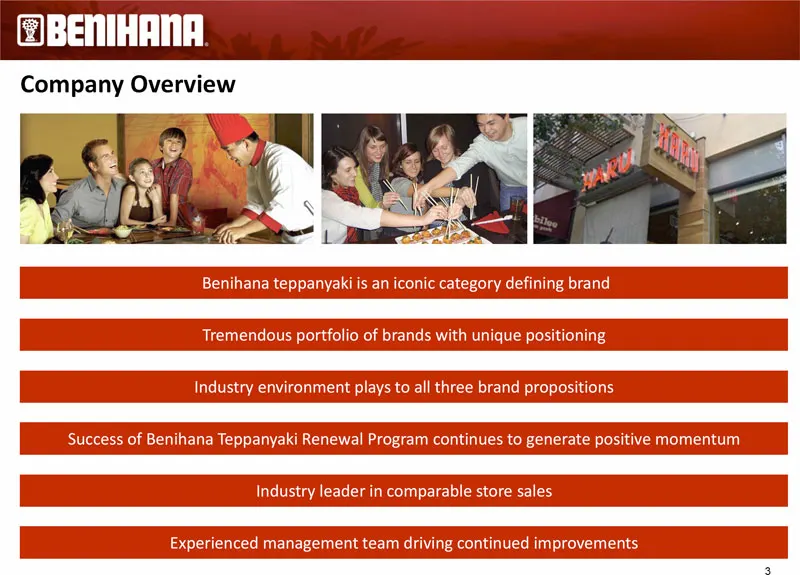
Company Overview Benihana teppanyaki is an iconic category defining brand Tremendous portfolio of brands with unique positioning Industry environment plays to all three brand propositions Success of Benihana Teppanyaki Renewal Program continues to generate positive momentum Industry leader in compar
Slide 4: Strategy for Continuing to Enhance Shareholder Value
Strategy for Continuing to Enhance Shareholder Value Continue driving Benihana Renewal Program initiatives to further improve restaurant margins and traffic Implement learnings from RA Sushi business review Begin site identification for new restaurant development Continue focus on Investor Relations
Slide 5: Experienced Management Team
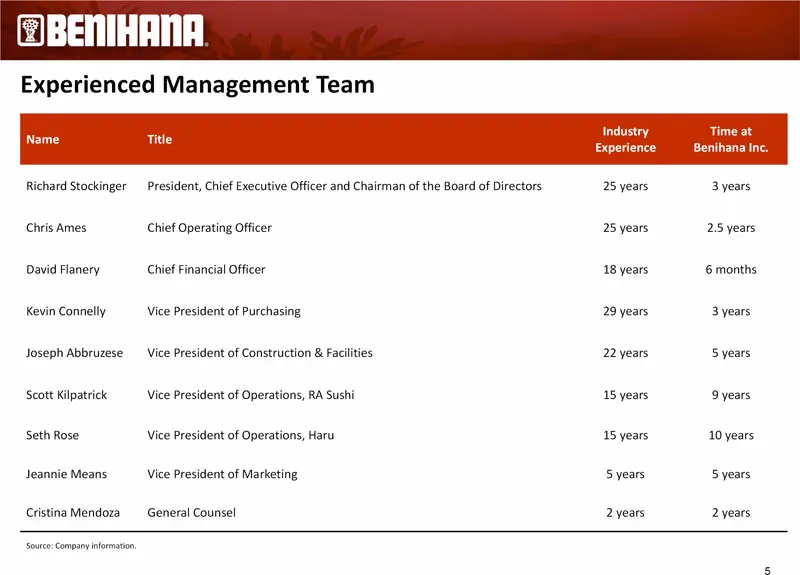
Experienced Management Team Industry Time at Name Title Experience Benihana Inc. Richard Stockinger President, Chief Executive Officer and Chairman of the Board of Directors 25 years 3 years Chris Ames Chief Operating Officer 25 years 2.5 years David Flanery Chief Financial Officer 18 years 6 months
Slide 6: Restaurant Locations
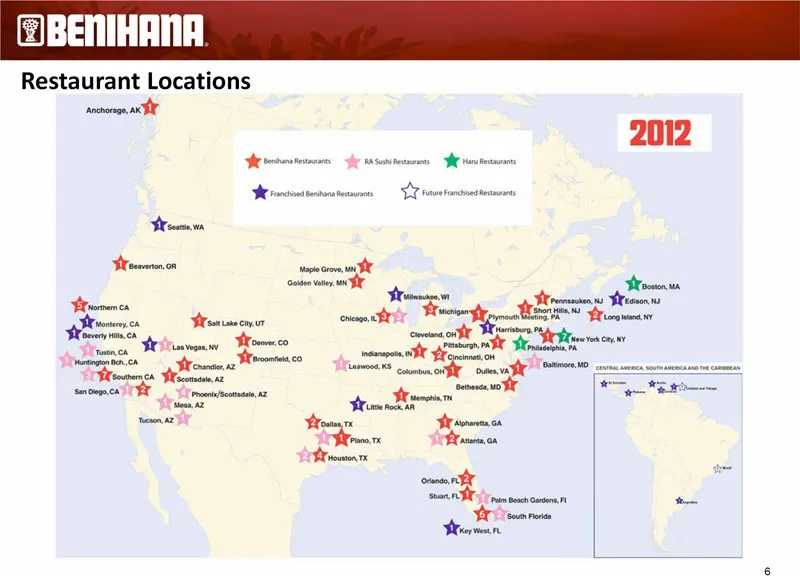
@BENIHANA Restaurant Locations sacra TY The eo a ane FR om Ne ne = Rela iE $ewenn oe eg sy
Slide 7: Overview: Benihana Teppanyaki – Iconic Brand
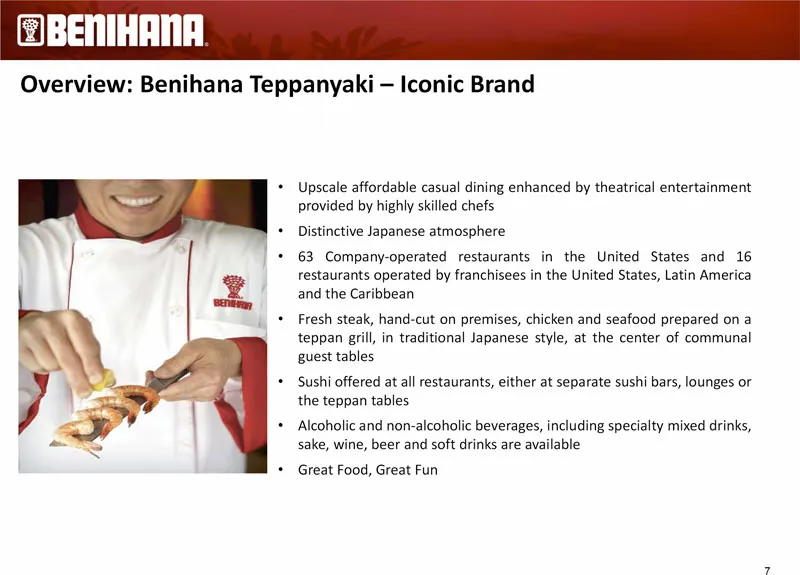
Overview: Benihana Teppanyaki – Iconic Brand • Upscale affordable casual dining enhanced by theatrical entertainment provided by highly skilled chefs • Distinctive Japanese atmosphere • 63 Company-operated restaurants in the United States and 16 restaurants operated by franchisees in the United Stat
Slide 8: Overview: RA Sushi – Fun Filled and Energetic
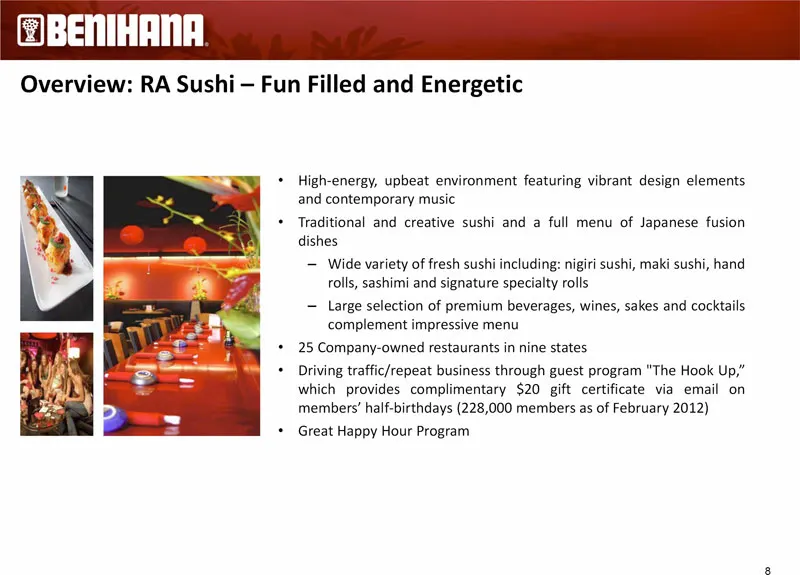
Overview: RA Sushi – Fun Filled and Energetic • High-energy, upbeat environment featuring vibrant design elements and contemporary music • Traditional and creative sushi and a full menu of Japanese fusion dishes – Wide variety of fresh sushi including: nigiri sushi, maki sushi, hand rolls, sashimi a
Slide 9: Overview: Haru – Premium Modern Japanese Fusion Dining
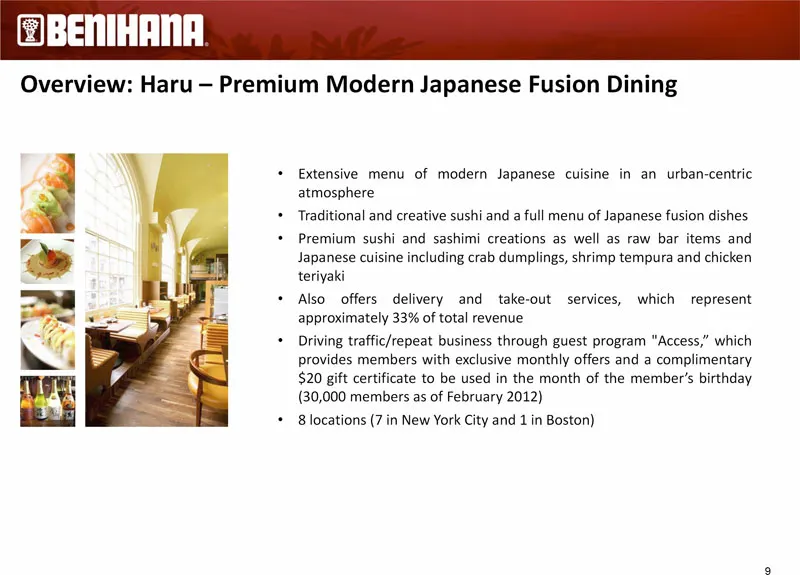
Overview: Haru – Premium Modern Japanese Fusion Dining • Extensive menu of modern Japanese cuisine in an urban-centric atmosphere • Traditional and creative sushi and a full menu of Japanese fusion dishes • Premium sushi and sashimi creations as well as raw bar items and Japanese cuisine including c

Slide 10: Renewal Program
@)BENIHANA. Renewal Program
Slide 11: The Renewal Program
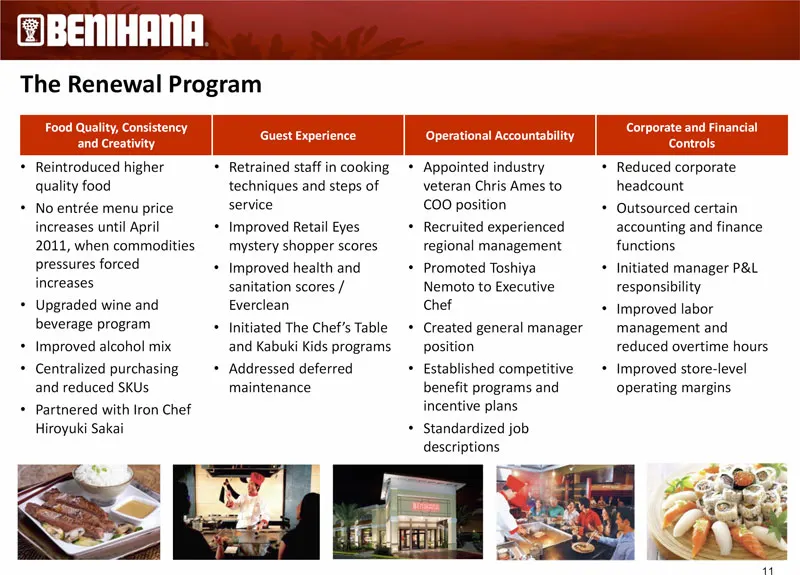
The Renewal Program Food Quality, Consistency Corporate and Financial Guest Experience Operational Accountability and Creativity Controls • Reintroduced higher • Retrained staff in cooking • Appointed industry • Reduced corporate quality food techniques and steps of veteran Chris Ames to headcount •
Slide 12: The Renewal Program: Food Quality, Consistency and Creativity
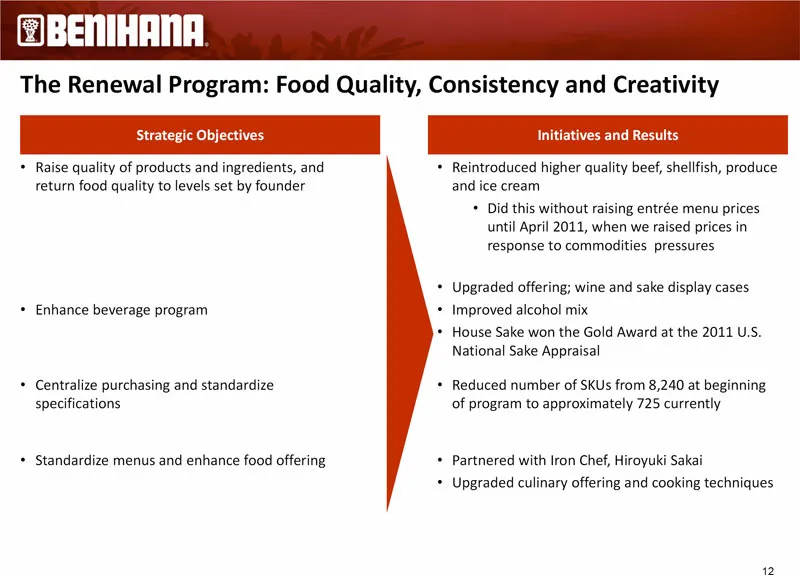
The Renewal Program: Food Quality, Consistency and Creativity Strategic Objectives Initiatives and Results • Raise quality of products and ingredients, and • Reintroduced higher quality beef, shellfish, produce return food quality to levels set by founder and ice cream • Did this without raising ent
Slide 13: The Renewal Program: Guest Experience
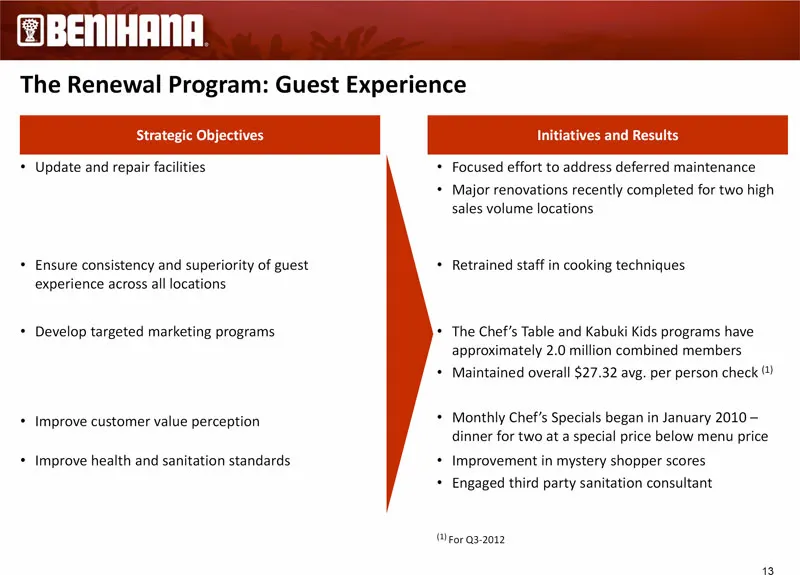
The Renewal Program: Guest Experience Strategic Objectives Initiatives and Results • Update and repair facilities • Focused effort to address deferred maintenance • Major renovations recently completed for two high sales volume locations • Ensure consistency and superiority of guest • Retrained staf
Slide 14: The Renewal Program: Operational Accountability
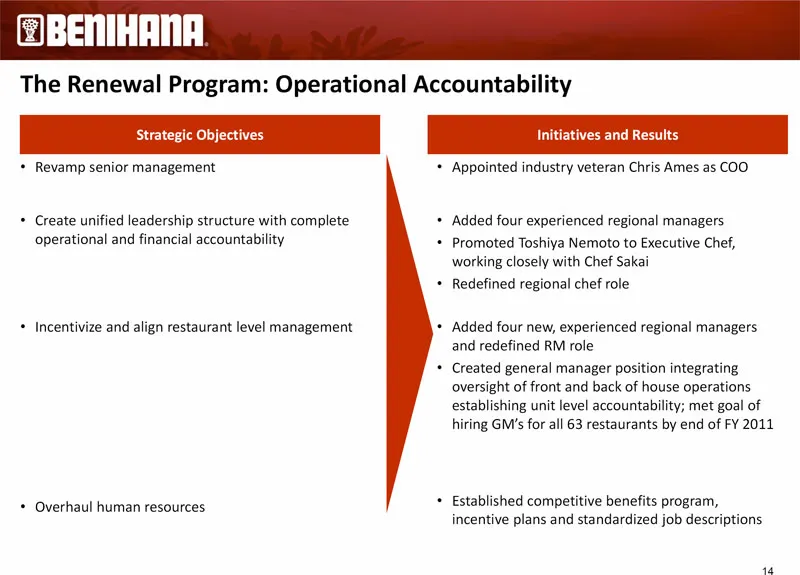
The Renewal Program: Operational Accountability Strategic Objectives Initiatives and Results • Revamp senior management • Appointed industry veteran Chris Ames as COO • Create unified leadership structure with complete • Added four experienced regional managers operational and financial accountabili
Slide 15: The Renewal Program: Corporate and Financial Controls
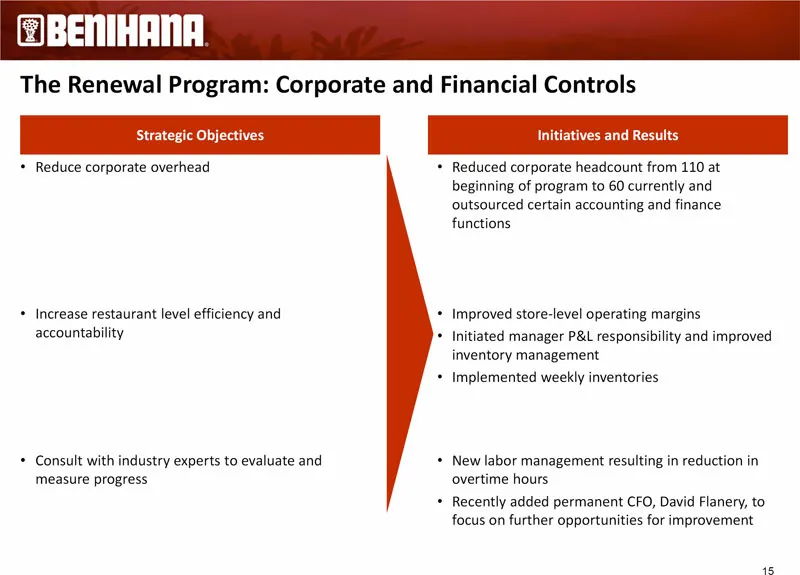
The Renewal Program: Corporate and Financial Controls Strategic Objectives Initiatives and Results • Reduce corporate overhead • Reduced corporate headcount from 110 at beginning of program to 60 currently and outsourced certain accounting and finance functions • Increase restaurant level efficiency
Slide 16: Marketing Strategy for Benihana Teppanyaki
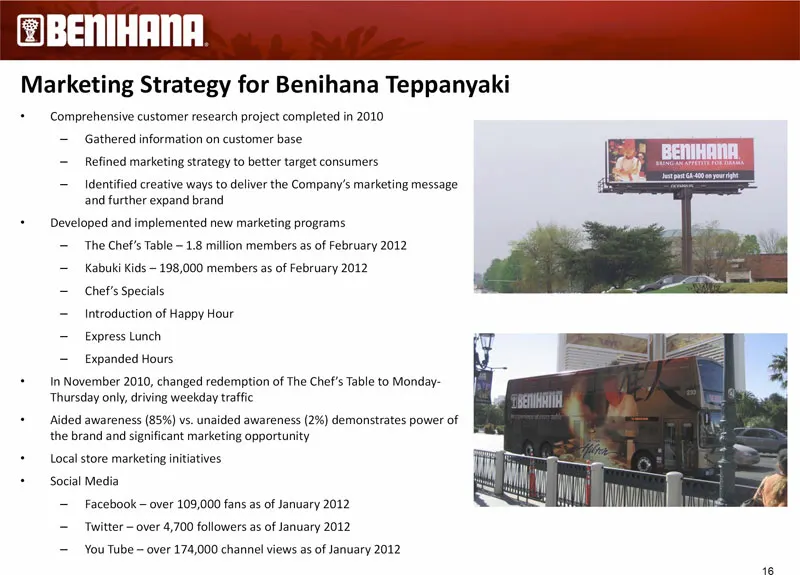
Marketing Strategy for Benihana Teppanyaki • Comprehensive customer research project completed in 2010 – Gathered information on customer base – Refined marketing strategy to better target consumers – Identified creative ways to deliver the Company’s marketing message and further expand brand • Deve
Slide 17: Impact of the Renewal Program through Q2-2012
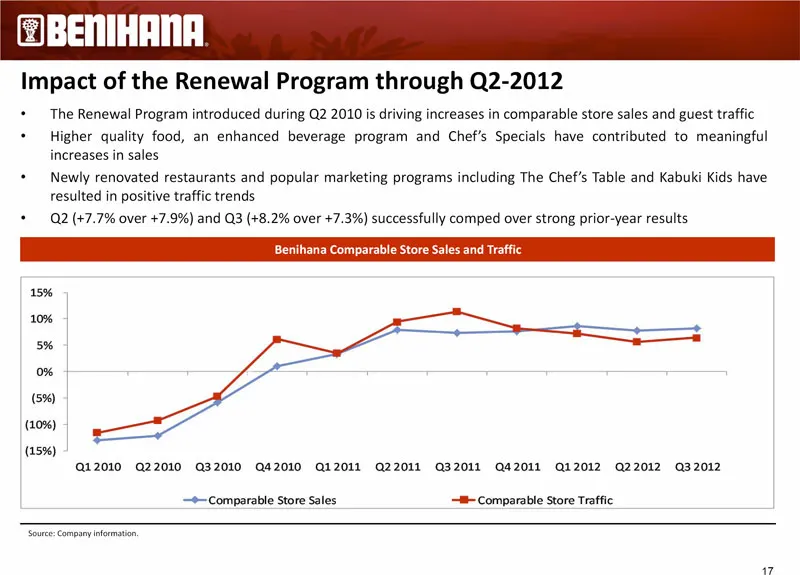
Impact of the Renewal Program through Q2-2012 • The Renewal Program introduced during Q2 2010 is driving increases in comparable store sales and guest traffic • Higher quality food, an enhanced beverage program and Chef’s Specials have contributed to meaningful increases in sales • Newly renovated r
Slide 18: Future Initiatives to Drive Additional Value
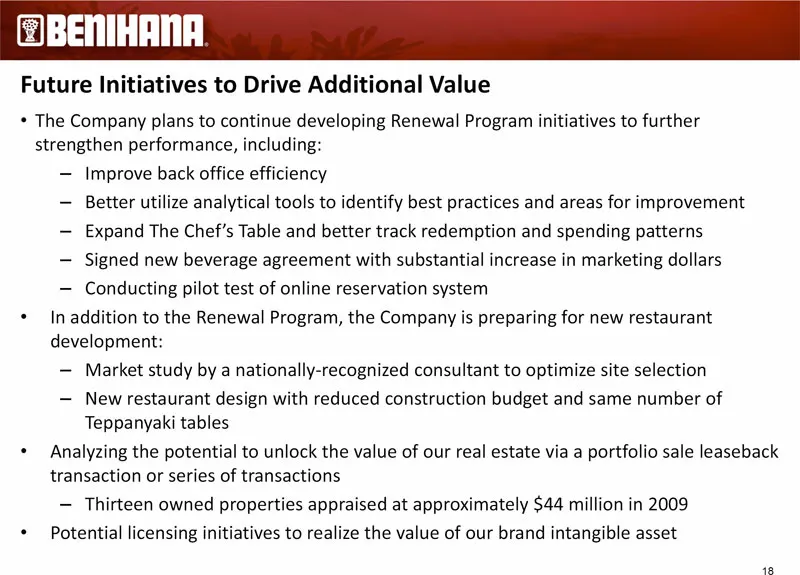
Future Initiatives to Drive Additional Value • The Company plans to continue developing Renewal Program initiatives to further strengthen performance, including: – Improve back office efficiency – Better utilize analytical tools to identify best practices and areas for improvement – Expand The Chef’
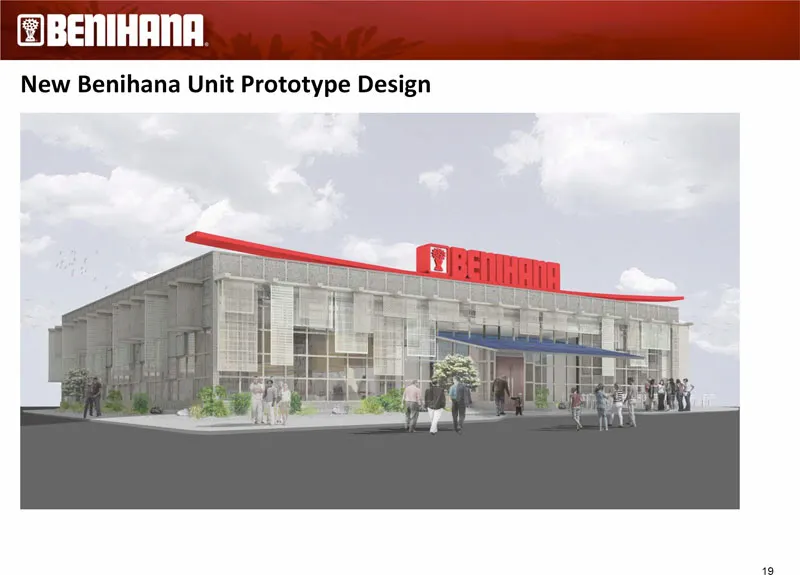
Slide 19: New Benihana Unit Prototype Design
New Benihana Unit Prototype Design 19
Slide 20: re Restaurant
re Restaurant Its more fun in the RA.
Slide 21: RA Sushi Overview
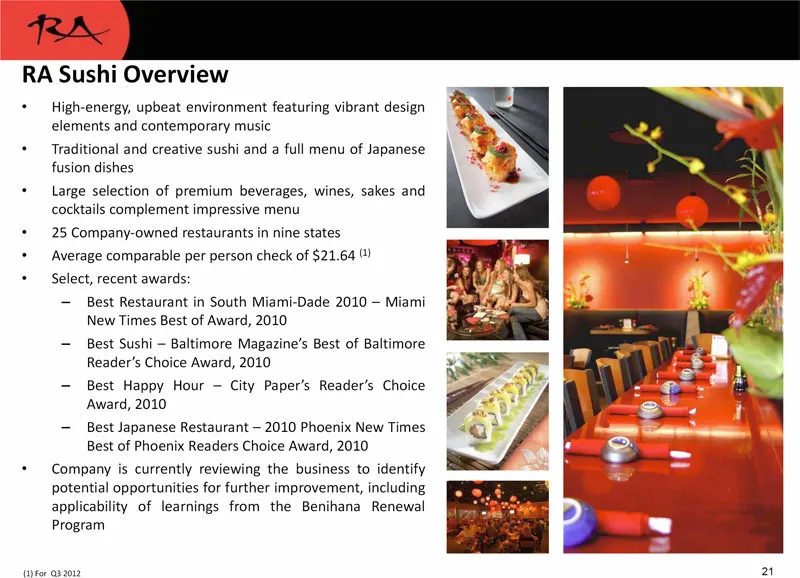
RA Sushi Overview • High-energy, upbeat environment featuring vibrant design elements and contemporary music • Traditional and creative sushi and a full menu of Japanese fusion dishes • Large selection of premium beverages, wines, sakes and cocktails complement impressive menu • 25 Company-owned res
Slide 22: RA Sushi Customer Demographics
(1) For Q3 2012 RA Sushi Customer Demographics • RA Sushi appeals to a broad demographic, including: – Diverse age and income spread – Equal mix of male and female guests • High-quality food is the primary driver of dining occasions and a vibrant happy hour supplements the brand’s profitable beverag
Slide 23: Differentiated Combination of Sushi and Energetic Environment
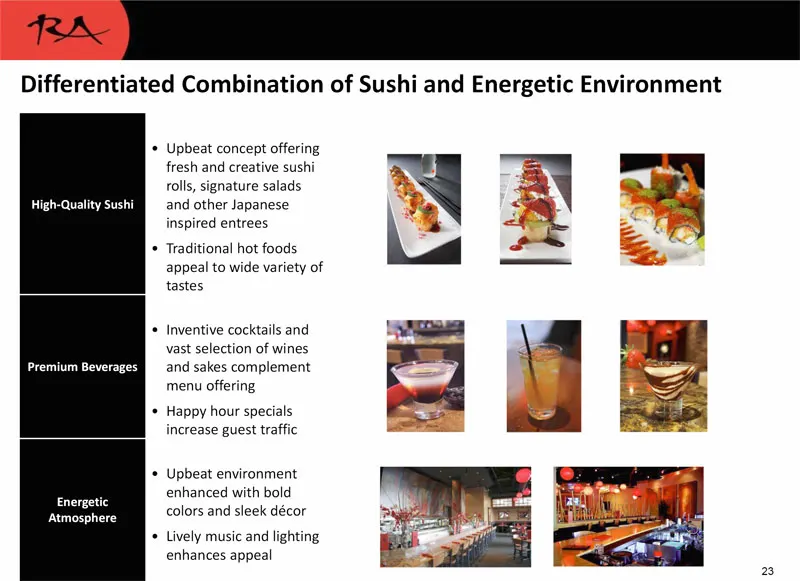
Differentiated Combination of Sushi and Energetic Environment • Upbeat concept offering fresh and creative sushi rolls, signature salads High-Quality Sushi and other Japanese inspired entrees • Traditional hot foods appeal to wide variety of tastes • Inventive cocktails and vast selection of wines P

Slide 24: 24
24
Slide 25: Haru Overview
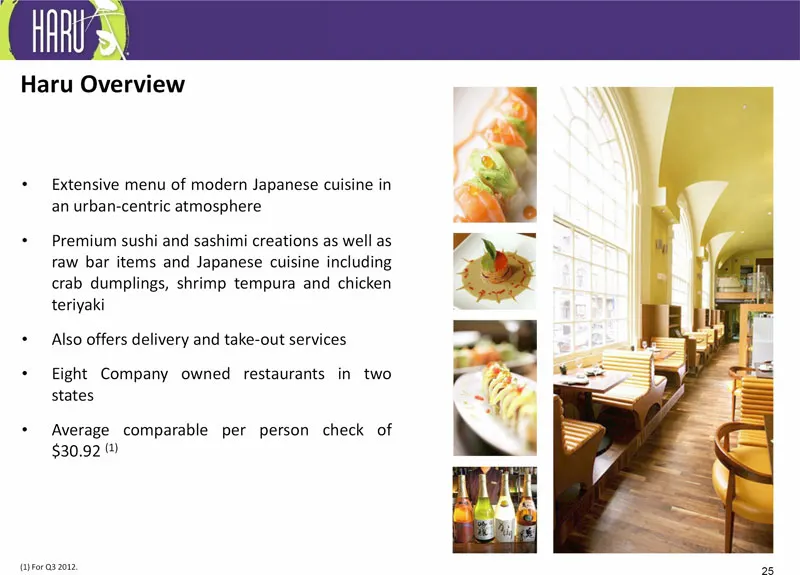
Haru Overview • Extensive menu of modern Japanese cuisine in an urban-centric atmosphere • Premium sushi and sashimi creations as well as raw bar items and Japanese cuisine including crab dumplings, shrimp tempura and chicken teriyaki • Also offers delivery and take-out services • Eight Company owne
Slide 26: Haru Customer Demographics
Haru Customer Demographics • Broad guest profile: – Premium sushi appeals to wide range of guests – Urban-centric locations attract young adults – Slightly higher male skew • Urban locations drive skew toward weekday dining and evening dining occasions • Take-out services approximately 33% of total
Slide 27: Premium Sushi in a Modern, Urban-Centric Atmosphere
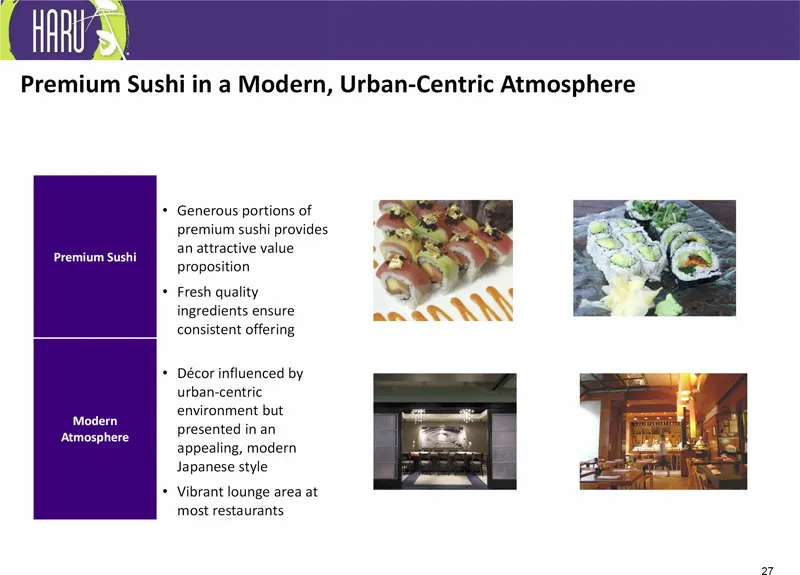
Premium Sushi in a Modern, Urban-Centric Atmosphere • Generous portions of premium sushi provides an attractive value Premium Sushi proposition • Fresh quality ingredients ensure consistent offering • Décor influenced by urban-centric environment but Modern presented in an Atmosphere appealing, mode
Slide 28: Investment Considerations
Investment Considerations 28
Slide 29: Investment Considerations
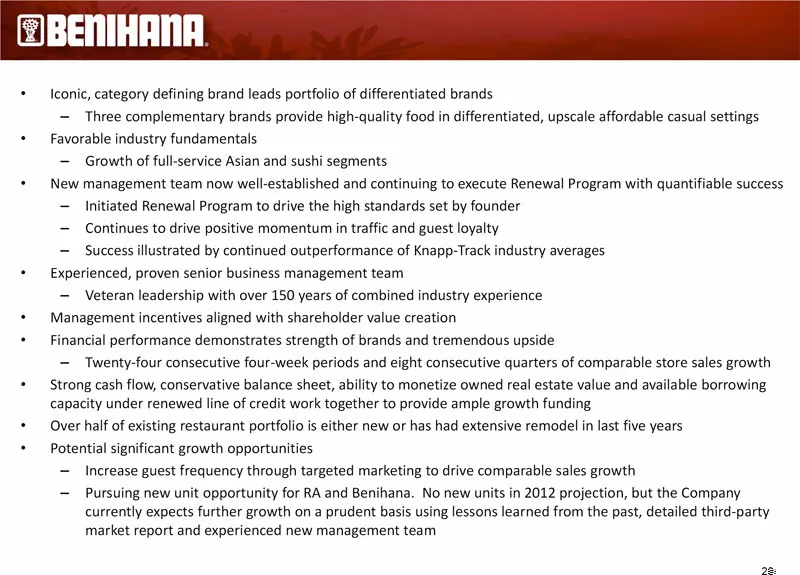
• Iconic, category defining brand leads portfolio of differentiated brands – Three complementary brands provide high-quality food in differentiated, upscale affordable casual settings • Favorable industry fundamentals – Growth of full-service Asian and sushi segments • New management team now well-e
Slide 30: Recent Capital Structure Developments
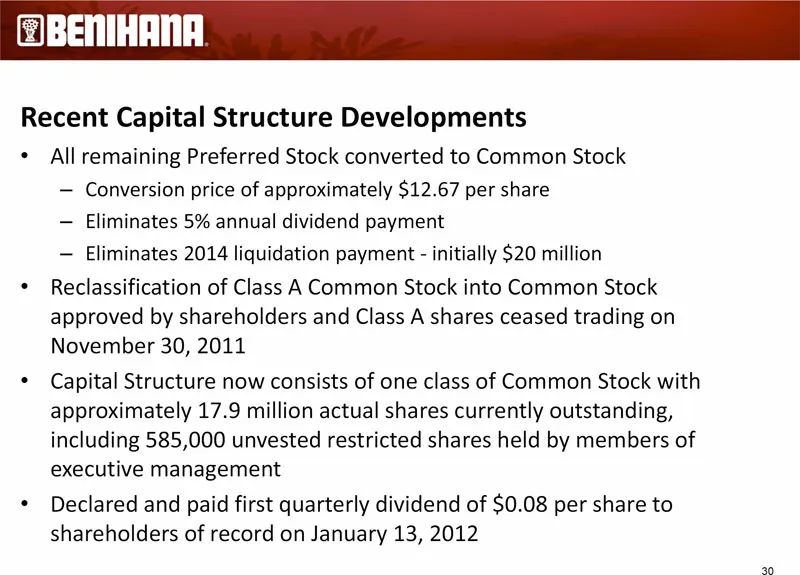
Recent Capital Structure Developments • All remaining Preferred Stock converted to Common Stock – Conversion price of approximately $12.67 per share – Eliminates 5% annual dividend payment – Eliminates 2014 liquidation payment -initially $20 million • Reclassification of Class A Common Stock into Co
Slide 31: Five-Year CapEx Review by Category
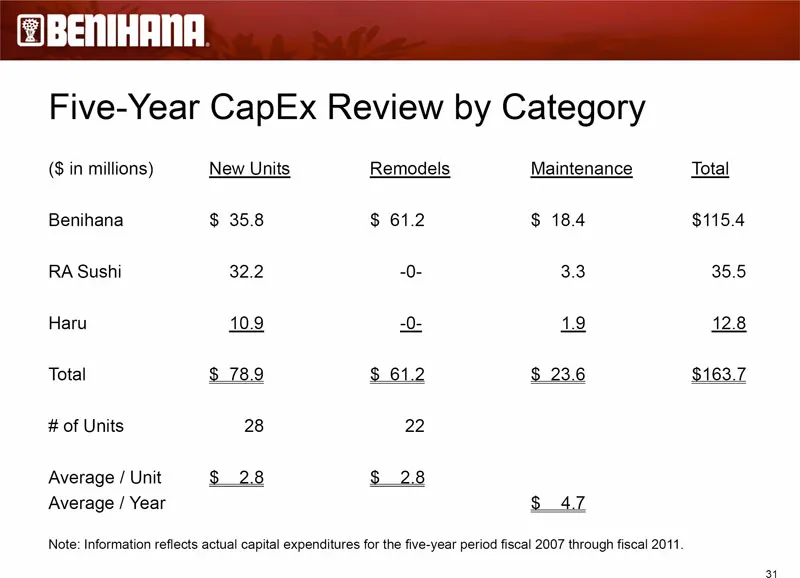
Five-Year CapEx Review by Category ($ in millions) New Units Remodels Maintenance Total Benihana $ 35.8 $ 61.2 $ 18.4 $115.4 RA Sushi 32.2 -0- 3.3 35.5 Haru 10.9 -0- 1.9 12.8 Total $ 78.9 $ 61.2 $ 23.6 $163.7 # of Units 28 22 Average / Unit $ 2.8 $ 2.8 Average / Year $ 4.7 Note: Information reflects
Slide 32: Growth Opportunities
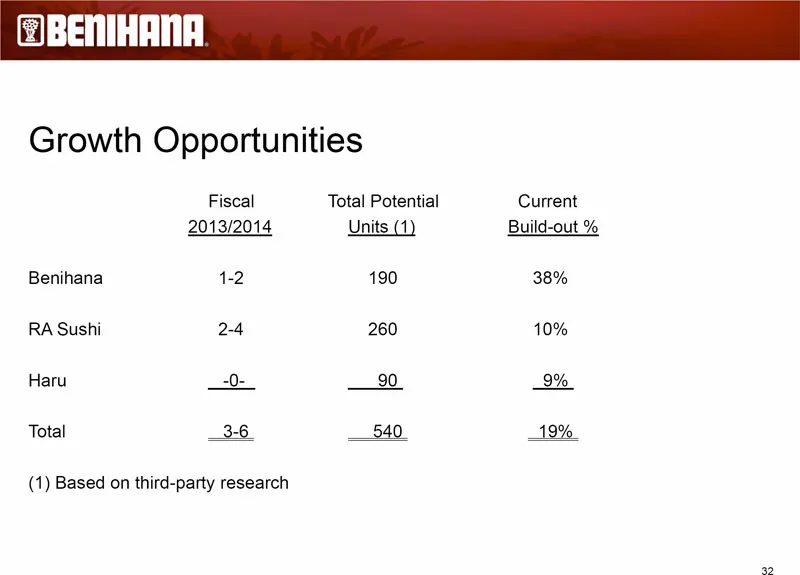
Growth Opportunities Fiscal Total Potential Current 2013/2014 Units (1) Build-out % Benihana 1-2 190 38% RA Sushi 2-4 260 10% Haru -0- 90 9% Total 3-6 540 19% (1) Based on third-party research 32

Slide 33: Financial Highlights
@)BENIHANA, Financial Highlights
Slide 34: Historical Revenue Summary
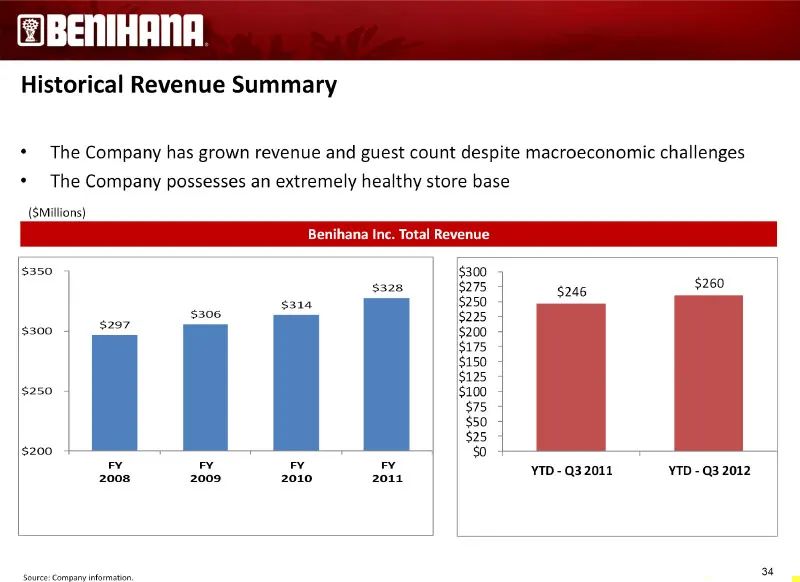
Historical Revenue Summary • The Company has grown revenue and guest count despite macroeconomic challenges • The Company possesses an extremely healthy store base ($Millions) Benihana Inc. Total Revenue 34
Slide 35: Comparable Store Sales
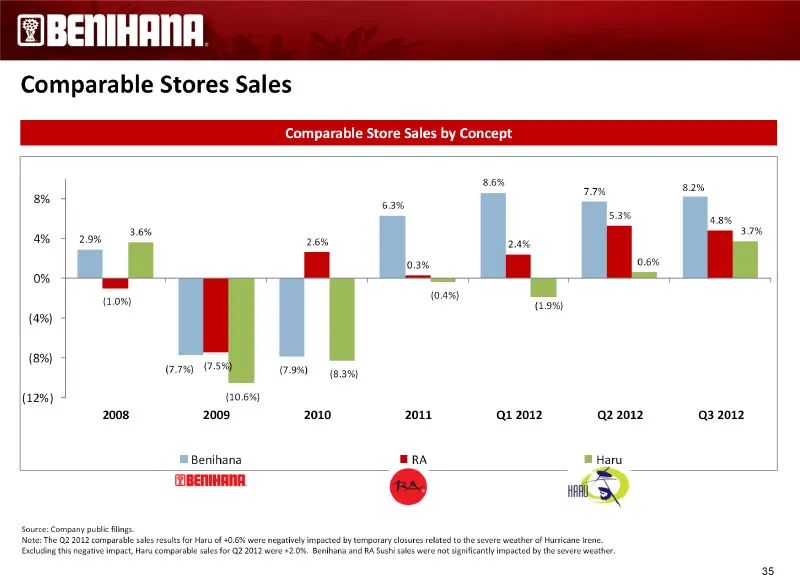
Source: Company information. Comparable Stores Sales Comparable Store Sales by Concept Source: Company public filings. Note: The Q2 2012 comparable sales results for Haru of +0.6% were negatively impacted by temporary closures related to the severe weather of Hurricane Irene. Excluding this negative
Slide 36: YTD Q3-2012 Highlights
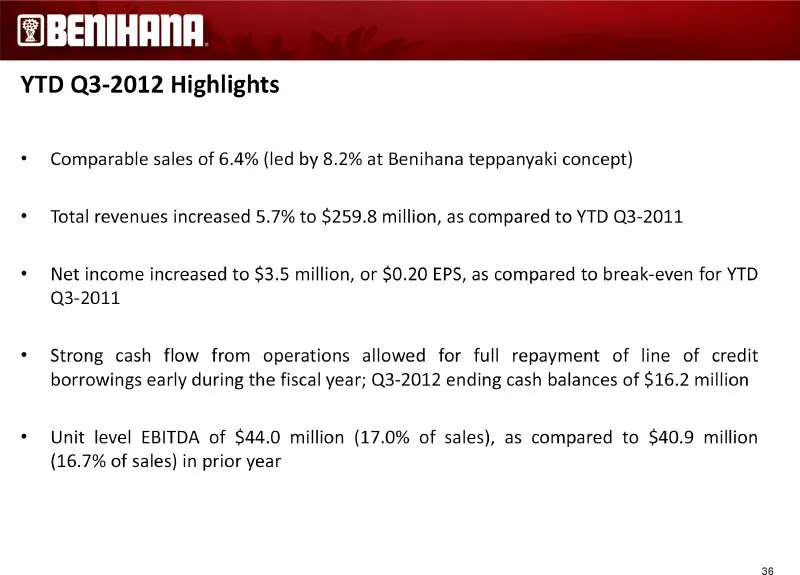
YTD Q3-2012 Highlights • Comparable sales of 6.4% (led by 8.2% at Benihana teppanyaki concept) • Total revenues increased 5.7% to $259.8 million, as compared to YTD Q3-2011 • Net income increased to $3.5 million, or $0.20 EPS, as compared to break-even for YTD Q3-2011 • Strong cash flow from operati

Slide 37: Supplemental Information
Supplemental Information 37
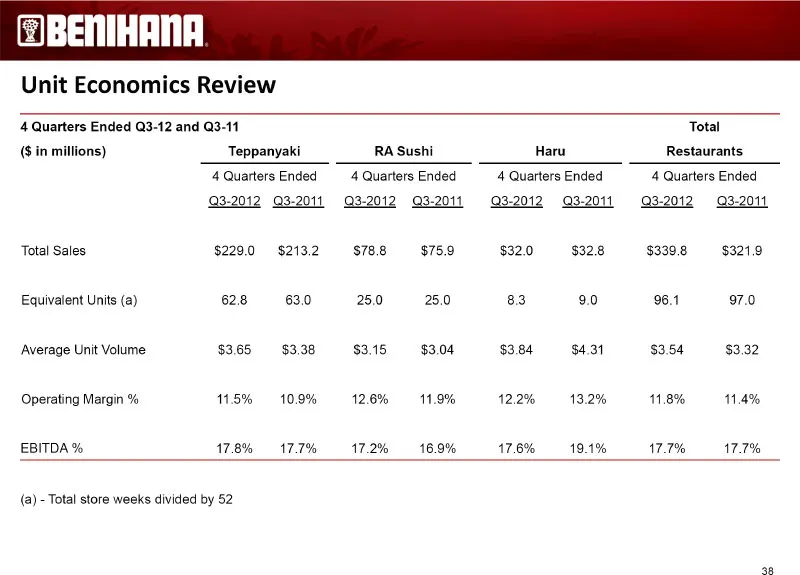
Slide 38: Unit Economics Review
Unit Economics Review 4 Quarters Ended Q3-12 and Q3-11 Total ($ in millions) Teppanyaki RA Sushi Haru Restaurants 4 Quarters Ended 4 Quarters Ended 4 Quarters Ended 4 Quarters Ended Q3-2012 Q3-2011 Q3-2012 Q3-2011 Q3-2012 Q3-2011 Q3-2012 Q3-2011 Total Sales $229.0 $213.2 $78.8 $75.9 $32.0 $32.8 $339
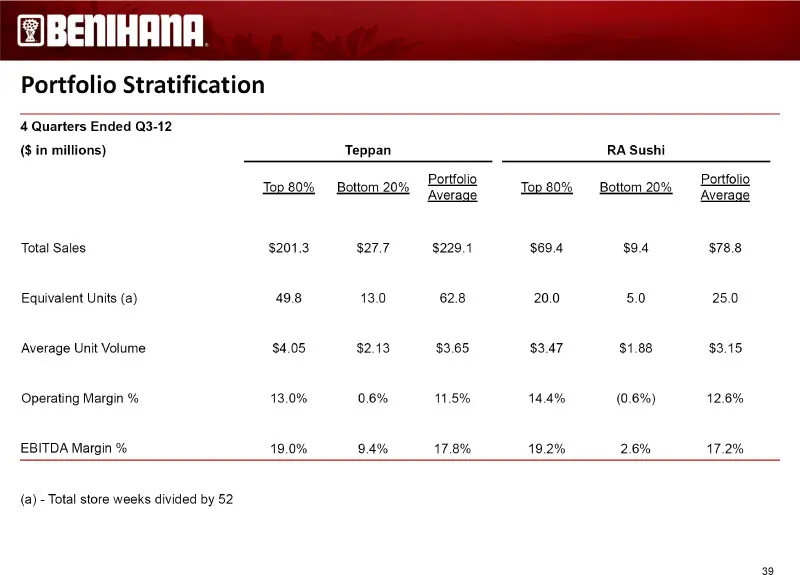
Slide 39: Portfolio Stratification
Portfolio Stratification 4 Quarters Ended Q3-12 ($ in millions) Teppan RA Sushi Portfolio Portfolio Top 80% Bottom 20% Top 80% Bottom 20% Average Average Total Sales $201.3 $27.7 $229.1 $69.4 $9.4 $78.8 Equivalent Units (a) 49.8 13.0 62.8 20.0 5.0 25.0 Average Unit Volume $4.05 $2.13 $3.65 $3.47 $1.
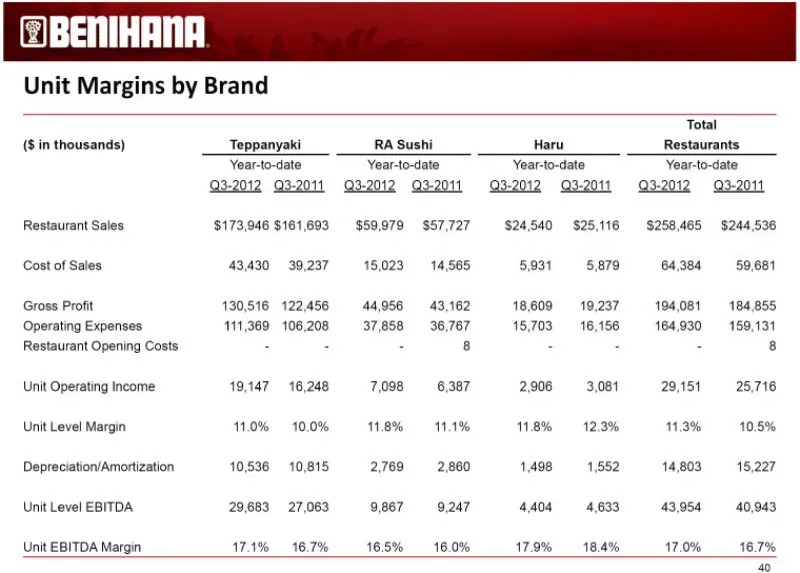
Slide 40: Unit Margins by Brand
Unit Margins by Brand Total ($ in thousands) Teppanyaki RA Sushi Haru Restaurants Year-to-date Year-to-date Year-to-date Year-to-date Q3-2012 Q3-2011 Q3-2012 Q3-2011 Q3-2012 Q3-2011 Q3-2012 Q3-2011 Restaurant Sales $173,946 $161,693 $59,979 $57,727 $24,540 $25,116 $258,465 $244,536 Cost of Sales 43,
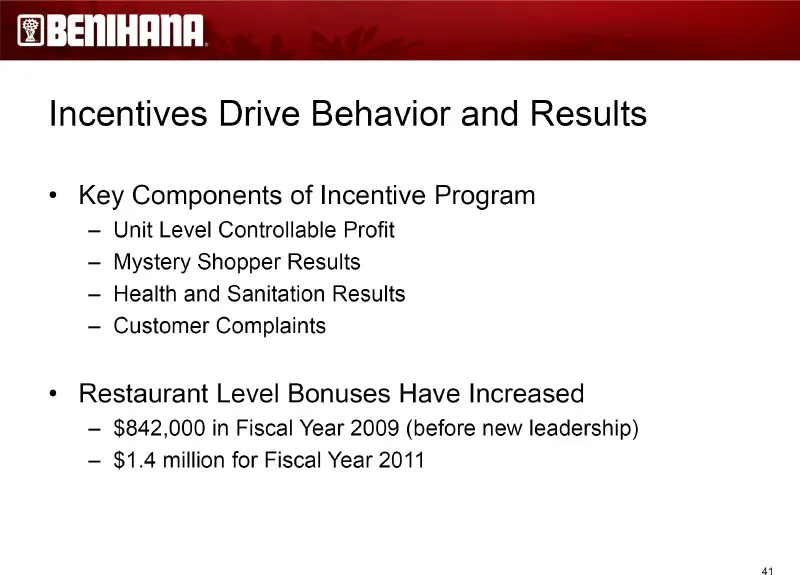
Slide 41: Incentives Drive Behavior and Results
Incentives Drive Behavior and Results • Key Components of Incentive Program – Unit Level Controllable Profit – Mystery Shopper Results – Health and Sanitation Results – Customer Complaints • Restaurant Level Bonuses Have Increased – $842,000 in Fiscal Year 2009 (before new leadership) – $1.4 million
Slide 42: Non-Beverage Commodity Costs
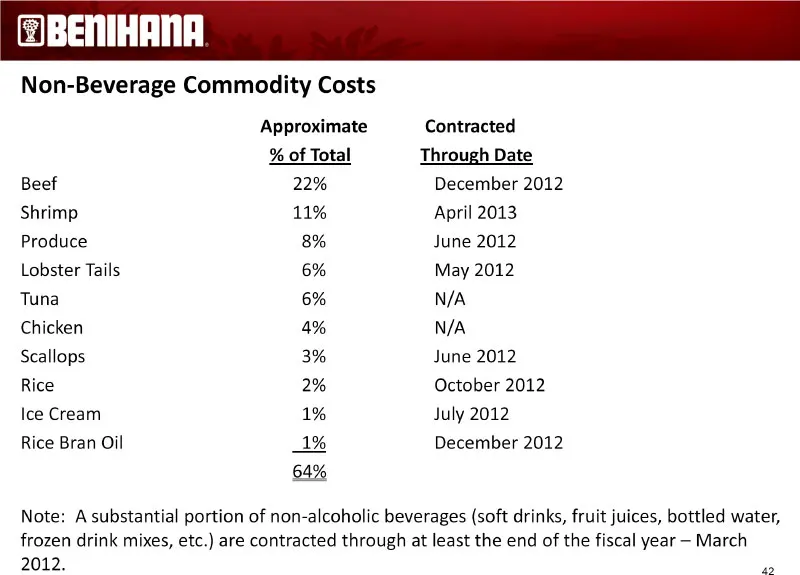
Non-Beverage Commodity Costs Approximate Contracted % of Total Through Date Beef 22% December 2012 Shrimp 11% April 2013 Produce 8% June 2012 Lobster Tails 6% May 2012 Tuna 6% N/A Chicken 4% N/A Scallops 3% June 2012 Rice 2% October 2012 Ice Cream 1% July 2012 Rice Bran Oil 1% December 2012 64% Note
Slide 43: General & Administrative Expenses
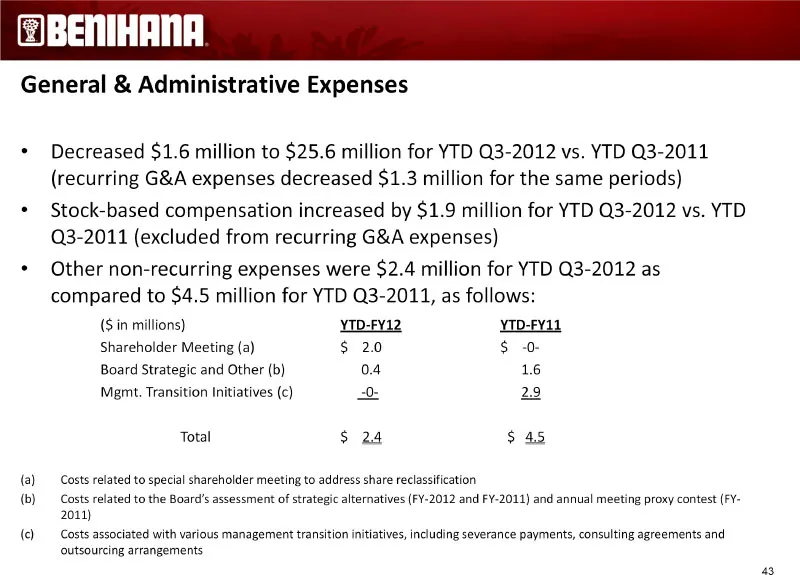
General & Administrative Expenses • Decreased $1.6 million to $25.6 million for YTD Q3-2012 vs. YTD Q3-2011 (recurring G&A expenses decreased $1.3 million for the same periods) • Stock-based compensation increased by $1.9 million for YTD Q3-2012 vs. YTD Q3-2011 (excluded from recurring G&A expenses)
Slide 44: Restricted Stock Awards (RSAs)
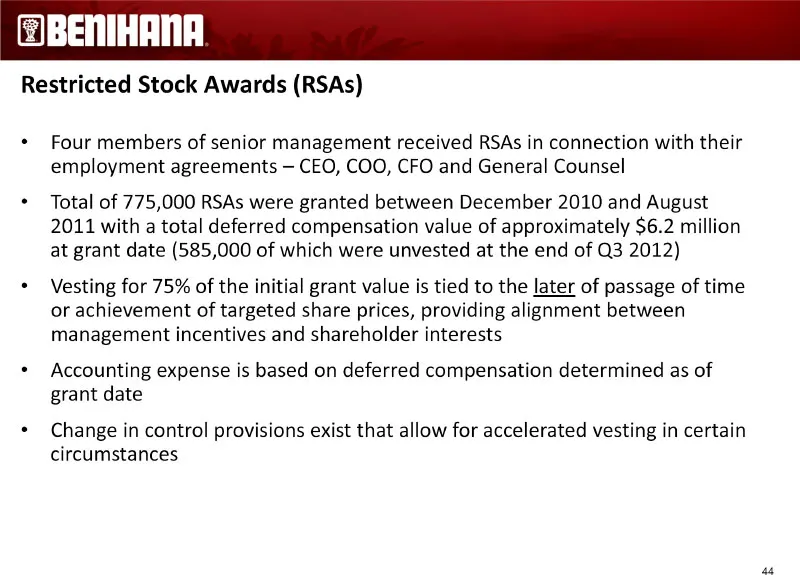
Restricted Stock Awards (RSAs) • Four members of senior management received RSAs in connection with their employment agreements – CEO, COO, CFO and General Counsel • Total of 775,000 RSAs were granted between December 2010 and August 2011 with a total deferred compensation value of approximately $6.
Slide 45: Restricted Stock Awards – Vesting and Expense Recognition
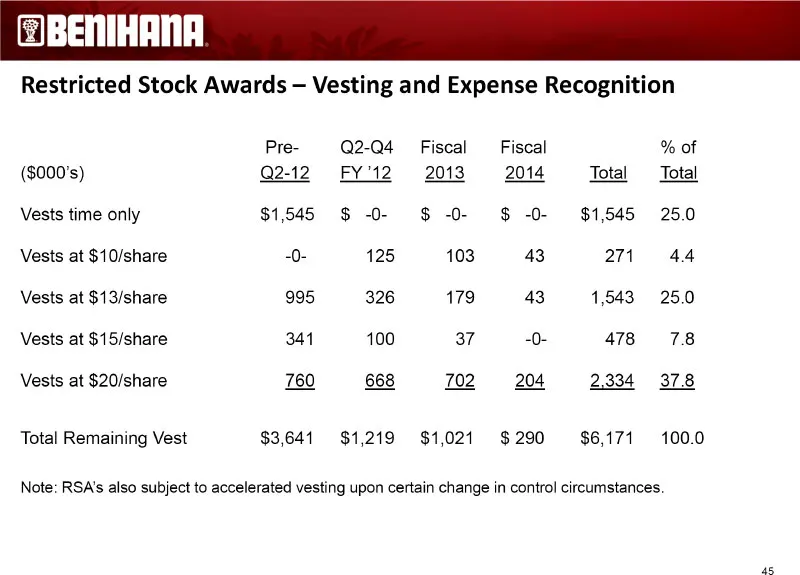
Restricted Stock Awards – Vesting and Expense Recognition Pre- Q2-Q4 Fiscal Fiscal % of ($000’s) Q2-12 FY ‘12 2013 2014 Total Total Vests time only $1,545 $ -0- $ -0- $ -0- $1,545 25.0 Vests at $10/share -0- 125 103 43 271 4.4 Vests at $13/share 995 326 179 43 1,543 25.0 Vests at $15/share 341 100 3
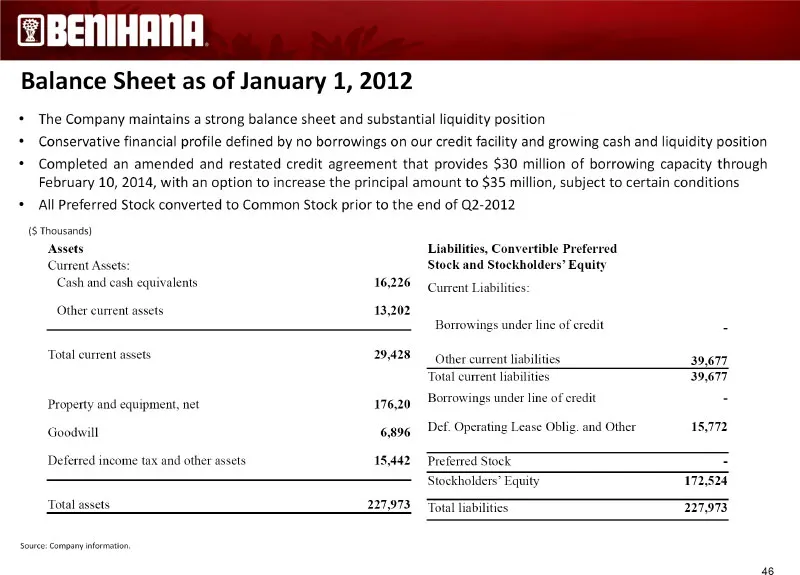
Slide 46: Balance Sheet as of January 1, 2012
Balance Sheet as of January 1, 2012 • The Company maintains a strong balance sheet and substantial liquidity position • Conservative financial profile defined by no borrowings on our credit facility and growing cash and liquidity position • Completed an amended and restated credit agreement that pro
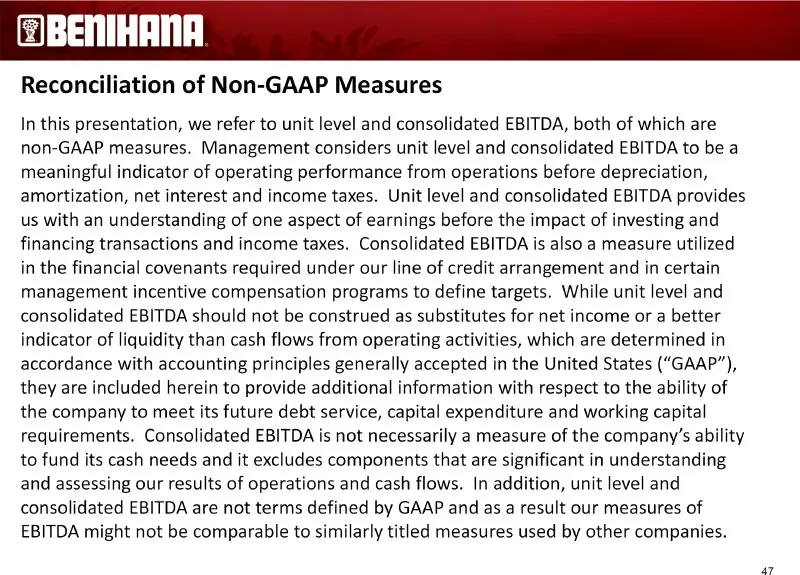
Slide 47: Reconciliation of Non-GAAP Measures
Reconciliation of Non-GAAP Measures In this presentation, we refer to unit level and consolidated EBITDA, both of which are non-GAAP measures. Management considers unit level and consolidated EBITDA to be a meaningful indicator of operating performance from operations before depreciation, amortizati
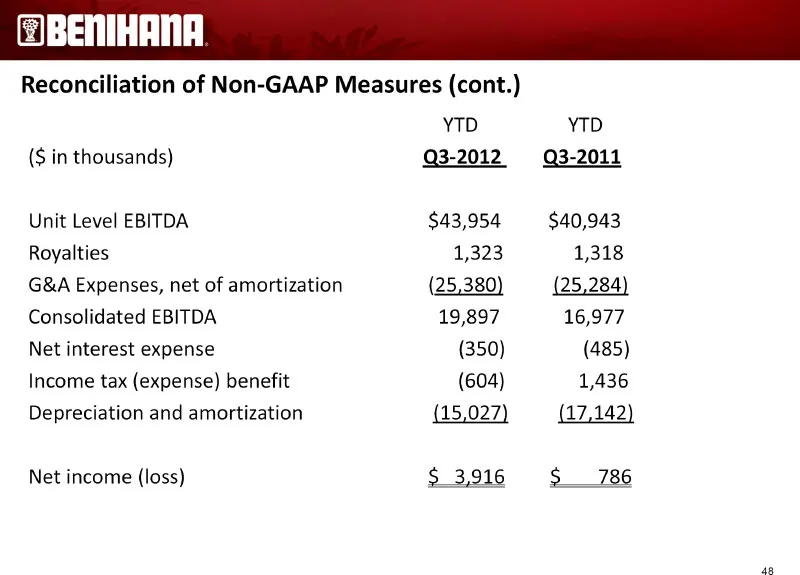
Slide 48: Reconciliation of Non-GAAP Measures (cont.)
Reconciliation of Non-GAAP Measures (cont.) YTD YTD ($in thousands) Q3-2012 Q3-2011 Unit Level EBITDA $43,954 $40,943 Royalties 1,323 1,318 G&A Expenses, net of amortization (25,380) (25,284) Consolidated EBITDA 19,897 16,977 Net interest expense (350) (485) Income tax (expense) benefit (604) 1,436
Source: SEC EDGAR · 8-K filed Feb 29, 2012
More decks from Benihana Inc
 Investor Presentation (December 2011)48 slides · Dec 12, 2011
 Investor Presentation (September 2011)50 slides · Sep 23, 2011
 Investor Presentation (September 2011)47 slides · Sep 13, 2011
 Proxy Contest (August 2011)11 slides · Aug 17, 2011
 Proxy Contest (September 2010)25 slides · Sep 14, 2010
 Investor Presentation (August 2006)32 slides · Aug 3, 2006