Southern Community Financial Corp
Southern Community Financial — KBW Investor Conference 2010
30 slides from Southern Community Financial's conference presentation, Jul 27, 2010
Slide 1: KBW Investor Conference
KBW Investor Conference uly 2010
Slide 2: Forward-looking statements
This presentation may contain, in addition to historical information, various “forward-looking atements” that represent our judgment concerning the future and are subject to ris uncertainties that could cause Southern Community's actual operating results and financial position to differ materially f
Slide 3: Corporate Profile
Corporate Profile
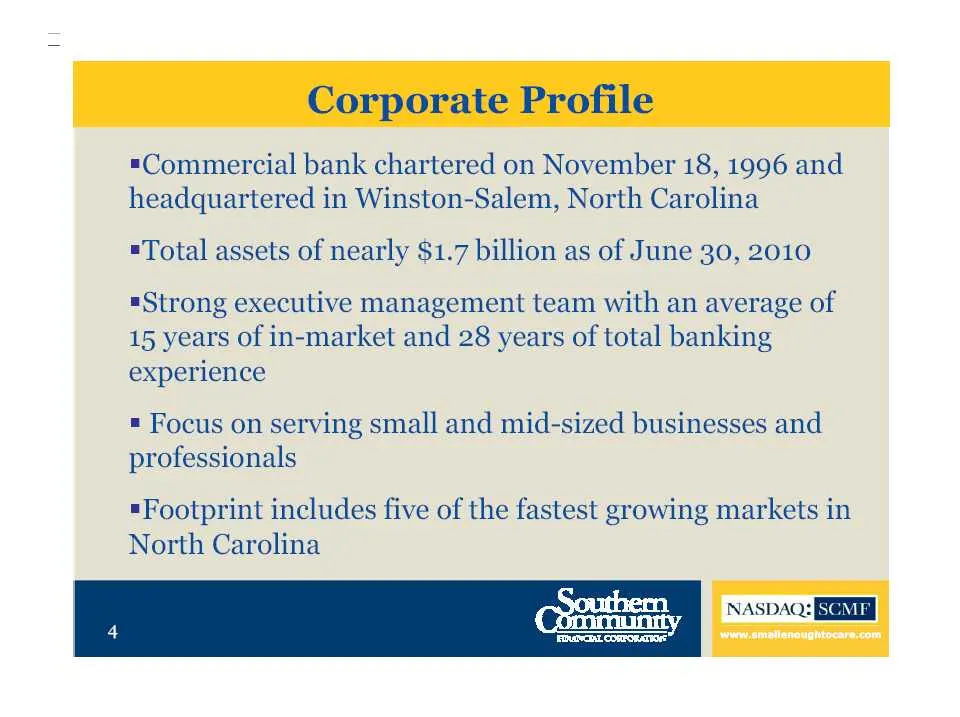
Slide 4: Commercial bank headquartered in Winston-Salem, North Carolina
"Commercial bank chartered on November 18, 1996 and headquartered in Winston-Salem, North Carolina =Total assets of nearly $1.7 billion as of June 30, 2010 =Strong executive management team with an average of 15 years of in-market and 28 years of total banking experience = Focus on serving small and
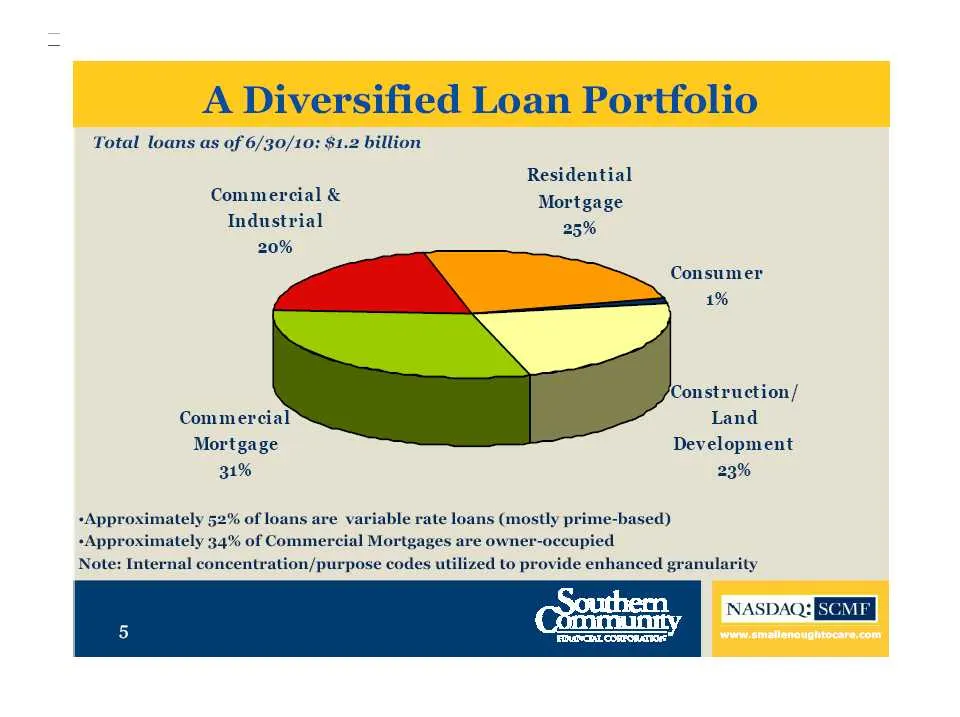
Slide 5: A Diversified Loan Portfolio
A Diversified Loan Portfolio Total loans as of 6/30/10: $1.2 billion Residential Commercial & Mortgage Industrial 25% 20% Consumer 1% Construction/ Commercial Land Mortgage Development 31% 23% +Approximately 52% of loans are variable rate loans (mostly prime-based) +Approximately 34% of Commercial M
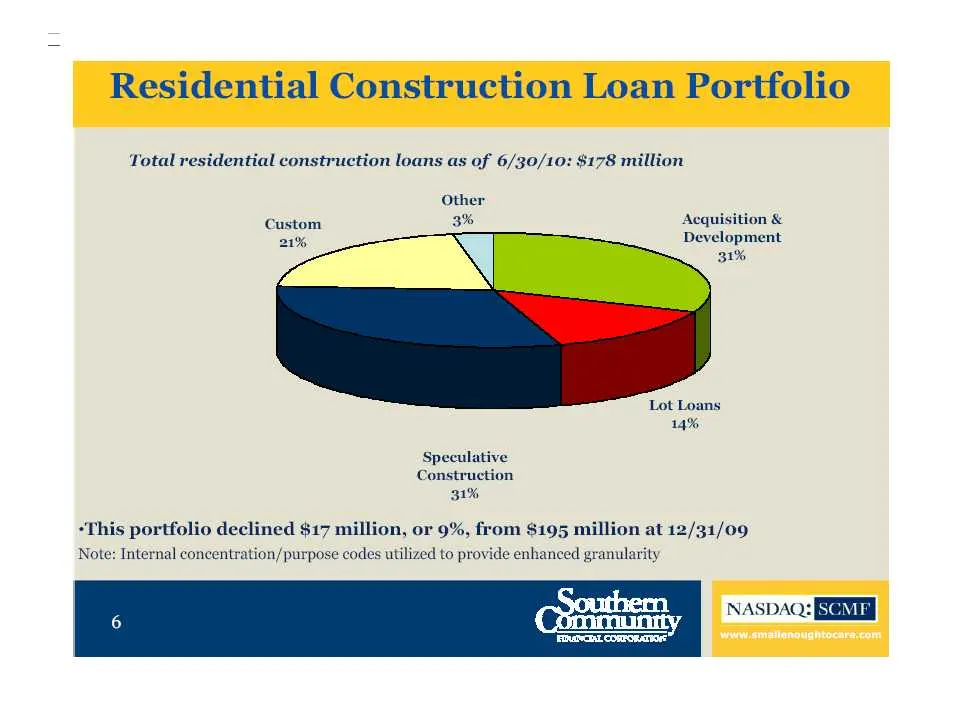
Slide 6: Residential Construction Loan Portfolio
Residential Construction Loan Portfolio Total residential construction loans as of 6/30/10: $178 million Other Custom 3% 21% sition & lopment 31% Lot Loans 14% Speculative Construction 31% -This portfolio declined $17 million, or 9%, from $195 million at 12/31/09 Note: Internal concentration/ purpos
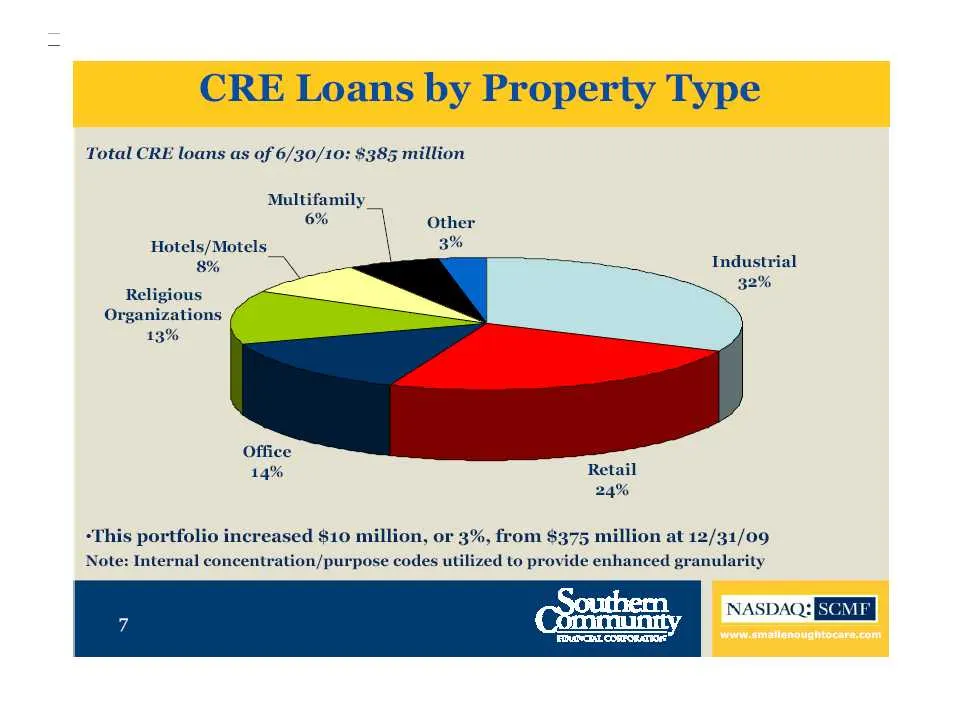
Slide 7: CRE Loans by Property Type
CRE Loans by Property Type Total CRE loans as of 6/30/10: $385 million Multifamily _ 6% \ Other SS Hotels/Motels _ 8% Industrial 32% Religious Organizations 13% Office 14% Retail 24% -This portfolio increased $10 million, or 3%, from $375 million at 12/31/09 Note: Internal concentration/purpose code
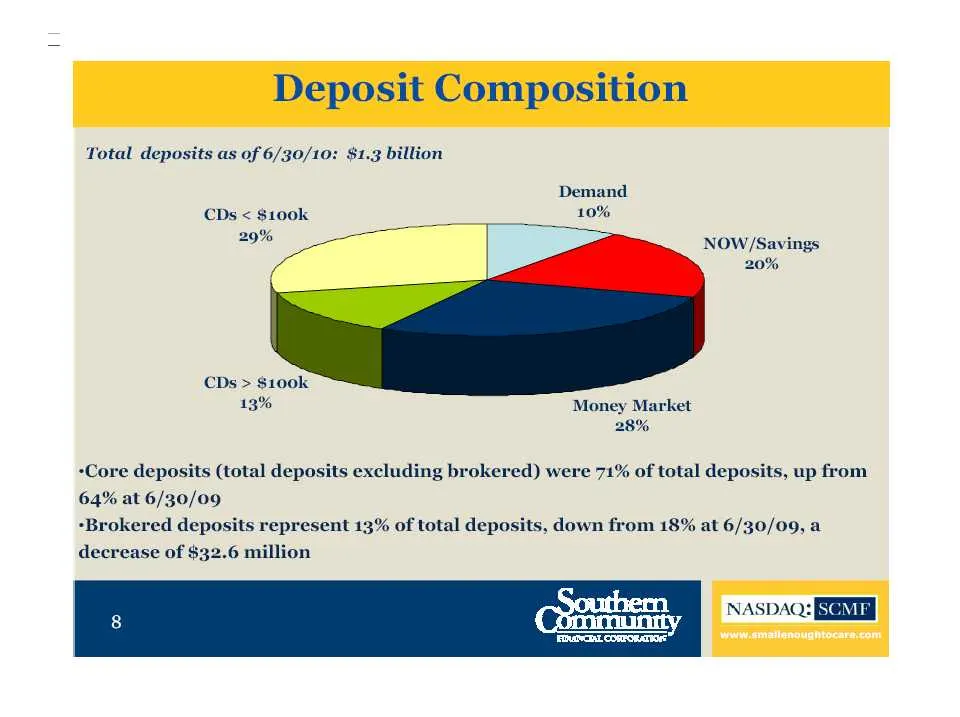
Slide 8: Total deposits as of 6/30/10: $1.3 billion
Total deposits as of 6/30/10: $1.3 billion Demand CDs < $100k 10% 29% NOW/Savings 20% CDs > $100k 13% Money Market 28% -Core deposits (total deposits excluding brokered) were 71% of total deposits, up from 64% at 6/30/09 -Brokered deposits represent 13% of total deposits, down from 18% at 6/30/09, a
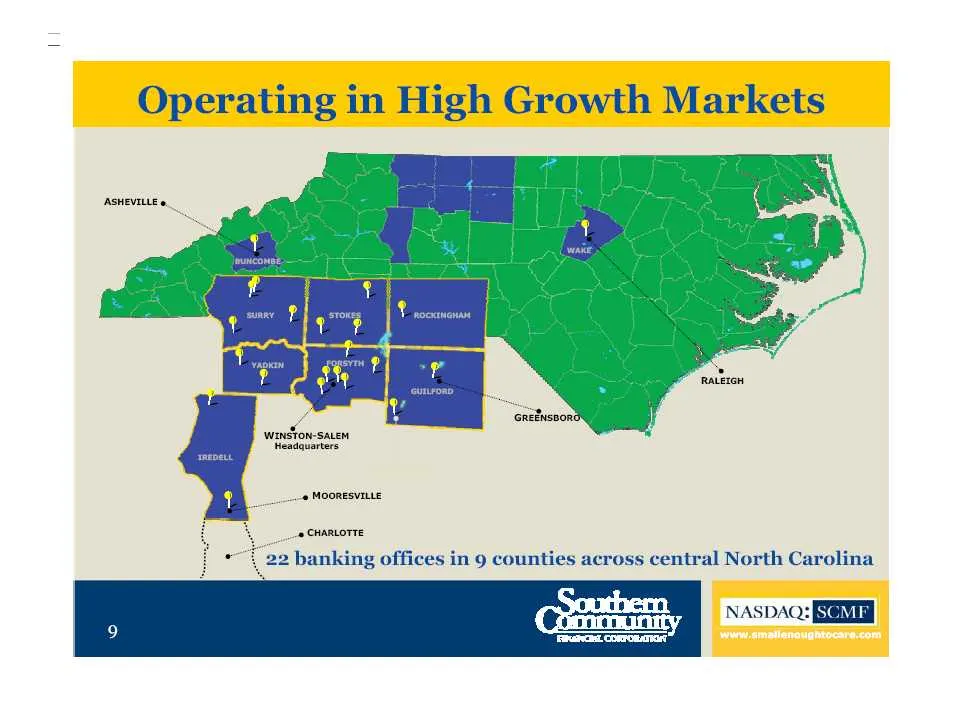
Slide 9: Operating in High Growth Markets
Operating in High Growth Markets ASHEVILLE «, wingfon-SALeM Headquarters. _-# MOORESVILLE s Chantorte & banking offices in 9 counties across central North Carolina a: ) aaa 9
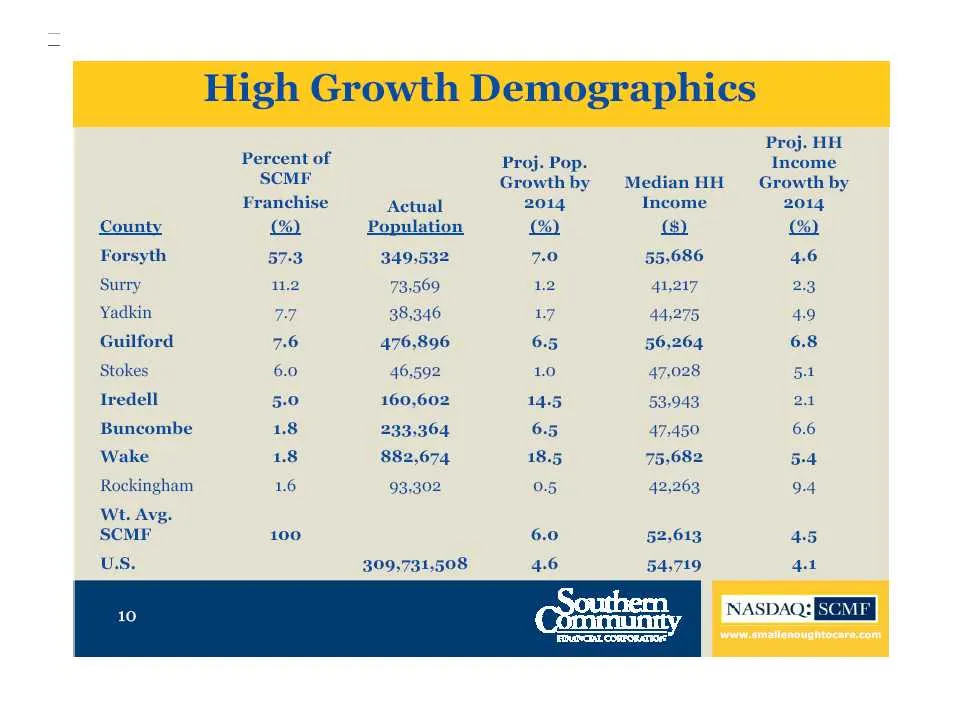
Slide 10: Market demographics by county
Proj. HH Percent of Proj. Pop. Income SCMF Growthby MedianHH — Growth by Franchise Actual 2014 Income 2014 County (26) Population % Forsyth 57:3 349.532 7.0 55,686 Surry 1.2 73569 12 41,217 Yadkin 7 38,346 17 44,275 Guilford 7.6 476,896 6.5 56,264 Stokes 6.0 46,592 1.0 47,028 5A Iredell 5.0 160,602
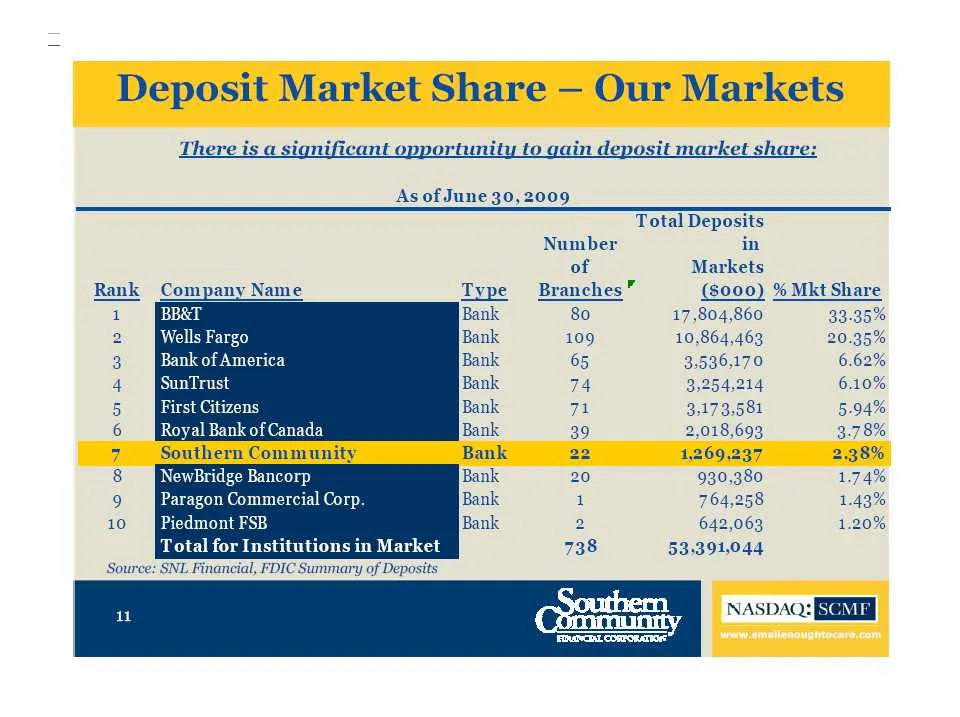
Slide 11: Deposit Market Share — Our Markets
Deposit Market Share — Our Markets There is a significant opportunity to gain deposit market share: As of June 30,2009 Total Deposits Number in of Markets Rank Company Name Type Branches” (S000) % Mkt Share 1 BB&T Bank 80 17,804,860 33-35% 2 Wells Fargo Bank 109 10,864,463 20.35% Eve Bank of America
Slide 12: Our Strategy
Our Strategy
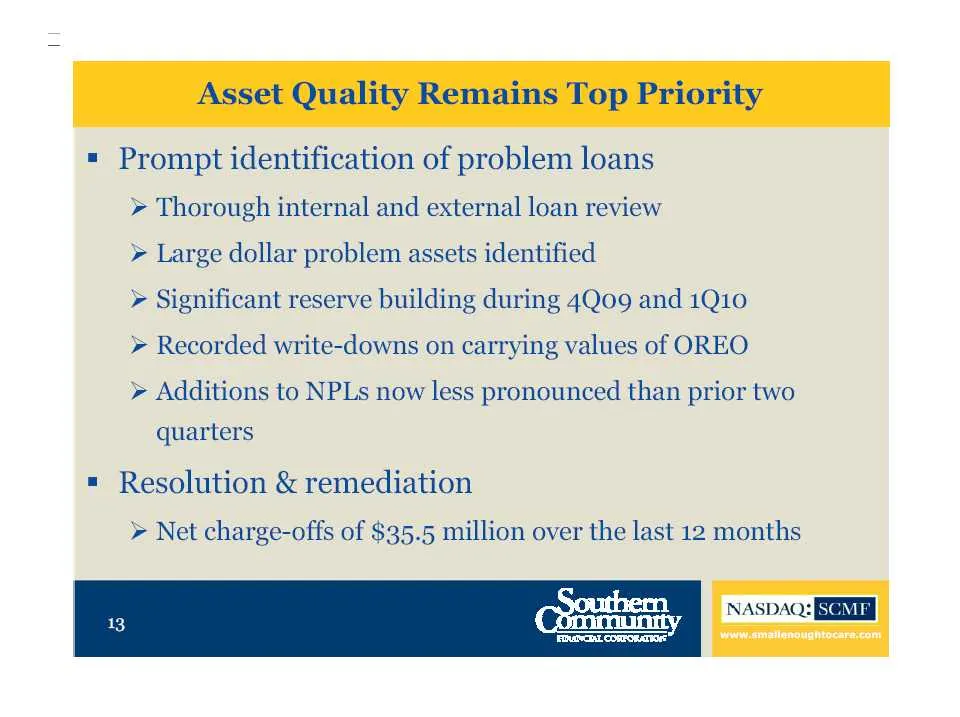
Slide 13: Prompt identification of problem loans
= Prompt identification of problem loans > Thorough internal and external loan review > Large dollar problem assets identified > Significant reserve building during 4Qo9 and 1Q10 > Recorded write-downs on carrying values of OREO > Additions to NPLs now less pronounced than prior two quarters = Resol
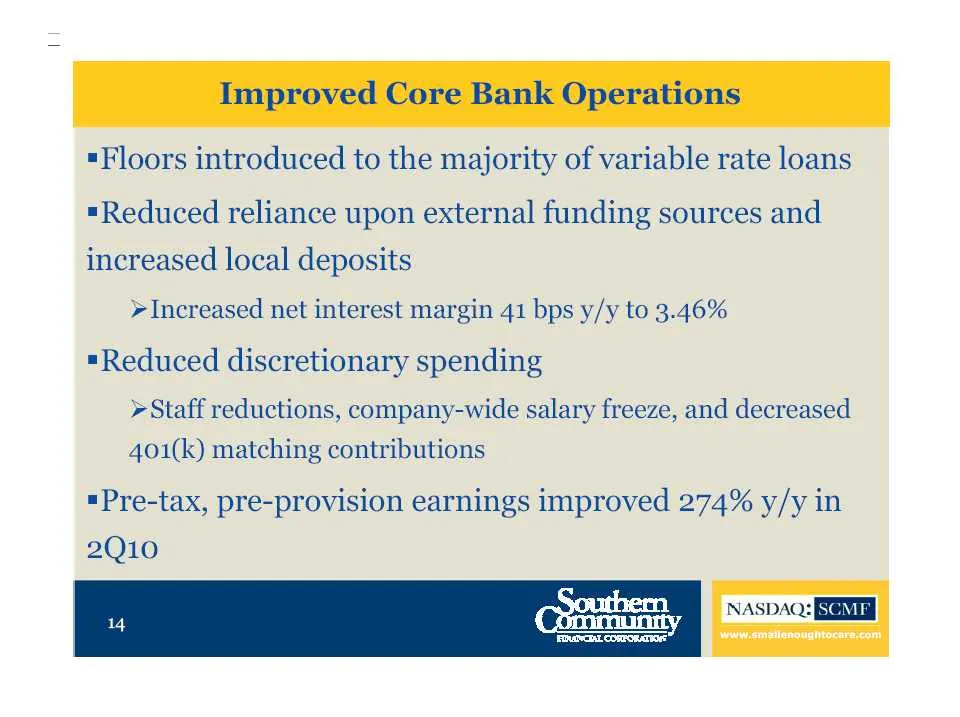
Slide 14: Floors introduced to variable rate loans
Floors introduced to the majority of variable rate loans "Reduced reliance upon external funding sources and increased local deposits > Increased net interest margin 41 bps y/y to 3.46% *Reduced discretionary spending > Staff reductions, company-wide salary freeze, and decreased 401(k) matching cont
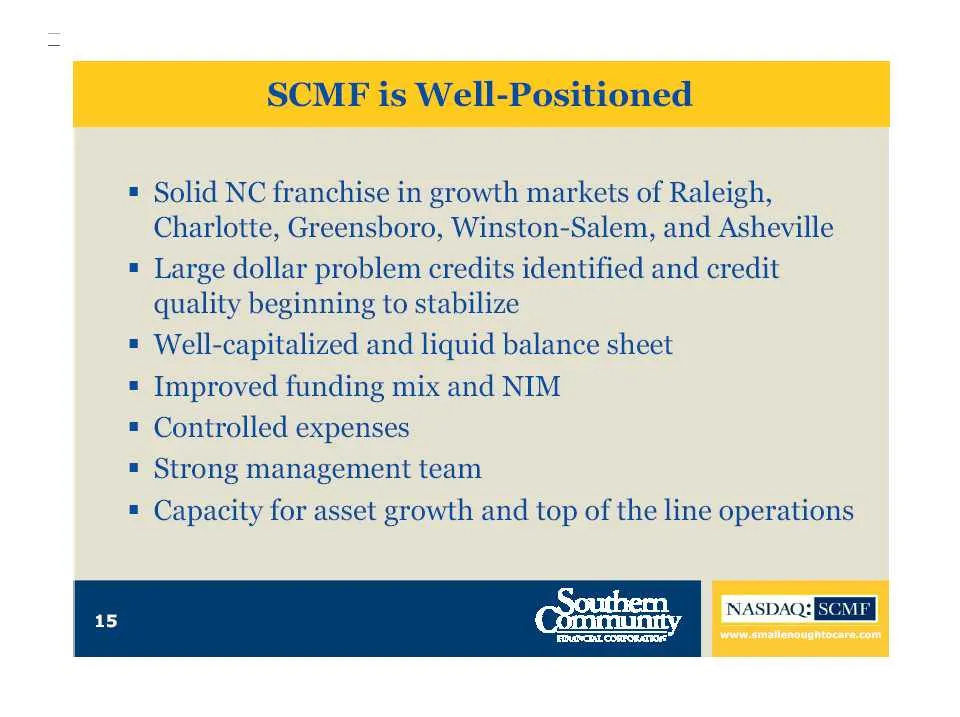
Slide 15: Investment highlights
= Solid NC franchise in growth markets of Raleigh, Charlotte, Greensboro, Winston-Salem, and Asheville " Large dollar problem credits identified and credit quality beginning to stabilize = Well-capitalized and liquid balance sheet = Improved funding mix and NIM = Controlled expenses = Strong managem
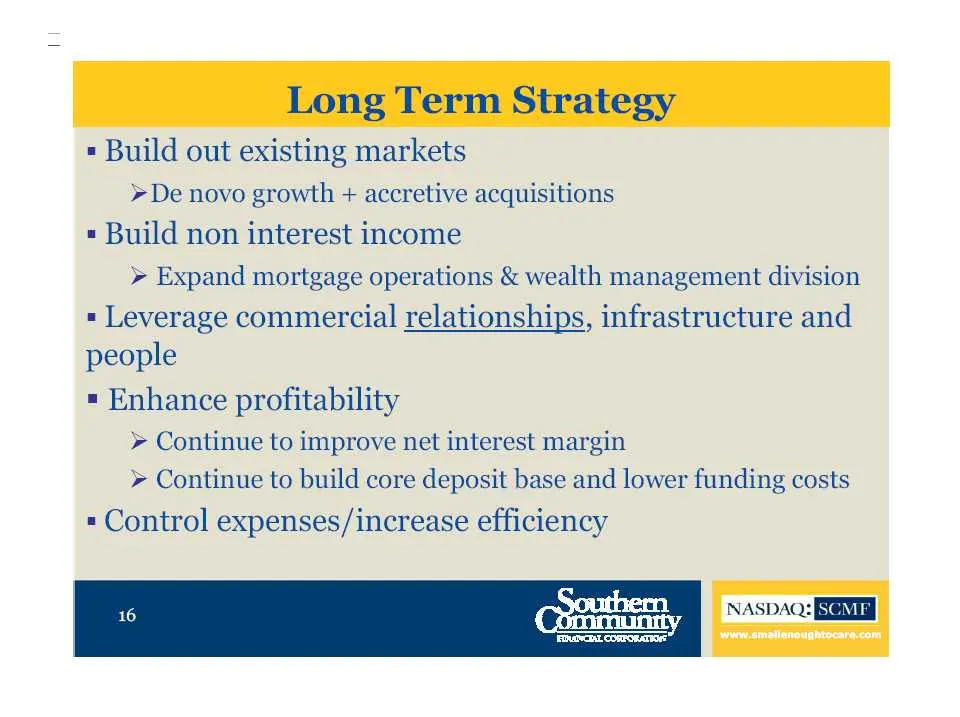
Slide 16: Build out existing markets
« Build out existing markets » De novo growth + accretive acquisitions « Build non interest income > Expand mortgage operations & wealth management division = Leverage commercial relationships, infrastructure and people » Enhance profitability > Continue to improve net interest margin > Continue to
Slide 17: Financial Performance
Financial Performance
Slide 18: Substantial reduction in net loss
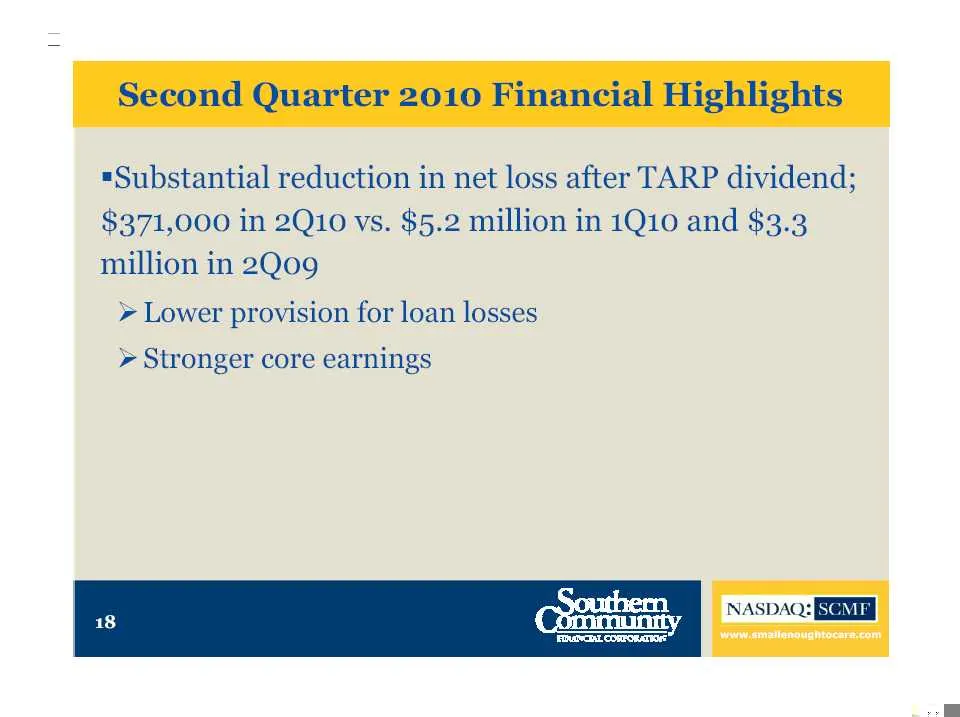
«Substantial reduction in net loss after TARP dividend; $371,000 in 2Q10 vs. $5.2 million in 1Q10 and $3.3 million in 2Q09 > Lower provision for loan losses » Stronger core earnings
Slide 19: Sequential decrease in provision for loan losses
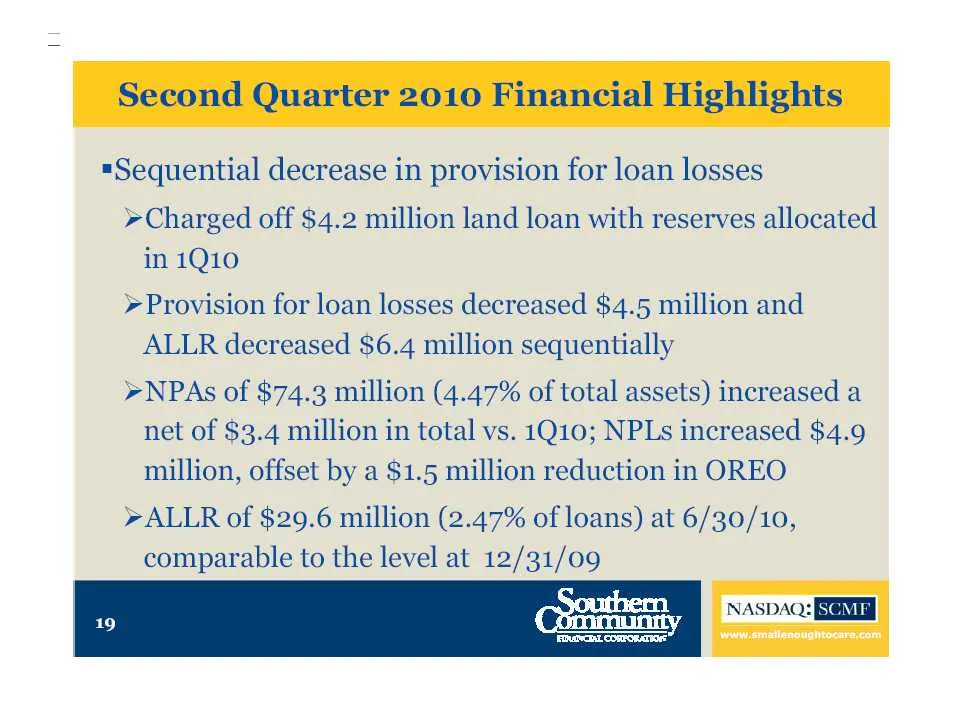
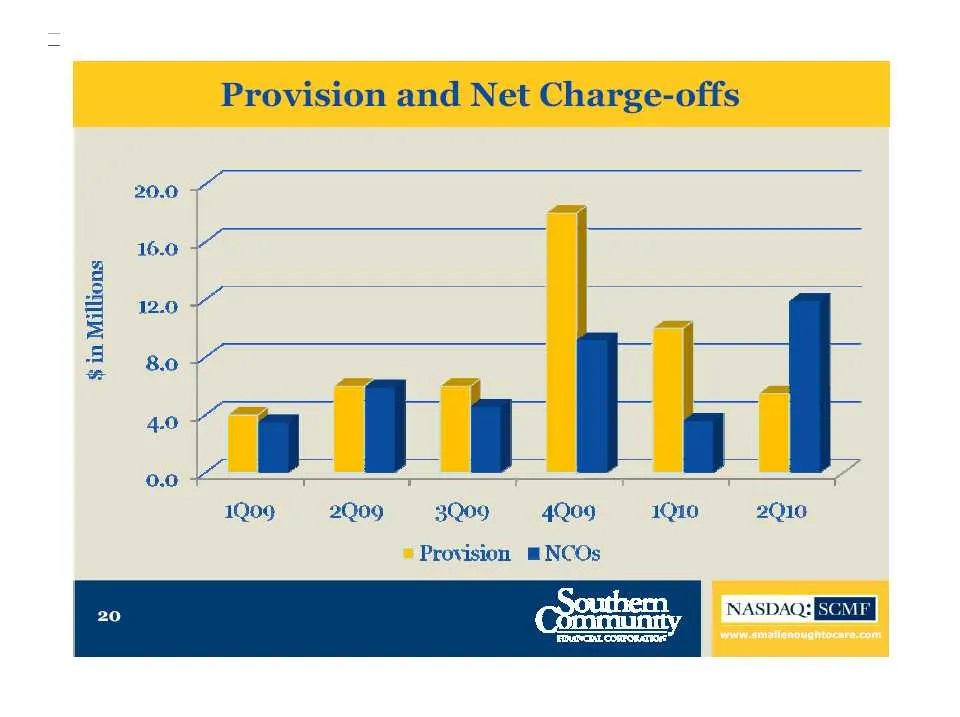
«Sequential decrease in provision for loan losses » Charged off $4.2 million land loan with reserves allocated in 1Q10 » Provision for loan losses decreased $4.5 million and ALLR decreased $6.4 million sequentially >NPAs of $74.3 million (4.47% of total assets) increased a net of $3.4 million in tot
Slide 20: Provision and net charge-offs
$ in Millions 8 o 4.0 | | 1 aathd 1Q09 2Q09 3Q09 4Q09 1Q10 2Q10 = Provision m NCOs
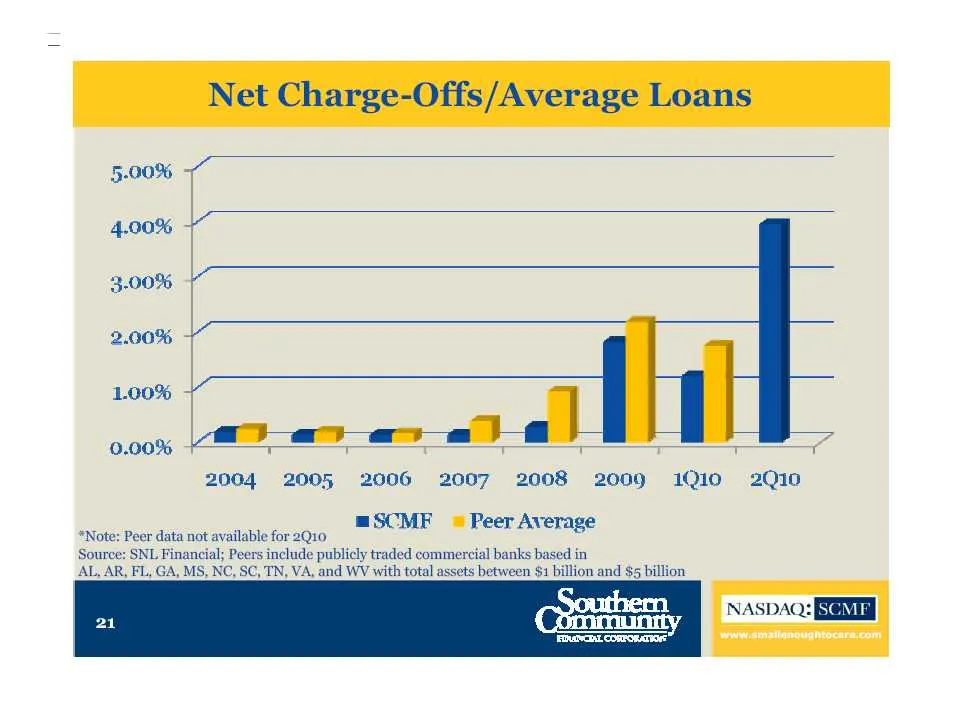
Slide 21: Credit metrics vs. peer average
5.00% 4.00% + 3.00% ff 2.00% | a! 1 00x San en eT es) 2004 2005 2006 2007 2008 2009 1Q10 2Q10 m=SCMF = Peer Average “Note: Peer data not available for 2Q10 nancial; Peers include publicly traded commercial banks based in L, GA, MS, NC, SC, TN, VA, and WV with total assets between $1 billion and $5 b
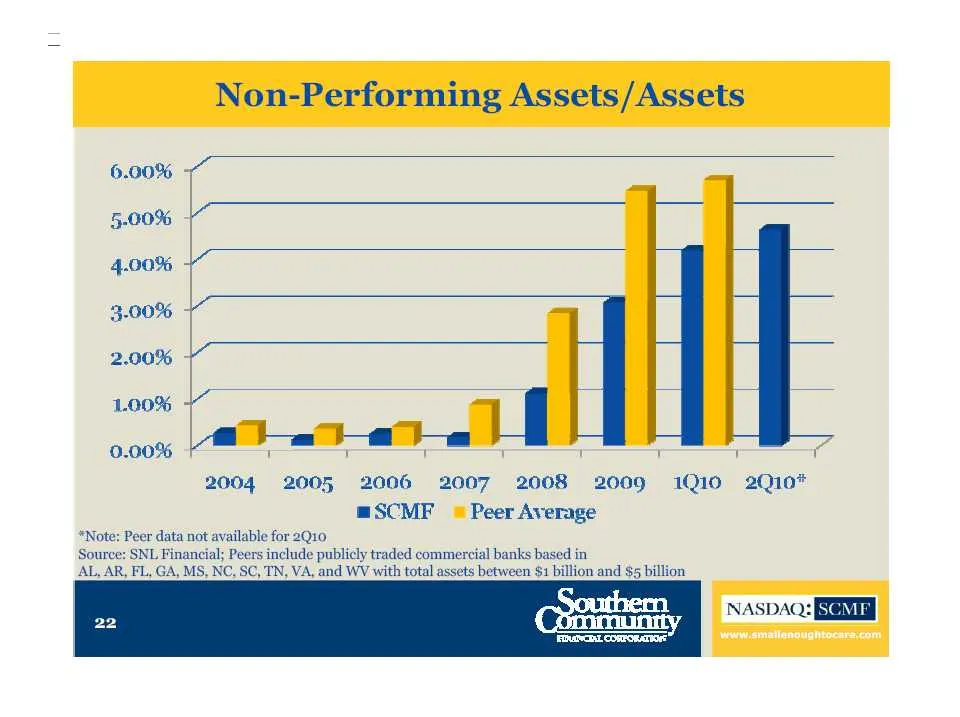
Slide 22: Credit metrics vs. peer average
6.00% 5.00096 | 4.00% f 3.00% 2.00% | 1.00% | aaa 0.00% 2004 2005 2006 2007 2008 2009 Toro ‘ae m=SCMF © Peer Average “Note: Peer data not available for 2Q10 nancial; Peers include publicly traded commercial banks based in L, GA, MS, NC, SC, TN, VA, and WV with total assets between $1 billion and $5
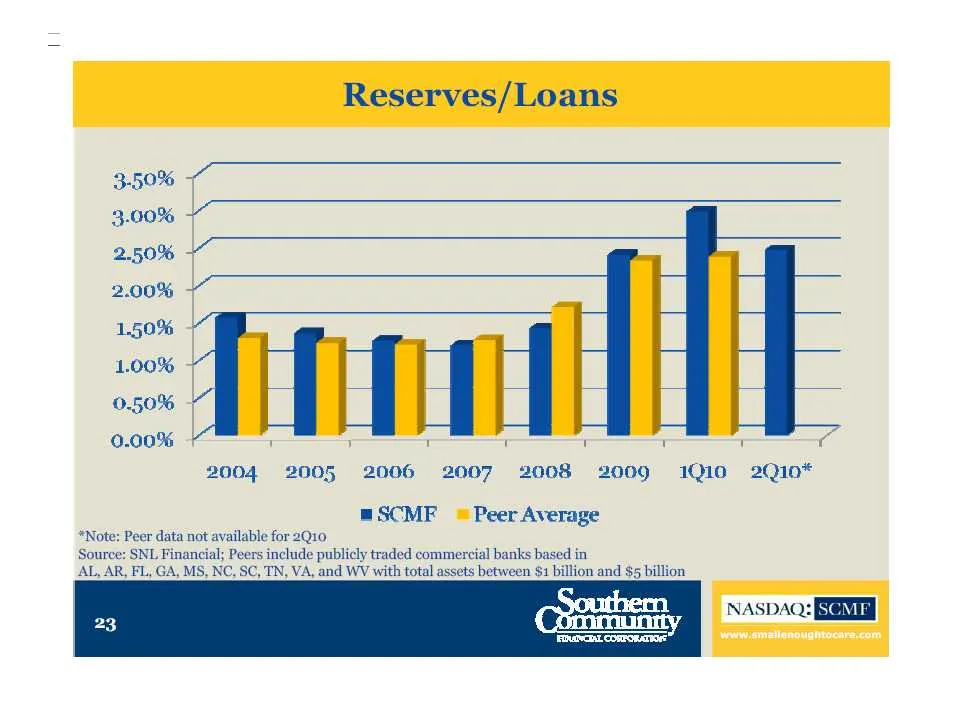
Slide 23: Performance vs. peer average
3-50% 3.00% + 2.50% 2.00% 7 1.50% 1.00% ~ 0.50% ‘| 0.00% 2004 2005 2006 2007 2008 2009 1Q10 2Qi0* @SCMF © Peer Average
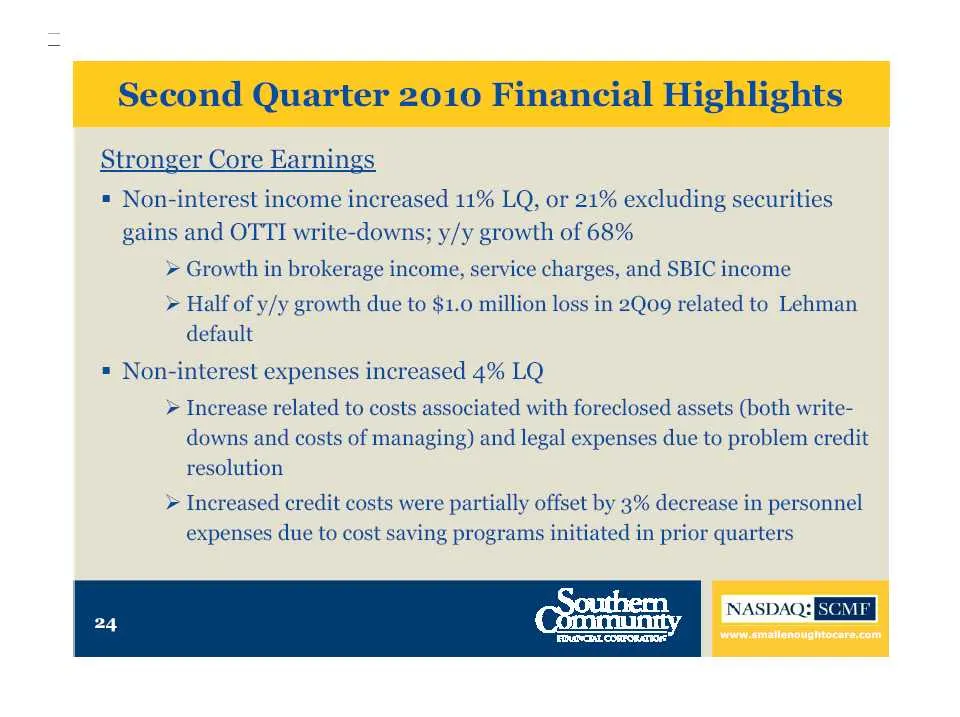
Slide 24: Stronger Core Earnings
Stronger Core Earnings = Non-interest income increased 11% LQ, or 21% excluding securities gains and OTTI write-downs; y/y growth of 68% > Growth in brokerage income, service charges, and SBIC income > Half of y/y growth due to $1.0 million loss in 2Qo9 related to Lehman default = Non-interest expen
Slide 25: Net interest margin improvement
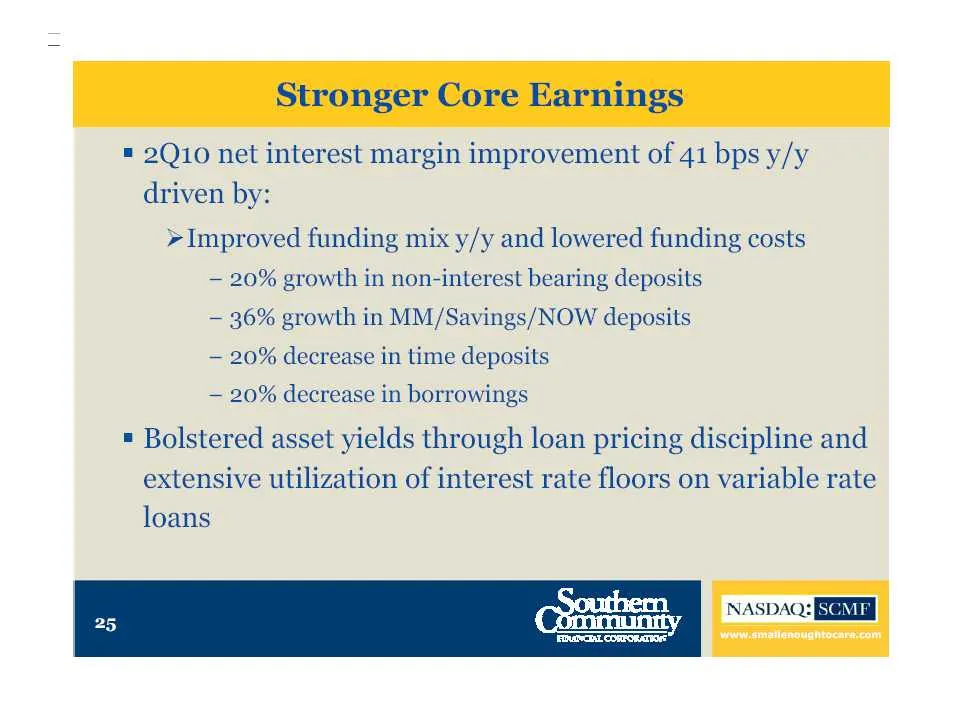
= 2Q10 net interest margin improvement of 41 bps y/y driven by: » Improved funding mix y/y and lowered funding costs — 20% growth in non-interest bearing deposits — 36% growth in MM/Savings/NOW deposits — 20% decrease in time deposits — 20% decrease in borrowings * Bolstered asset yields through loa
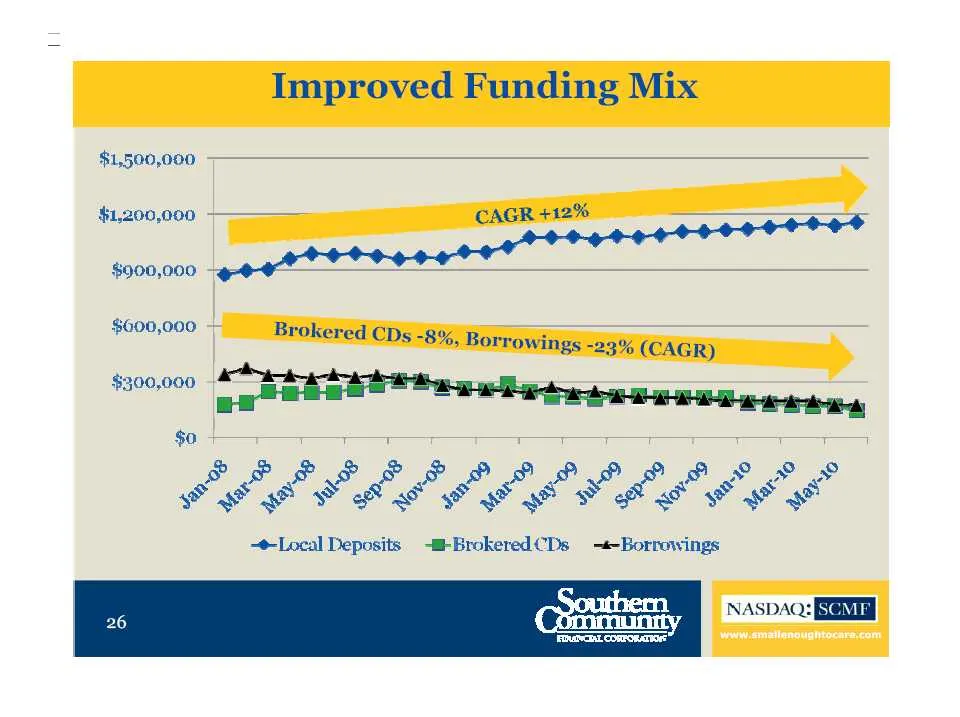
Slide 26: Funding mix: local deposits, brokered CDs, borrowings
$1,500,000 $1,200,000 $900,000 - $600,000 -- $300,000 arn oe oe ee LP oS aC ‘Ss ee FF se ne a ea Local Deposits -@+BrokeredCDs -«-Borrowings
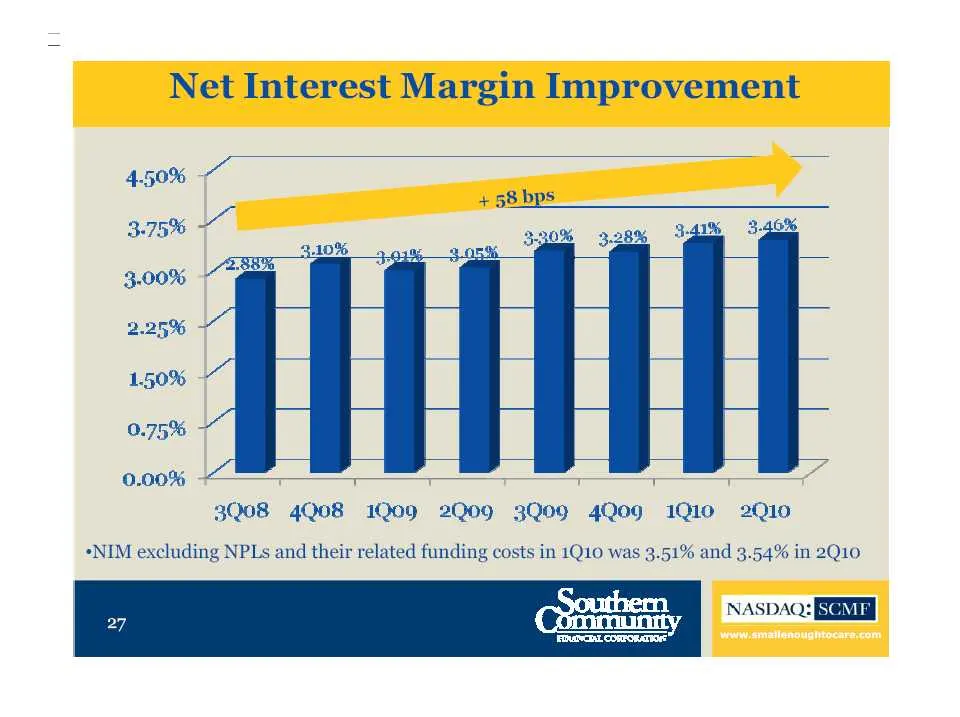
Slide 27: Net interest margin trend
0.00%, T T T a — — ~ —f 3Q0B 4Q0B 1Q09 2Q09 3Q09 4Q09 1Q10 2Q10 -NIM excluding NPLs and their related funding costs in 1Q10 was 3.51% and 3.54% in 2Q10
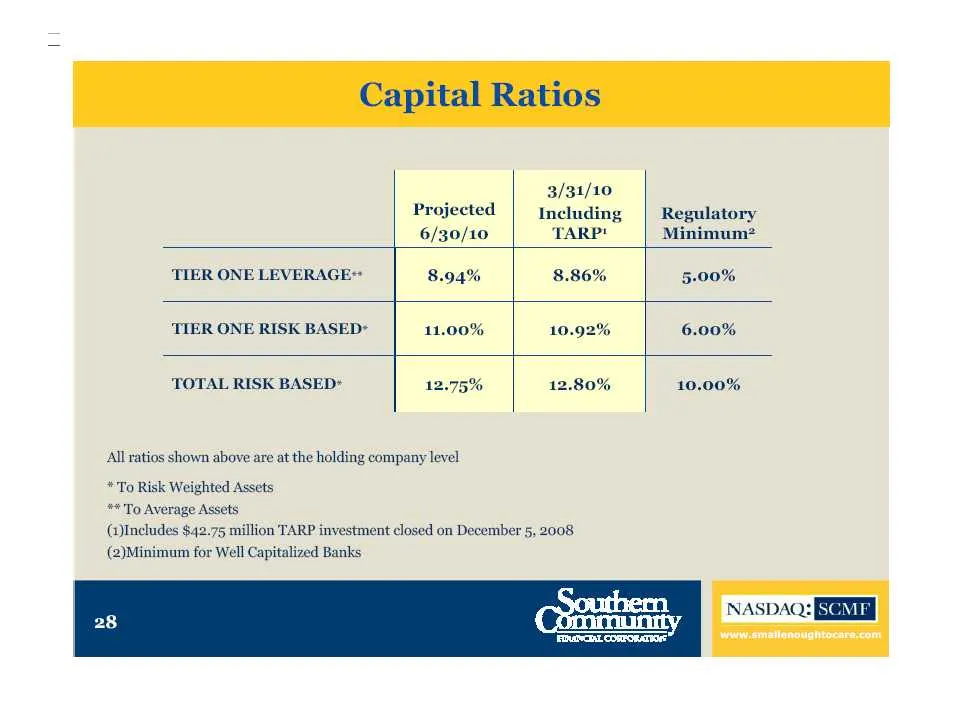
Slide 28: Capital ratios
Projected 3/31/10 Including | Regulatory 6/30/10 TARP! Minimum? TIER ONE LEVERAGE 8.94% 8.86% 5.00% TIER ONE RISK BASED* 11.00% 10.92% 6.00% TOTAL RISK BASED* 12.75% 12.80% 10.00% All ratios shown above are at the holding company level * To Risk Weighted Assets ** To Average Asset (Includes $4; (2)M
Slide 29: Outlook
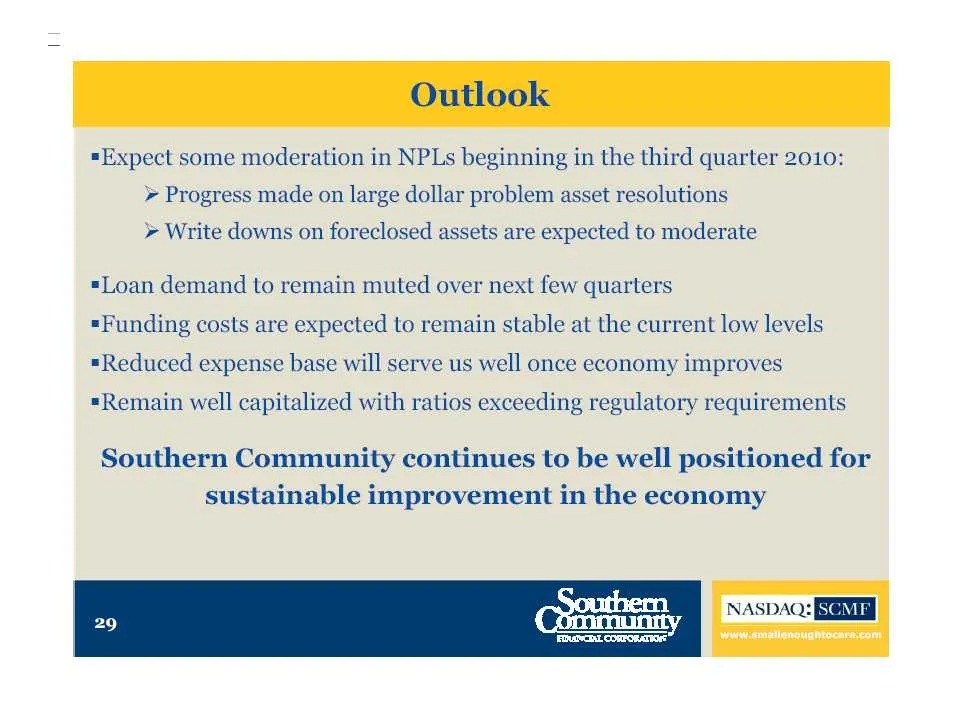
=Expect some moderation in NPLs beginning in the third quarter 2010: > Progress made on large dollar problem asset resolutions » Write downs on foreclosed assets are expected to moderate =Loan demand to remain muted over next few quarters =Funding costs are expected to remain stable at the current l

Slide 30: Southern Community Financial Corporation
Southern Community FINANCIAL CORPORATION Small Enough To Care NASDAQ: Sowag www.smallenoughtocare.com Coben, NASDAQ: SM)
Source: SEC EDGAR · 8-K filed Jul 27, 2010
More decks from Southern Community Financial Corp
 Investor Presentation (May 2009)26 slides · May 4, 2009
 Conference Presentation (February 2009)26 slides · Feb 6, 2009
 Southeast SuperCommunity Bank Conference (February 2008)28 slides · Feb 11, 2008
 America's Community Bankers Community Bank Investor Conference 200724 slides · Nov 2, 2007
 Emerging Growth Institutional Investor Forum 200727 slides · Mar 26, 2007
 Southeast SuperCommunity Bank Conference (February 2007)26 slides · Feb 14, 2007