Art Technology — Roth Capital Partners Conference (February 2007)
24 slides from Art Technology's conference presentation, Feb 20, 2007
Slide 1: Art Technology Group Investor Presentation
Art Technology Group Investor Presentation February 2007 Bob Burke, CEO Julie Bradley, CFO
Slide 2: Safe Harbor
Safe Harbor This presentation contains "forward-looking statements" within the meaning of the Private Securities Litigation Reform Act of 1995. Such forward-looking statements - including those regarding the company's financial expectations for full year 2007, expected demand for the company's solut
Slide 3: ATG Overview
ATG Overview - NASDAQ: ARTG ATG is the Leading eCommerce platform provider Founded in 1991, IPO in 1999 Headquarters in Cambridge, MA 378 employees Focused on eCommerce and solutions that drive profitable online business
Slide 4: Selected eStara Customers
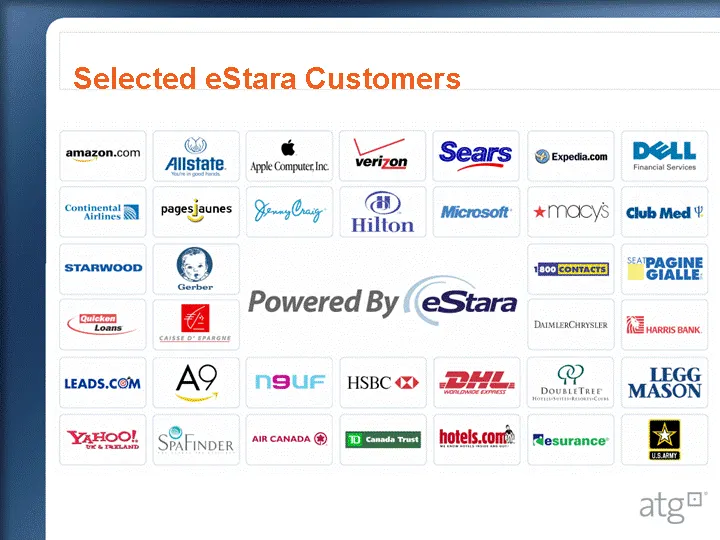
Selected eStara Customers amazon.com conics STARWOOD See LEADS.COM “YaHoo!, @ «‘ \— Sears Allstate syvctracre Verizon SOAS populate @) tee Beibey idton wa Powered By | eStara AQ nSurF HsBCc@ MAL. Duuntencostx Resurance’ “PAGINE GIALLE GE saves or. LEGG MASON
Slide 5: How eStara Augments ATG's Business
How eStara Augments ATG's Business Proven solutions for increasing online sales conversion through Click to Call, Click to Chat and Call Tracking High growth, on demand, recurring revenue business model Unprecedented enterprise customer list Q4 2006 revenue = $4.7M Accretive on a non-GAAP basis with
Slide 6: The Most Complete Integrated Commerce Suite
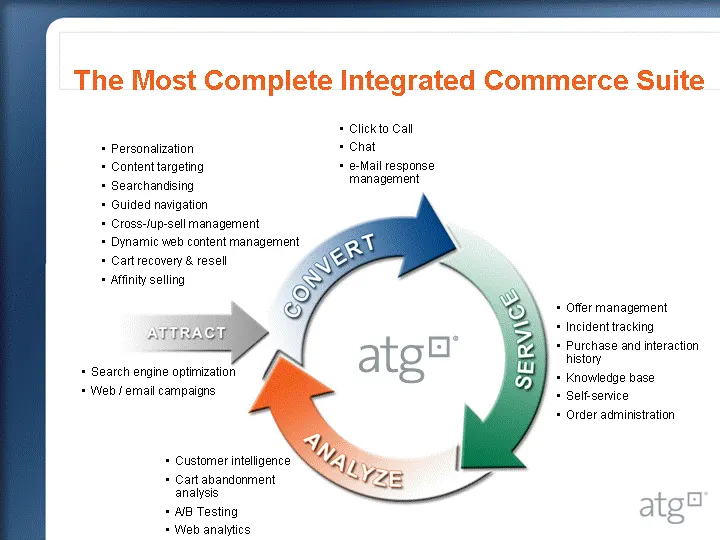
The Most Complete Integrated Commerce Suite Click to Call Chat e-Mail response management Offer management Incident tracking Purchase and interaction history Knowledge base Self-service Order administration Search engine optimization Web / email campaigns Personalization Content targeting Searchandi
Slide 7: ATG Rankings: The eCommerce Platform Analysts Rate #1
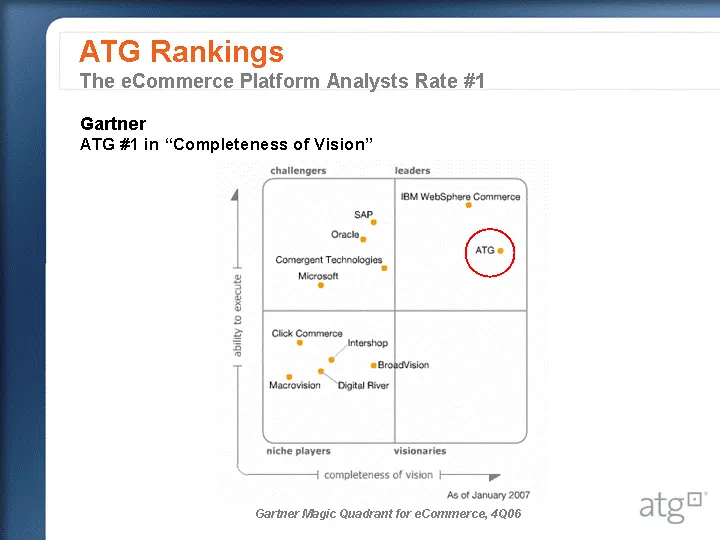
ATG Rankings The eCommerce Platform Analysts Rate #1 Gartner Magic Quadrant for eCommerce, 4Q06 Gartner ATG #1 in "Completeness of Vision"
Slide 8: Market Dynamics
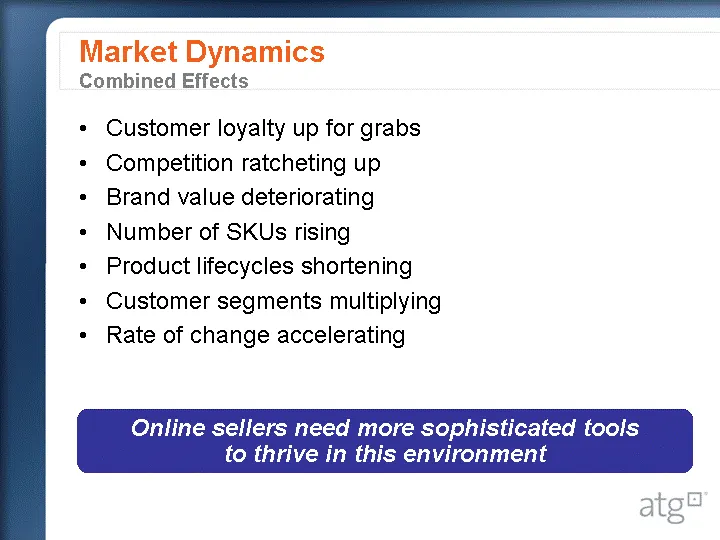
Online sellers need more sophisticated tools to thrive in this environment Market Dynamics Combined Effects Customer loyalty up for grabs Competition ratcheting up Brand value deteriorating Number of SKUs rising Product lifecycles shortening Customer segments multiplying Rate of change accelerating
Slide 9: What's Driving eCommerce Re-platforming
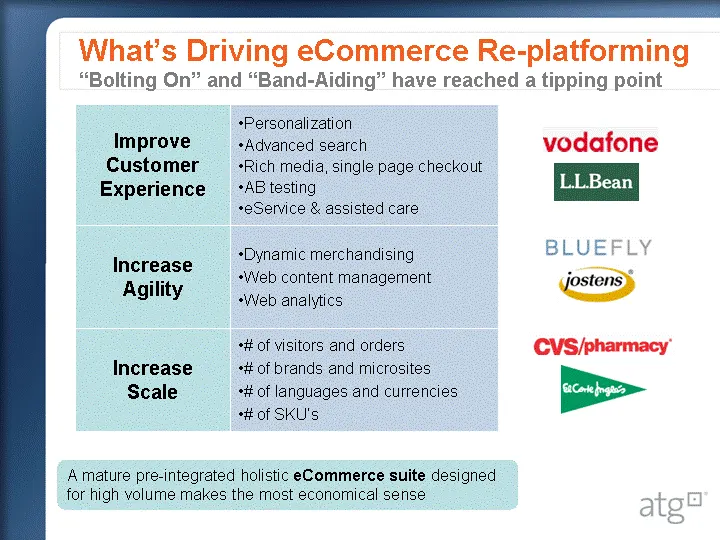
Improve Customer Experience Personalization Advanced search Rich media, single page checkout AB testing eService & assisted care Increase Agility Dynamic merchandising Web content management Web analytics Increase Scale # of visitors and orders # of brands and microsites # of languages and currencie
Slide 10: Current Target eCommerce Market
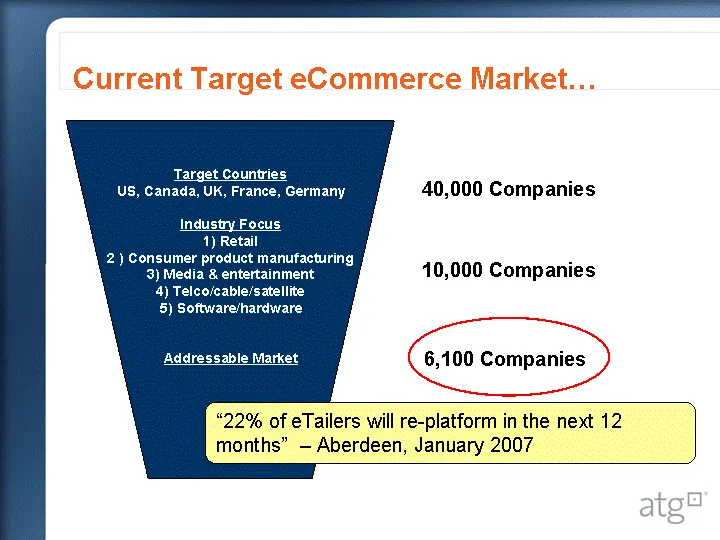
Current Target eCommerce Market... Target Countries US, Canada, UK, France, Germany Industry Focus 1) Retail 2 ) Consumer product manufacturing 3) Media & entertainment 4) Telco/cable/satellite 5) Software/hardware Addressable Market 40,000 Companies 10,000 Companies 6,100 Companies "22% of eTailers
Slide 11: Goals & Strategy Summary
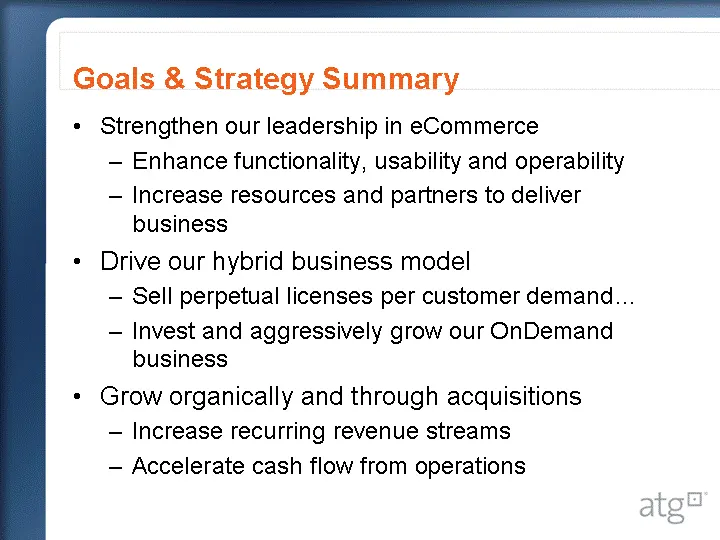
Goals & Strategy Summary Strengthen our leadership in eCommerce Enhance functionality, usability and operability Increase resources and partners to deliver business Drive our hybrid business model Sell perpetual licenses per customer demand... Invest and aggressively grow our OnDemand business Grow
Slide 12: Financial Review
Financial Review
Slide 13: Growing Revenue
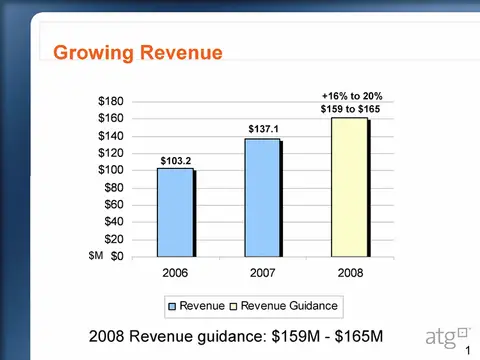
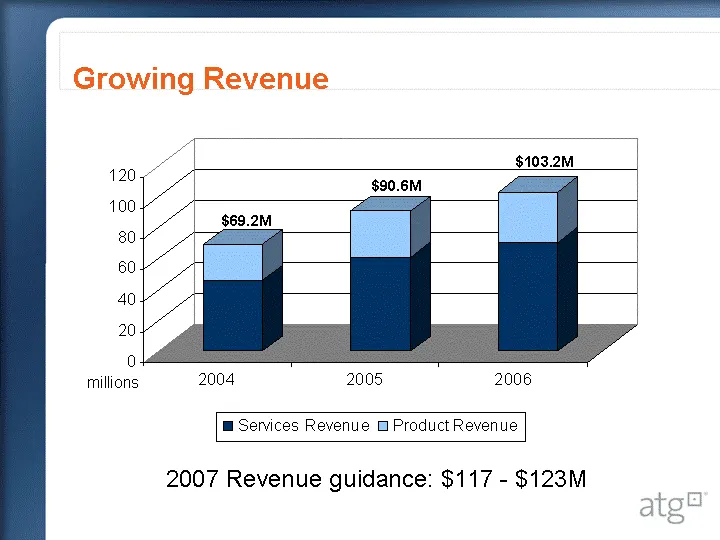
Growing Revenue $69.2M $90.6M $103.2M millions 2007 Revenue guidance: $117 - $123M
Slide 14: 2006 Revenue Mix
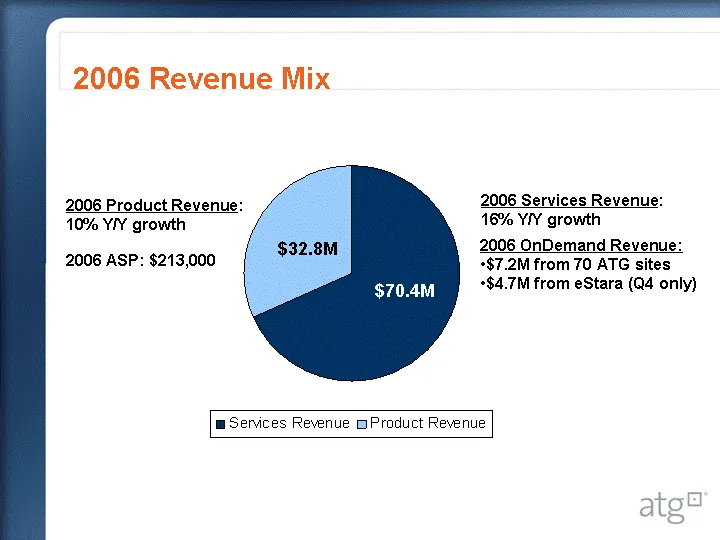
2006 Revenue Mix 2006 Product Revenue: 10% Y/Y growth 2006 Services Revenue: 16% Y/Y growth 2006 OnDemand Revenue: $7.2M from 70 ATG sites $4.7M from eStara (Q4 only) 2006 ASP: $213,000 $32.8M $70.4M
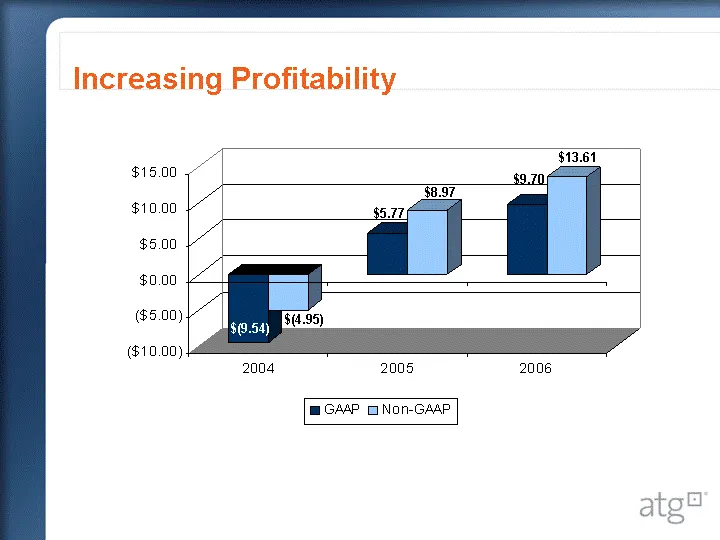
Slide 15: Increasing Profitability
Increasing Profitability $(9.54) $(4.95) $5.77 $8.97 $9.70 $13.61
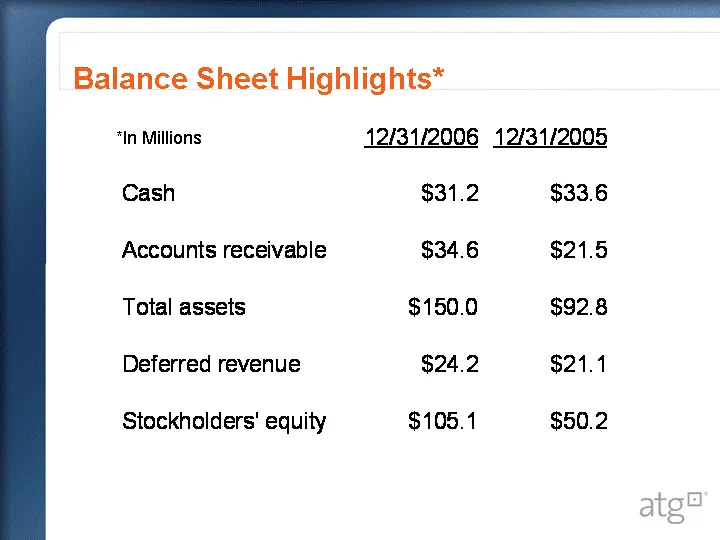
Slide 16: Balance Sheet Highlights
Balance Sheet Highlights* *In Millions
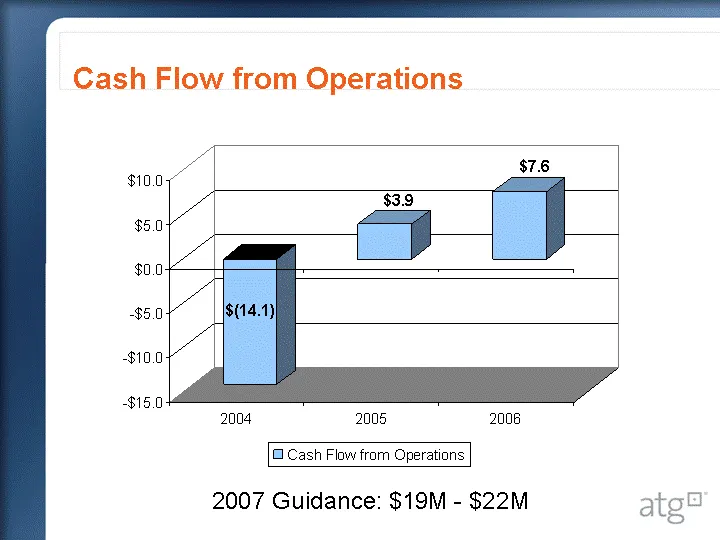
Slide 17: Cash Flow from Operations
Cash Flow from Operations $(14.1) $3.9 $7.6 2007 Guidance: $19M - $22M
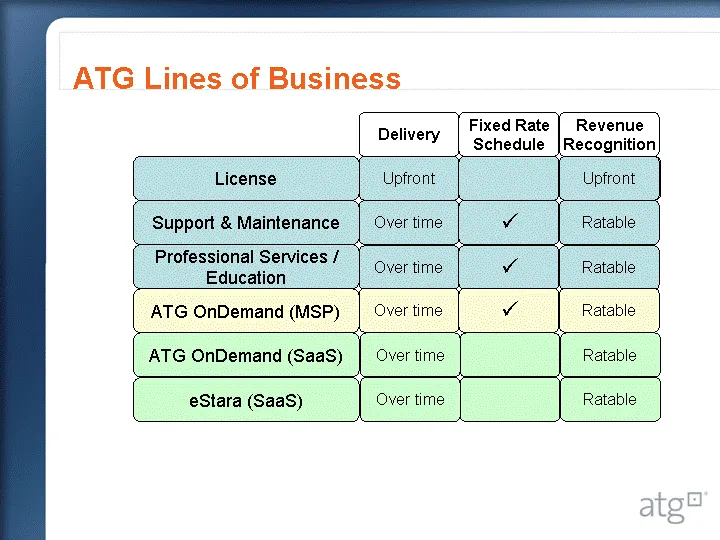
Slide 18: Upfront or Ratable
Upfront or Ratable Upfront ATG Lines of Business License Support & Maintenance Professional Services / Education Delivery Upfront Over time Over time Fixed Rate Schedule ? ? Revenue Recognition Ratable Ratable ATG OnDemand (MSP) Over time ? Ratable ATG OnDemand (SaaS) Over time Ratable eStara (SaaS)
Slide 19: Upfront or Ratable
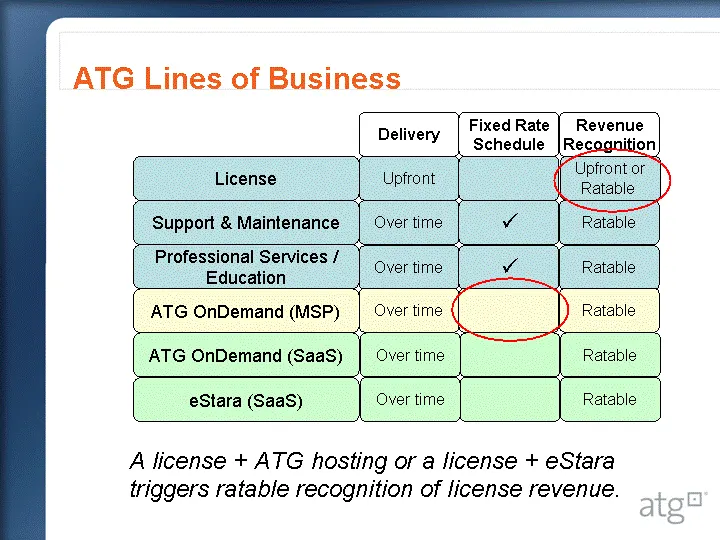
Upfront or Ratable ATG Lines of Business License Support & Maintenance Professional Services / Education Delivery Upfront Over time Over time Fixed Rate Schedule ? ? Revenue Recognition Ratable Ratable ATG OnDemand (MSP) Over time Ratable ATG OnDemand (SaaS) Over time Ratable eStara (SaaS) Over time
Slide 20: Upfront + Ratable
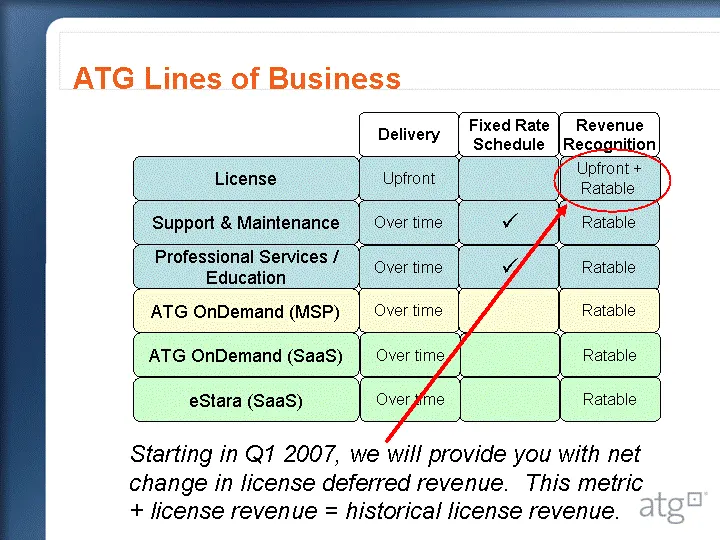
Upfront + Ratable ATG Lines of Business License Support & Maintenance Professional Services / Education Delivery Upfront Over time Over time Fixed Rate Schedule ? ? Revenue Recognition Ratable Ratable ATG OnDemand (MSP) Over time Ratable ATG OnDemand (SaaS) Over time Ratable eStara (SaaS) Over time
Slide 21: Revenue Reconciliation: 2007 Guidance
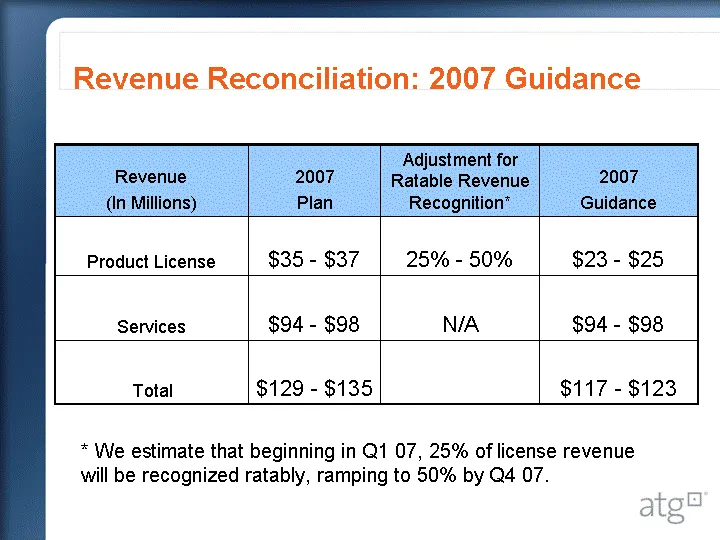
Revenue Reconciliation: 2007 Guidance Revenue (In Millions) 2007 Plan Adjustment for Ratable Revenue Recognition* 2007 Guidance Product License $35 - $37 25% - 50% $23 - $25 Services $94 - $98 N/A $94 - $98 Total $129 - $135 $117 - $123 * We estimate that beginning in Q1 07, 25% of license revenue w
Slide 22: Scalable Business Model
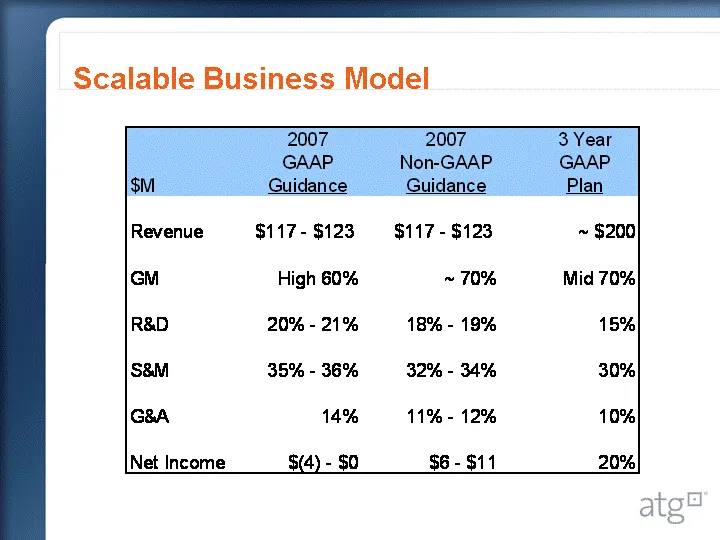
Scalable Business Model 2007 2007 i 3 Year GAAP Non-GAAP GAAP — $M Guidance - Guidance = Plan Revenue $117 - $123 $117 - $123 ~ $200 GM High 60% ~ 70% Mid 70%| R&D 20% - 21% 18% - 19% 15%| S&8M 35% - 36% 32% - 34% 30% GBA 14% 11% - 12% 10%| Net Income $(4) - $0 $6-$11 20%
Slide 23: FY2007 Outlook
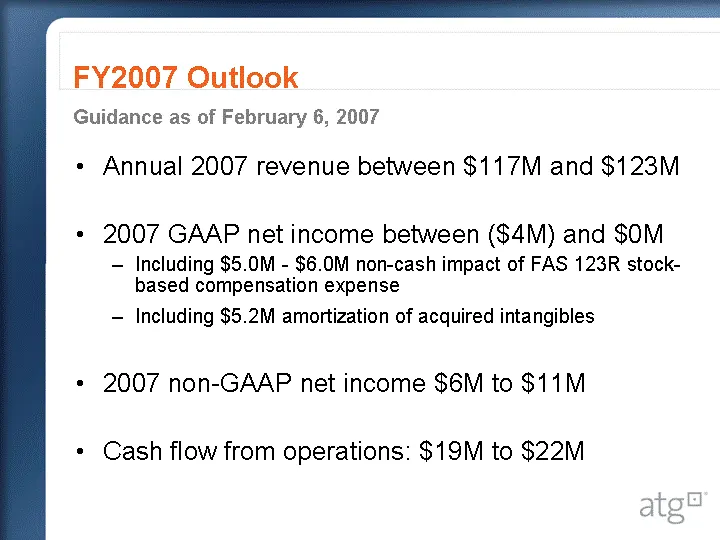
FY2007 Outlook Guidance as of February 6, 2007 Annual 2007 revenue between $117M and $123M 2007 GAAP net income between ($4M) and $0M Including $5.0M - $6.0M non-cash impact of FAS 123R stock- based compensation expense Including $5.2M amortization of acquired intangibles 2007 non-GAAP net income $6
Slide 24: Conclusion
Conclusion Healthy Market Opportunity Leadership in eCommerce Solid Financials
Source: SEC EDGAR · 8-K filed Feb 20, 2007