Thule Group AB · OMXSTO:THULE
Thule Group AB — Q1 2020 Earnings Presentation
27 slides from Thule Group AB's earnings presentation, April 2020
Slide 1: 2020/Q1 Investor meetings April-May
2020/Q1 Investor meetings April-May Magnus Welander, CEO Jonas Lindqvist, CFO
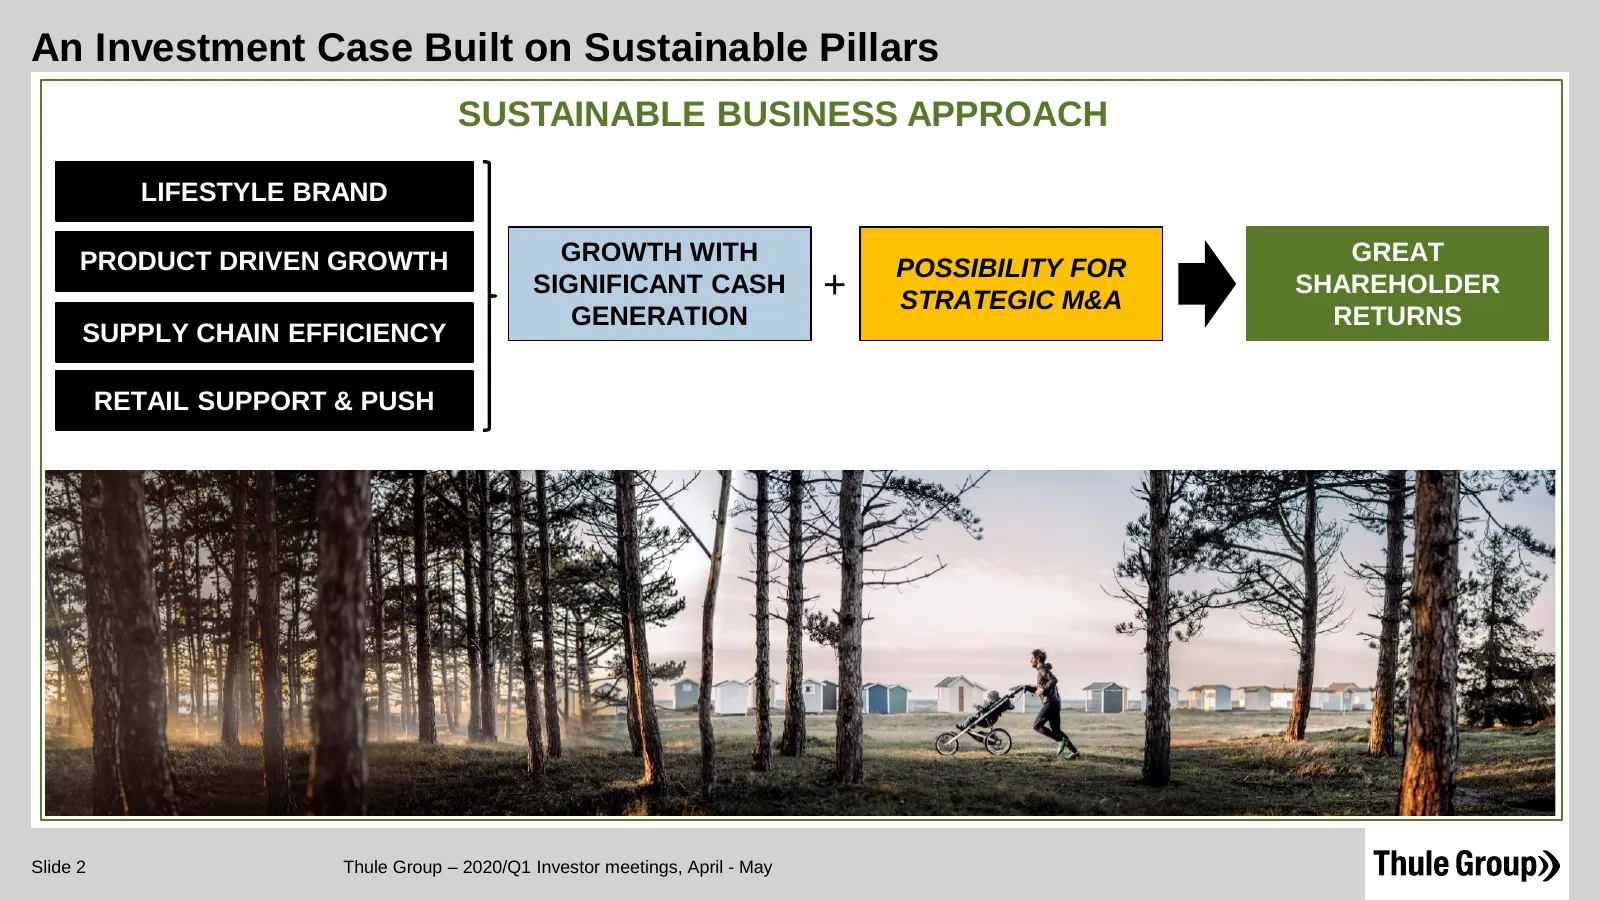
Slide 2: An Investment Case Built on Sustainable Pillars
An Investment Case Built on Sustainable Pillars SUSTAINABLE BUSINESS APPROACH LIFESTYLE BRAND PRODUCT DRIVEN GROWTH GROWTH WITH GREAT POSSIBILITY FOR SIGNIFICANT CASH + STRATEGIC M&A SHAREHOLDER GENERATION RETURNS SUPPLY CHAIN EFFICIENCY RETAIL SUPPORT & PUSH Slide 2 Thule Group – 2020/Q1 Investor m
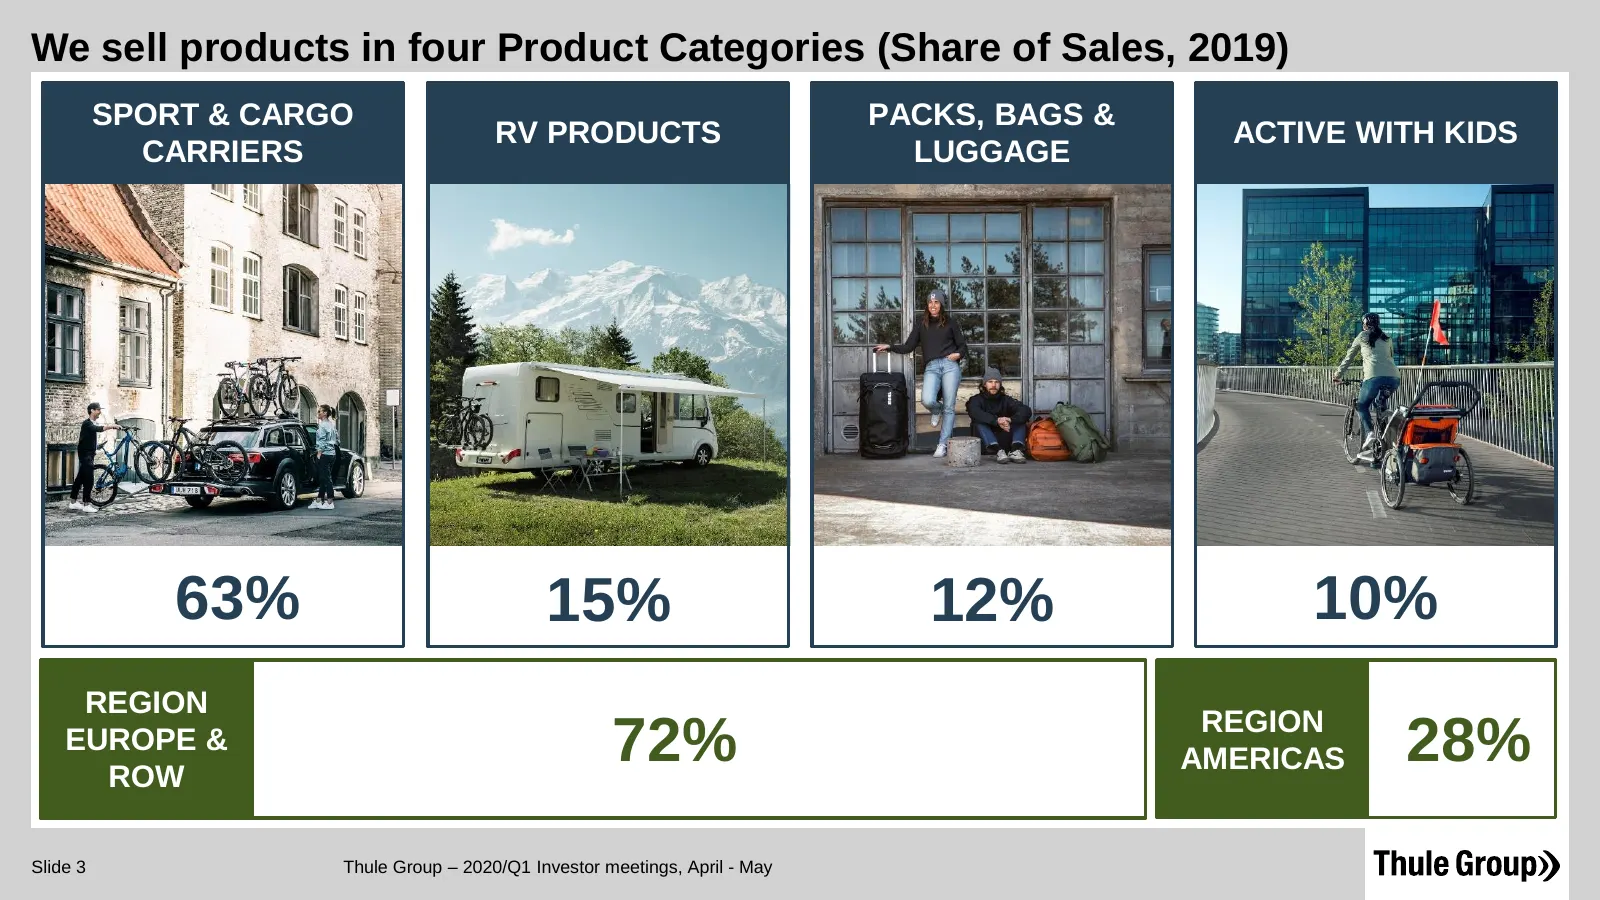
Slide 3: We sell products in four Product Categories
We sell products in four Product Categories (Share of Sales, 2019) SPORT & CARGO PACKS, BAGS & 14% RV PRODUCTS ACTIVE WITH KIDS CARRIERS LUGGAGE 63% 15% 12% 10% REGION REGION EUROPE & ROW 72% AMERICAS 28% Slide 3 Thule Group – 2020/Q1 Investor meetings, April - May
Slide 4: 2020/Q1 Financials
We make it easier for people to live active lives 2020/Q1 Financials Slide 4 Thule Group – 2020/Q1 Investor meetings, April - May
Slide 5: 2020/Q1 – A quarter with two distinct phases due to the corona-virus pandemic
2020/Q1 – A quarter with two distinct phases due to the corona-virus pandemic ▪ Net sales of SEK 1,744m (1,834) ▪ -4.9% (-7.5% excluding Fx effects) ▪ Region Europe & ROW -3.7% (-5.7% excl. Fx effect) ▪ Region Americas -8.8% (-13.1% excl. Fx effect) ▪ Growth until mid March and then significant drop
Slide 6: 2020/Q1 – Net Sales and Underlying EBIT development
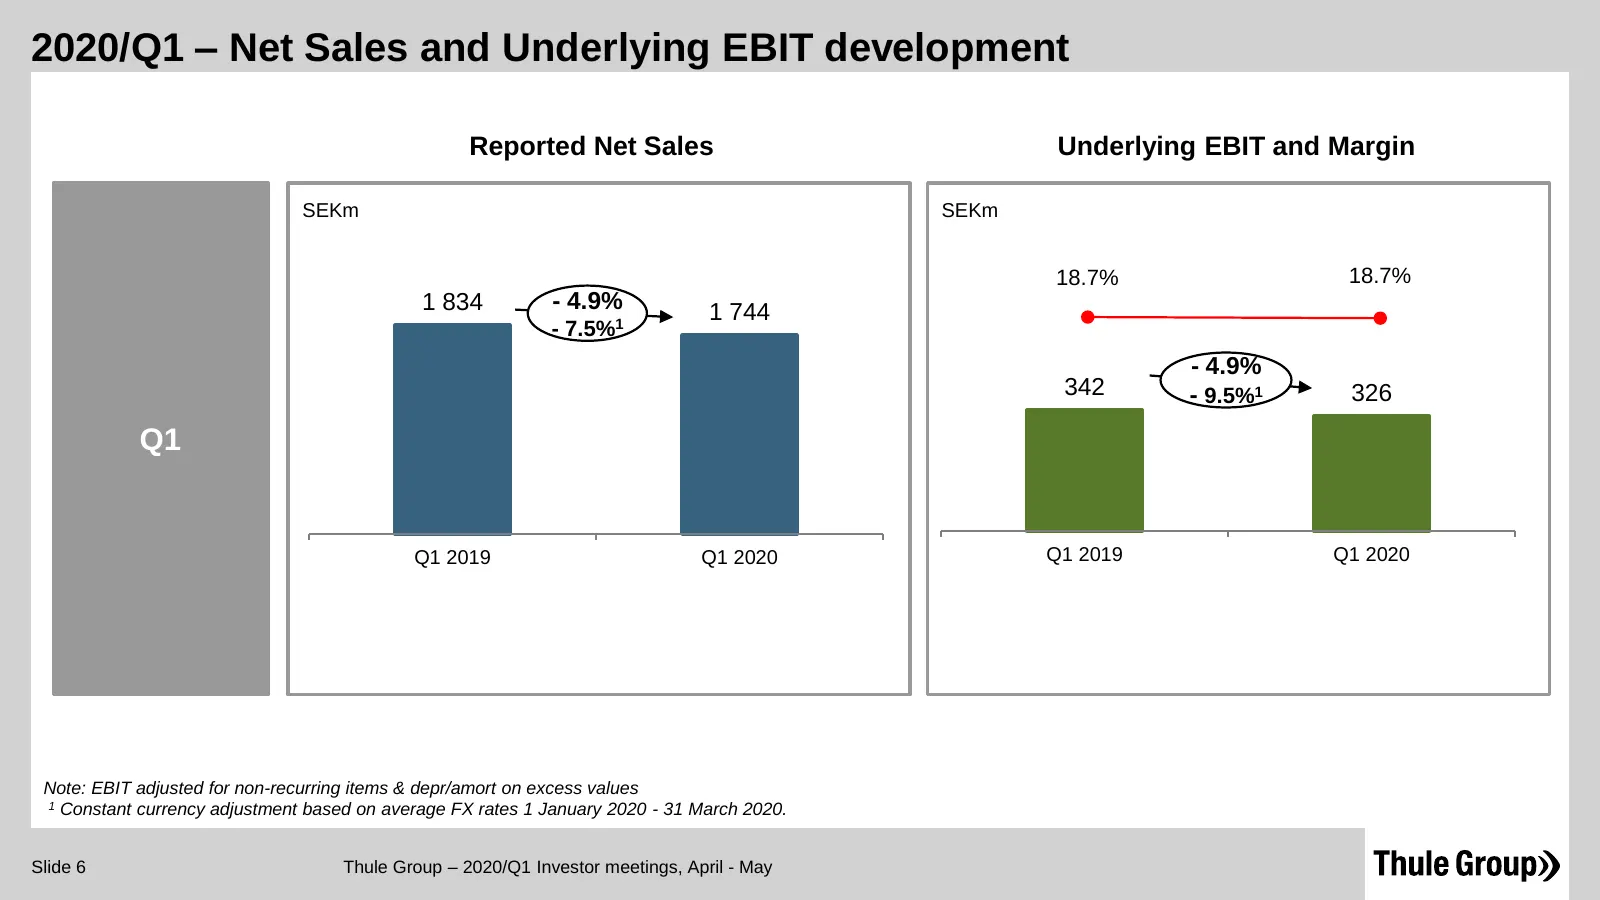
2020/Q1 – Net Sales and Underlying EBIT development Reported Net Sales Underlying EBIT and Margin SEKm SEKm 18.7% 18.7% 1 834 - 4.9% 1 744 - 7.5%1 - 4.9% 342 - 9.5%1 326 Q1 Q1 2019 Q1 2020 Q1 2019 Q1 2020 Note: EBIT adjusted for non-recurring items & depr/amort on excess values 1 Constant currency a
Slide 7: 2020/Q1 - Region Europe & ROW
2020/Q1 - Region Europe & ROW ▪ Net sales SEK 1,354m (1,406), -5.7% decline (constant currency) ▪ Growth until mid-March and then significant decline ▪ As communicated PY, 2019/Q1 had very strong end of Q1 thanks to early spring season sales of Bike Carriers ▪ Decline fully related to Covid-19 lock-
Slide 8: 2020/Q1 - Region Americas
2020/Q1 - Region Americas ▪ Net sales SEK 390m (428), -13.1% decline (constant currency) ▪ Growth until mid-March after strong winter season and then significant decline as lock-down were implemented ▪ Decline fully related to Covid-19 lock-downs ▪ Most significant drop end of March in regions with
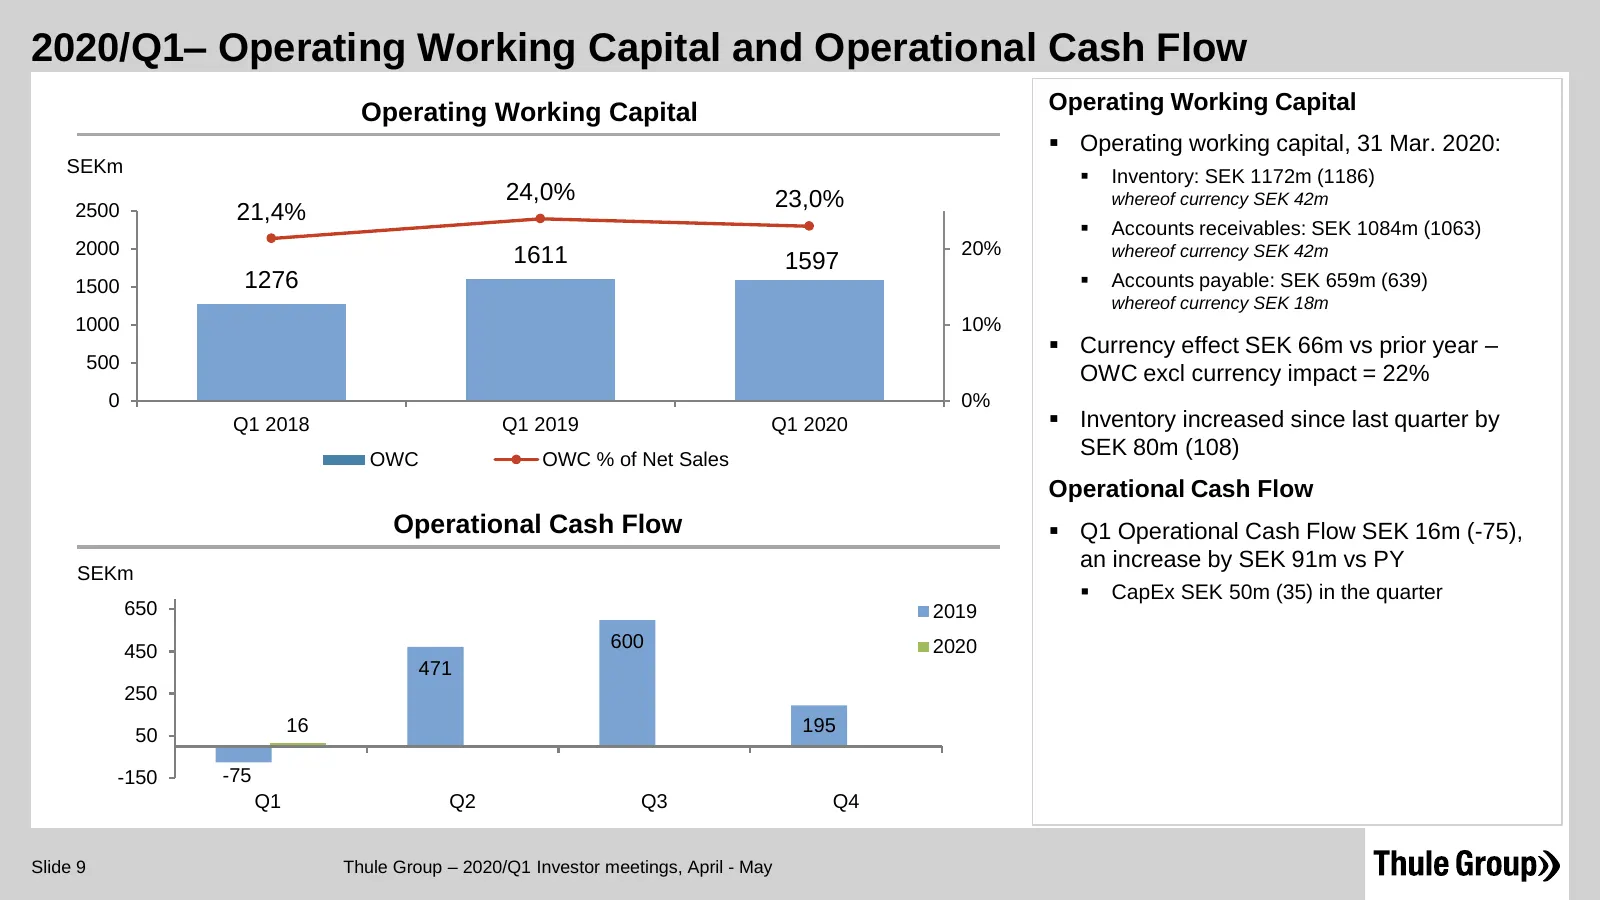
Slide 9: 2020/Q1 – Operating Working Capital and Operational Cash Flow
2020/Q1– Operating Working Capital and Operational Cash Flow Operating Working Capital Operating Working Capital ▪ Operating working capital, 31 Mar. 2020: SEKm ▪ Inventory: SEK 1172m (1186) 24,0% 23,0% whereof currency SEK 42m 2500 21,4% ▪ Accounts receivables: SEK 1084m (1063) 2000 1611 20% whereo
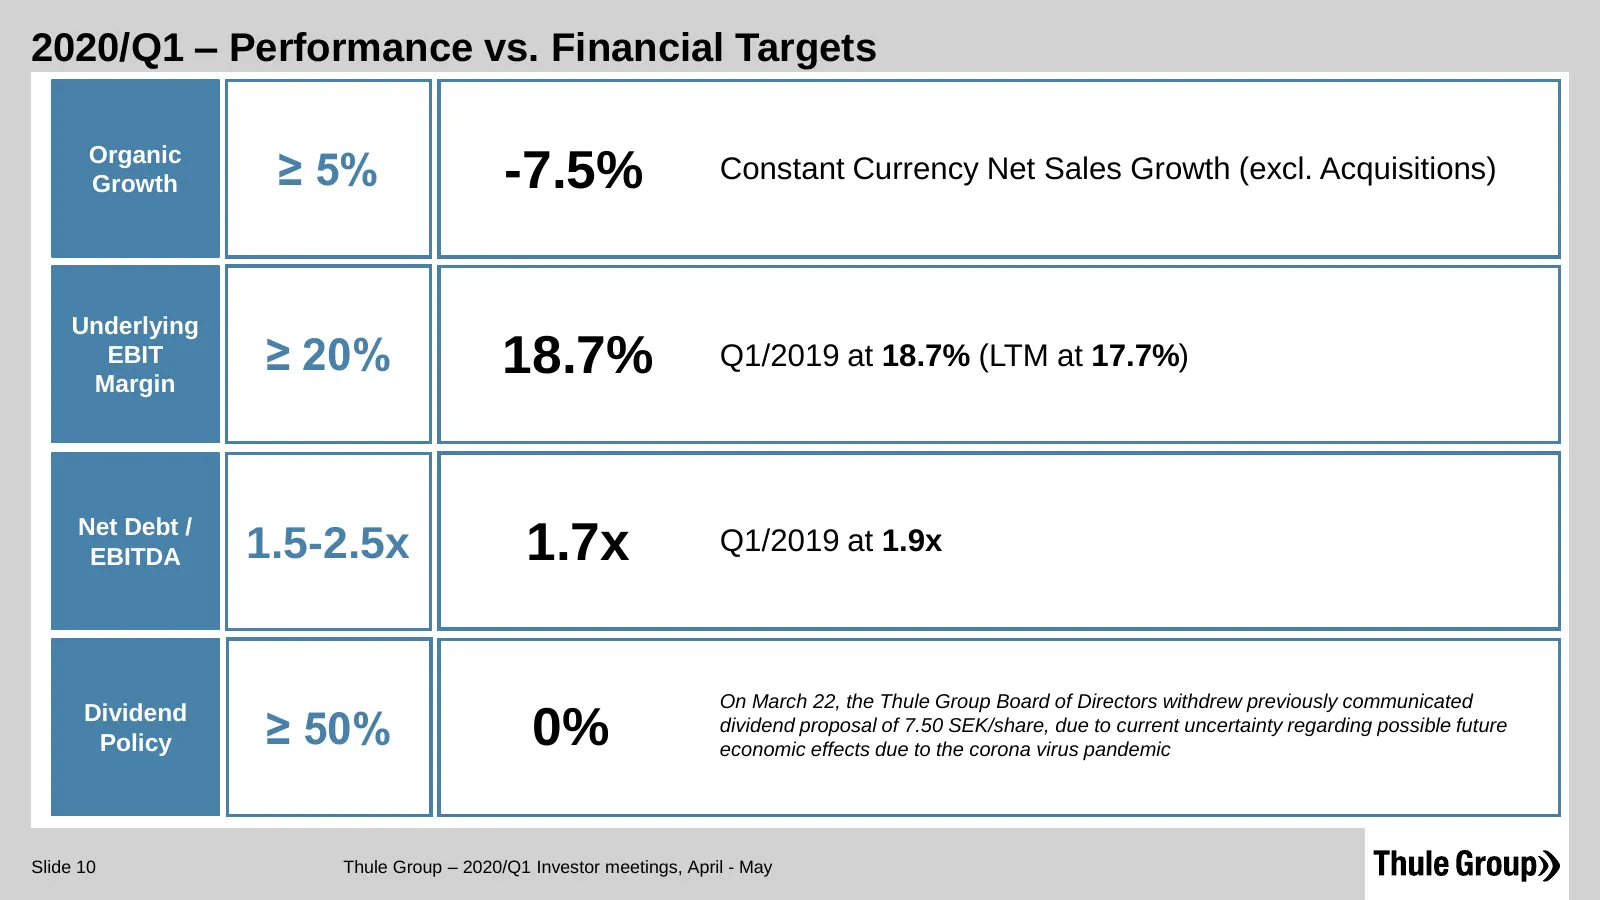
Slide 10: 2020/Q1 – Performance vs. Financial Targets
2020/Q1 – Performance vs. Financial Targets Organic Growth ≥ 5% -7.5% Constant Currency Net Sales Growth (excl. Acquisitions) Underlying EBIT Margin ≥ 20% 18.7% Q1/2019 at 18.7% (LTM at 17.7%) Net Debt / EBITDA 1.5-2.5x 1.7x Q1/2019 at 1.9x On March 22, the Thule Group Board of Directors withdrew pr
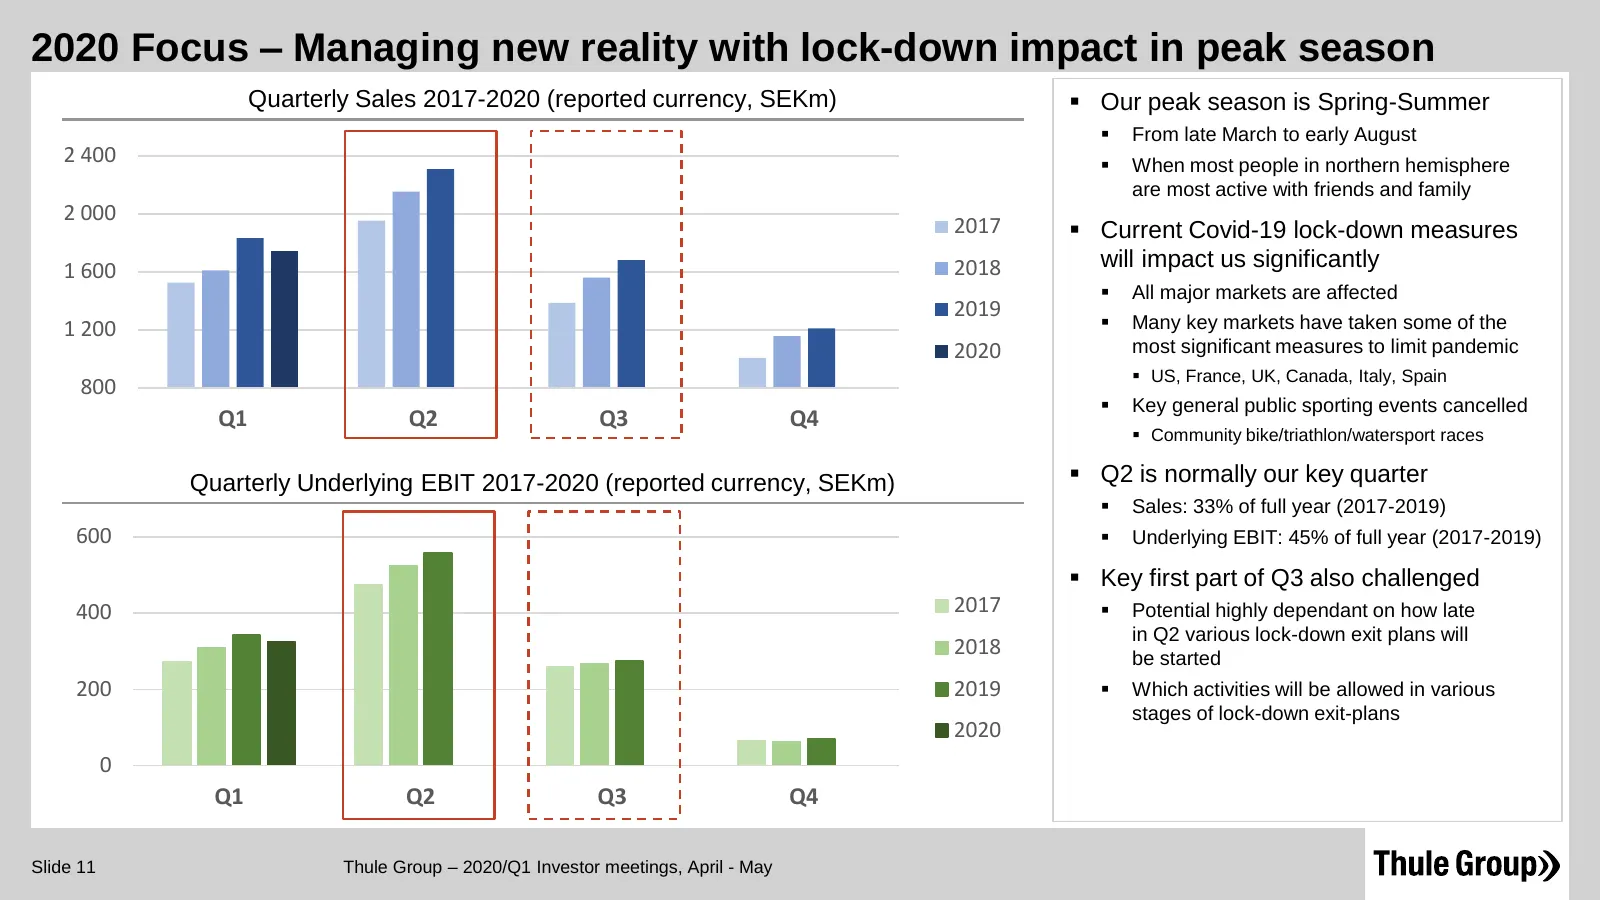
Slide 11: 2020 Focus – Managing new reality with lock-down impact in peak season
2020 Focus – Managing new reality with lock-down impact in peak season Quarterly Sales 2017-2020 (reported currency, SEKm) ▪ Our peak season is Spring-Summer ▪ From late March to early August 2 400 ▪ When most people in northern hemisphere are most active with friends and family 2 000 2017 ▪ Current
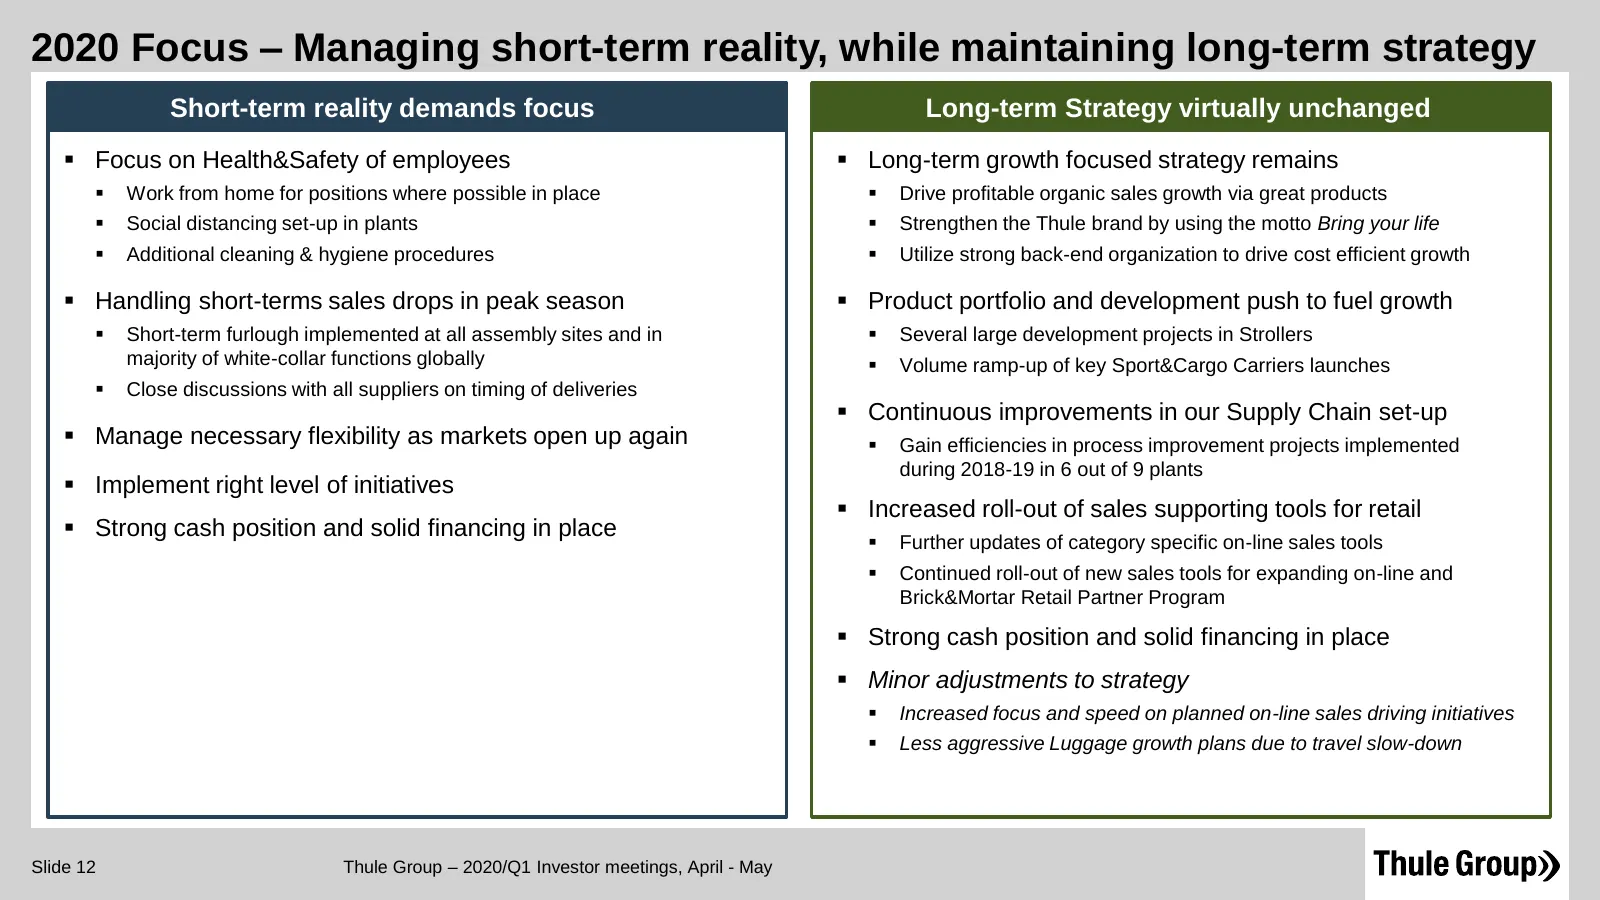
Slide 12: 2020 Focus – Managing short-term reality, while maintaining long-term strategy
2020 Focus – Managing short-term reality, while maintaining long-term strategy Short-term reality demands focus Long-term Strategy virtually unchanged ▪ Focus on Health&Safety of employees ▪ Long-term growth focused strategy remains ▪ Work from home for positions where possible in place ▪ Drive prof
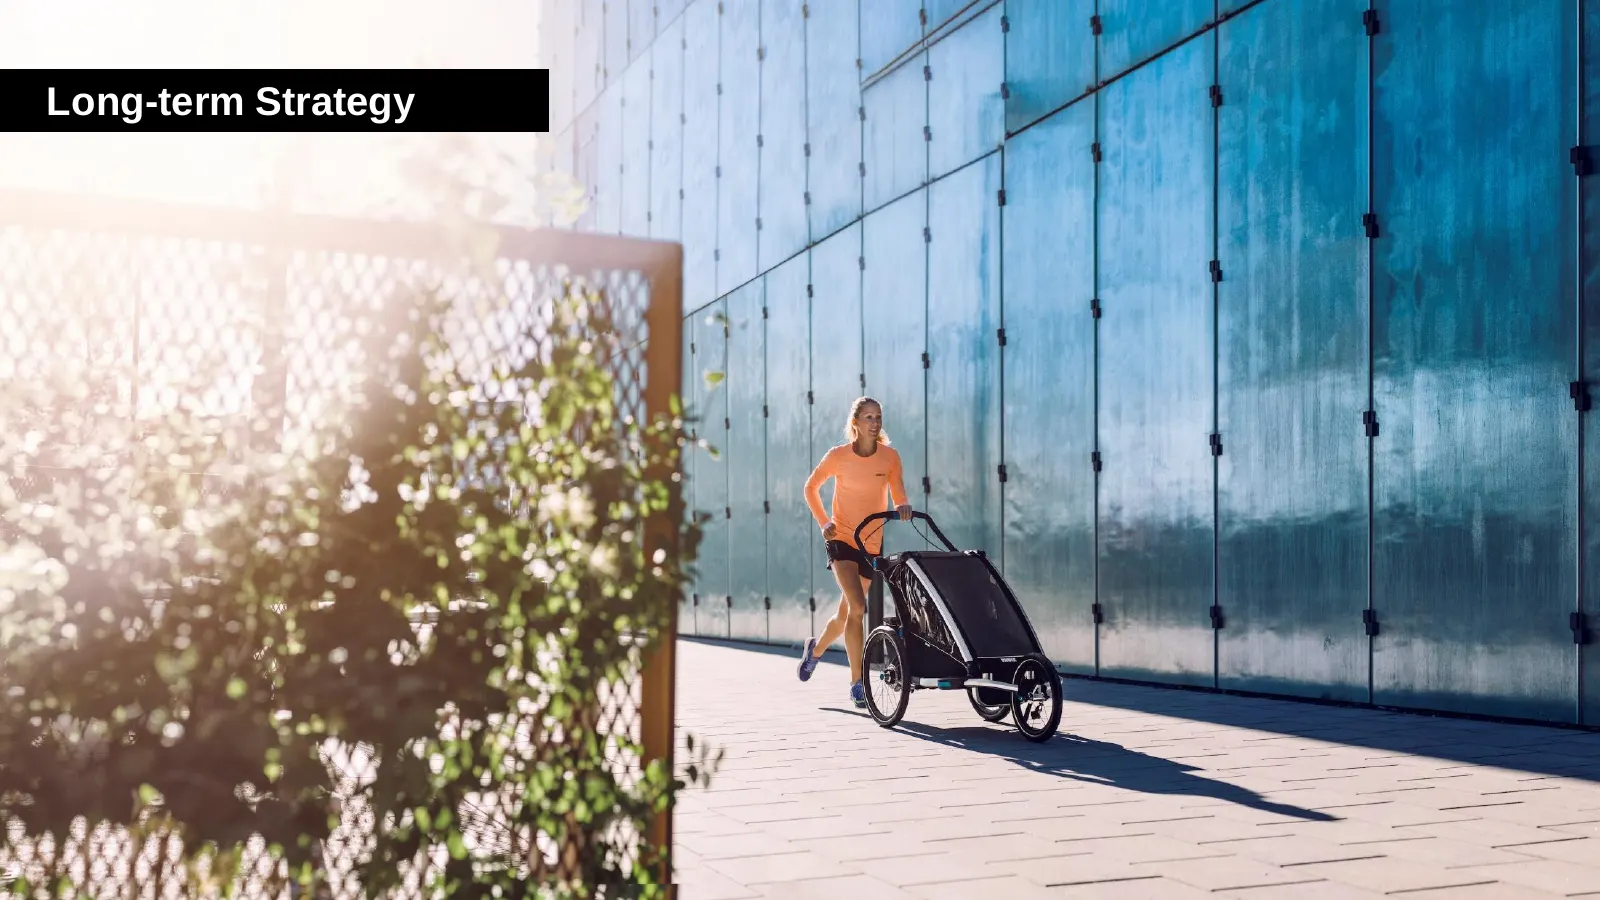
Slide 13: Long-term Strategy
Long-term Strategy on 2 * ~ (Pe bing 7 tes, ae “J 23 a Fy <s *
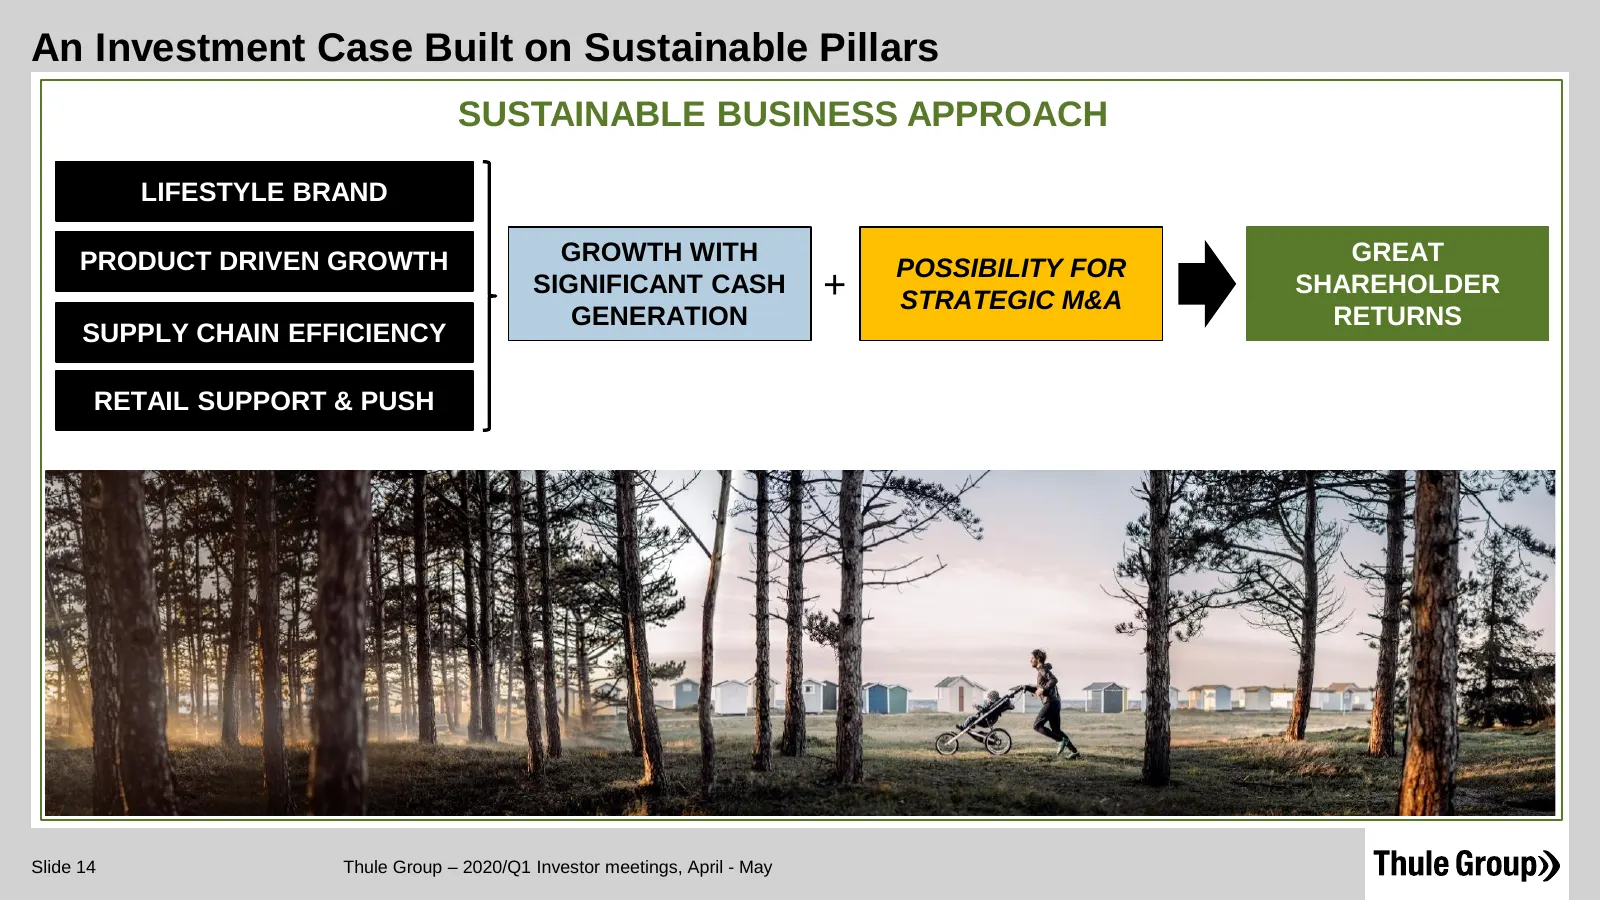
Slide 14: An Investment Case Built on Sustainable Pillars
An Investment Case Built on Sustainable Pillars SUSTAINABLE BUSINESS APPROACH LIFESTYLE BRAND PRODUCT DRIVEN GROWTH GROWTH WITH GREAT POSSIBILITY FOR SIGNIFICANT CASH + STRATEGIC M&A SHAREHOLDER GENERATION RETURNS SUPPLY CHAIN EFFICIENCY RETAIL SUPPORT & PUSH Slide 14 Thule Group – 2020/Q1 Investor
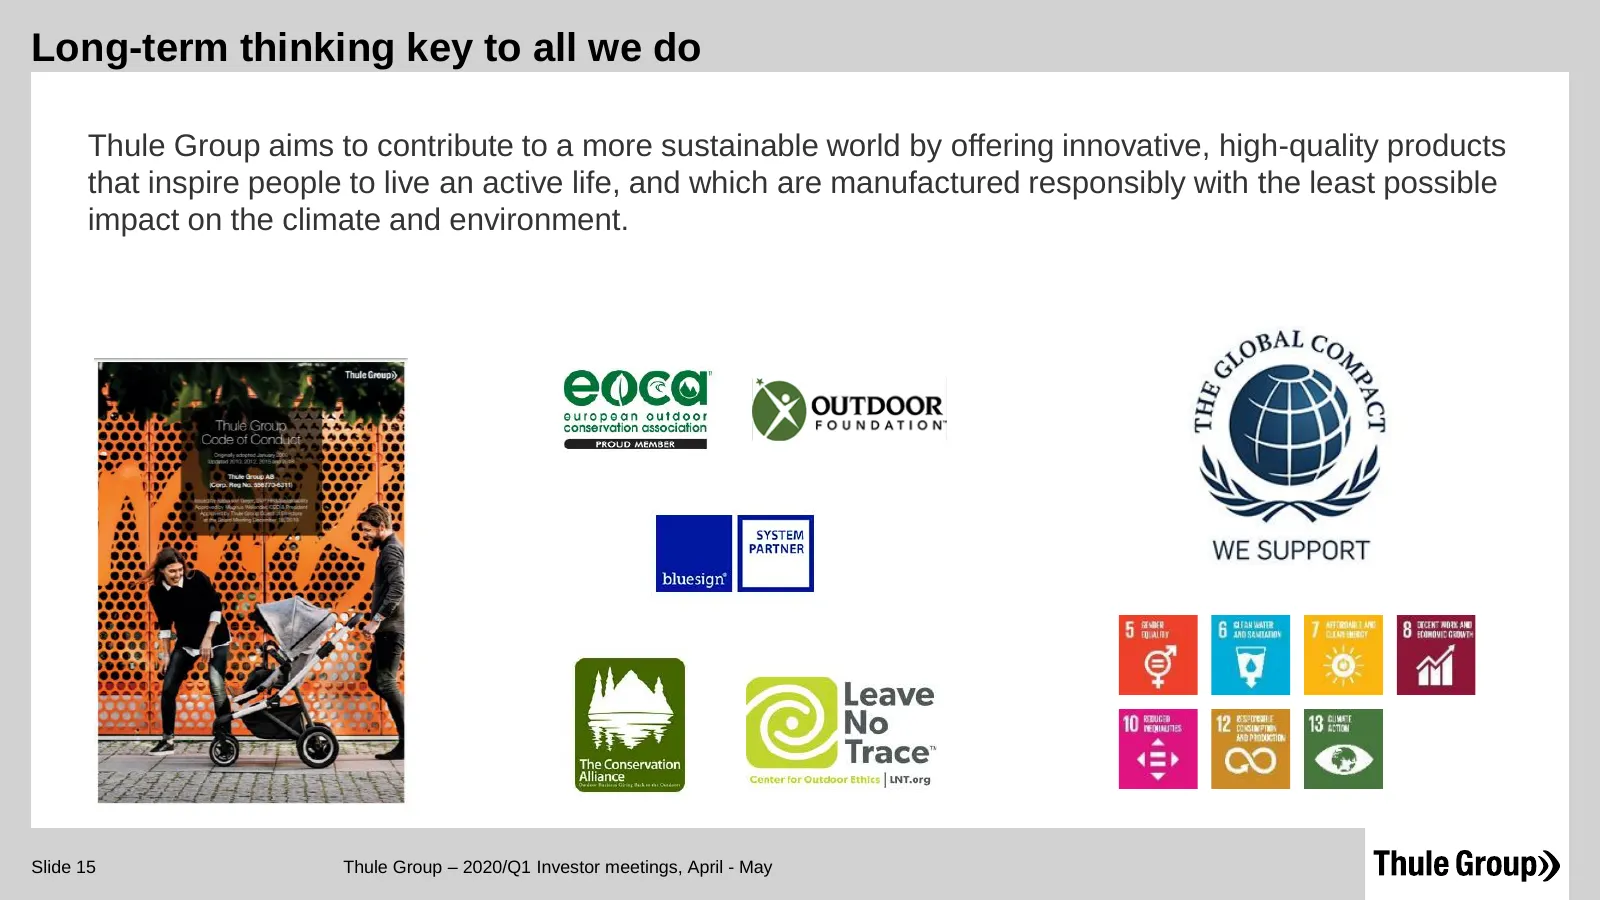
Slide 15: Long-term thinking key to all we do
Long-term thinking key to all we do Thule Group aims to contribute to a more sustainable world by offering innovative, high-quality products that inspire people to live an active life, and which are manufactured responsibly with the least possible impact on the climate and environment. Slide 15 Thul
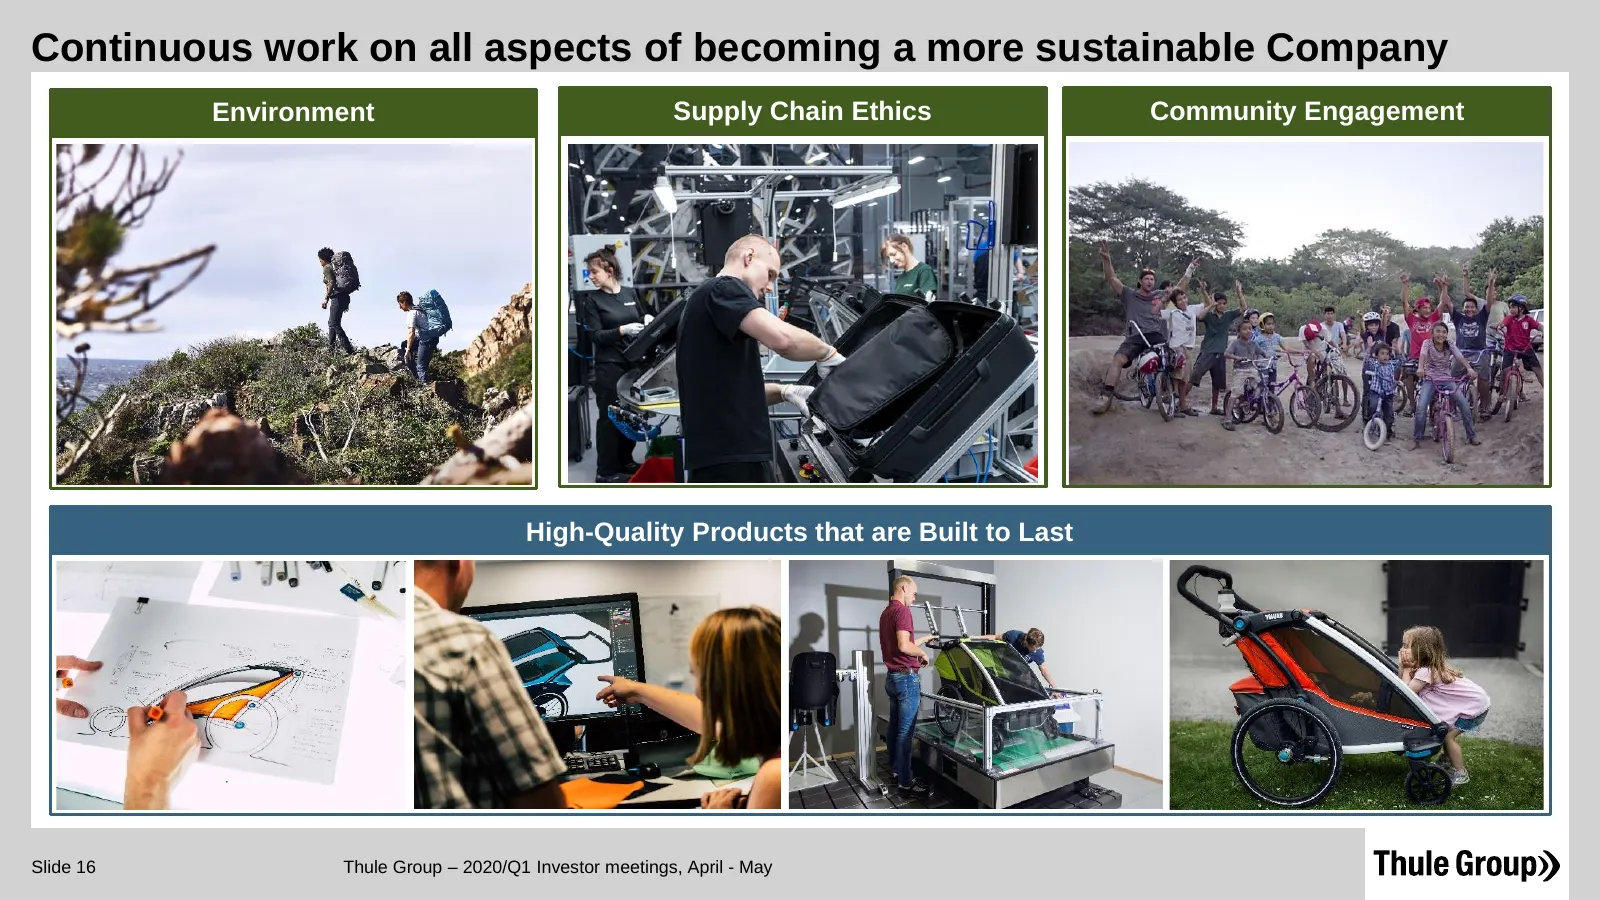
Slide 16: Continuous work on all aspects of becoming a more sustainable Company
Continuous work on all aspects of becoming a more sustainable Company Environment Supply Chain Ethics Community Engagement High-Quality Products that are Built to Last Slide 16 Thule Group – 2020/Q1 Investor meetings, April - May
Slide 17: Thule Group – 2020/Q1 Investor meetings, April - May
Thule Group – 2020/Q1 Investor meetings, 17 April - May

Slide 18: Thule Group – 2020/Q1 Investor meetings, April - May
Thule Group – 2020/Q1 Investor meetings, 18 April - May
Slide 19: Thule Group – 2020/Q1 Investor meetings, April - May
Thule Group – 2020/Q1 Investor meetings, 19 April - May
Slide 20: Thule Group – 2020/Q1 Investor meetings, April - May
Thule Group – 2020/Q1 Investor meetings, 20 April - May
Slide 21: Thule Group – 2020/Q1 Investor meetings, April - May
Thule Group – 2020/Q1 Investor meetings, 21 April - May
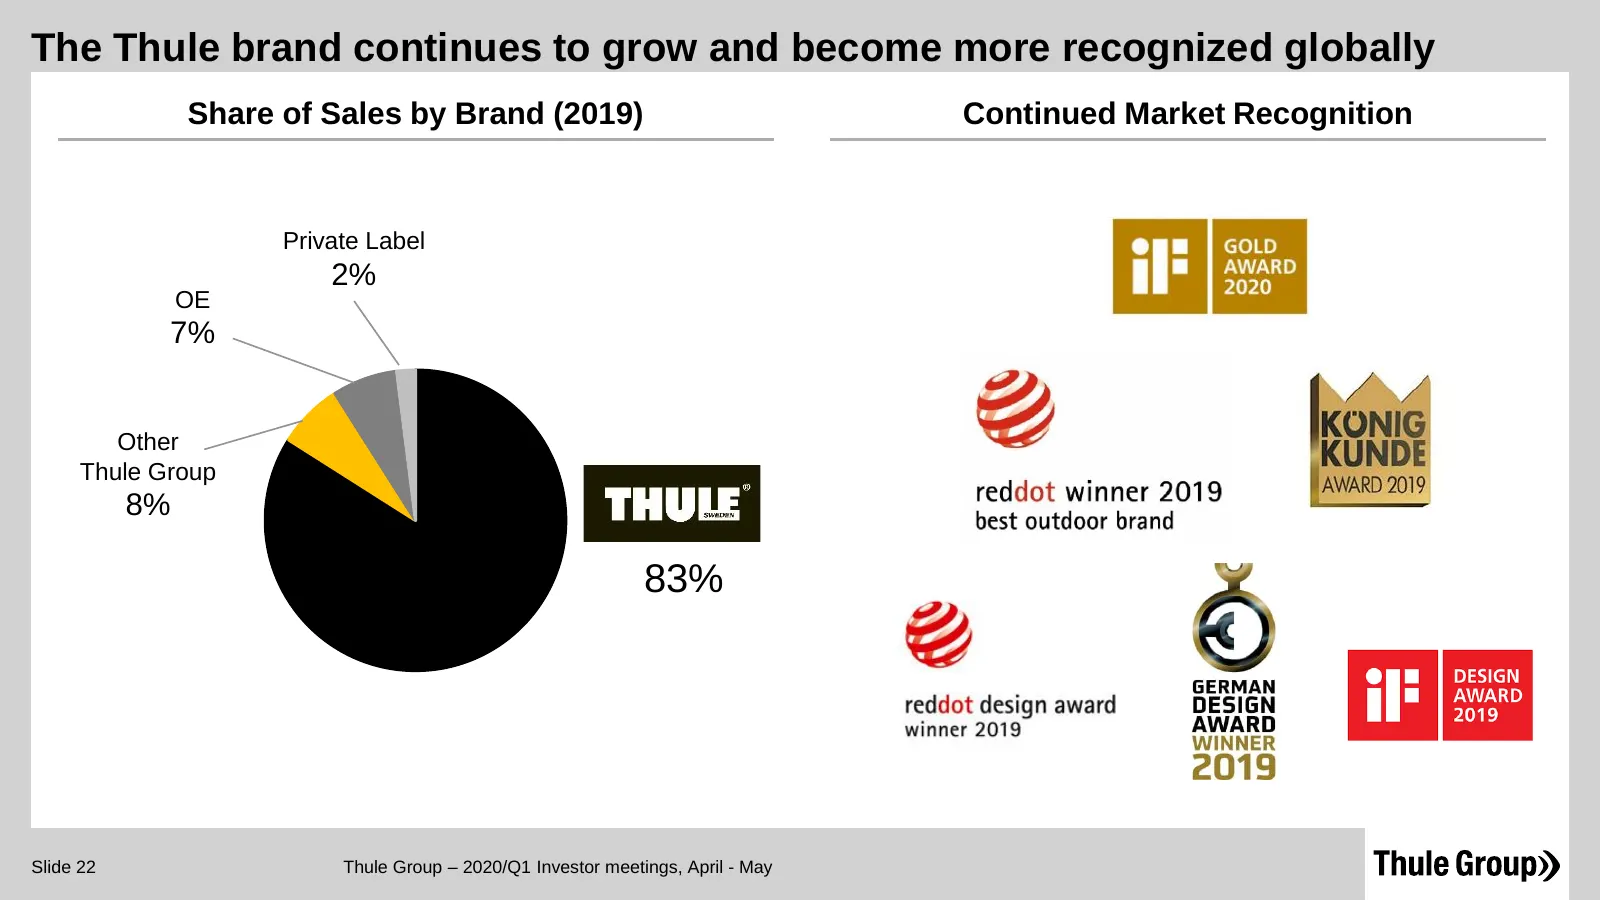
Slide 22: The Thule brand continues to grow and become more recognized globally
The Thule brand continues to grow and become more recognized globally Share of Sales by Brand (2019) Continued Market Recognition Private Label 2% OE 7% Other Thule Group 8% 83% Slide 22 Thule Group – 2020/Q1 Investor meetings, April - May
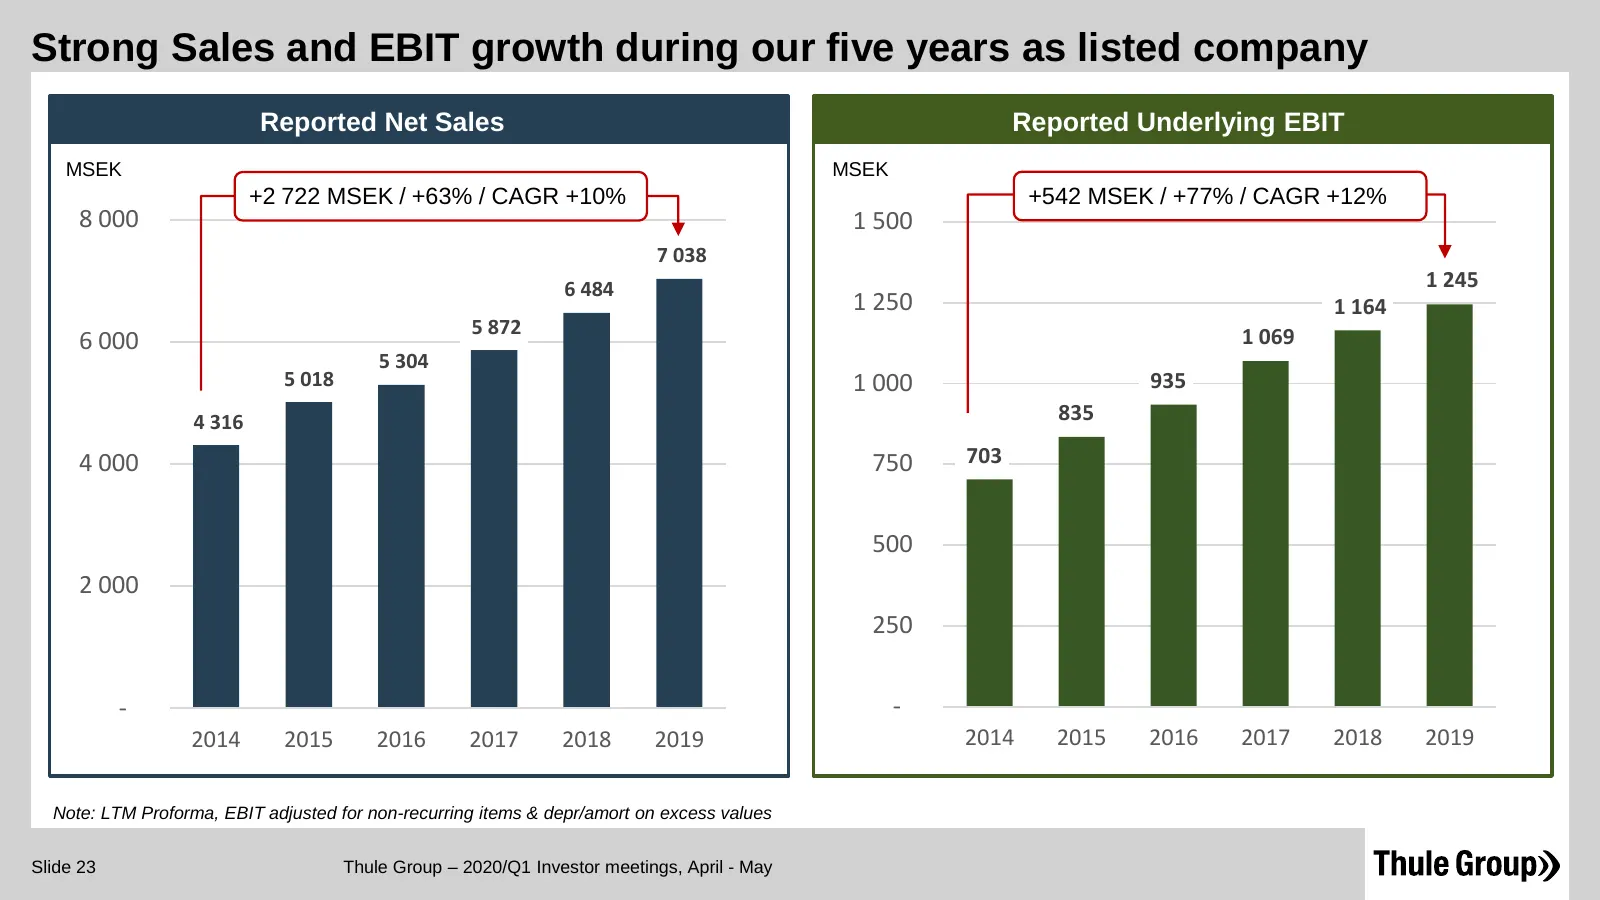
Slide 23: Strong Sales and EBIT growth during our five years as listed company
Strong Sales and EBIT growth during our five years as listed company Reported Net Sales Reported Underlying EBIT MSEK MSEK +2 722 MSEK / +63% / CAGR +10% +542 MSEK / +77% / CAGR +12% 8 000 1 500 7 038 6 484 1 245 1 250 1 164 5 872 1 069 6 000 5 304 5 018 1 000 935 4 316 835 4 000 750 703 500 2 000 2
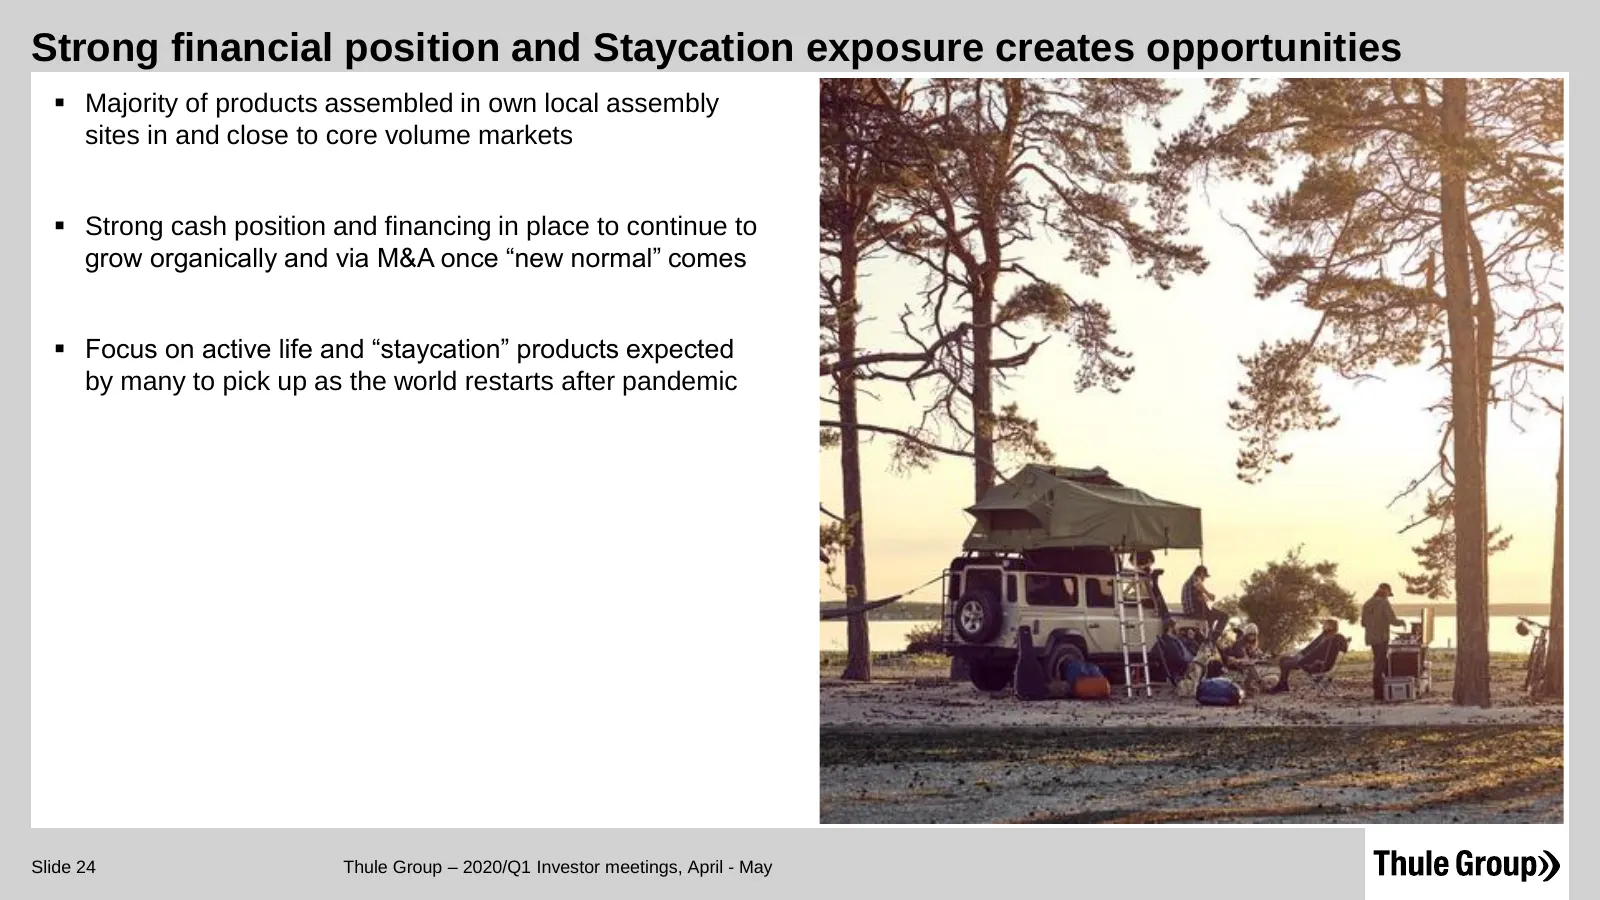
Slide 24: Strong financial position and Staycation exposure creates opportunities
Strong financial position and Staycation exposure creates opportunities ▪ Majority of products assembled in own local assembly sites in and close to core volume markets ▪ Strong cash position and financing in place to continue to grow organically and via M&A once “new normal” comes ▪ Focus on active
Slide 25: Q&A
Q&A
Slide 26: Disclaimer
Disclaimer ▪ This presentation has been prepared by Thule Group AB (publ) (the “Company”) solely for use at this presentation and is furnished to you solely for your information and may not be reproduced or redistributed, in whole or in part, to any other person. The presentation does not constitute
Slide 27: Active Life, Simplified
Thule Group») ACTIVE LIFE, SIMPLIFIED
Source: Internet Archive copy of thulegroup.com
More decks from Thule Group AB
 Q3 2026 Earnings Presentation23 slides · Oct 22, 2026
 Q3 2026 Earnings Presentation13 slides · Sep 23, 2026
 Q2 2026 Earnings Presentation23 slides · Jul 20, 2026
 Corporate Update (June 2026)13 slides · Jun 17, 2026
 Q1 2026 Earnings Presentation23 slides · Apr 29, 2026
 Q4 2025 Earnings Presentation13 slides · Mar 30, 2026