Flagstar Bank, N.A. · NYSE:FLG
Flagstar Bank, N.A — New York Community Bancorp — Shareholder Meeting (June 2018)
34 slides from Flagstar Bank, N.A's shareholder meeting presentation, Jun 5, 2018
Slide 1: Annual Meeting of Shareholders
Annual Meeting of Shareholders June 5, 2018
Slide 2: Cautionary Statements
Cautionary Statements Forward-Looking Information This presentation may include forward‐looking statements by the Company and our authorized officers pertaining to such matters as our goals, intentions, and expectations regarding revenues, earnings, loan production, asset quality, capital levels, an
Slide 3: We rank among the largest U.S. bank holding companies
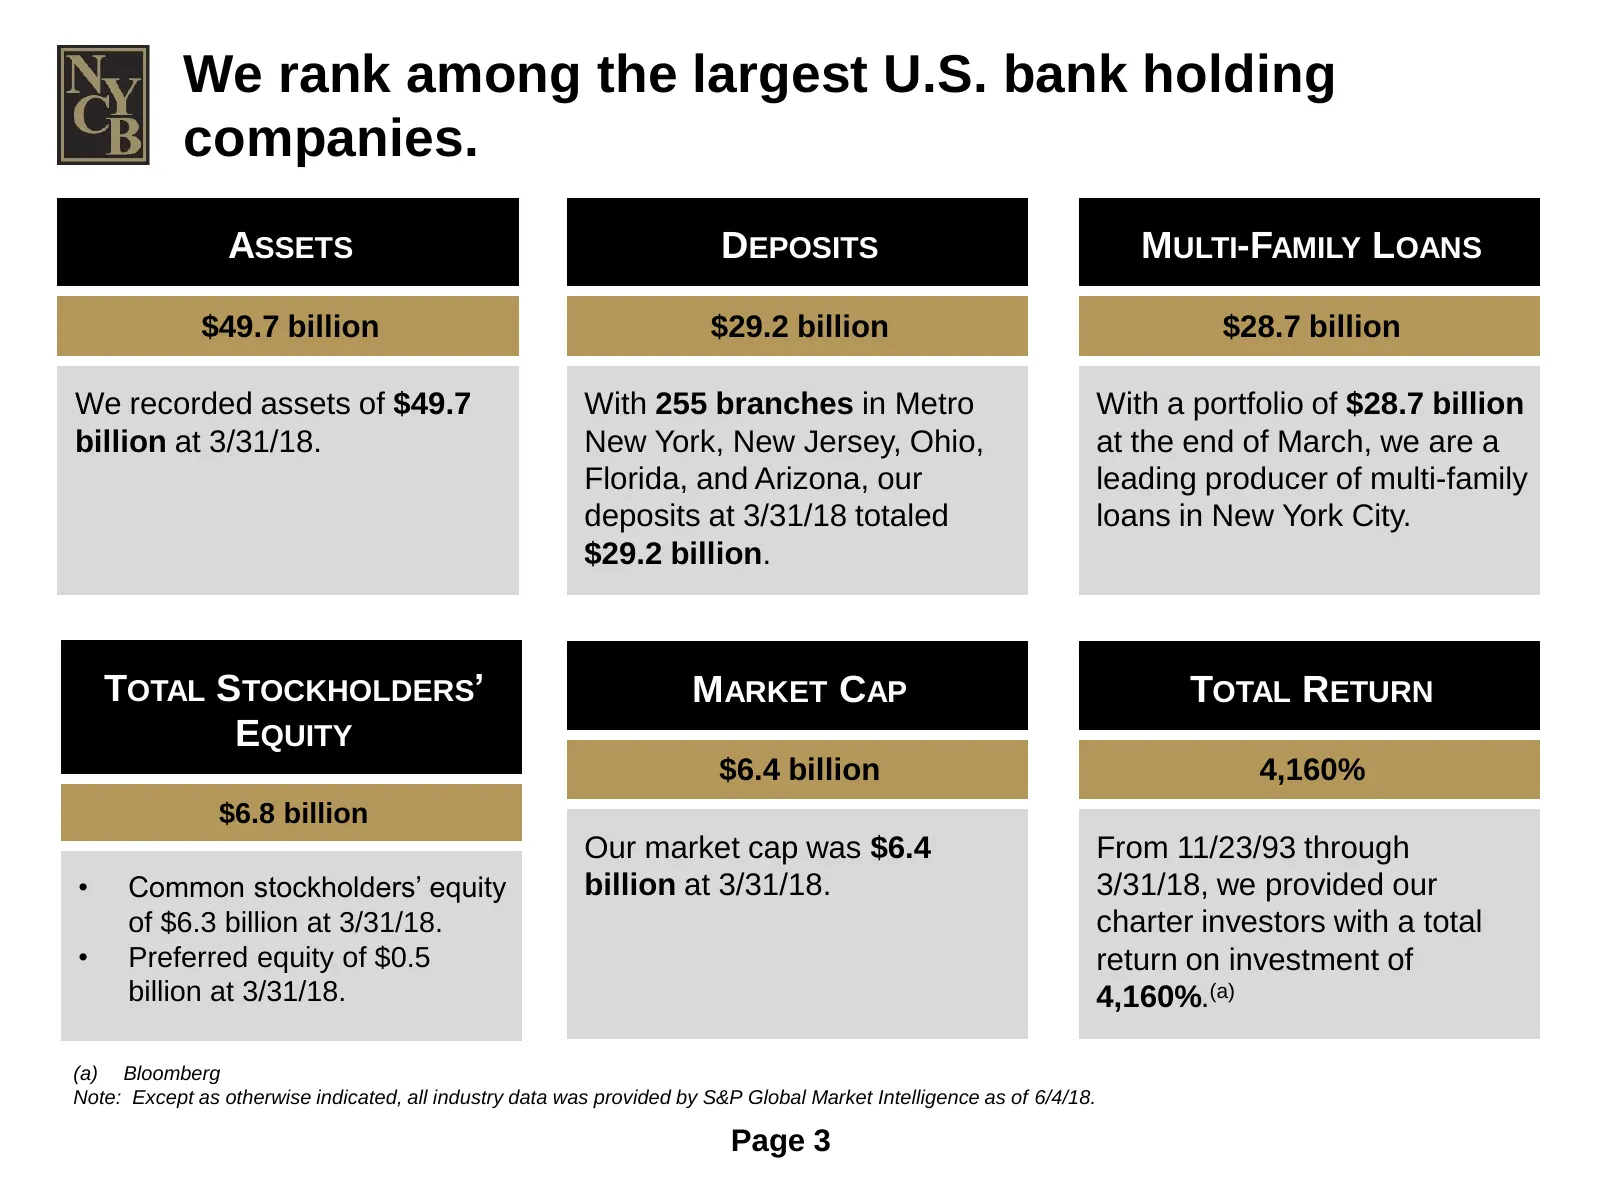
We rank among the largest U.S. bank holding companies. ASSETS DEPOSITS MULTI-FAMILY LOANS $49.7 billion $29.2 billion $28.7 billion We recorded assets of $49.7 With 255 branches in Metro With a portfolio of $28.7 billion billion at 3/31/18. New York, New Jersey, Ohio, at the end of March, we are a F
Slide 4: Performance Highlights
PERFORMANCE HIGHLIGHTS
Slide 5: Income Statement Highlights
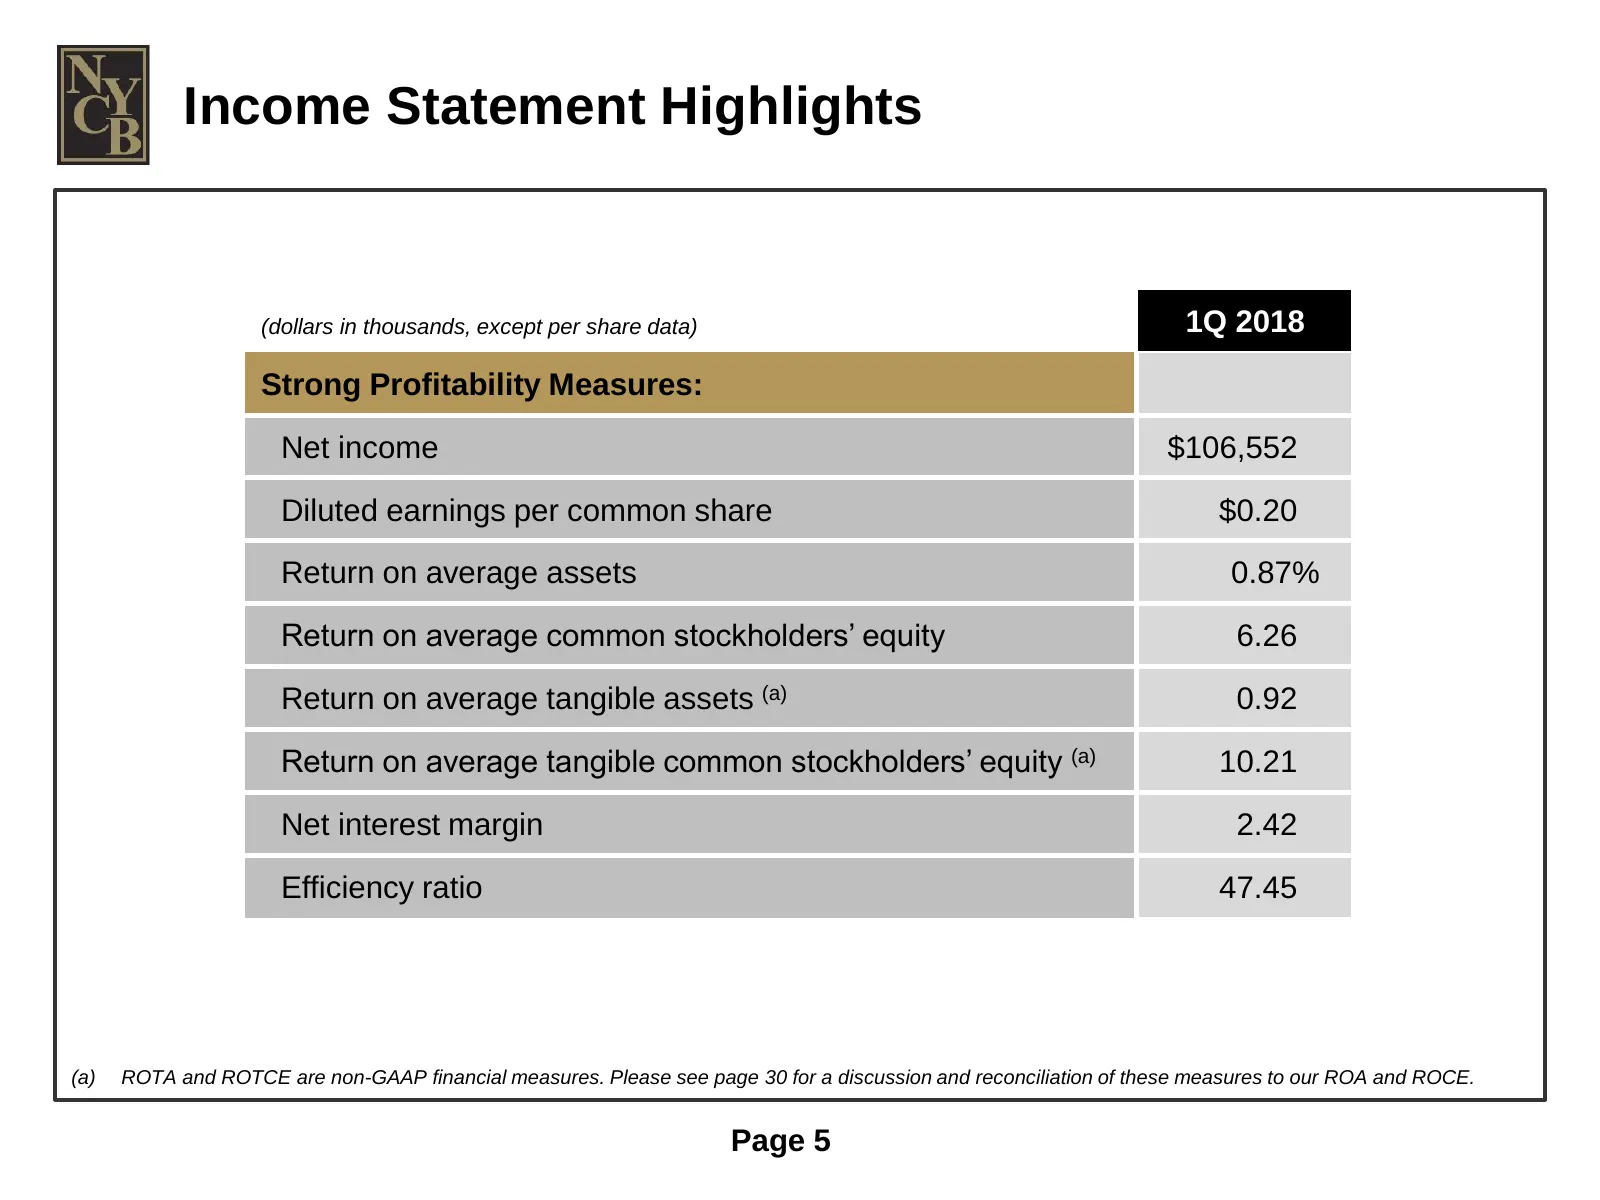
Income Statement Highlights (dollars in thousands, except per share data) 1Q 2018 Strong Profitability Measures: Net income $106,552 Diluted earnings per common share $0.20 Return on average assets 0.87% Return on average common stockholders’ equity 6.26 Return on average tangible assets (a) 0.92 Re
Slide 6: Balance Sheet Highlights
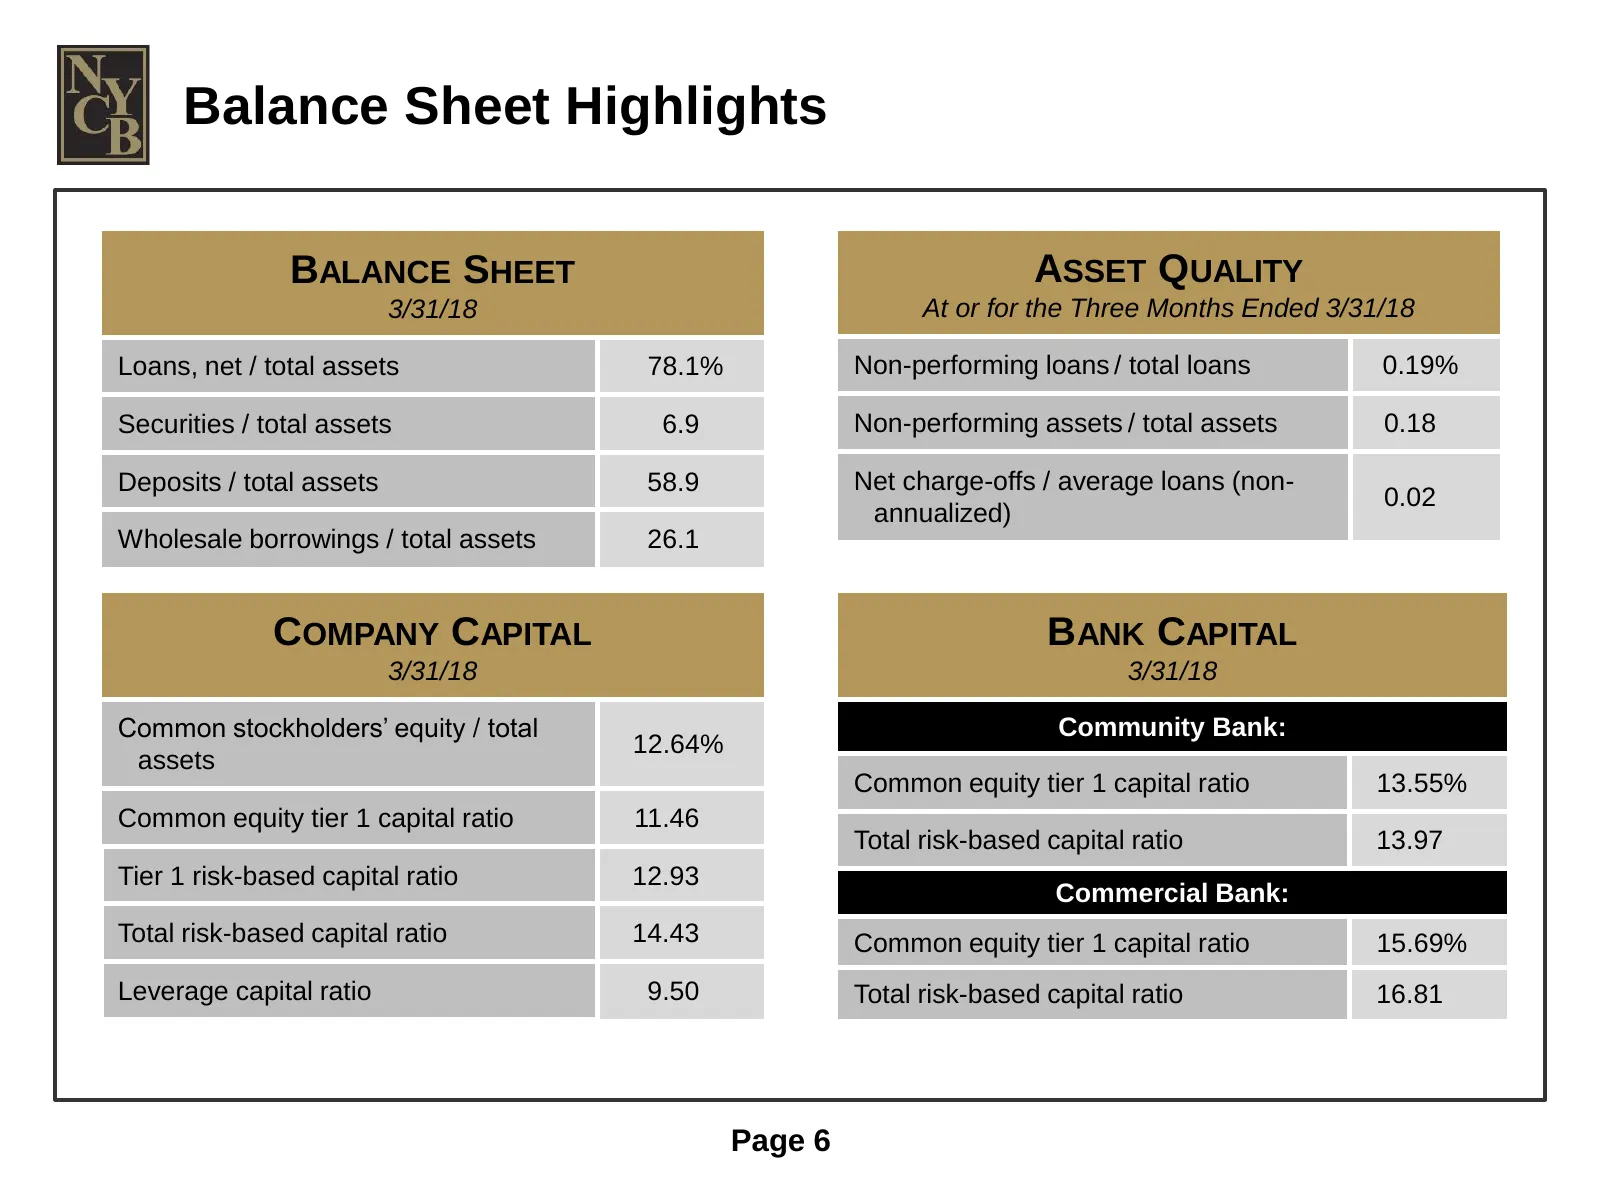
Balance Sheet Highlights BALANCE SHEET ASSET QUALITY 3/31/18 At or for the Three Months Ended 3/31/18 Loans, net / total assets 78.1% Non-performing loans / total loans 0.19% Securities / total assets 6.9 Non-performing assets / total assets 0.18 Deposits / total assets 58.9 Net charge-offs / averag
Slide 7: Loans and Deposits
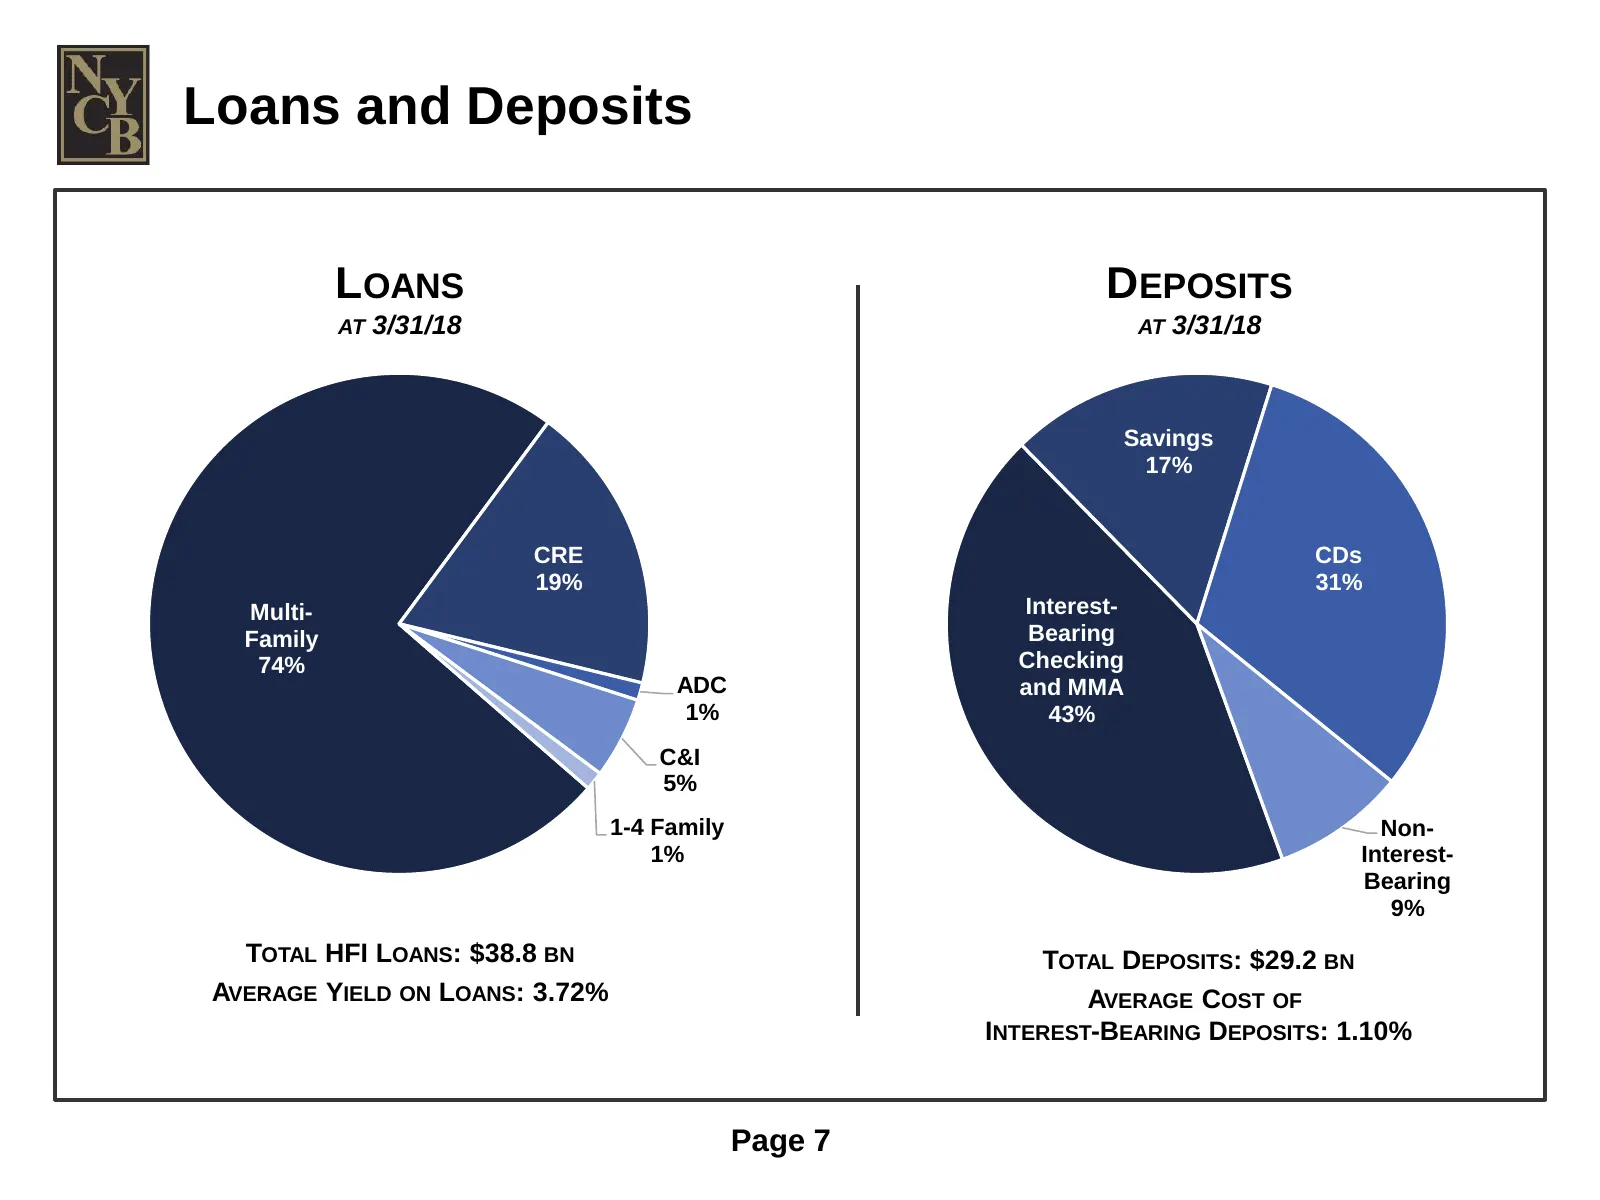
Loans and Deposits LOANS DEPOSITS AT 3/31/18 AT 3/31/18 Savings 17% CRE CDs 19% 31% Multi- Interest- Family Bearing 74% Checking ADC and MMA 1% 43% C&I 5% 1-4 Family Non- 1% Interest- Bearing 9% TOTAL HFI LOANS: $38.8 BN TOTAL DEPOSITS: $29.2 BN AVERAGE YIELD ON LOANS: 3.72% AVERAGE COST OF INTEREST
Slide 8: Our regulatory capital ratios exceed those of our peers
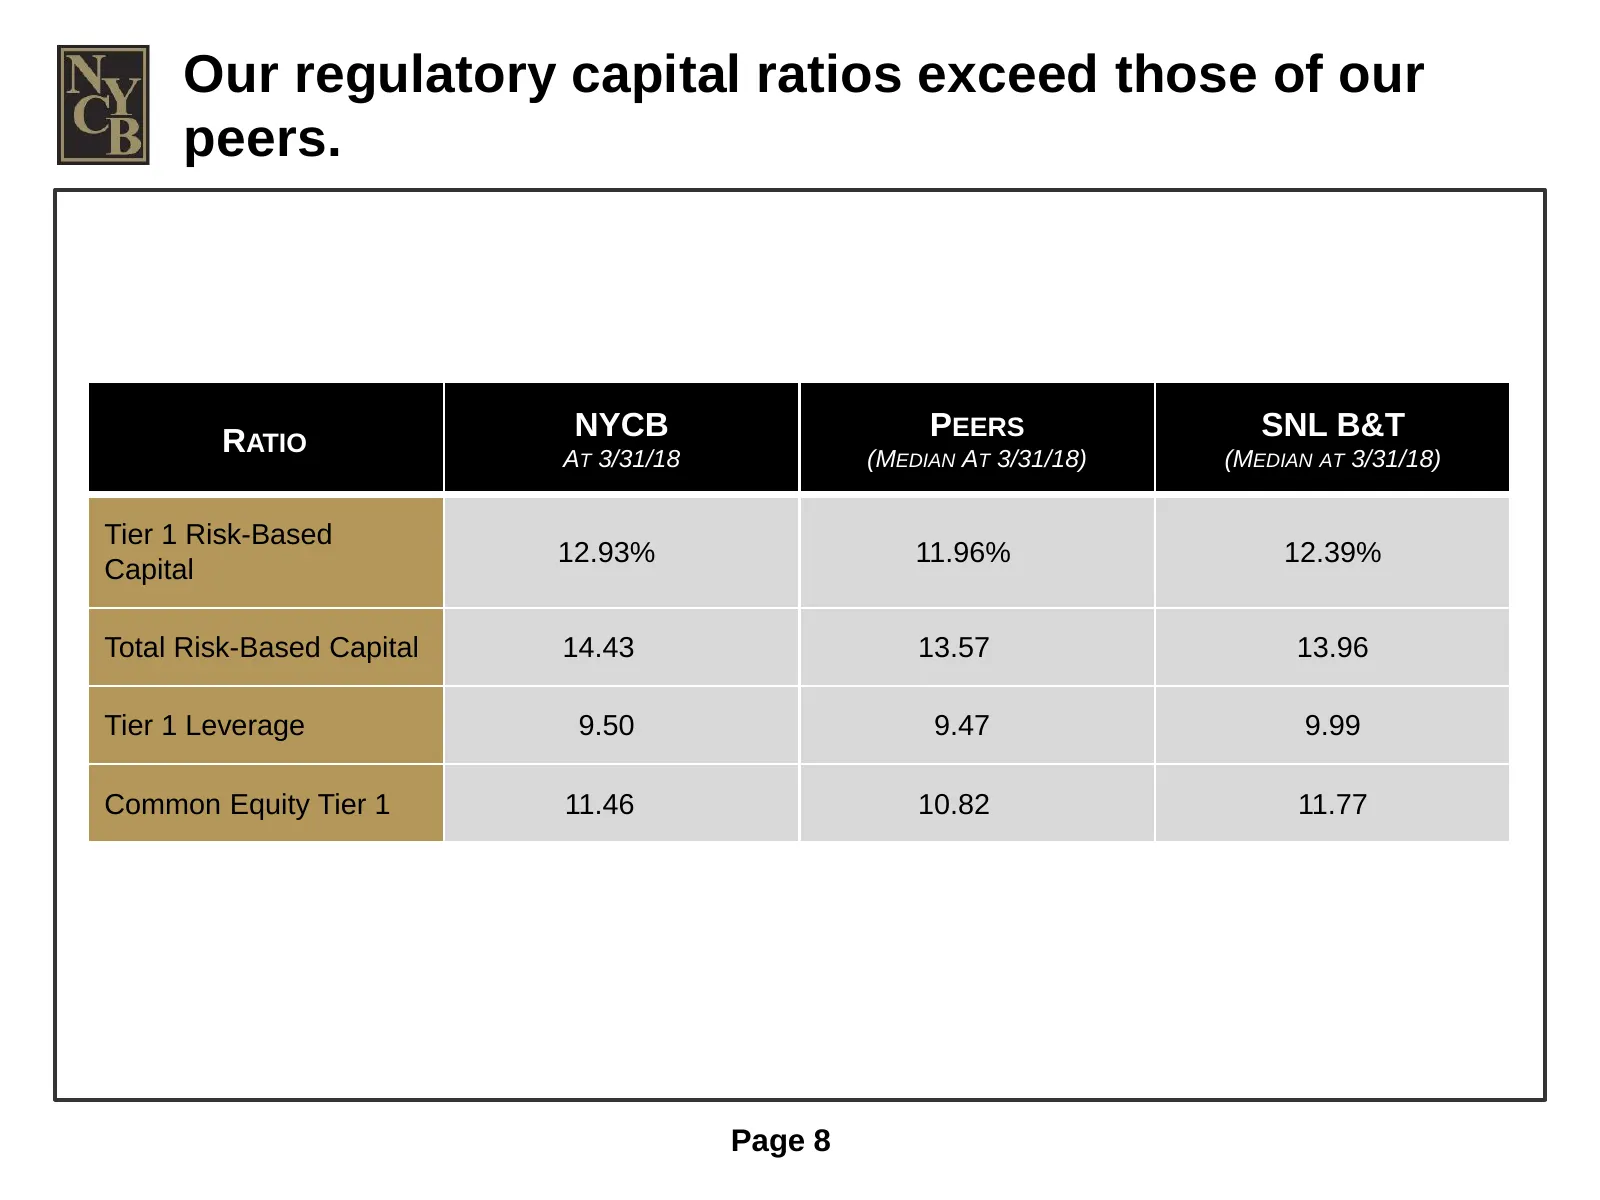
Our regulatory capital ratios exceed those of our peers. RATIO NYCB PEERS SNL B&T AT 3/31/18 (MEDIAN AT 3/31/18) (MEDIAN AT 3/31/18) Tier 1 Risk-Based 12.93% 11.96% 12.39% Capital Total Risk-Based Capital 14.43 13.57 13.96 Tier 1 Leverage 9.50 9.47 9.99 Common Equity Tier 1 11.46 10.82 11.77 Page 8
Slide 9: Our 2017 Performance Ranks Among the Top 10
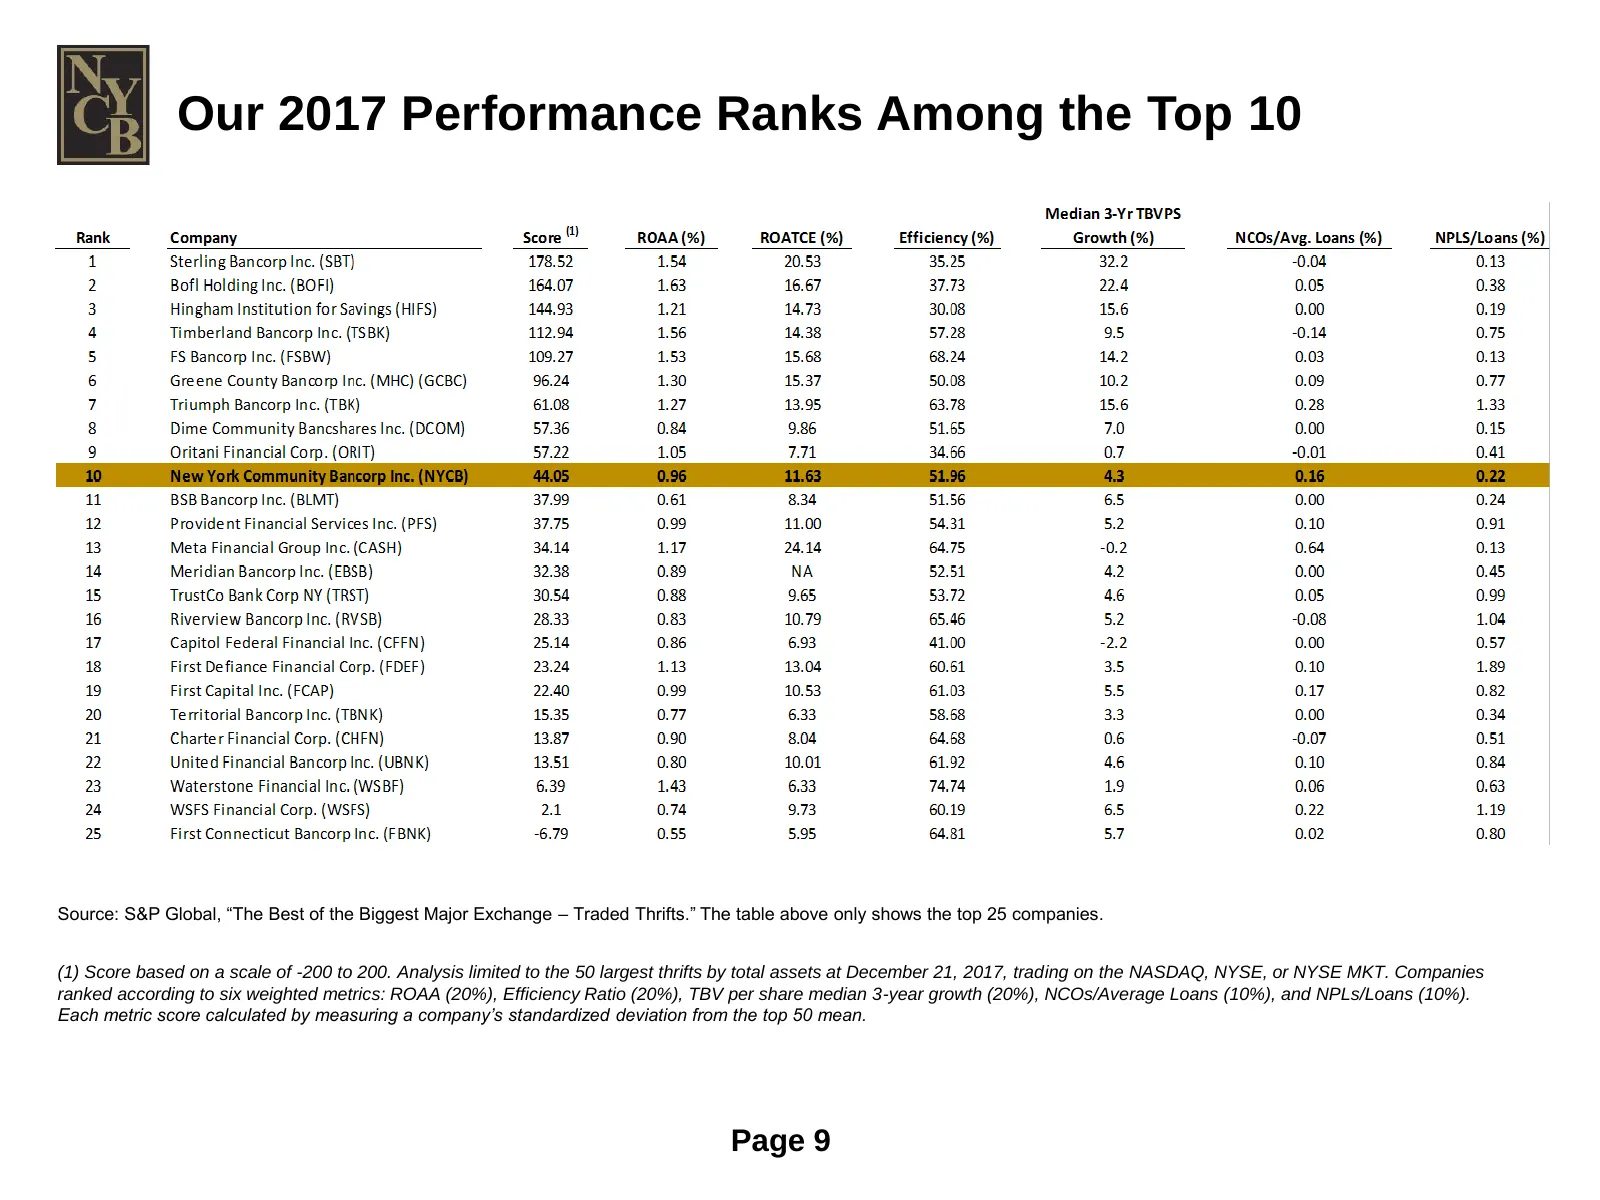
Our 2017 Performance Ranks Among the Top 10 Source: S&P Global, “The Best of the Biggest Major Exchange – Traded Thrifts.” The table above only shows the top 25 companies. (1) Score based on a scale of -200 to 200. Analysis limited to the 50 largest thrifts by total assets at December 21, 2017, trad
Slide 10: In 2017, We Took Several Measures to Re-Position the Company for Growth
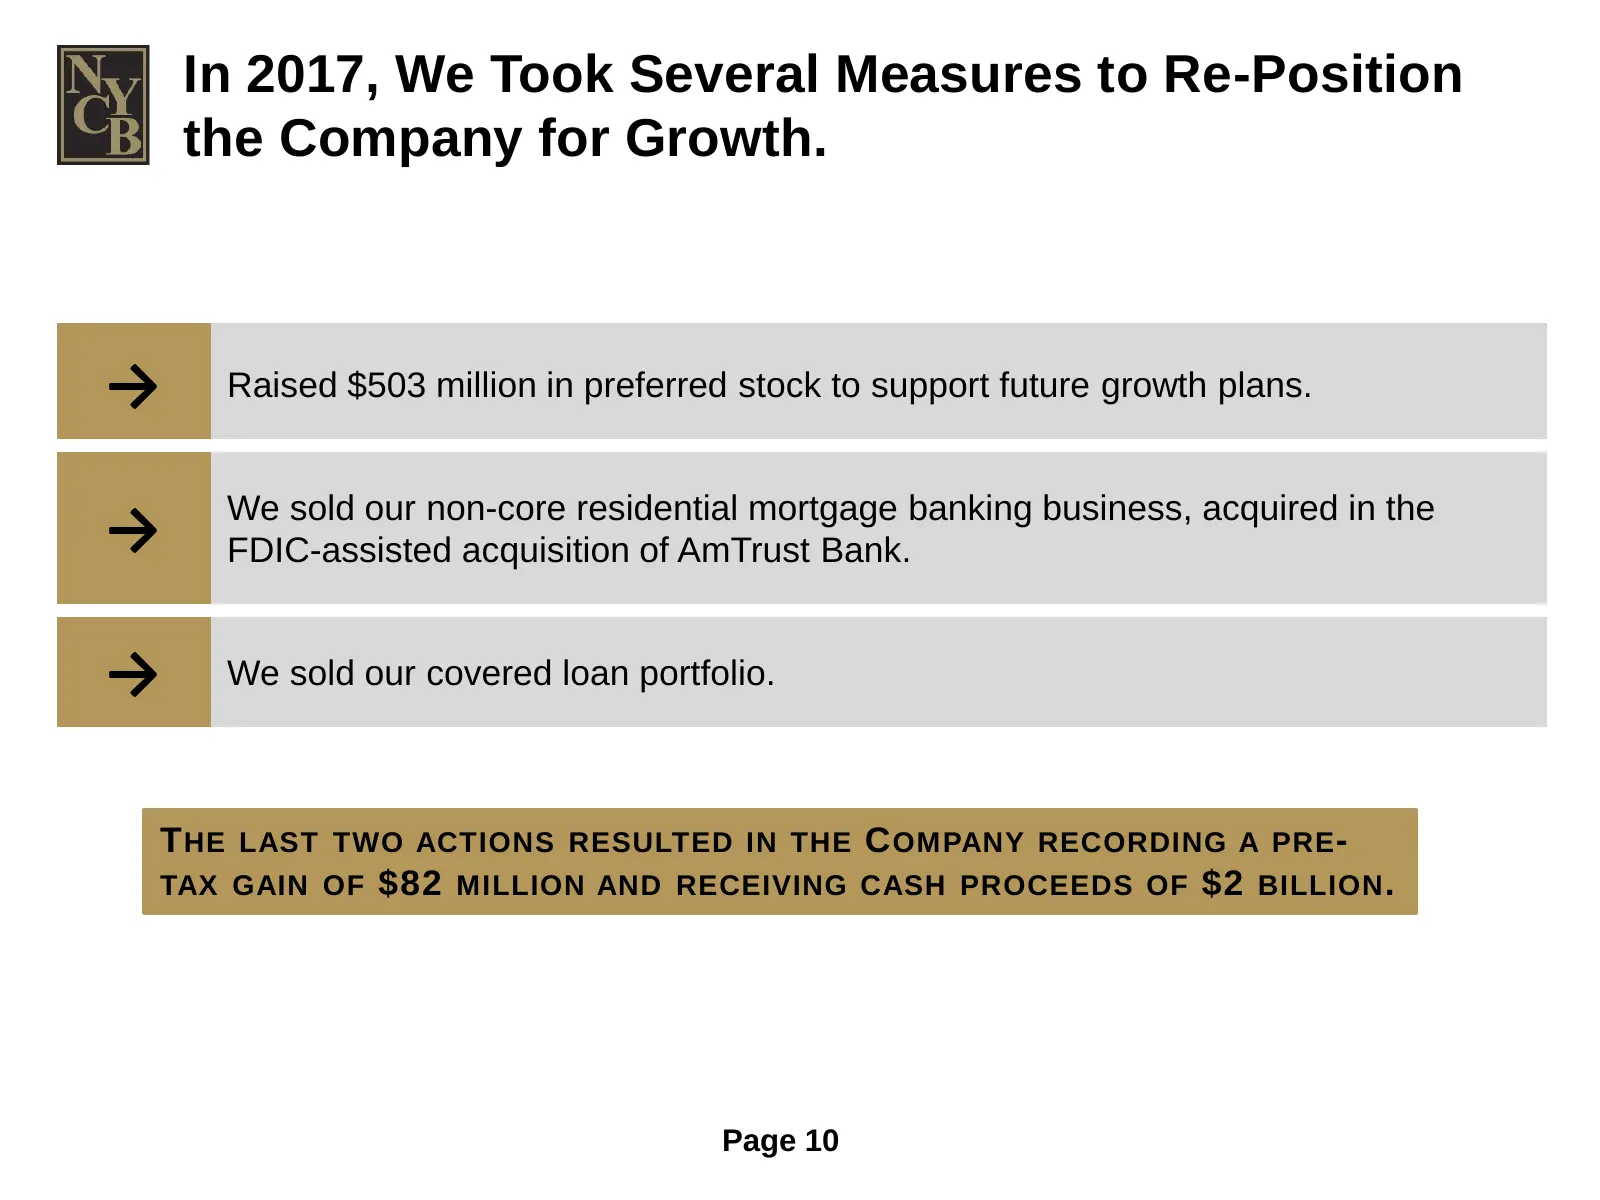
In 2017, We Took Several Measures to Re-Position the Company for Growth. → Raised $503 million in preferred stock to support future growth plans. We sold our non-core residential mortgage banking business, acquired in the → FDIC-assisted acquisition of AmTrust Bank. → We sold our covered loan portfo
Slide 11: We are a main beneficiary of tax-reform and regulatory relief legislation
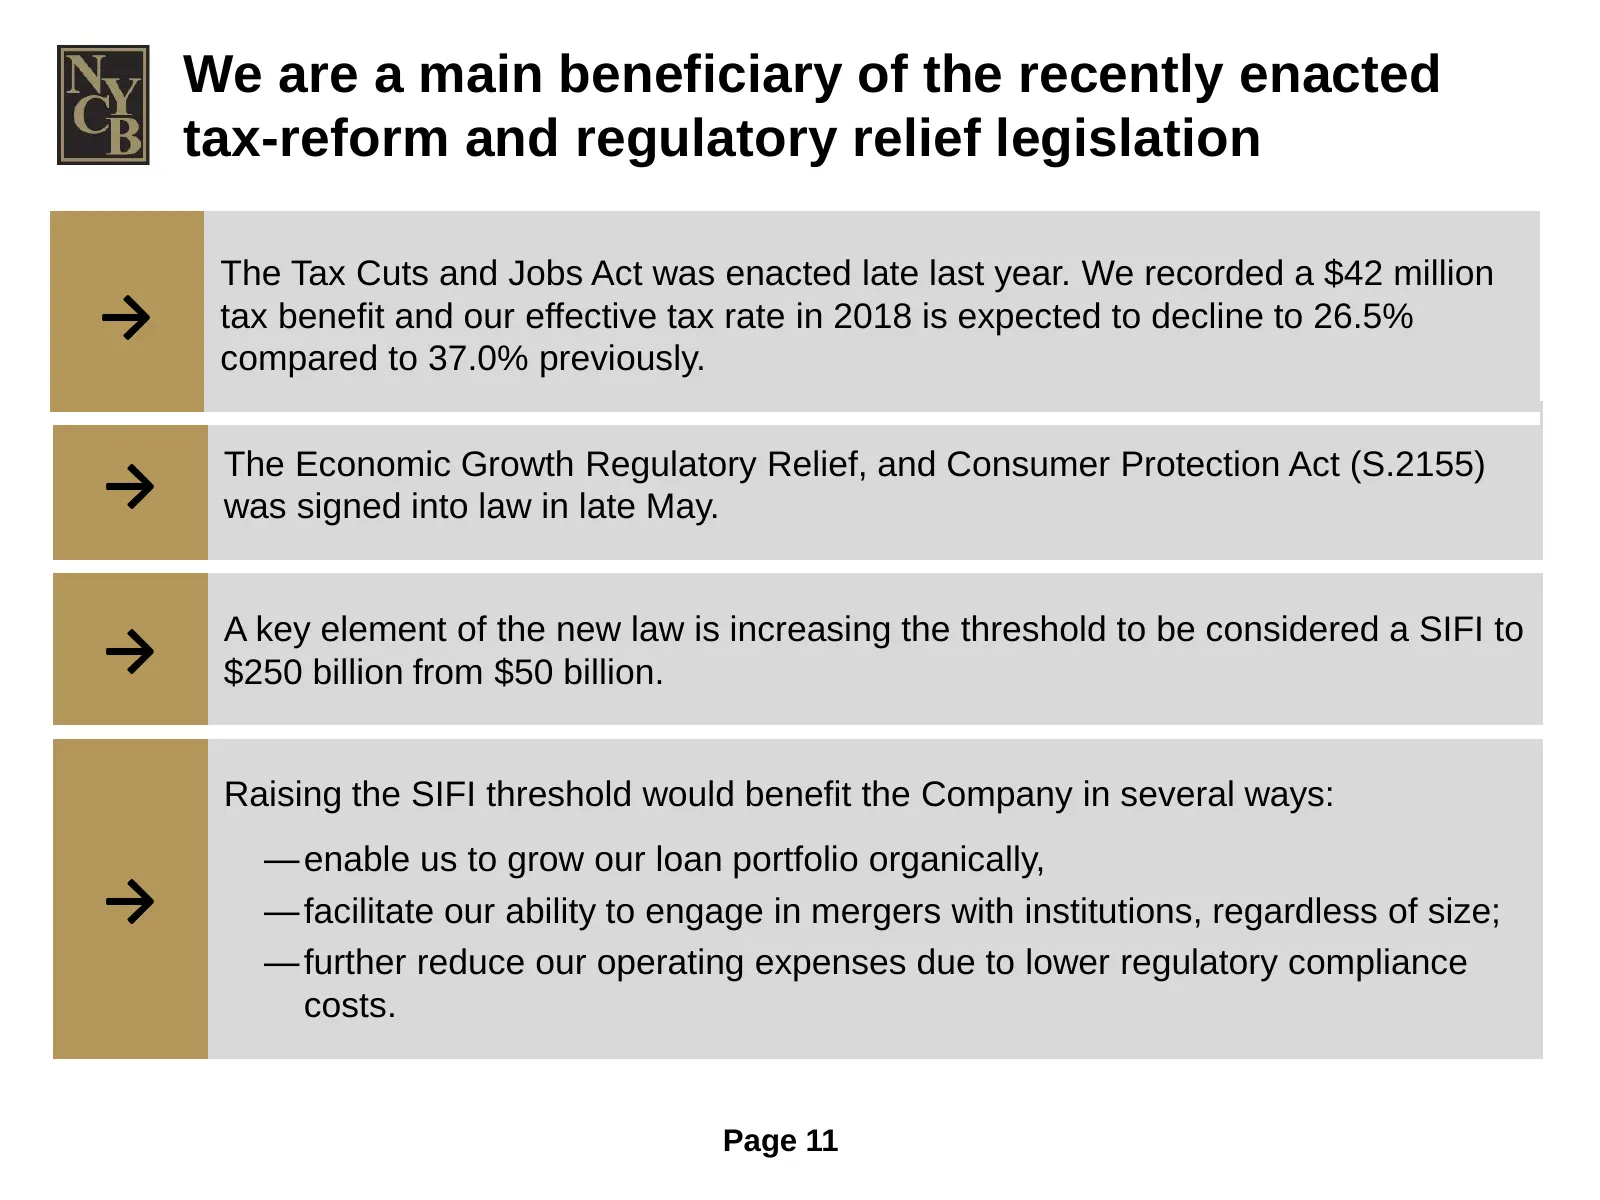
We are a main beneficiary of the recently enacted tax-reform and regulatory relief legislation The Tax Cuts and Jobs Act was enacted late last year. We recorded a $42 million → tax benefit and our effective tax rate in 2018 is expected to decline to 26.5% compared to 37.0% previously. The Economic G
Slide 12: Asset Growth Prior to and Since Dodd-Frank was Enacted
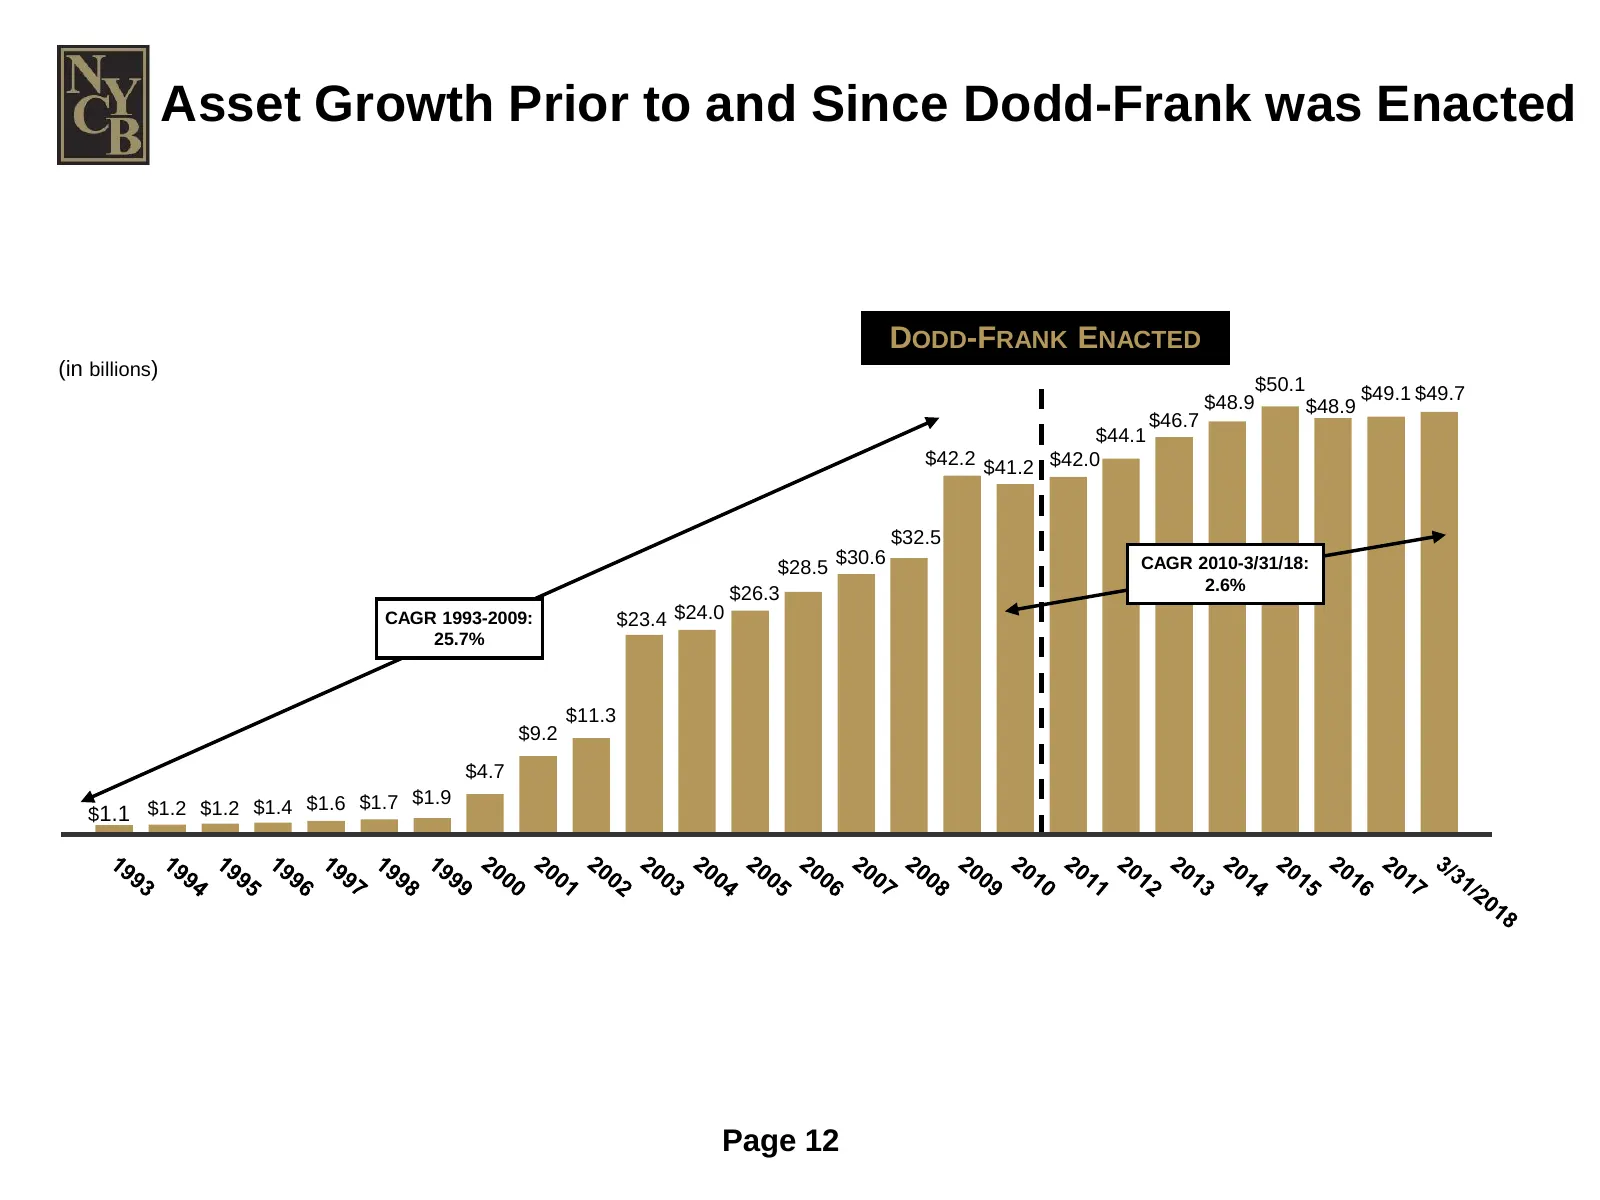
Asset Growth Prior to and Since Dodd-Frank was Enacted DODD-FRANK ENACTED (in billions) $50.1 $49.1 $49.7 $48.9 $48.9 $46.7 $44.1 $42.2 $41.2 $42.0 $32.5 $28.5 $30.6 CAGR 2010-3/31/18: 2.6% $26.3 CAGR 1993-2009: $23.4 $24.0 25.7% $11.3 $9.2 $4.7 $1.6 $1.7 $1.9 $1.1 $1.2 $1.2 $1.4 Page 12

Slide 13: Looking Forward
LOOKING FORWARD
Slide 14: Levers for Future Earnings Growth
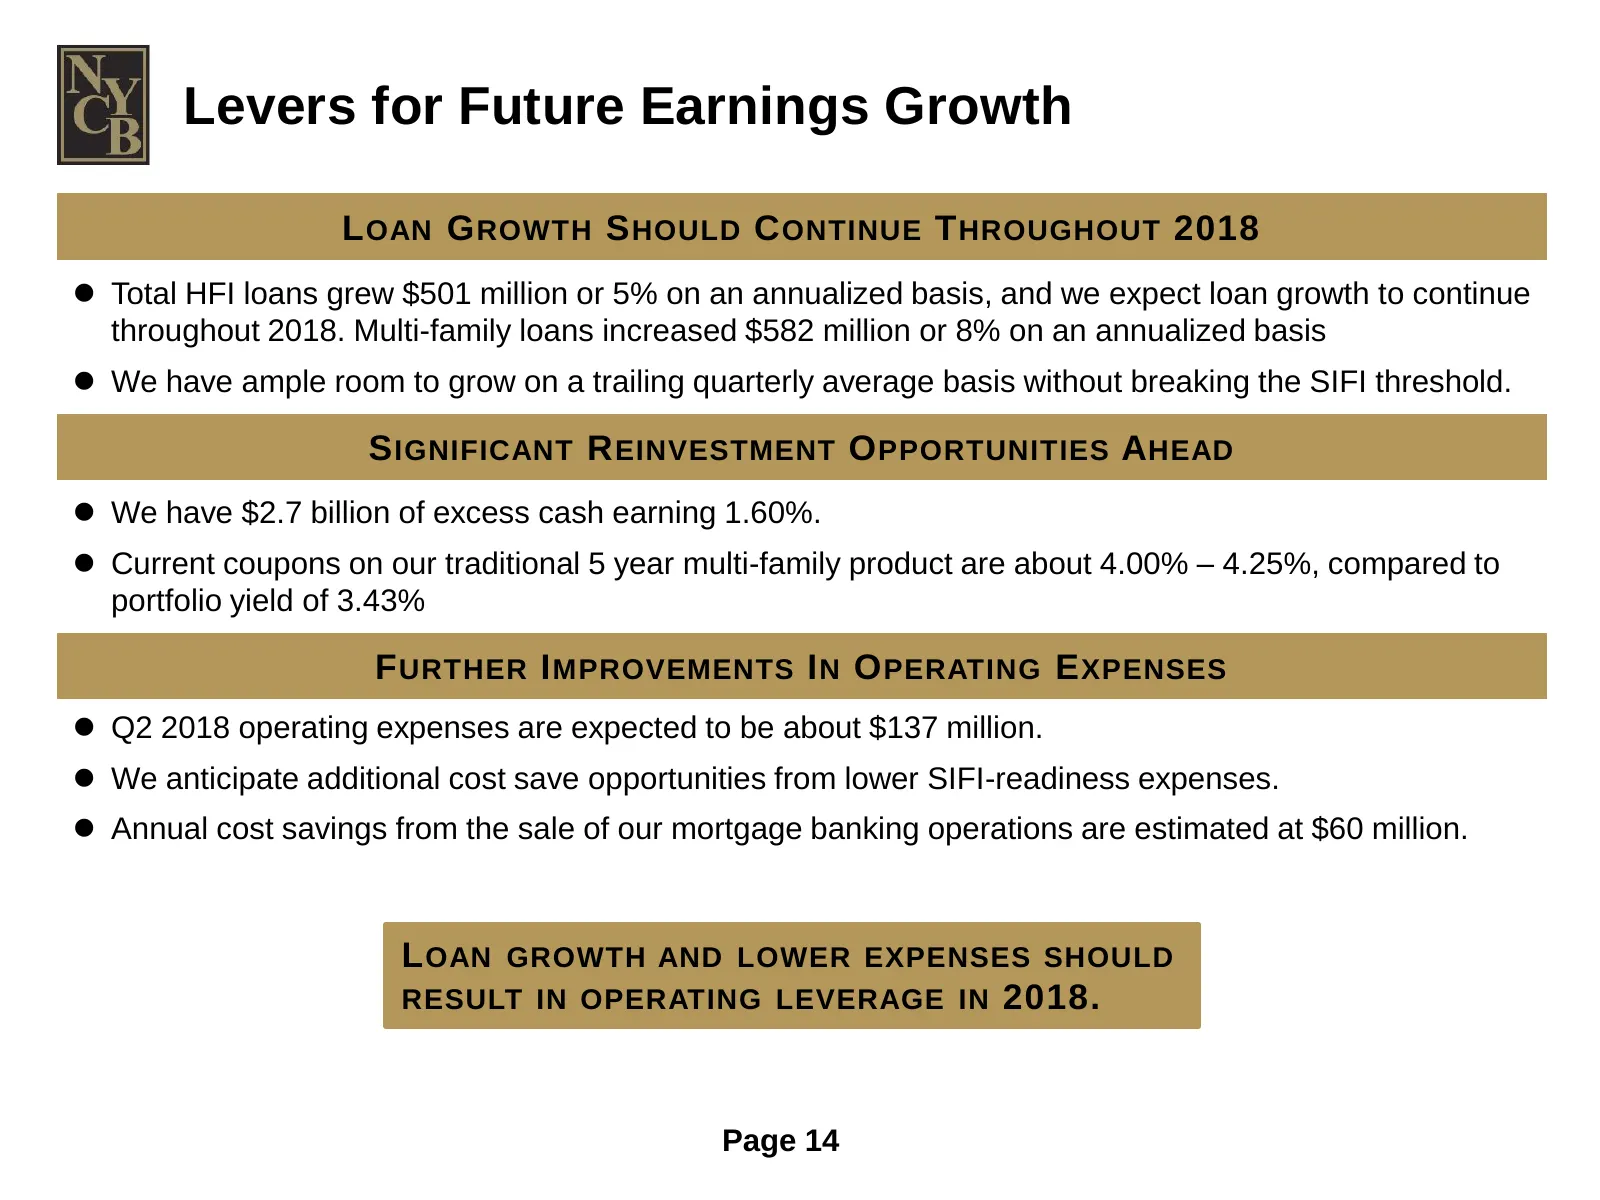
Levers for Future Earnings Growth L OAN G ROWTH S HOULD C ONTINUE T HROUGHOUT 2018 Total HFI loans grew $501 million or 5% on an annualized basis, and we expect loan growth to continue throughout 2018. Multi-family loans increased $582 million or 8% on an annualized basis We have ample room to g

Slide 15: Our Business Model
OUR BUSINESS MODEL
Slide 16: Strategic Loan Production
STRATEGIC LOAN PRODUCTION
Slide 17: We are a leading producer of multi-family loans on non-luxury apartment buildings in NYC
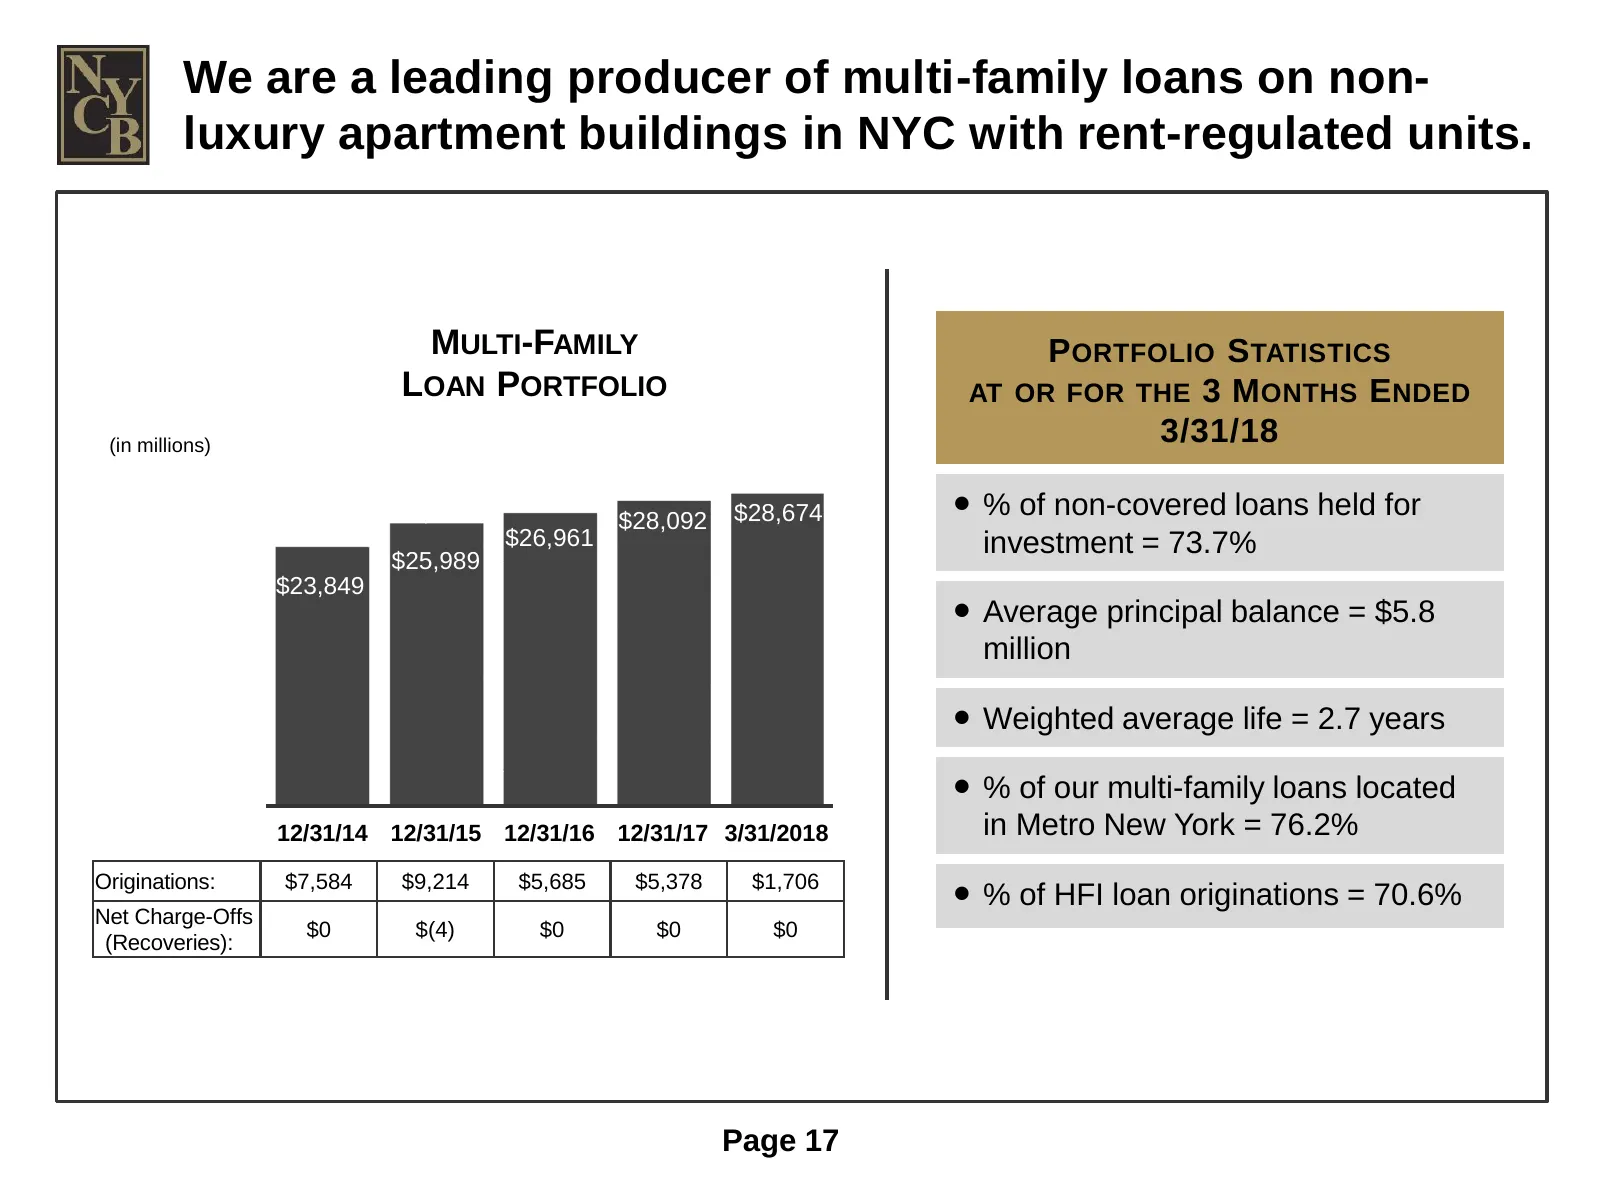
We are a leading producer of multi-family loans on non- luxury apartment buildings in NYC with rent-regulated units. MULTI-FAMILY PORTFOLIO STATISTICS LOAN PORTFOLIO AT OR FOR THE 3 M ONTHS E NDED (in millions) 3/31/18 $28,092 $28,674 ● % of non-covered loans held for $26,961 investment = 73.7% $25,
Slide 18: The way we lend in this market niche has distinguished our performance
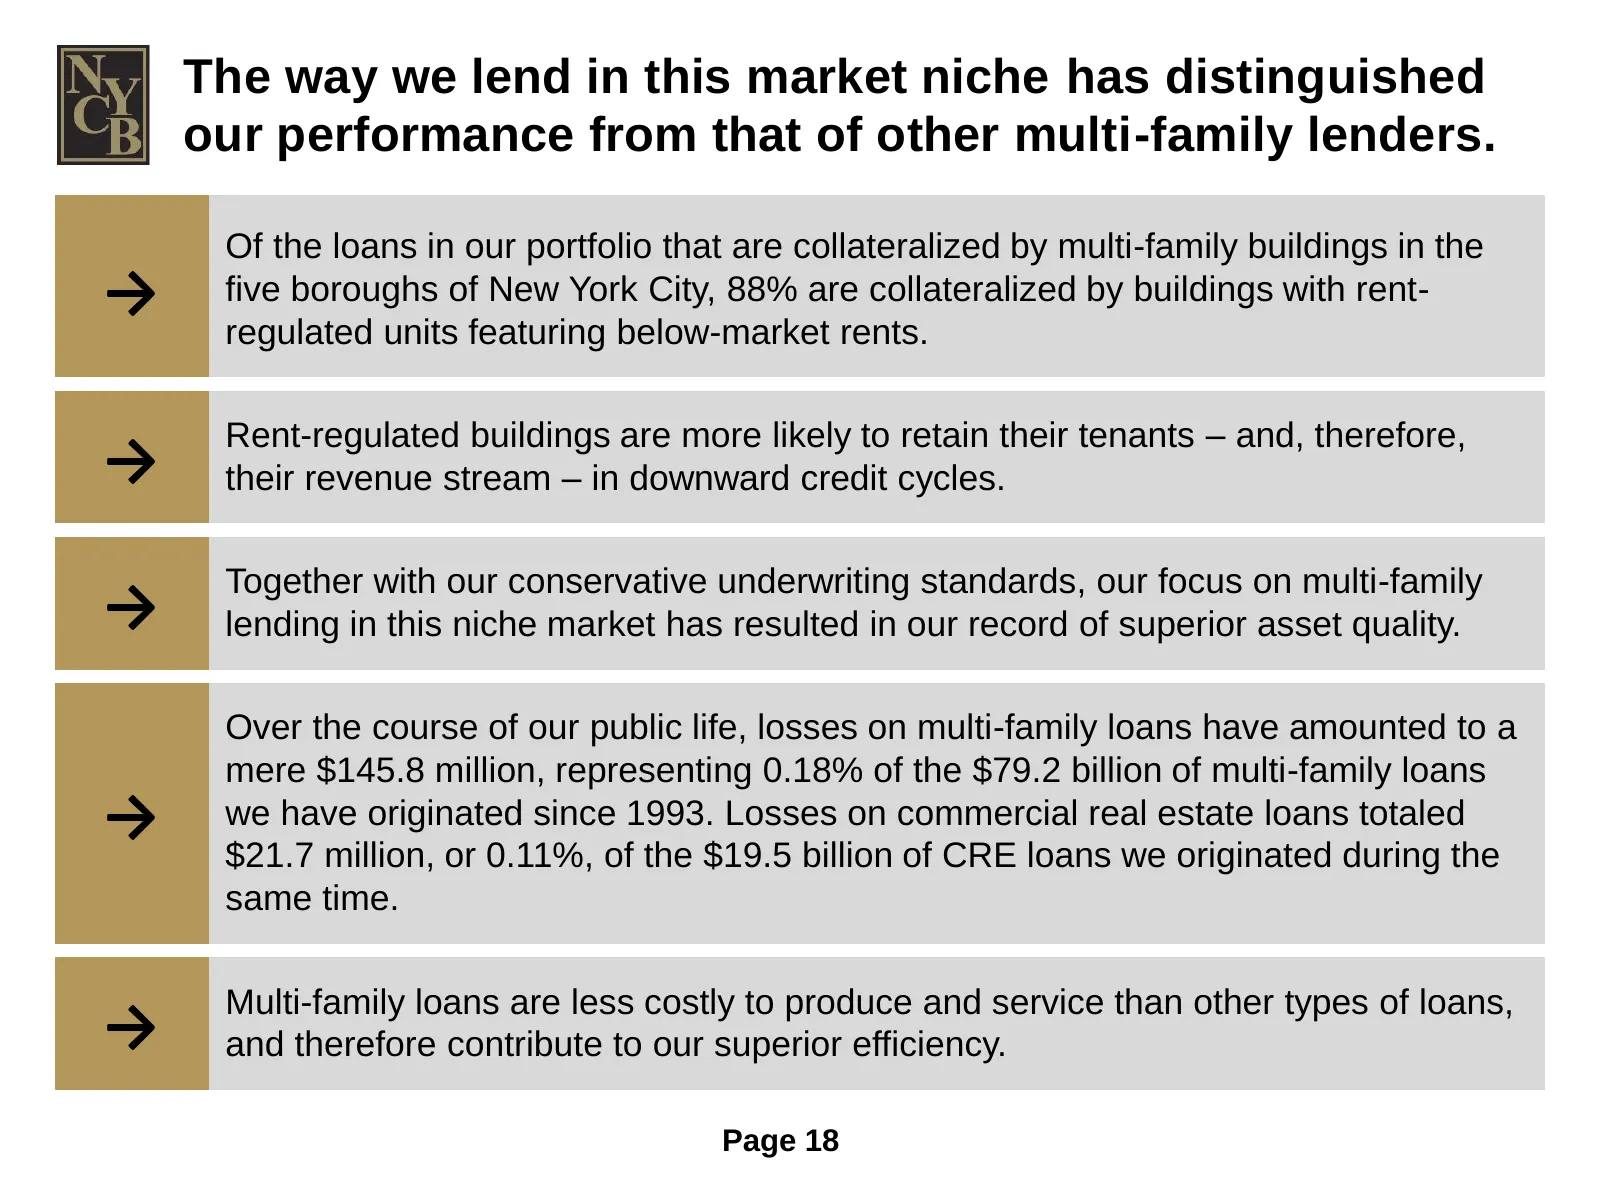
The way we lend in this market niche has distinguished our performance from that of other multi-family lenders. Of the loans in our portfolio that are collateralized by multi-family buildings in the → five boroughs of New York City, 88% are collateralized by buildings with rent- regulated units feat
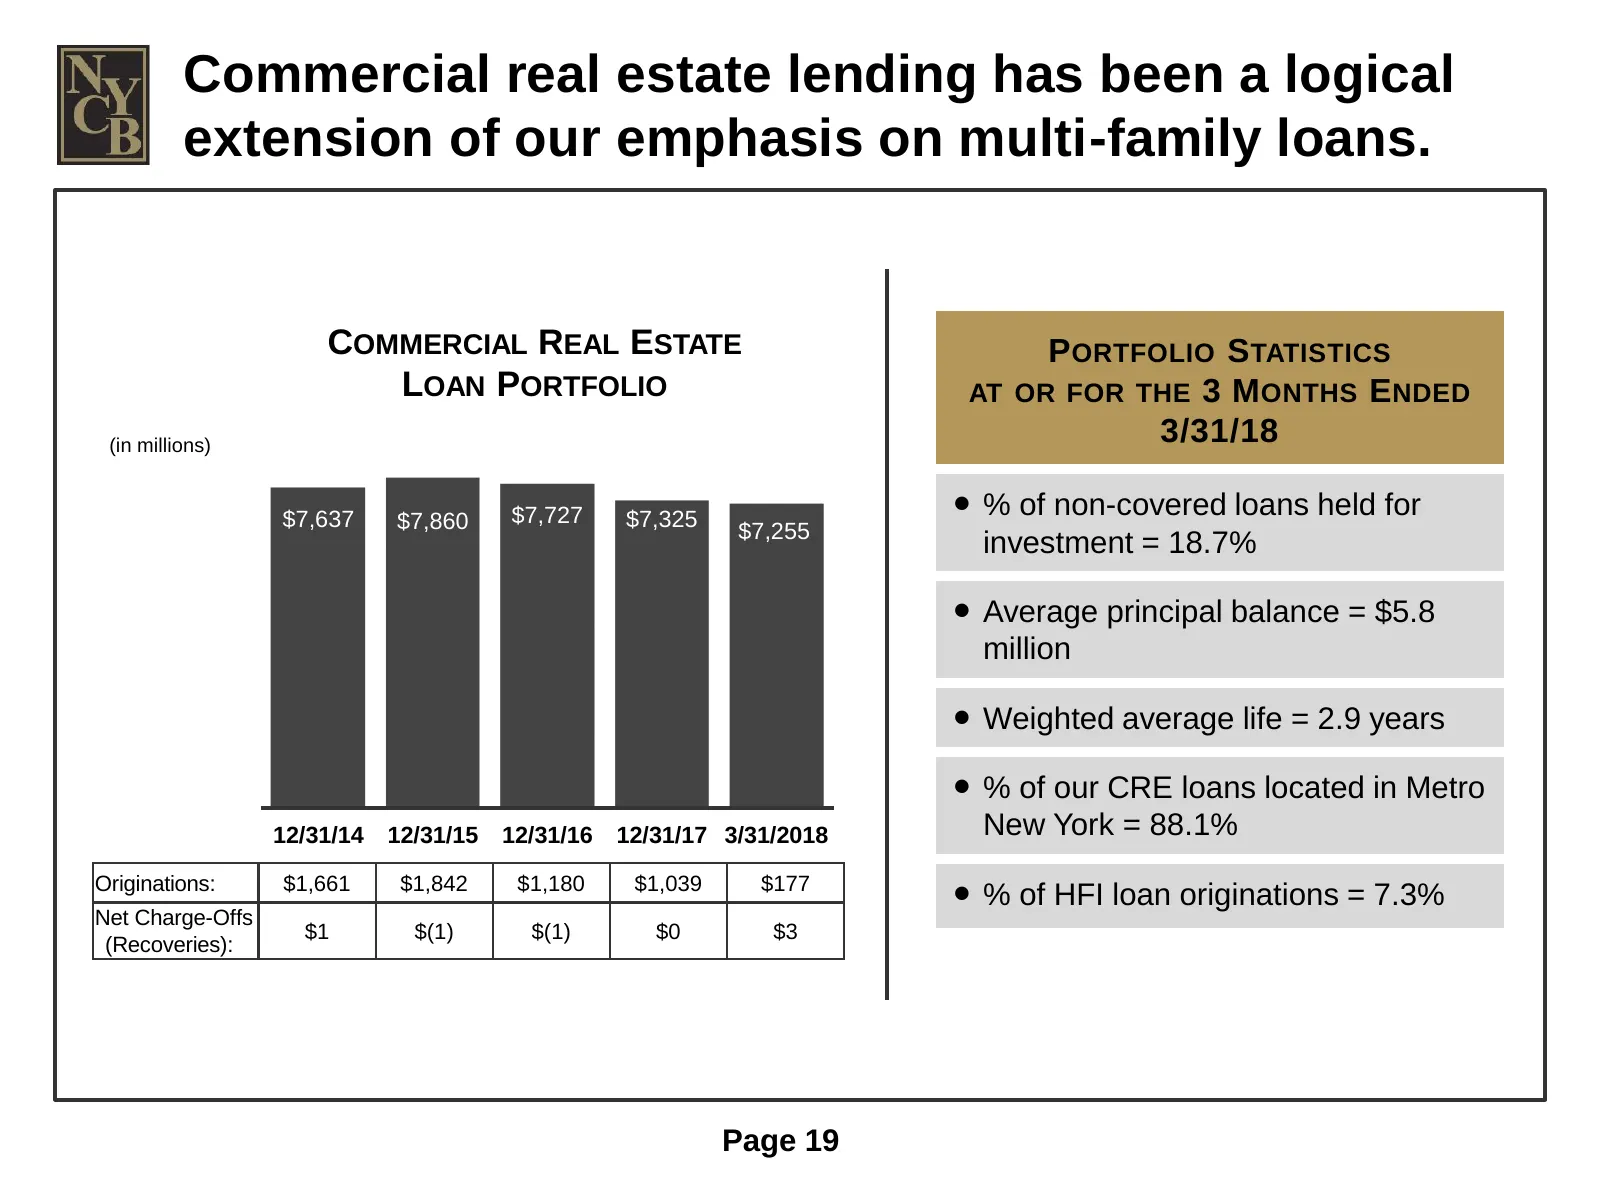
Slide 19: Commercial real estate lending has been a logical extension of multi-family
Commercial real estate lending has been a logical extension of our emphasis on multi-family loans. COMMERCIAL REAL ESTATE PORTFOLIO STATISTICS LOAN PORTFOLIO AT OR FOR THE 3 M ONTHS E NDED (in millions) 3/31/18 $7,637 $7,860 $7,727 $7,325 ● % of non-covered loans held for $7,255 investment = 18.7% ●
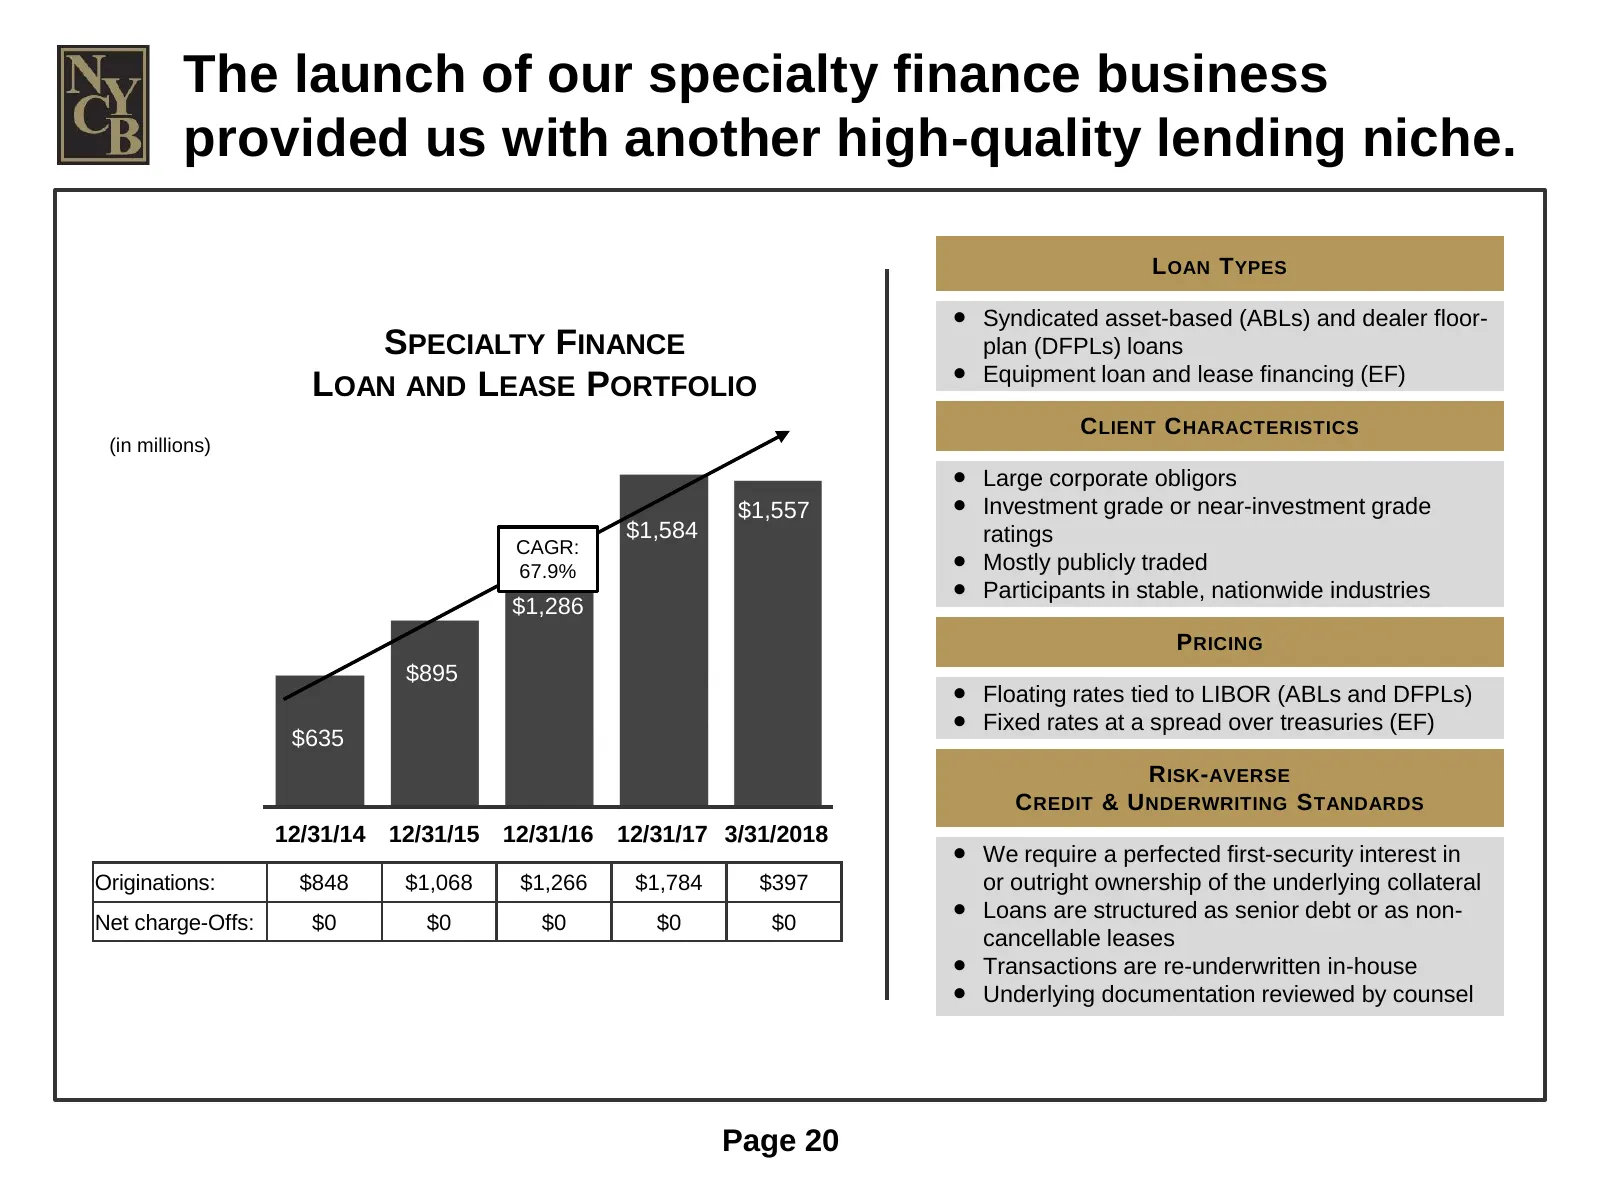
Slide 20: The launch of our specialty finance business provided another lending niche
The launch of our specialty finance business provided us with another high-quality lending niche. L OAN T YPES ● Syndicated asset-based (ABLs) and dealer floor- SPECIALTY FINANCE plan (DFPLs) loans ● Equipment loan and lease financing (EF) LOAN AND LEASE PORTFOLIO C LIENT C HARACTERISTICS (in millio
Slide 21: Asset Quality
ASSET QUALITY
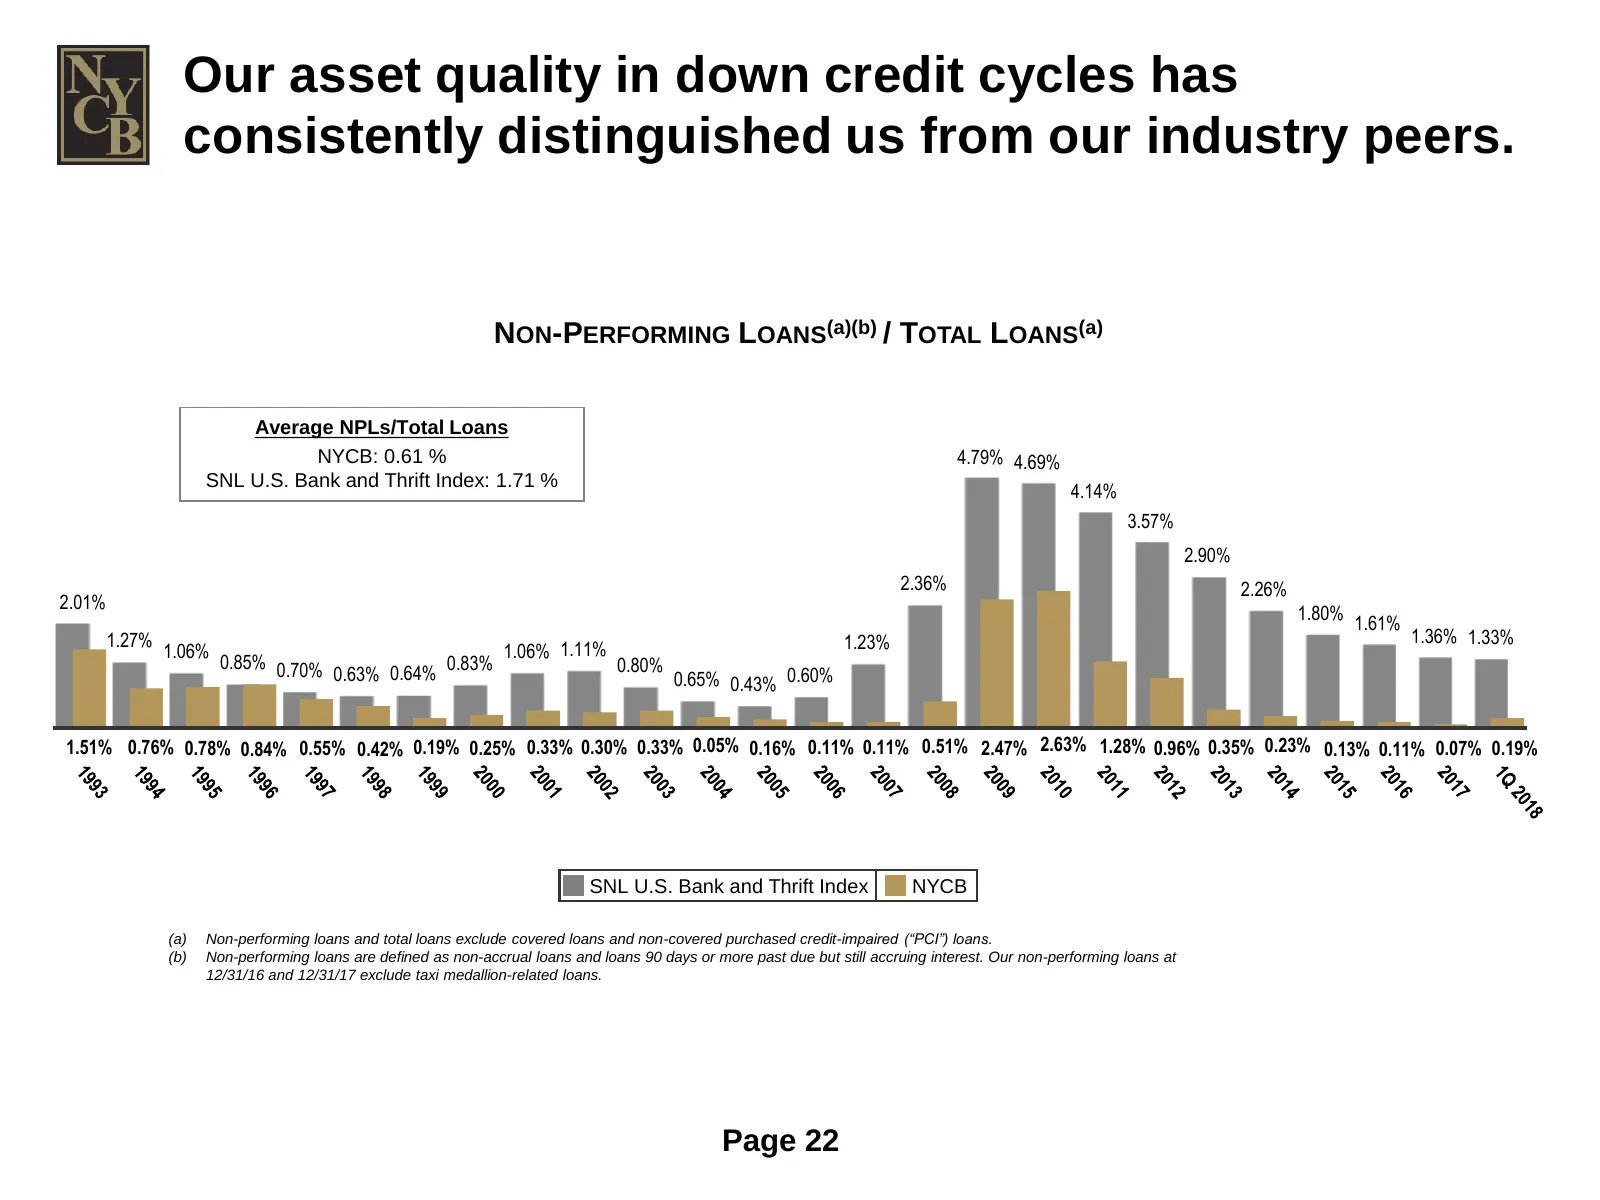
Slide 22: Our asset quality in down credit cycles has distinguished us from peers
Our asset quality in down credit cycles has consistently distinguished us from our industry peers. NON-PERFORMING LOANS(a)(b) / TOTAL LOANS(a) Average NPLs/Total Loans NYCB: 0.61 % 4.79% 4.69% SNL U.S. Bank and Thrift Index: 1.71 % 4.14% 3.57% 2.90% 2.36% 2.26% 2.01% 1.80% 1.61% 1.27% 1.23% 1.36% 1.
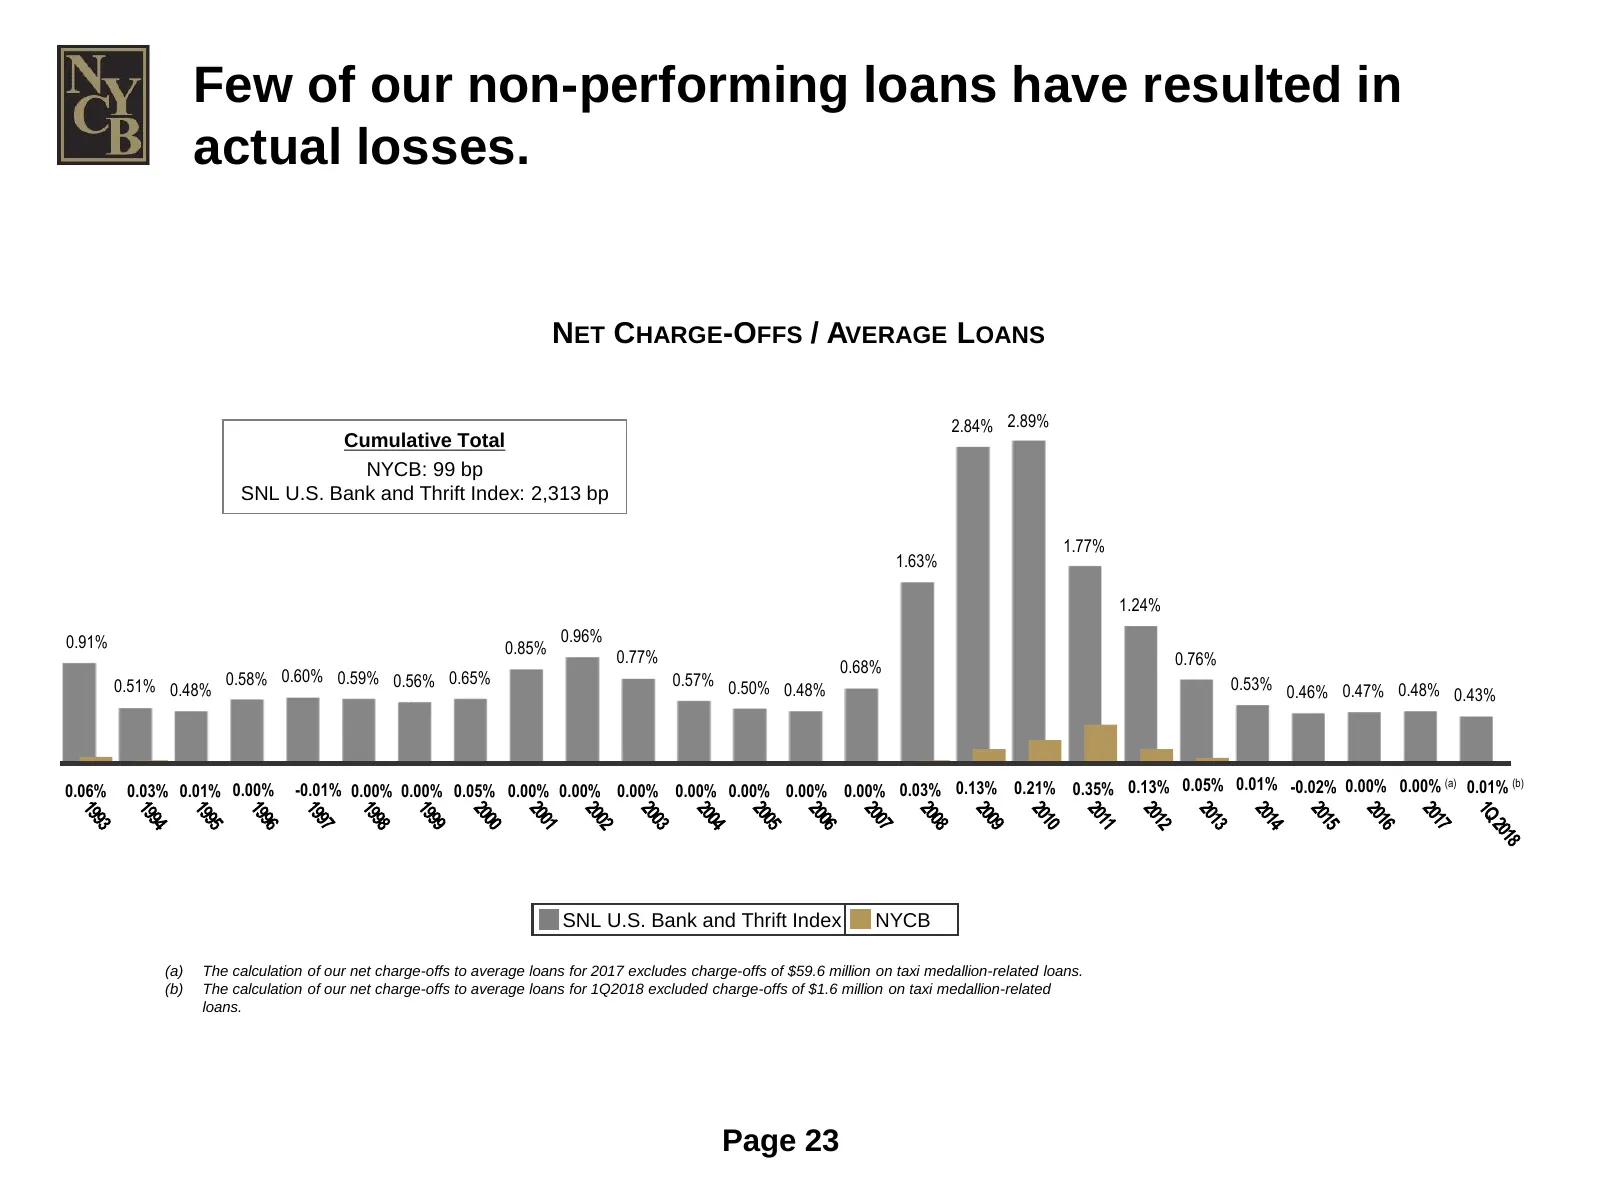
Slide 23: Few of our non-performing loans have resulted in actual losses
Few of our non-performing loans have resulted in actual losses. NET CHARGE-OFFS / AVERAGE LOANS 2.84% 2.89% Cumulative Total NYCB: 99 bp SNL U.S. Bank and Thrift Index: 2,313 bp 1.77% 1.63% 1.24% 0.91% 0.96% 0.85% 0.77% 0.68% 0.76% 0.60% 0.59% 0.56% 0.65% 0.51% 0.48% 0.58% 0.57% 0.50% 0.48% 0.53% 0.
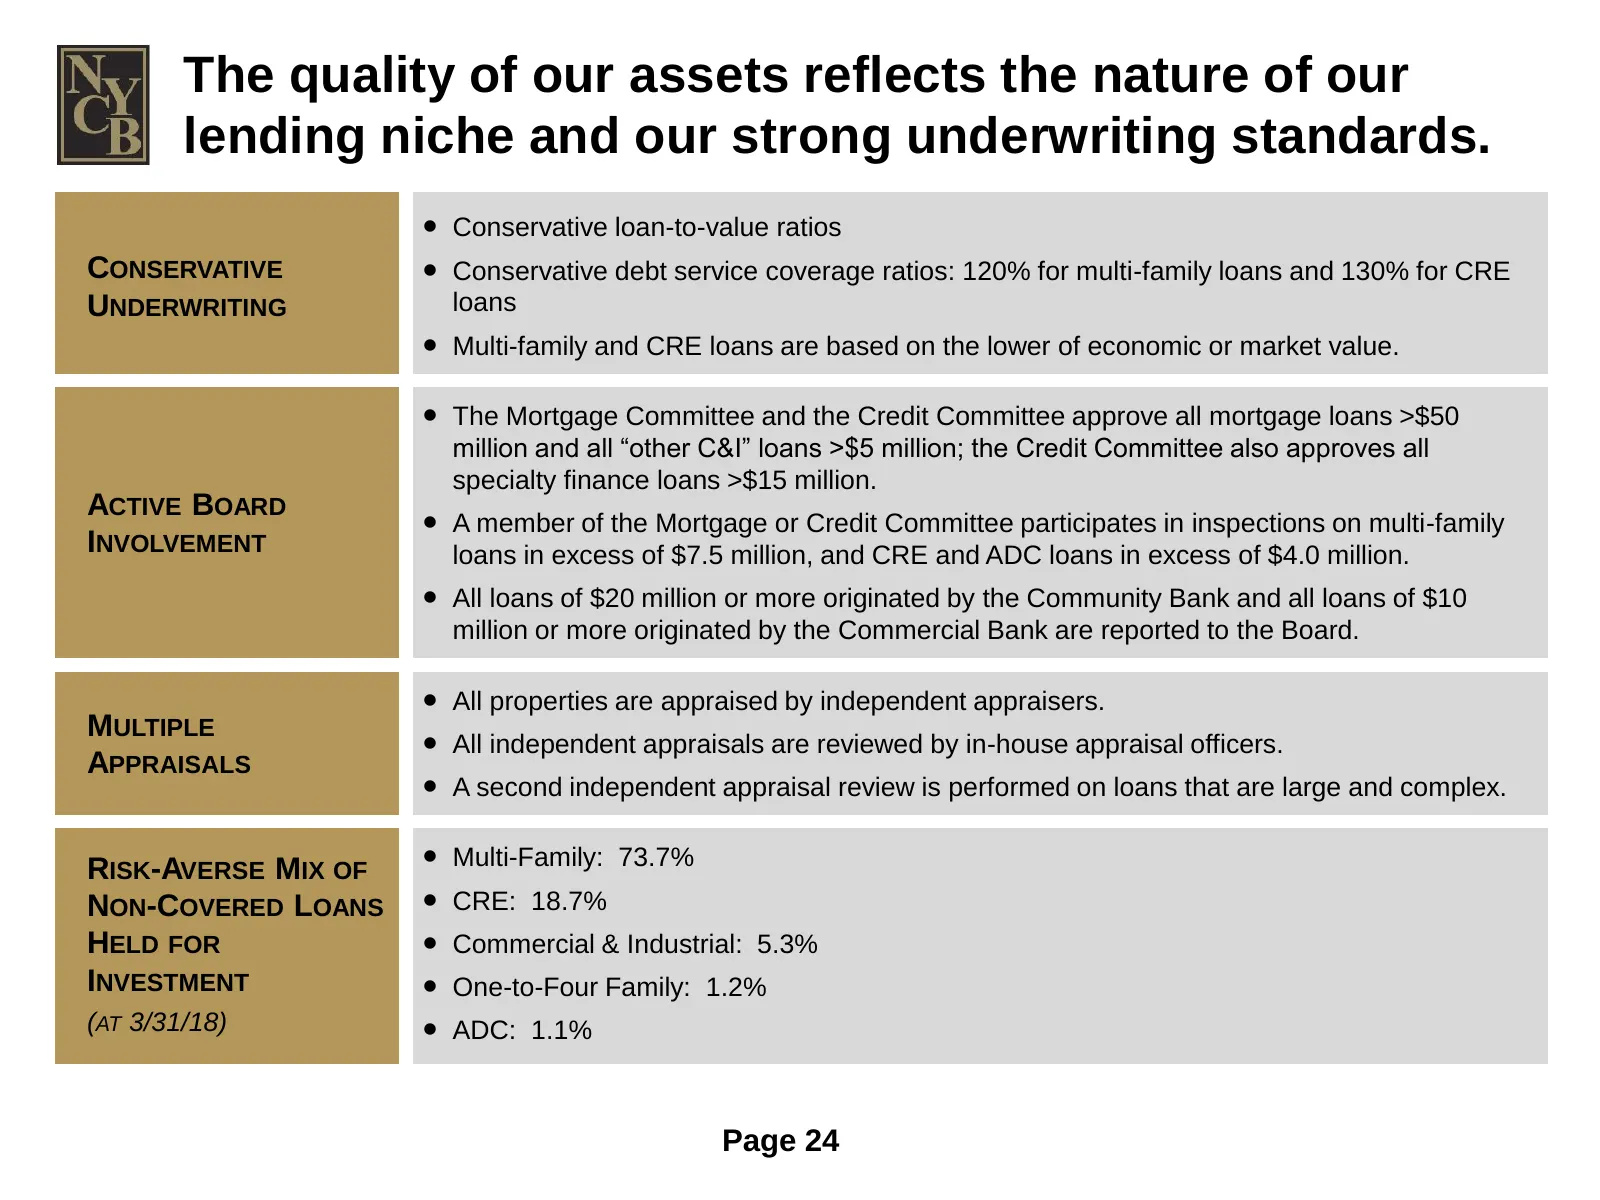
Slide 24: The quality of our assets reflects our lending niche and strong underwriting
The quality of our assets reflects the nature of our lending niche and our strong underwriting standards. ● Conservative loan-to-value ratios CONSERVATIVE ● Conservative debt service coverage ratios: 120% for multi-family loans and 130% for CRE UNDERWRITING loans ● Multi-family and CRE loans are bas
Slide 25: Efficiency
EFFICIENCY
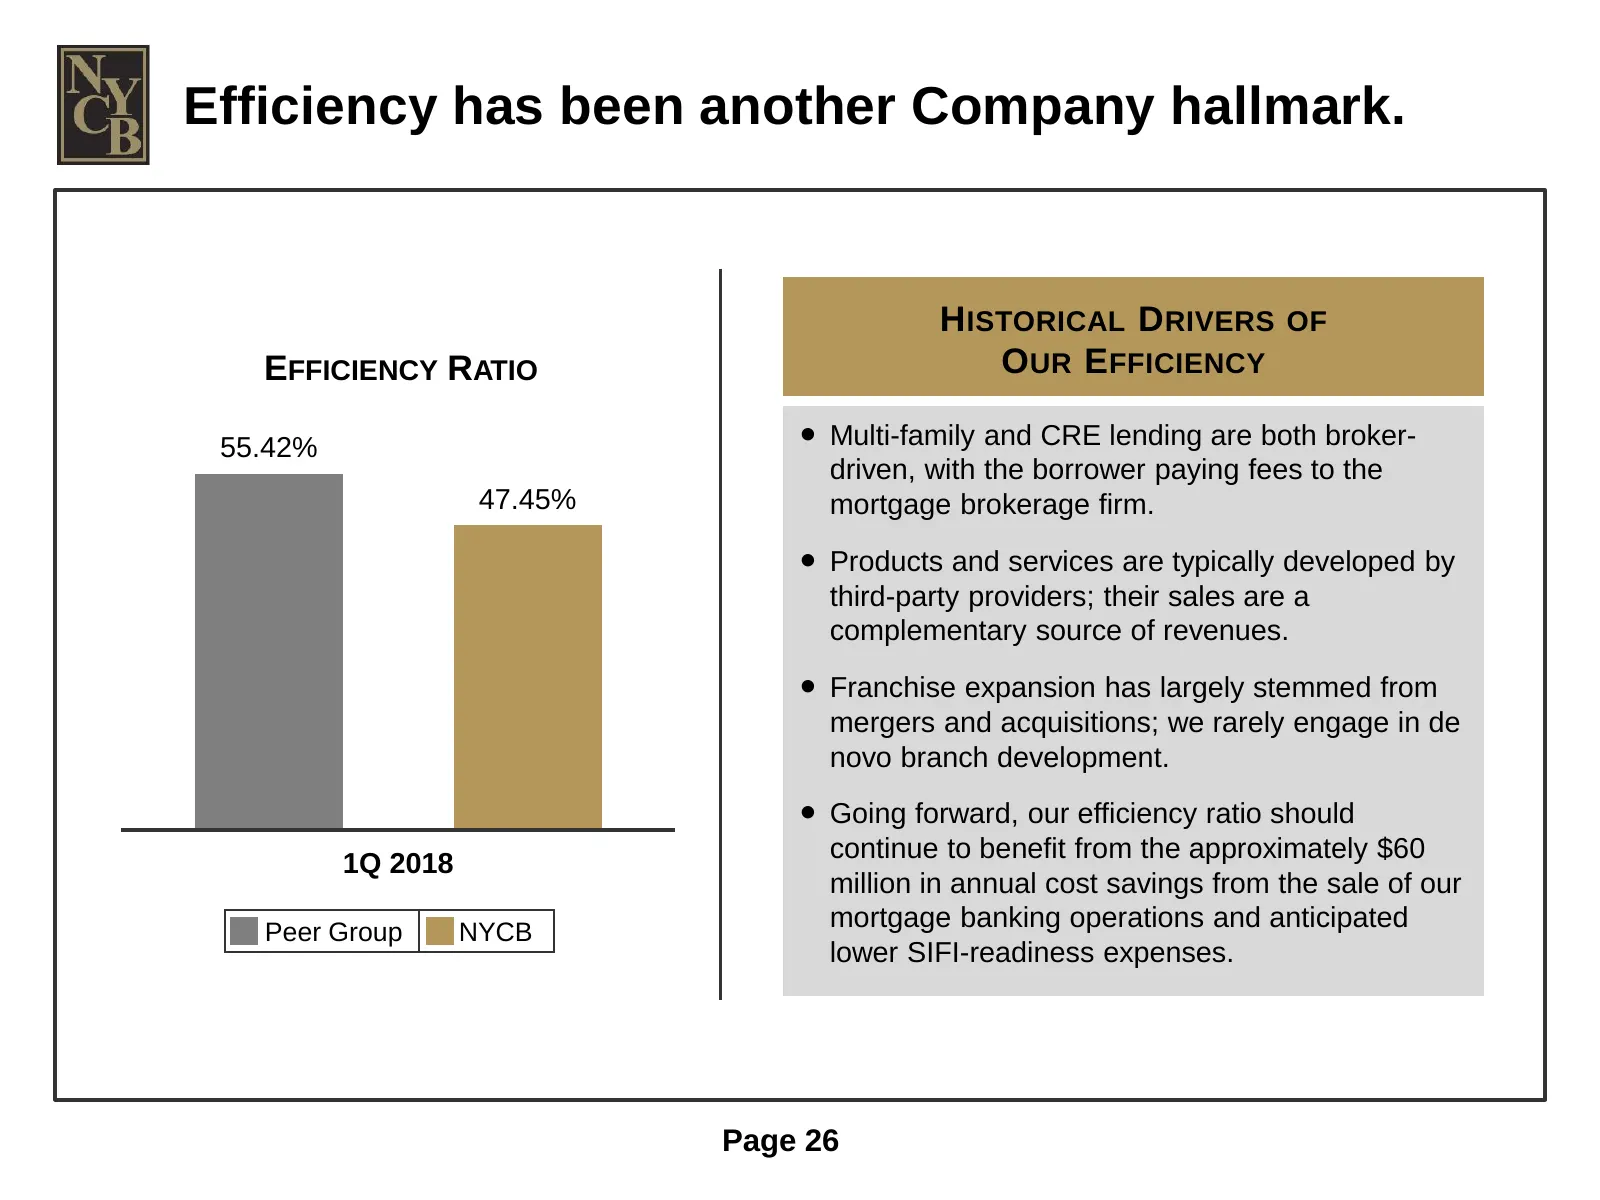
Slide 26: Efficiency has been another Company hallmark
Efficiency has been another Company hallmark. HISTORICAL DRIVERS OF EFFICIENCY RATIO OUR E FFICIENCY 55.42% ● Multi-family and CRE lending are both broker- driven, with the borrower paying fees to the 47.45% mortgage brokerage firm. ● Products and services are typically developed by third-party prov
Slide 27: Our efficiency ratio has increased significantly since Dodd-Frank
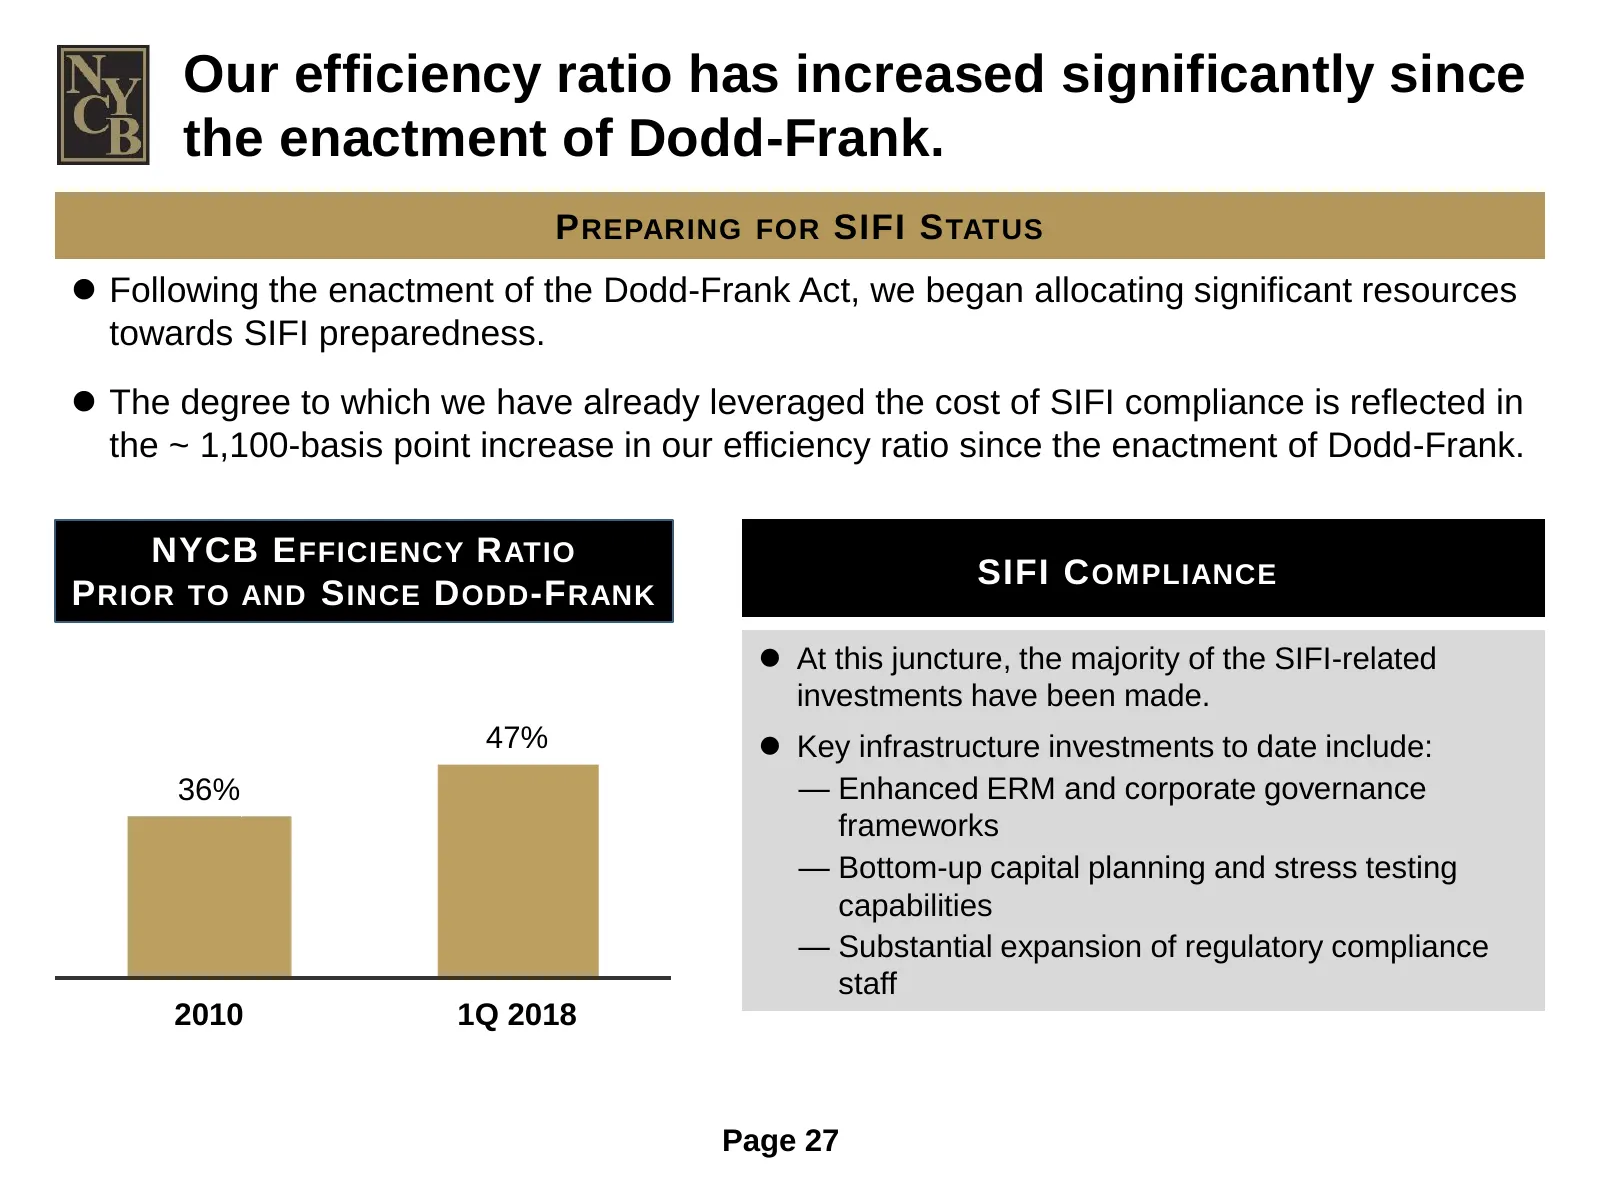
Our efficiency ratio has increased significantly since the enactment of Dodd-Frank. P REPARING FOR SIFI S TATUS Following the enactment of the Dodd-Frank Act, we began allocating significant resources towards SIFI preparedness. The degree to which we have already leveraged the cost of SIFI compl
Slide 28: Growth Through Acquisitions
GROWTH THROUGH ACQUISITIONS
Slide 29: We have a long history of earnings-accretive transactions
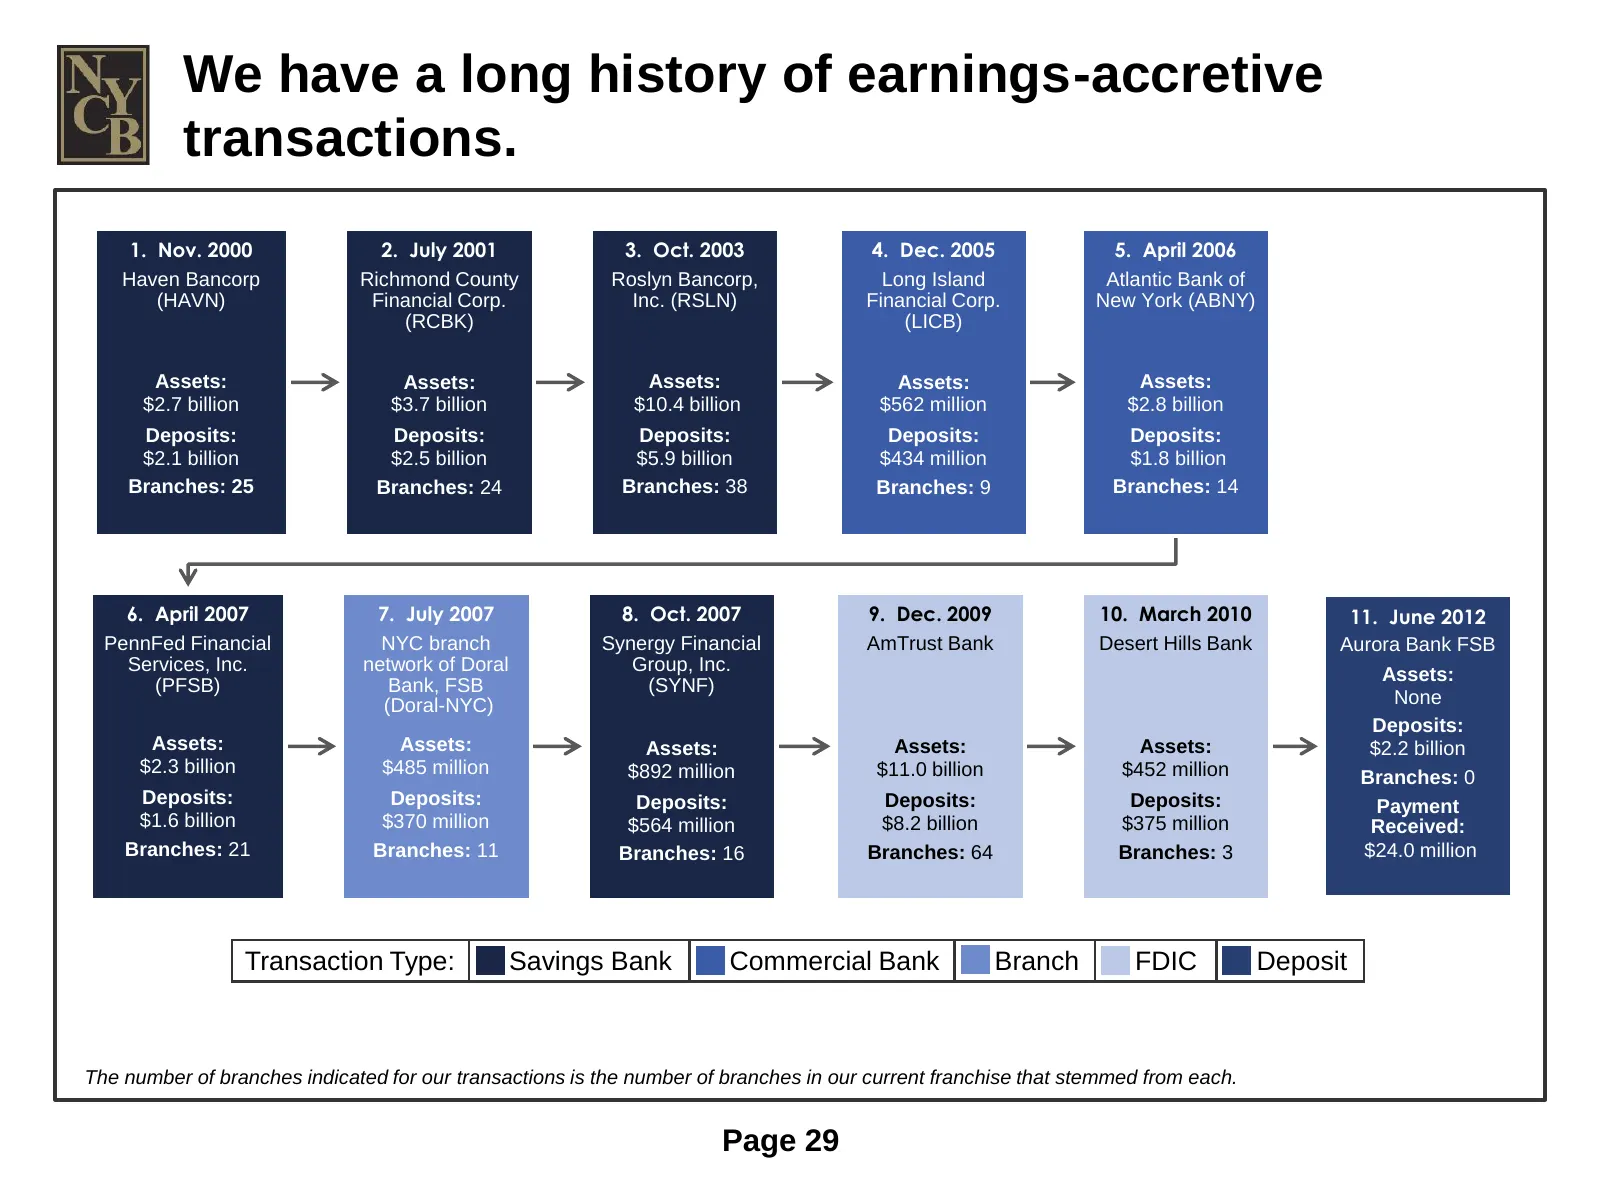
We have a long history of earnings-accretive transactions. 1. Nov. 2000 2. July 2001 3. Oct. 2003 4. Dec. 2005 5. April 2006 Haven Bancorp Richmond County Roslyn Bancorp, Long Island Atlantic Bank of (HAVN) Financial Corp. Inc. (RSLN) Financial Corp. New York (ABNY) (RCBK) (LICB) Assets: Assets: Ass
Slide 30: The benefits of our business model are reflected in our total return
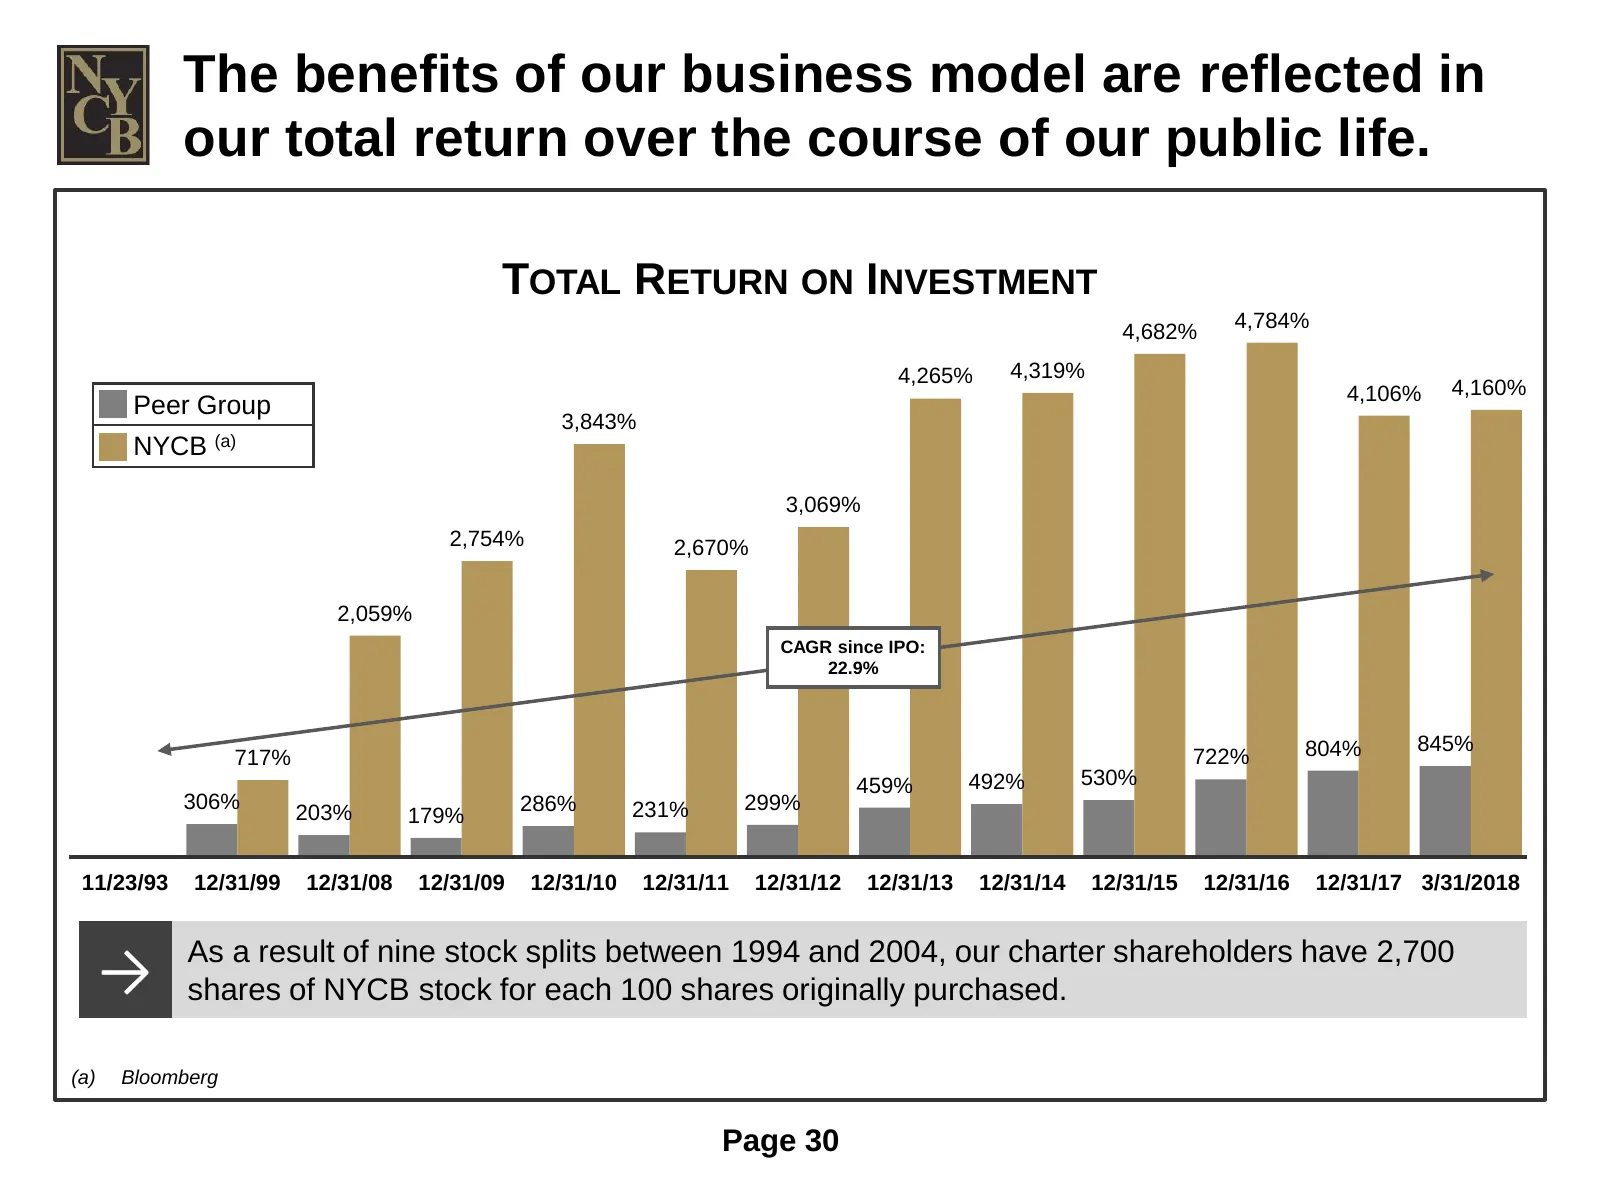
The benefits of our business model are reflected in our total return over the course of our public life. TOTAL RETURN ON INVESTMENT 4,682% 4,784% 4,265% 4,319% 4,106% 4,160% Peer Group 3,843% NYCB (a) 3,069% 2,754% 2,670% 2,059% CAGR since IPO: 22.9% 804% 845% 717% 722% 459% 492% 530% 306% 286% 231%
Slide 31: For More Information
For More Information VISIT OUR WEBSITE: ir.myNYCB.com E-MAIL REQUESTS TO: ir@myNYCB.com CALL INVESTOR RELATIONS AT: (516) 683-4420 Investor Relations New York Community Bancorp, Inc. WRITE TO: 615 Merrick Avenue Westbury, NY 11590 Page 31 6/4/18
Slide 32: Appendix
APPENDIX
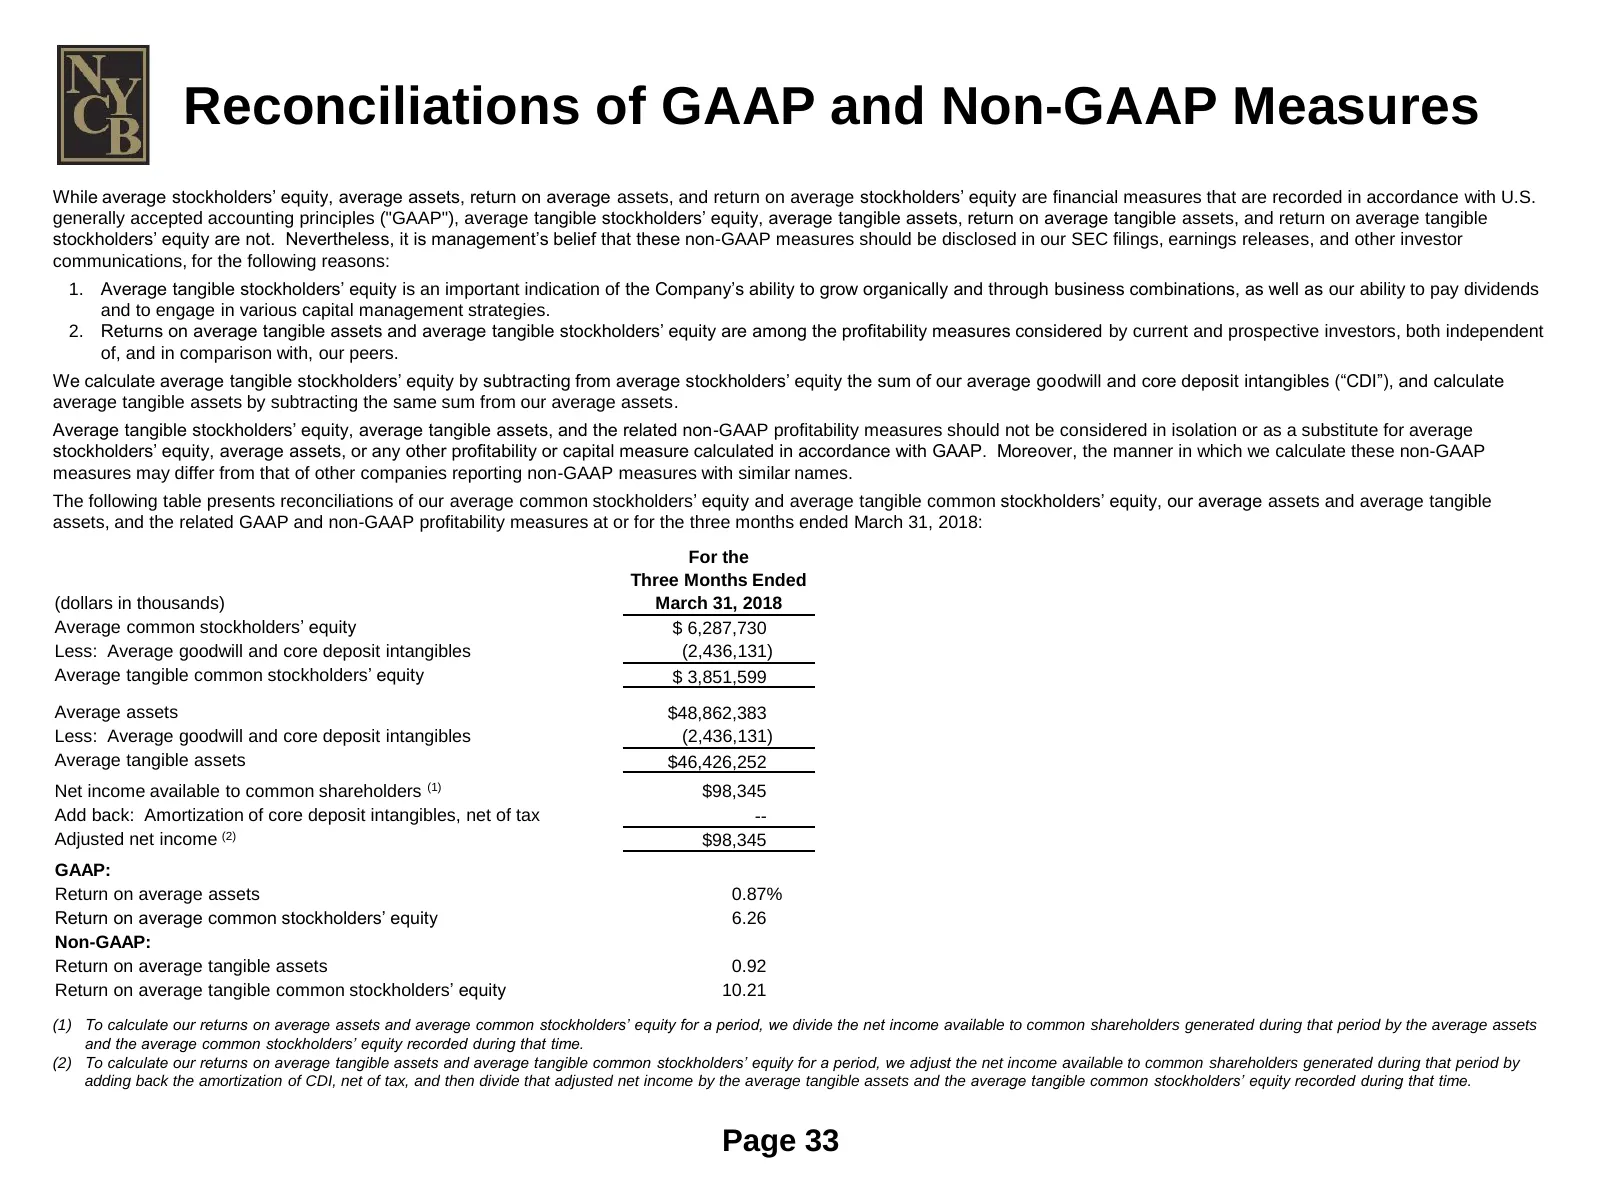
Slide 33: Reconciliations of GAAP and Non-GAAP Measures
Reconciliations of GAAP and Non-GAAP Measures While average stockholders’ equity, average assets, return on average assets, and return on average stockholders’ equity are financial measures that are recorded in accordance with U.S. generally accepted accounting principles ("GAAP"), average tangible
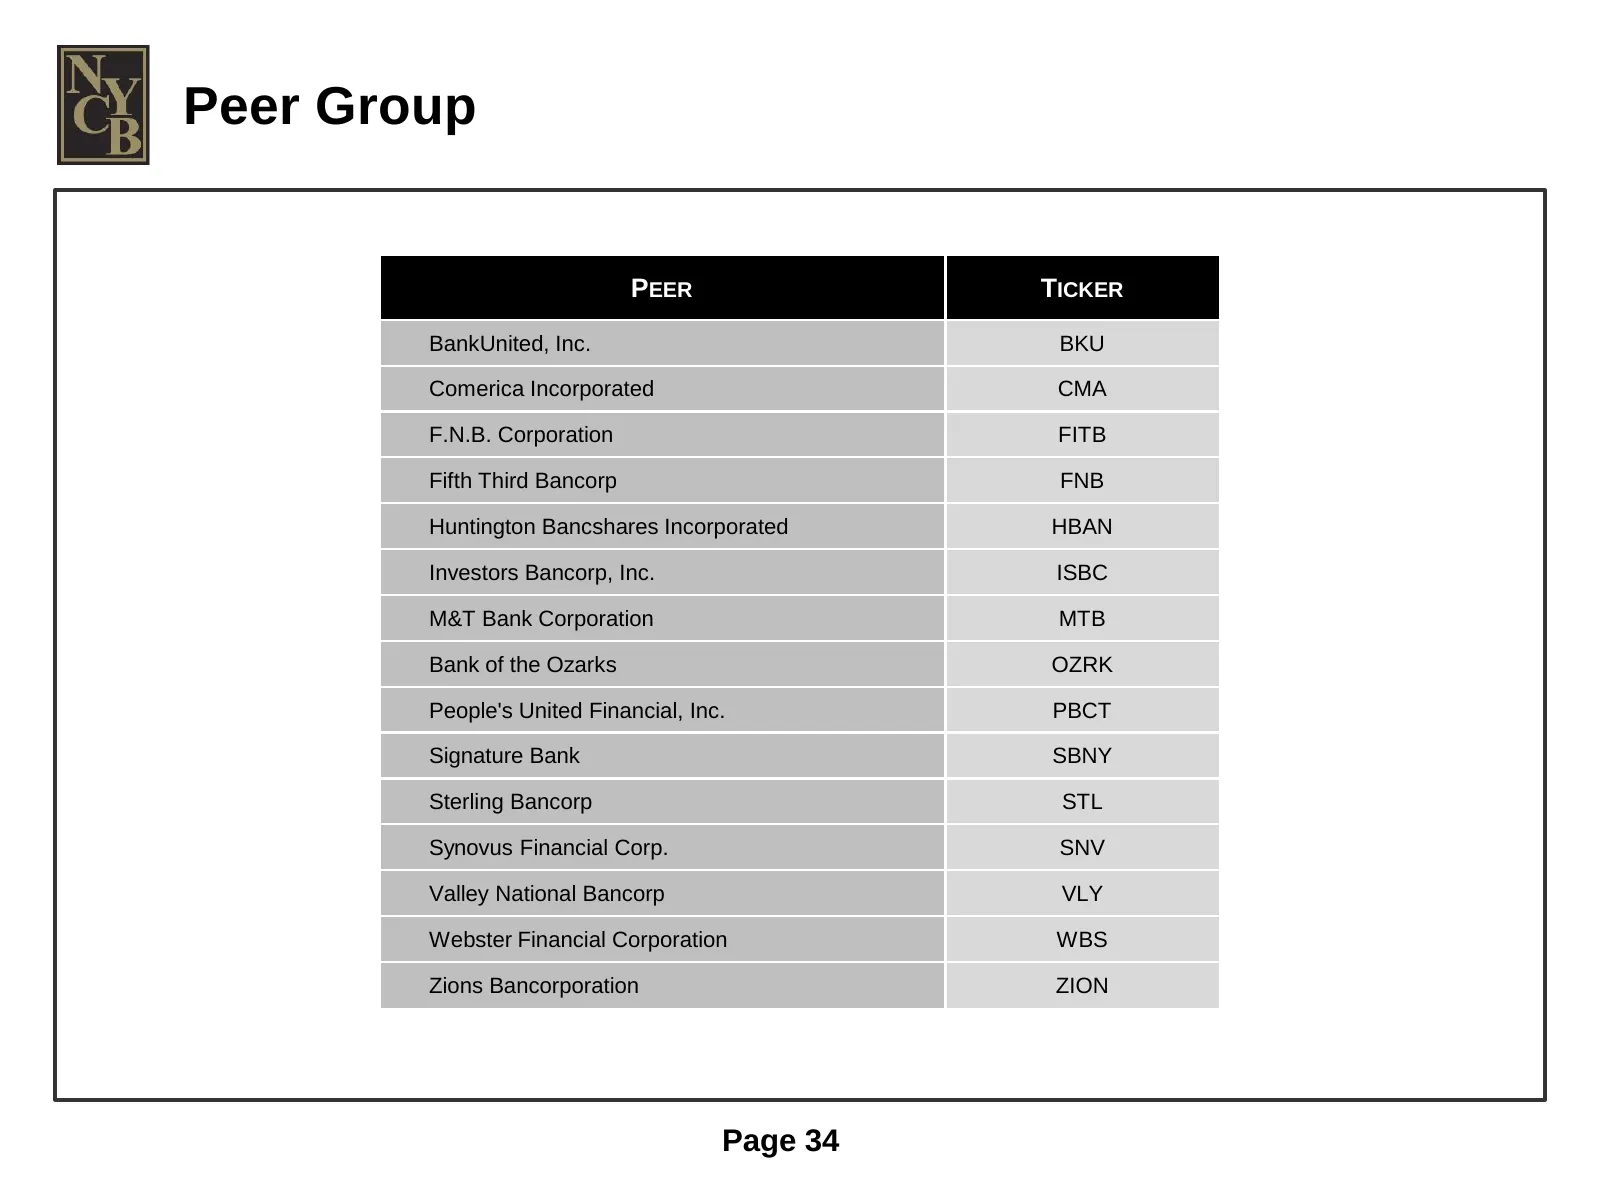
Slide 34: Peer Group
Peer Group PEER TICKER BankUnited, Inc. BKU Comerica Incorporated CMA F.N.B. Corporation FITB Fifth Third Bancorp FNB Huntington Bancshares Incorporated HBAN Investors Bancorp, Inc. ISBC M&T Bank Corporation MTB Bank of the Ozarks OZRK People's United Financial, Inc. PBCT Signature Bank SBNY Sterlin
Source: company website
More decks from Flagstar Bank, N.A.
 Q3 2026 Earnings Presentation29 slides · Oct 23, 2026
 Q2 2026 Earnings Presentation25 slides · Jul 24, 2026
 Q1 2026 Earnings Presentation25 slides · Apr 24, 2026
 Q4 2025 Earnings Presentation29 slides · Jan 30, 2026
 Q3 2025 Earnings Presentation24 slides · Oct 24, 2025
 Q2 2025 Earnings Presentation25 slides · Jul 25, 2025