Landmark Infrastructure Partners LP
Landmark Infrastructure Partners LP — Investor Presentation (August 2016)
24 slides from Landmark Infrastructure Partners LP's investor presentation, Aug 11, 2016
Slide 1: Disclaimer
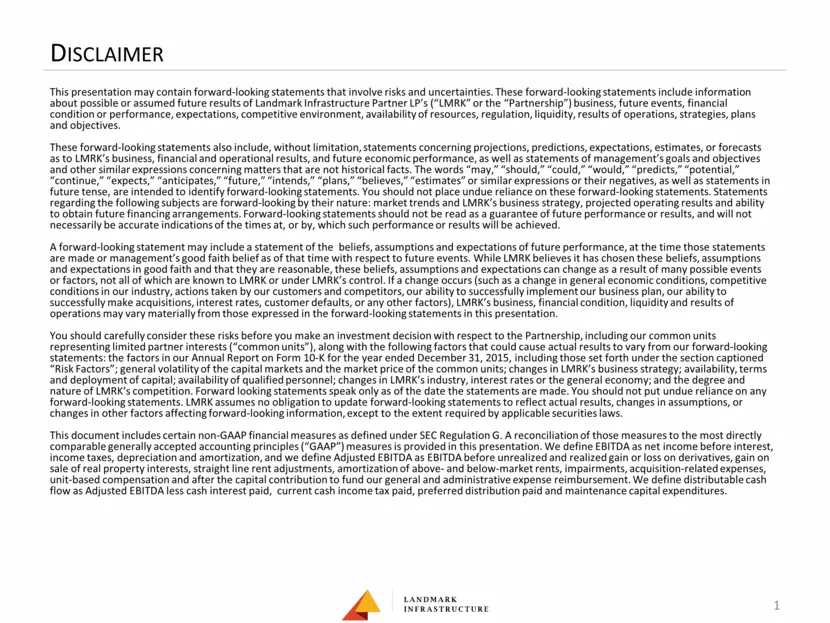
Disclaimer This presentation may contain forward-looking statements that involve risks and uncertainties. These forward-looking statements include information about possible or assumed future results of Landmark Infrastructure Partner LP’s (“LMRK” or the “Partnership”) business, future events, finan
Slide 2: Partnership Snapshot
Partnership Snapshot Landmark Infrastructure Partners LP (Nasdaq: LMRK) Unit Price(1): $17.45 Market Capitalization(2): $267 million Current Yield(1): 7.6% Minimum Quarterly Distribution (MQD): $0.2875 per unit Most Recent Distribution(3): $0.3325 per unit for Q2 2016 (6th Consecutive Quarterly Dist
Slide 3: Overview of Our Assets
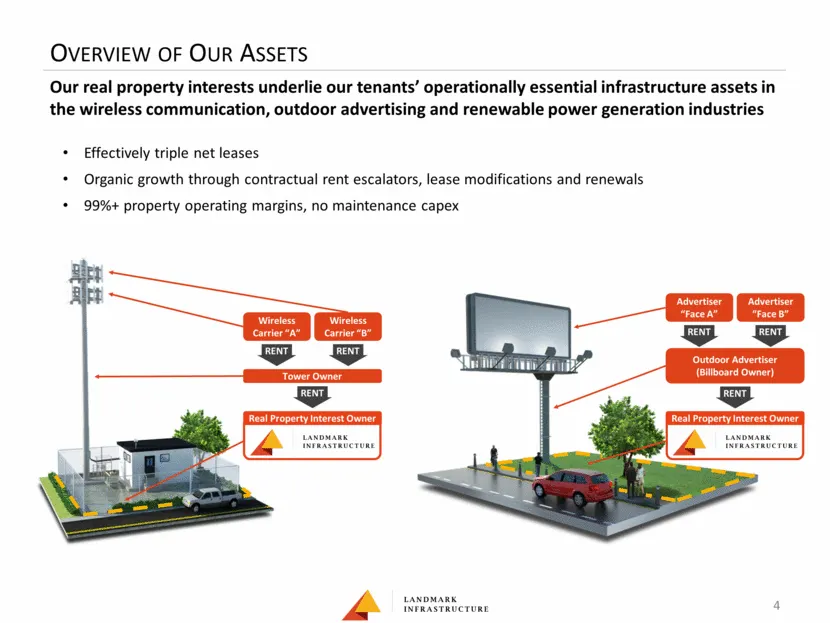
Overview of Our Assets Effectively triple net leases Organic growth through contractual rent escalators, lease modifications and renewals 99%+ property operating margins, no maintenance capex 4 Our real property interests underlie our tenants’ operationally essential infrastructure assets in the wir
Slide 4: Significant, Growing and Fragmented U.S. Market Opportunity
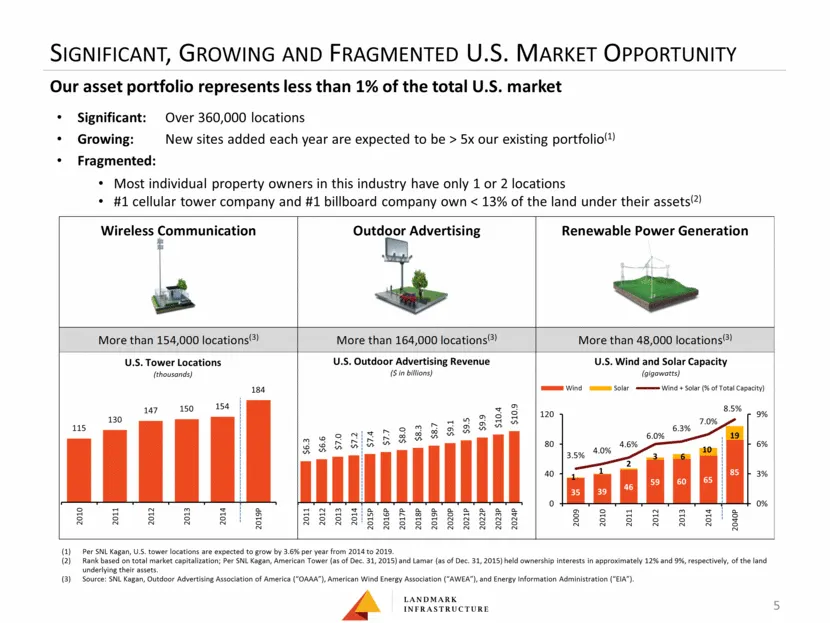
Significant, Growing and Fragmented U.S. Market Opportunity Our asset portfolio represents less than 1% of the total U.S. market 5 Significant: Over 360,000 locations Growing: New sites added each year are expected to be > 5x our existing portfolio(1) Fragmented: Most individual property owners in t
Slide 5: Our Portfolio
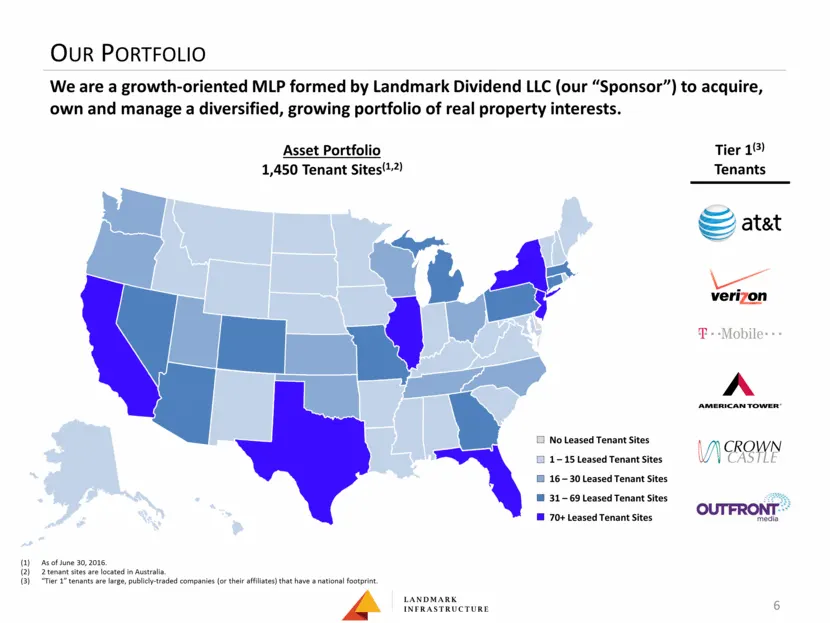
Our Portfolio 6 We are a growth-oriented MLP formed by Landmark Dividend LLC (our “Sponsor”) to acquire, own and manage a diversified, growing portfolio of real property interests. Tier 1(3) Tenants As of June 30, 2016. 2 tenant sites are located in Australia. “Tier 1” tenants are large, publicly-tr
Slide 6: Partnership Highlights
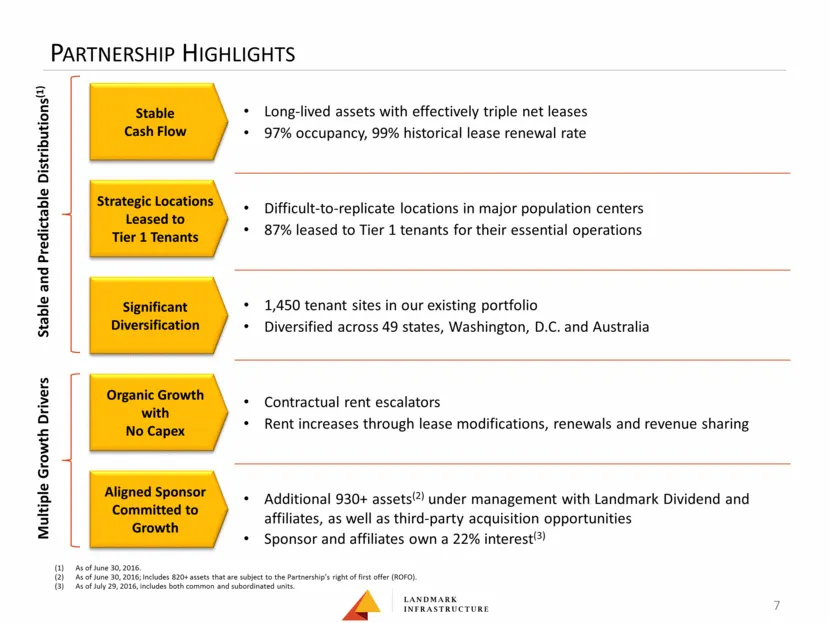
Partnership Highlights Long-lived assets with effectively triple net leases 97% occupancy, 99% historical lease renewal rate Stable Cash Flow Strategic Locations Leased to Tier 1 Tenants Significant Diversification Organic Growth with No Capex Aligned Sponsor Committed to Growth Difficult-to-replica
Slide 7: Stable cash flow from long-lived assets
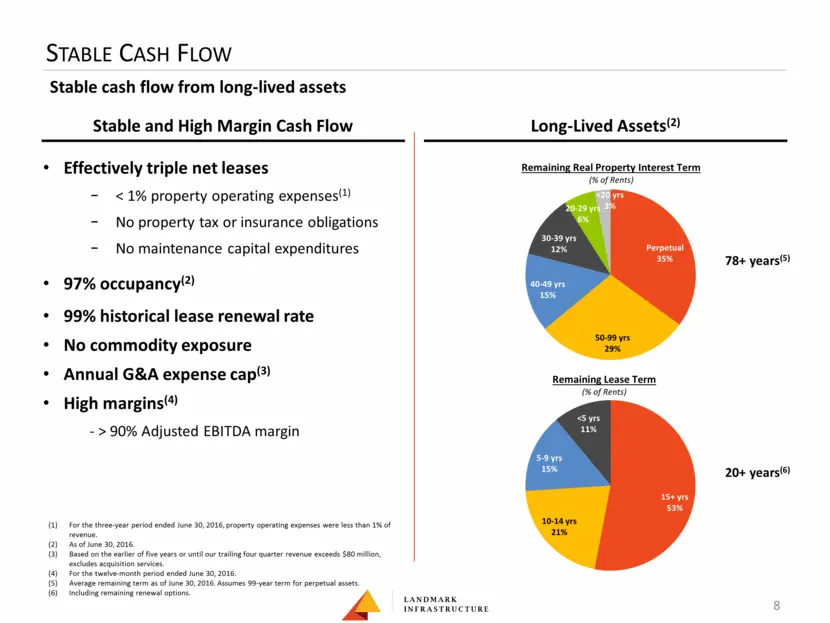
Stable cash flow from long-lived assets Stable Cash Flow Effectively triple net leases < 1% property operating expenses(1) No property tax or insurance obligations No maintenance capital expenditures 97% occupancy(2) 99% historical lease renewal rate No commodity exposure Annual G&A expense cap(3) H
Slide 8: Strategic Locations
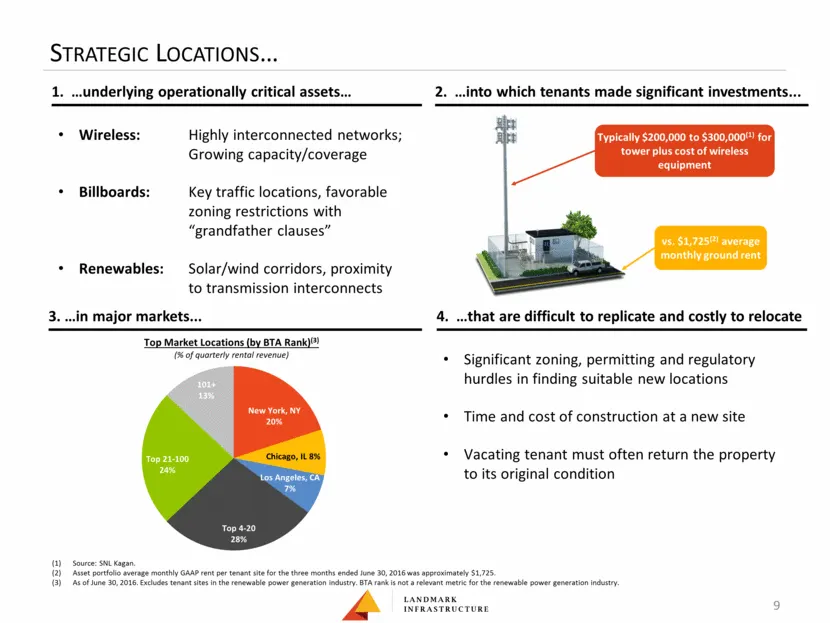
Strategic Locations 9 Source: SNL Kagan. Asset portfolio average monthly GAAP rent per tenant site for the three months ended June 30, 2016 was approximately $1,725. As of June 30, 2016. Excludes tenant sites in the renewable power generation industry. BTA rank is not a relevant metric for the renew
Slide 9: Highly Desired by Tier 1 Tenants
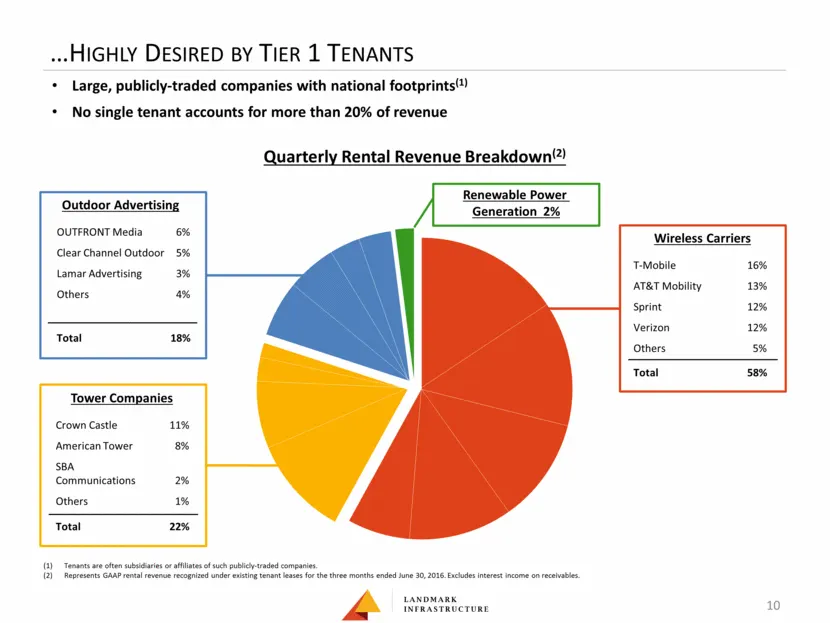
Highly Desired by Tier 1 Tenants 10 Large, publicly-traded companies with national footprints(1) No single tenant accounts for more than 20% of revenue Wireless Carriers T-Mobile 16% AT&T Mobility 13% Sprint 12% Verizon 12% Others 5% Total 58% Tower Companies Crown Castle 11% American Tower 8% SBA C
Slide 10: Multiple Growth Drivers
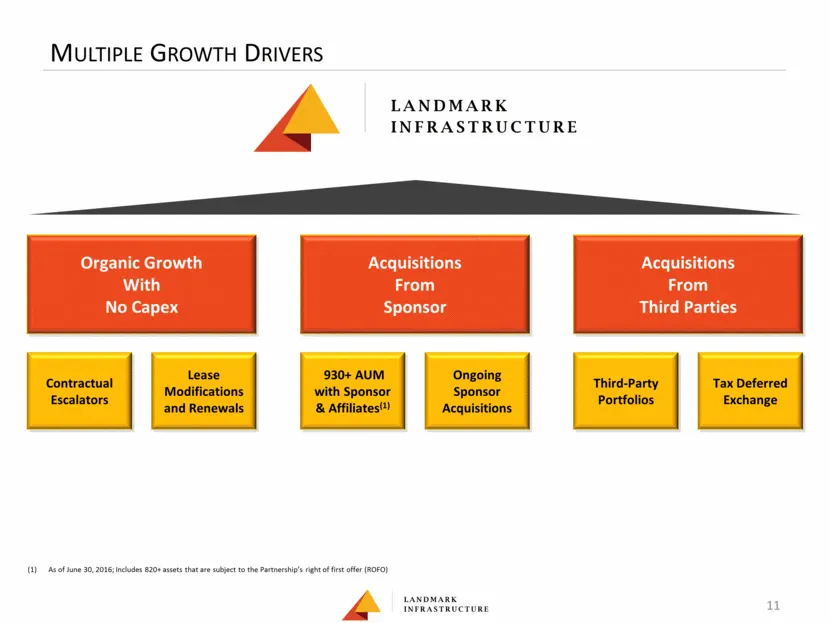
Multiple Growth Drivers 11 Organic Growth With No Capex Acquisitions From Sponsor Acquisitions From Third Parties Contractual Escalators Lease Modifications and Renewals 930+ AUM with Sponsor & Affiliates(1) Ongoing Sponsor Acquisitions Third-Party Portfolios Tax Deferred Exchange As of June 30, 201
Slide 11: Organic Growth with No Capital Expenditures
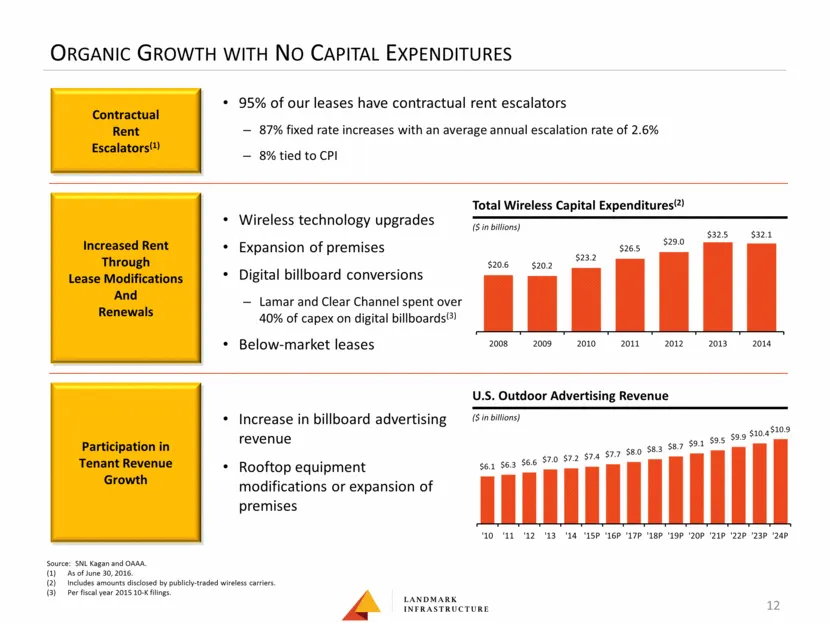
Organic Growth with No Capital Expenditures Wireless technology upgrades Expansion of premises Digital billboard conversions Lamar and Clear Channel spent over 40% of capex on digital billboards(3) Below-market leases ($ in billions) Total Wireless Capital Expenditures(2) Source: SNL Kagan and OAAA.
Slide 12: Assets Under Management with Sponsor & Affiliates
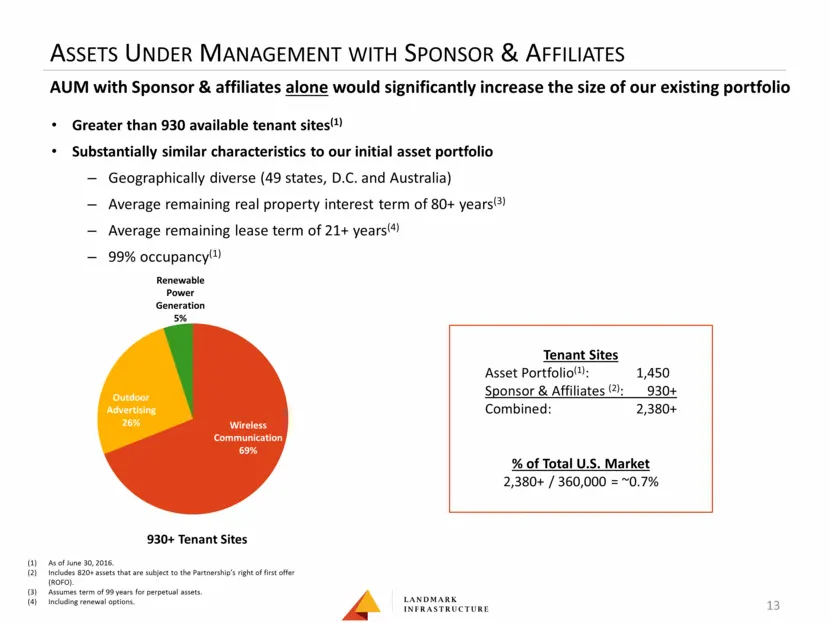
Assets Under Management with Sponsor & Affiliates 13 AUM with Sponsor & affiliates alone would significantly increase the size of our existing portfolio Greater than 930 available tenant sites(1) Substantially similar characteristics to our initial asset portfolio Geographically diverse (49 states,
Slide 13: Aligned Sponsor Driving Growth
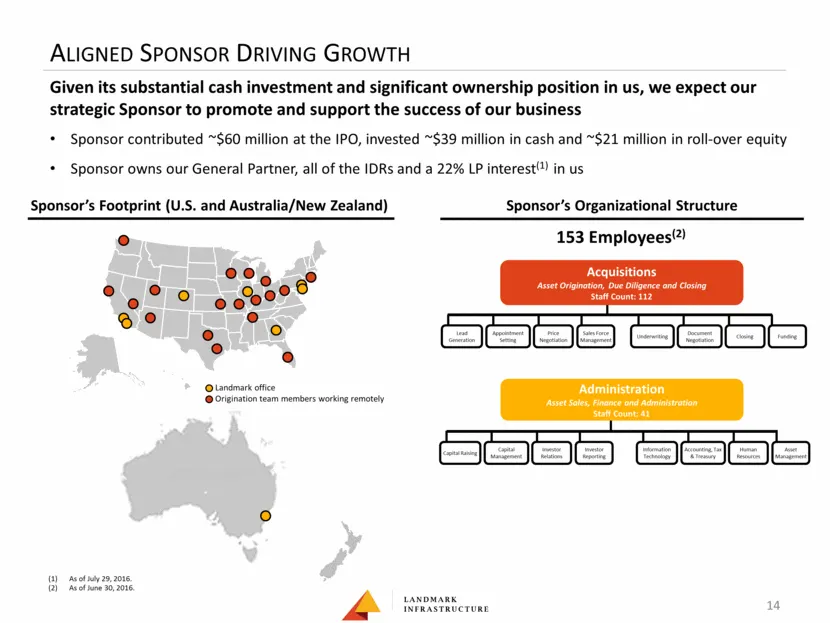
Aligned Sponsor Driving Growth Sponsor contributed ~$60 million at the IPO, invested ~$39 million in cash and ~$21 million in roll-over equity Sponsor owns our General Partner, all of the IDRs and a 22% LP interest(1) in us Landmark office Origination team members working remotely Lead Generation Ap
Slide 14: Sponsor Expertise in an Industry with High Barriers of Entry
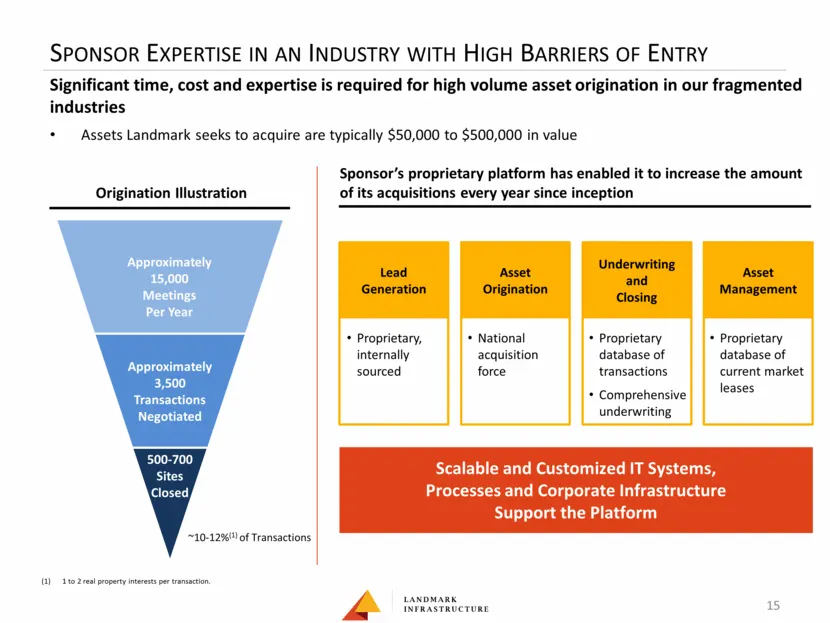
Sponsor Expertise in an Industry with High Barriers of Entry Approximately 15,000 Meetings Per Year Approximately 3,500 Transactions Negotiated 500-700 Sites Closed 15 ~10-12%(1) of Transactions 1 to 2 real property interests per transaction. Significant time, cost and expertise is required for high
Slide 15: Ten Drop-Down Transactions Since IPO
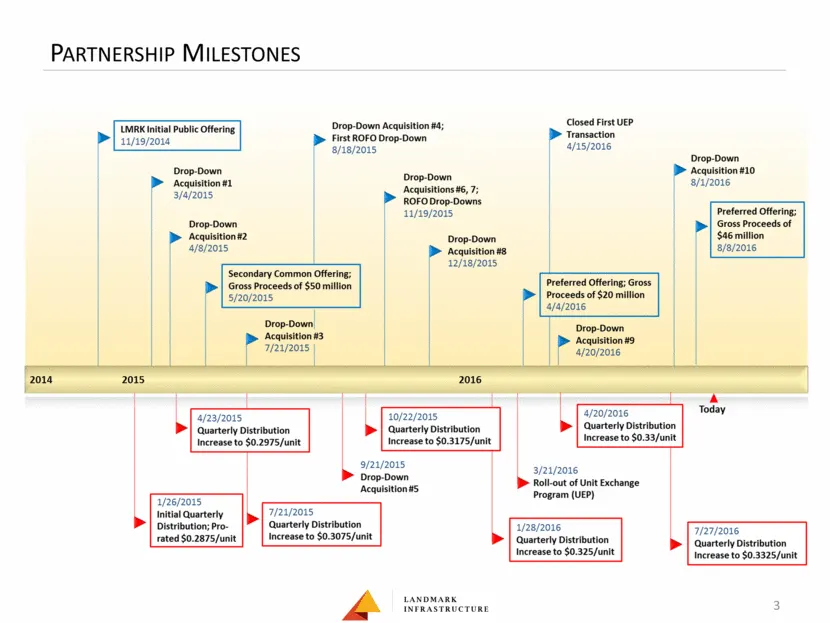
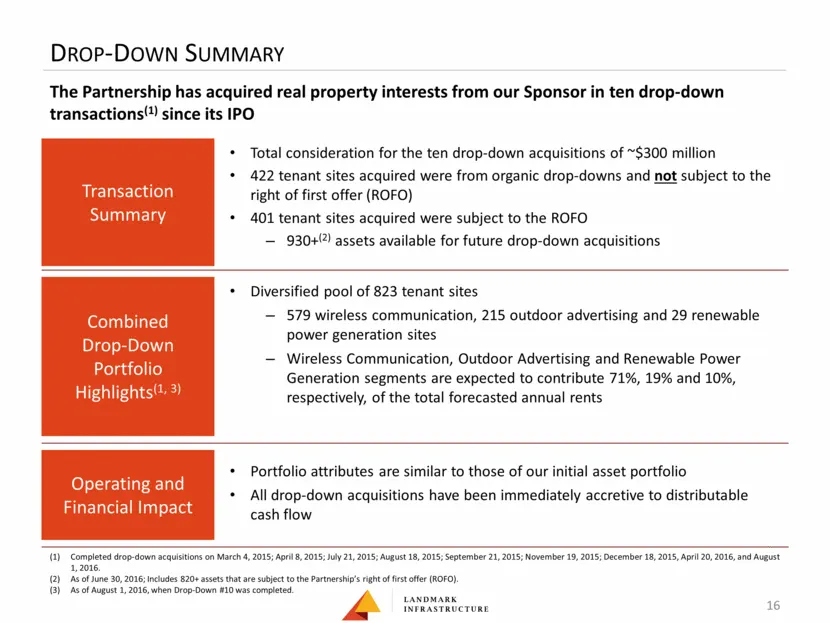
The Partnership has acquired real property interests from our Sponsor in ten drop-down transactions(1) since its IPO Drop-Down Summary 16 Transaction Summary Combined Drop-Down Portfolio Highlights(1, 3) Operating and Financial Impact Total consideration for the ten drop-down acquisitions of ~$300 m
Slide 16: Third-Party Acquisitions
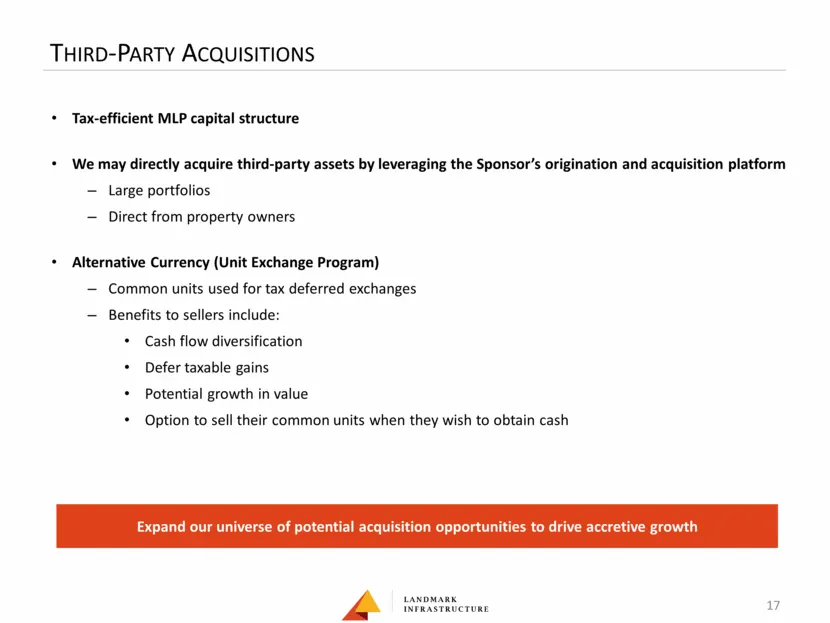
Third-Party Acquisitions 17 Tax-efficient MLP capital structure We may directly acquire third-party assets by leveraging the Sponsor’s origination and acquisition platform Large portfolios Direct from property owners Alternative Currency (Unit Exchange Program) Common units used for tax deferred exc
Slide 17: Multiple Drivers of Distribution Growth
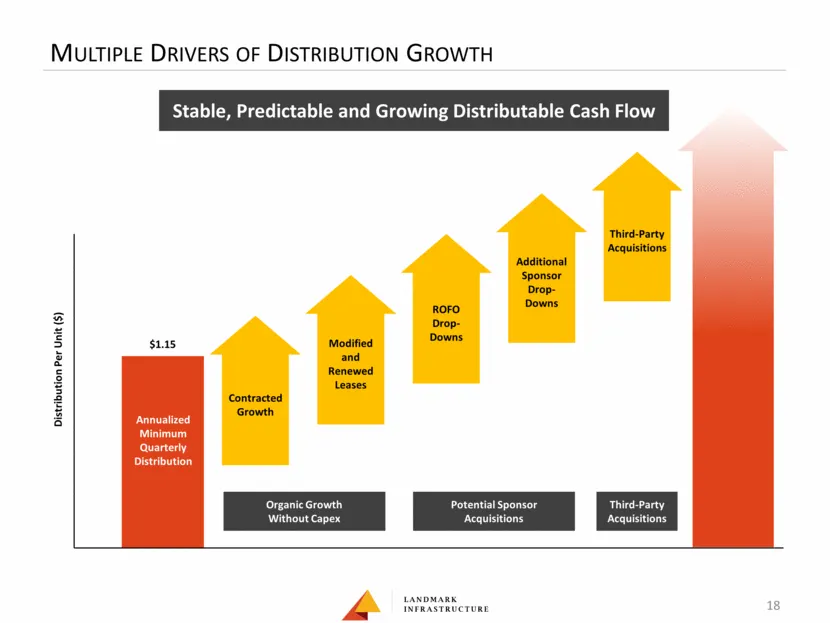
Multiple Drivers of Distribution Growth 18 Contracted Growth Modified and Renewed Leases ROFO Drop- Downs Additional Sponsor Drop-Downs Third-Party Acquisitions Distribution Per Unit ($) Stable, Predictable and Growing Distributable Cash Flow Organic Growth Without Capex Potential Sponsor Acquisitio
Slide 18: Multiple Drivers of Distribution Growth
MULTIPLE DRIVERS OF DISTRIBUTION GROWTH Stable, Predictable and Growing Distributable Cash Flow Distribution Per Unit (5) Annualized Minimum Quarterly Distribution Organic Growth Potential Sponsor Third-Party Without capex Acquisitions Acquisitions
Slide 19: Keys to Our Success
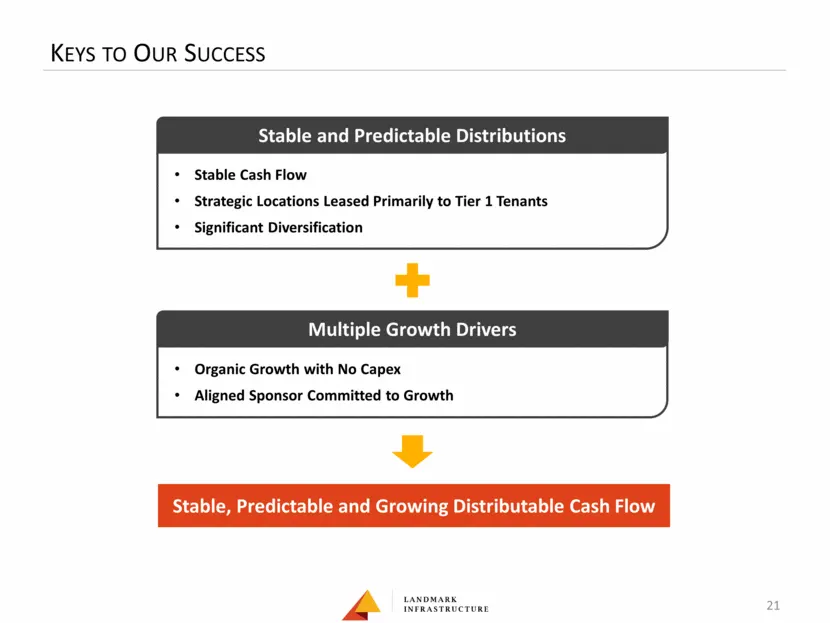
Keys to Our Success 21 Stable, Predictable and Growing Distributable Cash Flow Stable and Predictable Distributions Multiple Growth Drivers Organic Growth with No Capex Aligned Sponsor Committed to Growth Stable Cash Flow Strategic Locations Leased Primarily to Tier 1 Tenants Significant Diversifica
Slide 20: Keys to Our Success
KEYS TO OUR SUCCESS Stable and Predictable Distributions + Stable Cash Flow Strategic Locations Leased Primarily to Tier 1 Tenants Significant Diversification Multiple Growth Drivers + Organic Growth with No Capex * Aligned Sponsor Committed to Growth y eee
Slide 21: Reconciliation of EBITDA, Adjusted EBITDA and Distributable Cash Flow
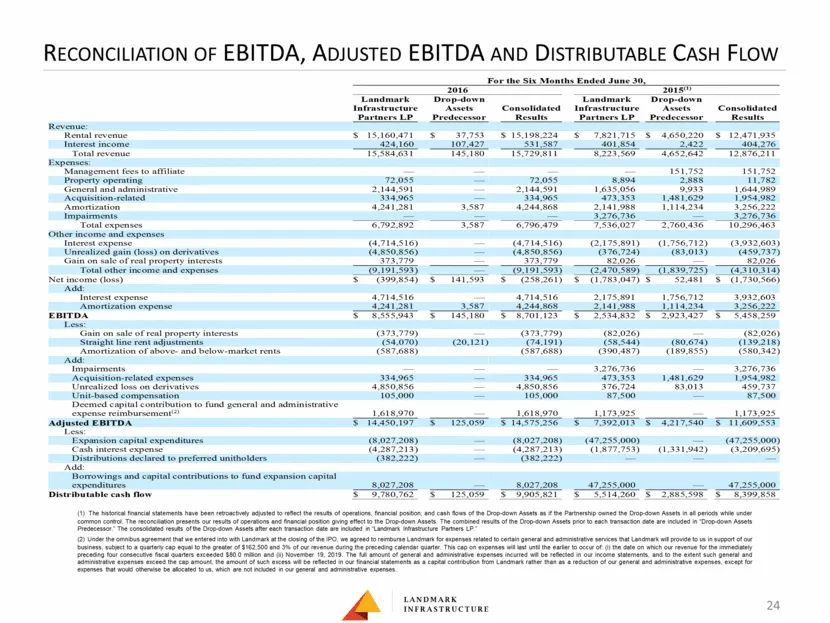
Reconciliation of EBITDA, Adjusted EBITDA and Distributable Cash Flow 24 (1) The historical financial statements have been retroactively adjusted to reflect the results of operations, financial position, and cash flows of the Drop-down Assets as if the Partnership owned the Drop-down Assets in all p
Slide 22: Management Team
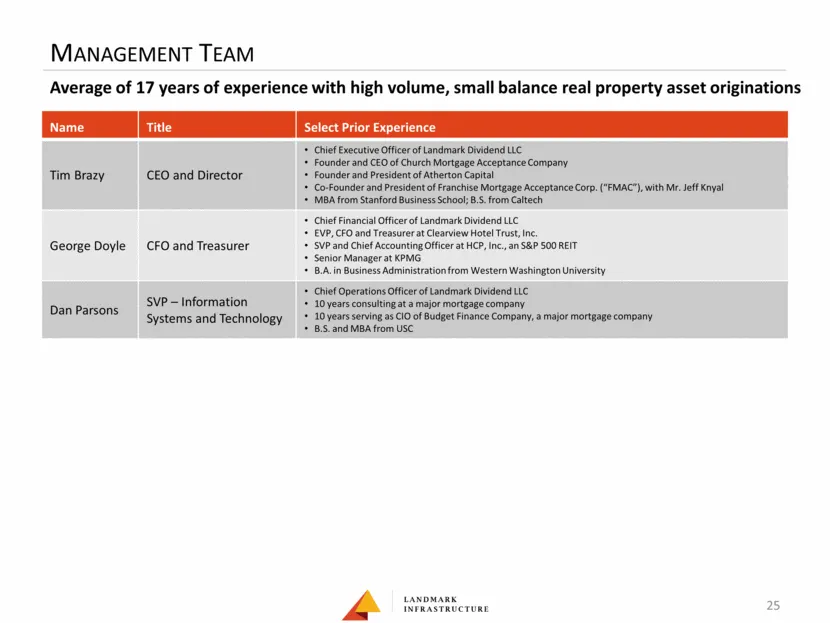
Management Team 25 Average of 17 years of experience with high volume, small balance real property asset originations Name Title Select Prior Experience Tim Brazy CEO and Director Chief Executive Officer of Landmark Dividend LLC Founder and CEO of Church Mortgage Acceptance Company Founder and Presi
Slide 23: Landmark Infrastructure and its Sponsor are Aligned
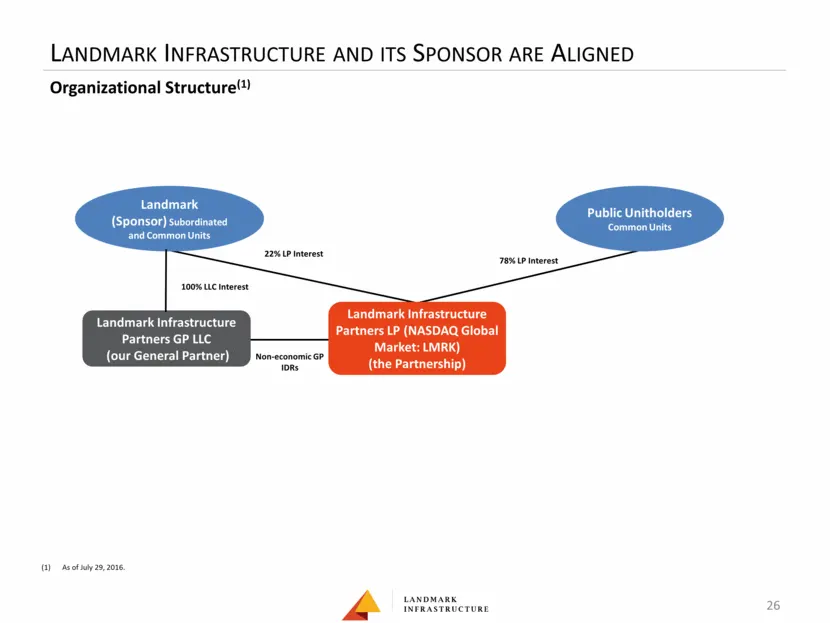
Landmark Infrastructure and its Sponsor are Aligned 26 Organizational Structure(1) 22% LP Interest Landmark Infrastructure Partners LP (NASDAQ Global Market: LMRK) (the Partnership) 100% LLC Interest 78% LP Interest Landmark Infrastructure Partners GP LLC (our General Partner) Public Unitholders Com
Slide 24: Landmark Infrastructure and its Sponsor are Aligned
LANDMARK INFRASTRUCTURE AND ITS SPONSOR ARE ALIGNED Organizational Structure) Landmark Public Unitholders (Sponsor) subordinates ‘Common Units and Common Units 22H UP iteest 7am cerest Landmark Infrastructure Partners LP (NASDAQ Global Market: LMRK) (the Partnership) Landmark Infrastructure Partners
Source: SEC EDGAR · 8-K filed Aug 11, 2016
More decks from Landmark Infrastructure Partners LP
 Investor Presentation (December 2020)28 slides · Dec 9, 2020
 Investor Presentation (June 2020)28 slides · Jun 2, 2020
 Investor Presentation (March 2020)28 slides · Mar 11, 2020
 Investor Presentation (November 2019)28 slides · Nov 12, 2019
 Investor Presentation (September 2019)28 slides · Sep 4, 2019
 Investor Presentation (May 2019)28 slides · May 14, 2019