Varex Imaging Corporation · NASDAQ:VREX
Varex Imaging — Q2 2021 Earnings Presentation
22 slides from Varex Imaging's earnings presentation, May 4, 2021
Slide 1: Q2 FY21 Earnings Presentation
Solutions in Sight™ Q2 FY21 Earnings Presentation May 4, 2021 Proprietary and Confidential Information
Slide 2: Forward Looking Statements / Non-GAAP Measures
Forward Looking Statements / Non-GAAP Measures Forward Looking Statements Certain statements in this supplement contain “forward-looking statements” within the meaning of Section 27A of the Securities Act of 1933 and Section 21E of the Securities Exchange Act of 1934. Forward looking statements incl
Slide 3: Q2 FY21 Results
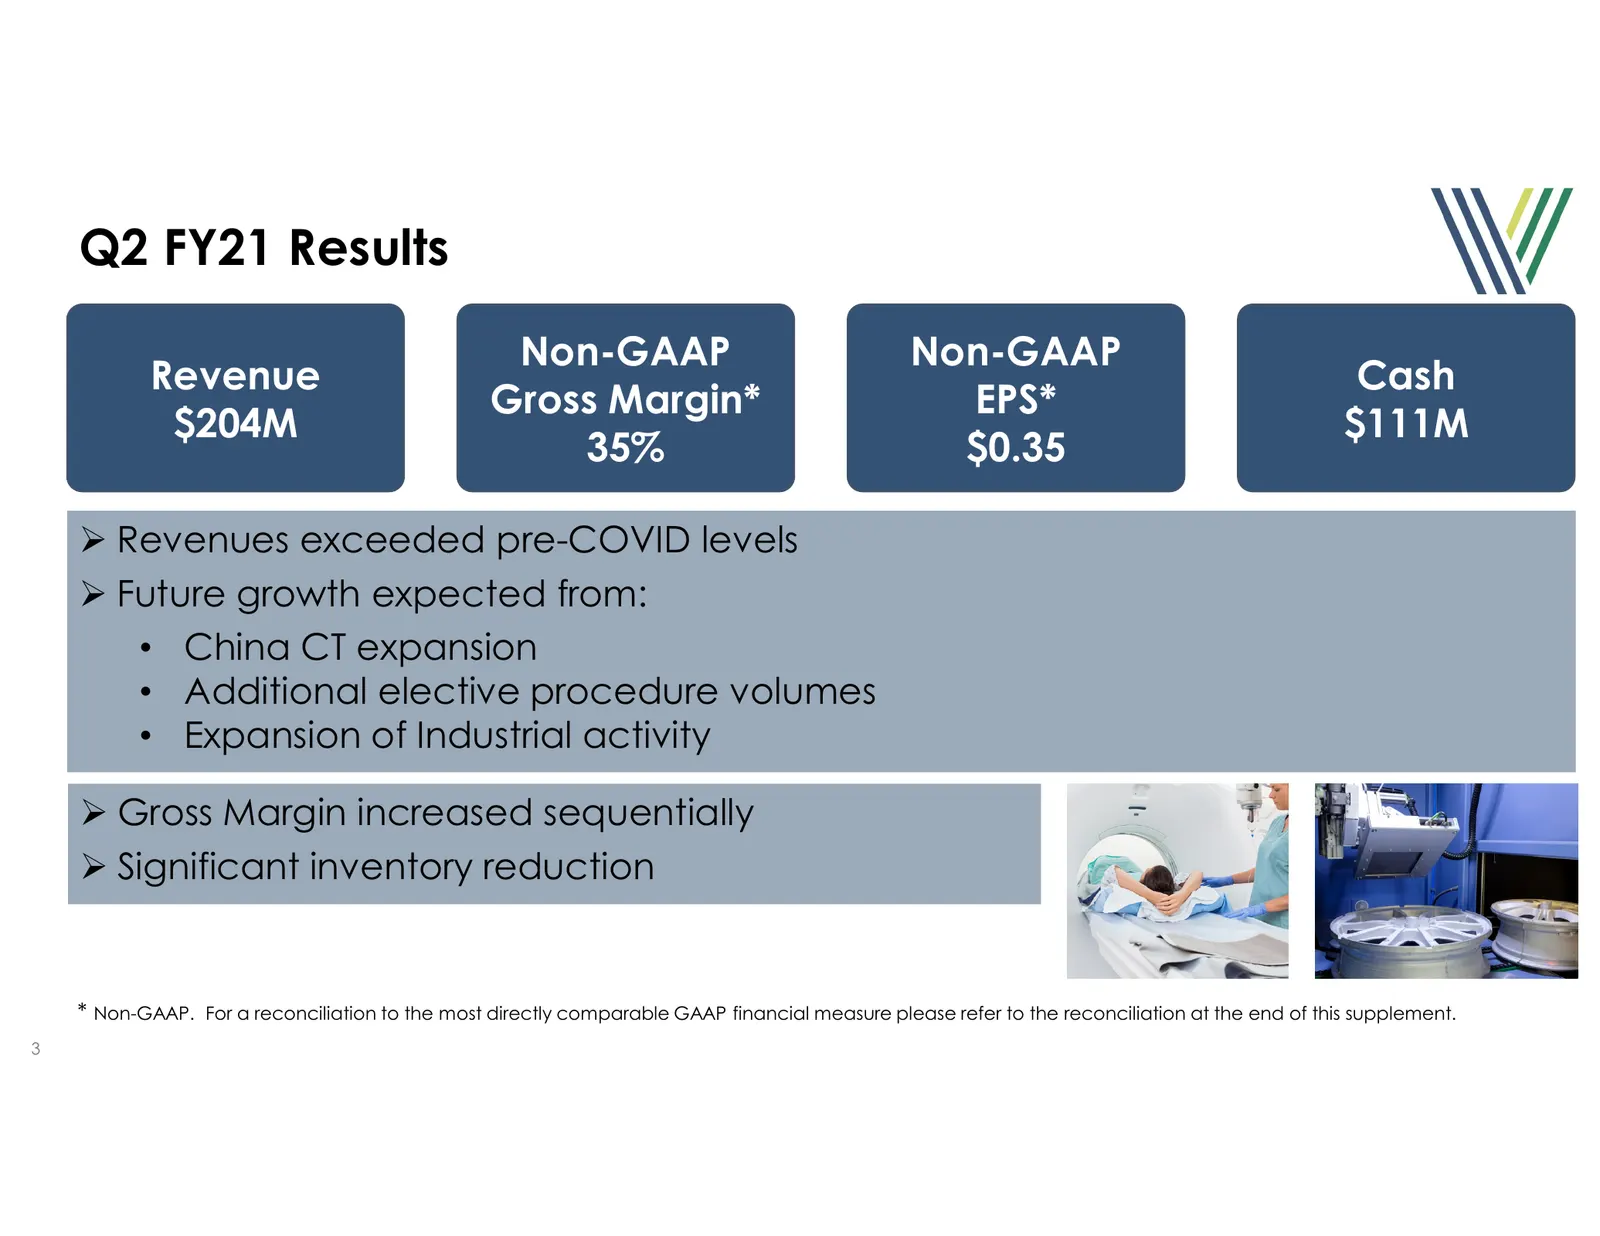
Q2 FY21 Results Non-GAAP Non-GAAP Revenue Cash Gross Margin* EPS* $204M $111M 35% $0.35 Revenues exceeded pre-COVID levels Future growth expected from: • China CT expansion • Additional elective procedure volumes • Expansion of Industrial activity Gross Margin increased sequentially Signific
Slide 4: Q2 FY21 Sequential Trends
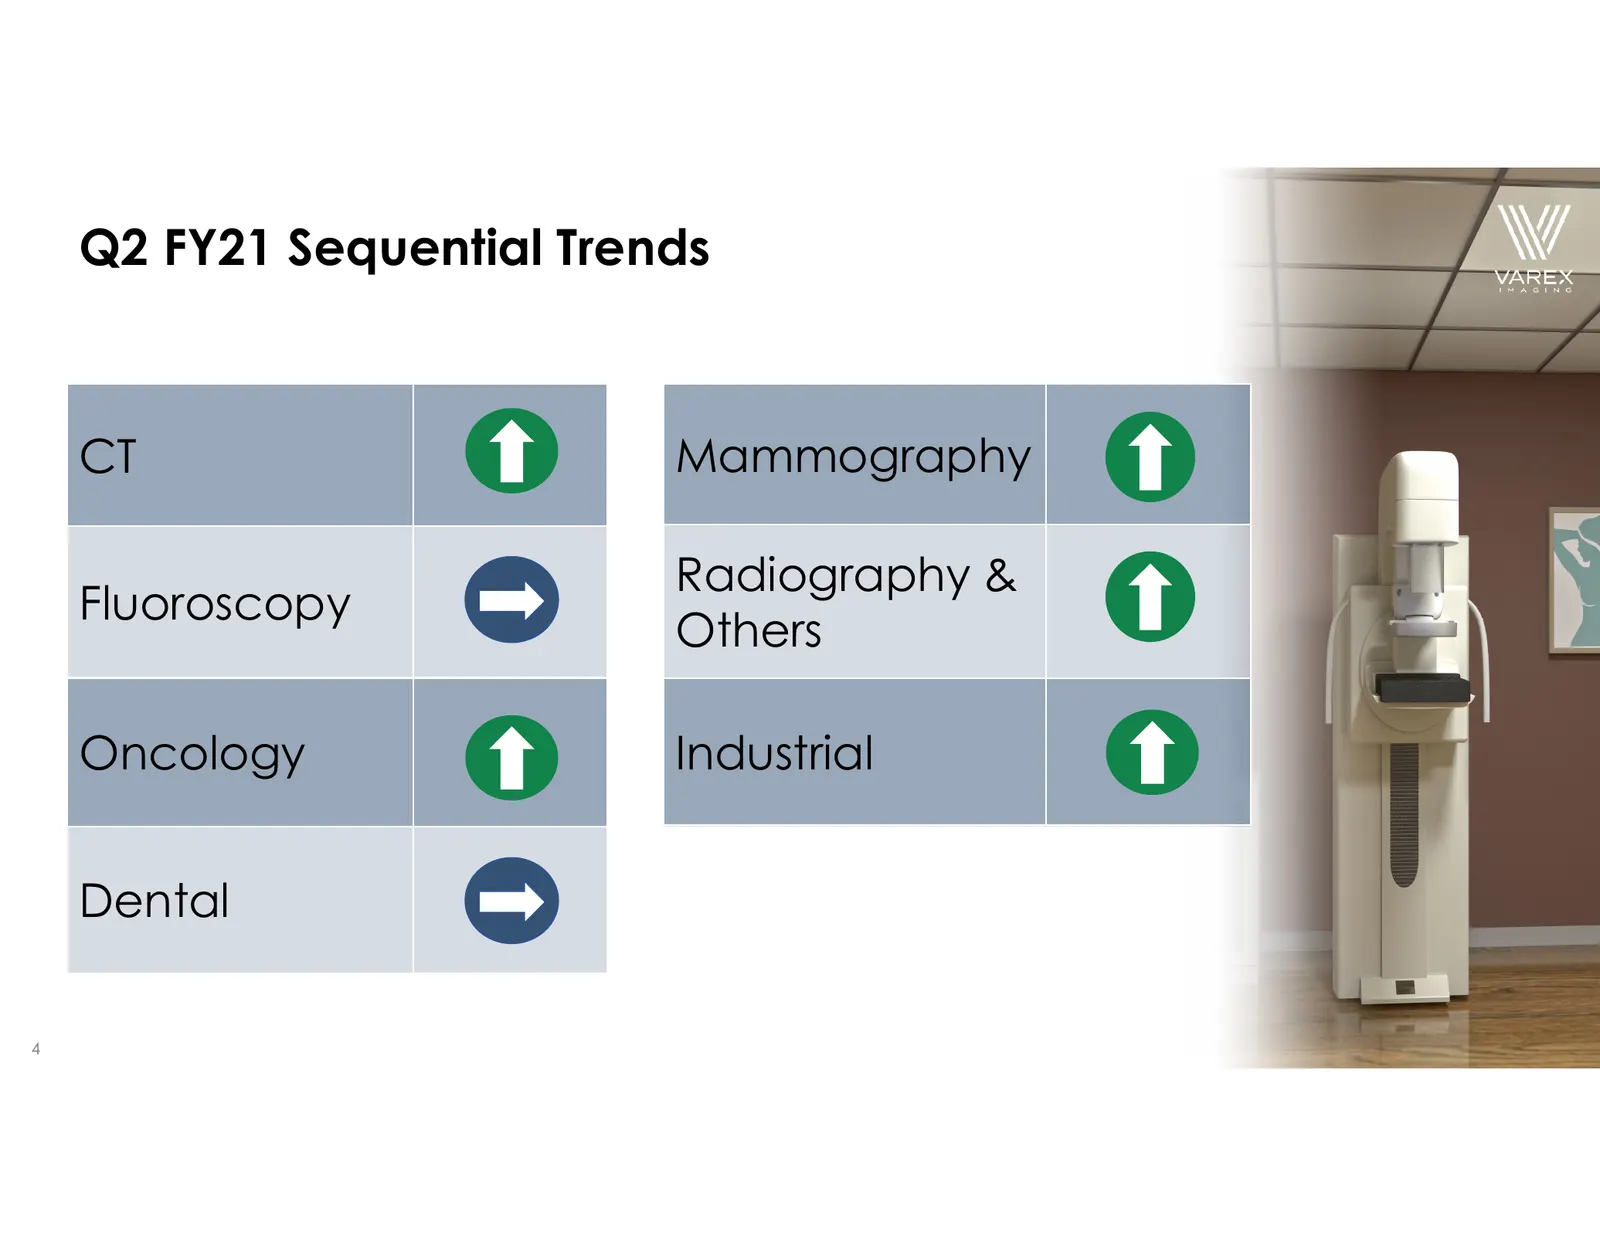
Q2 FY21 Sequential Trends CT Mammography Radiography & Fluoroscopy Others Oncology Industrial Dental 4
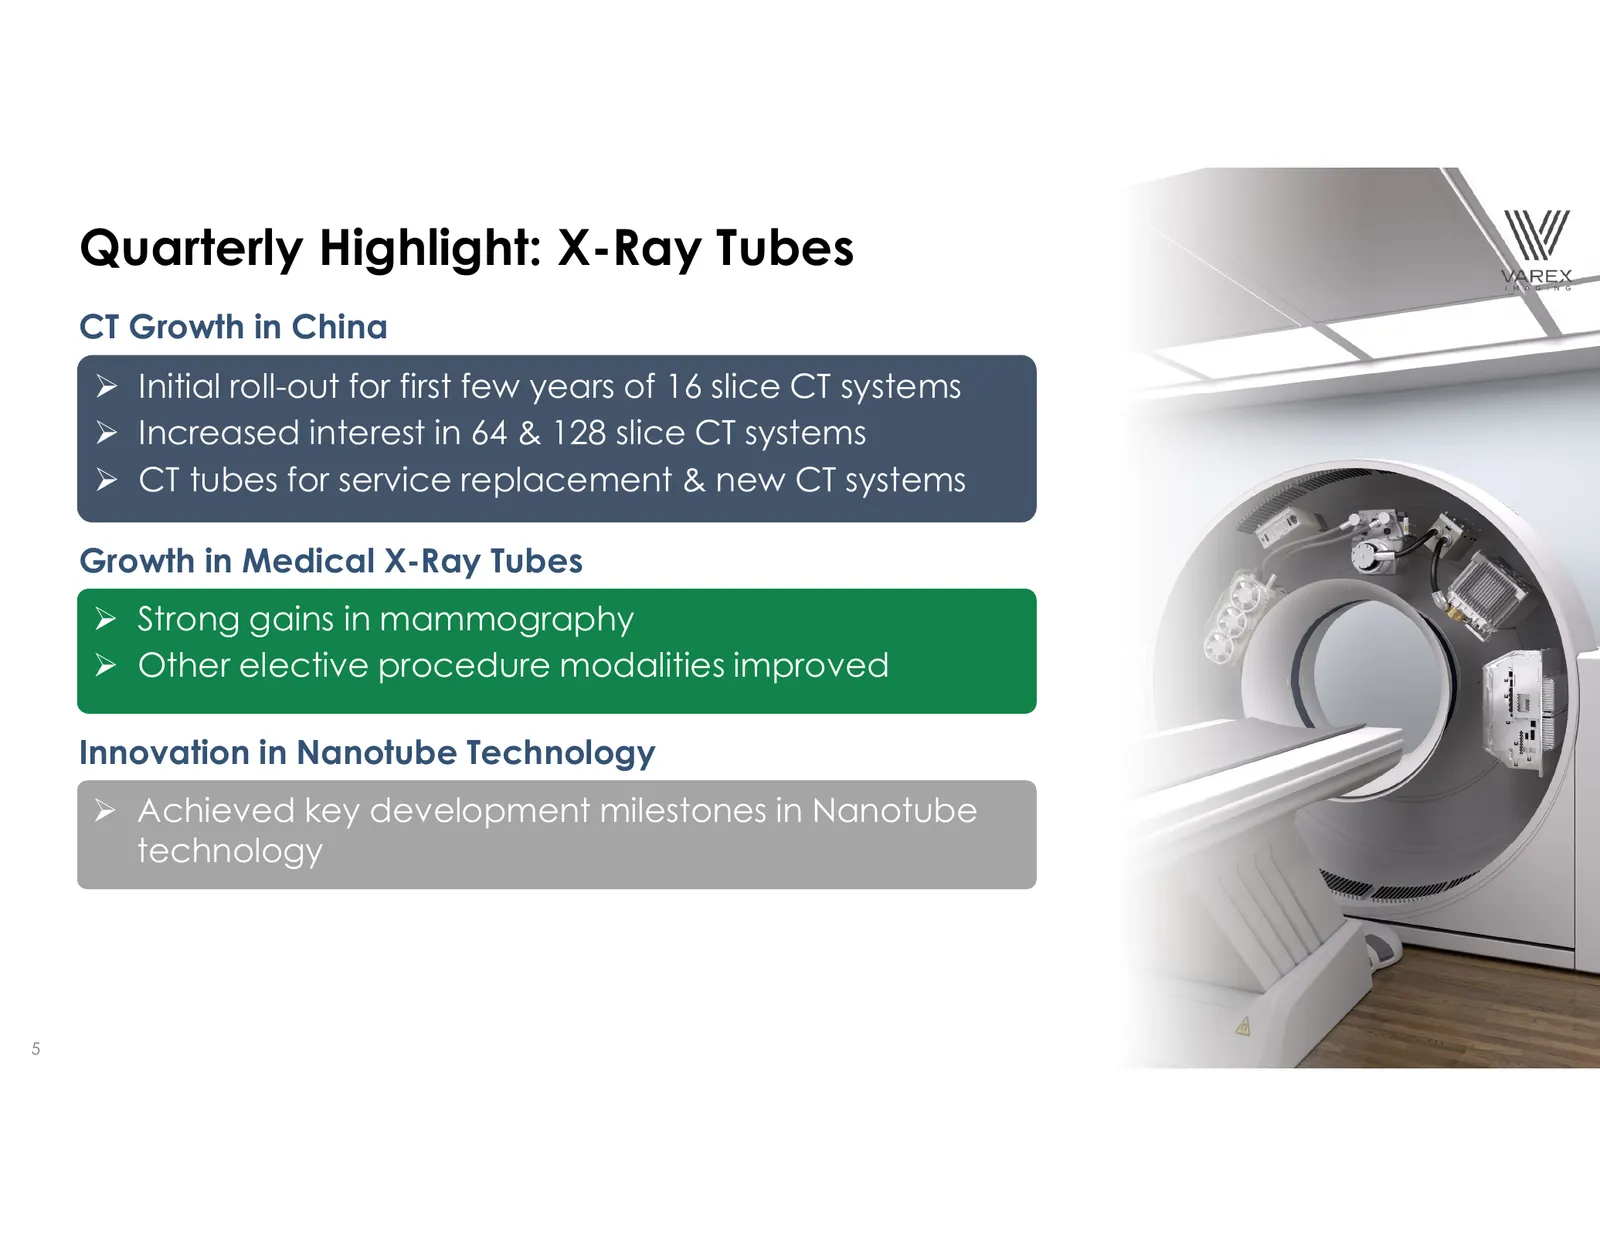
Slide 5: Quarterly Highlight: X-Ray Tubes
Quarterly Highlight: X-Ray Tubes CT Growth in China Initial roll-out for first few years of 16 slice CT systems Increased interest in 64 & 128 slice CT systems CT tubes for service replacement & new CT systems Growth in Medical X-Ray Tubes Strong gains in mammography Other elective procedu
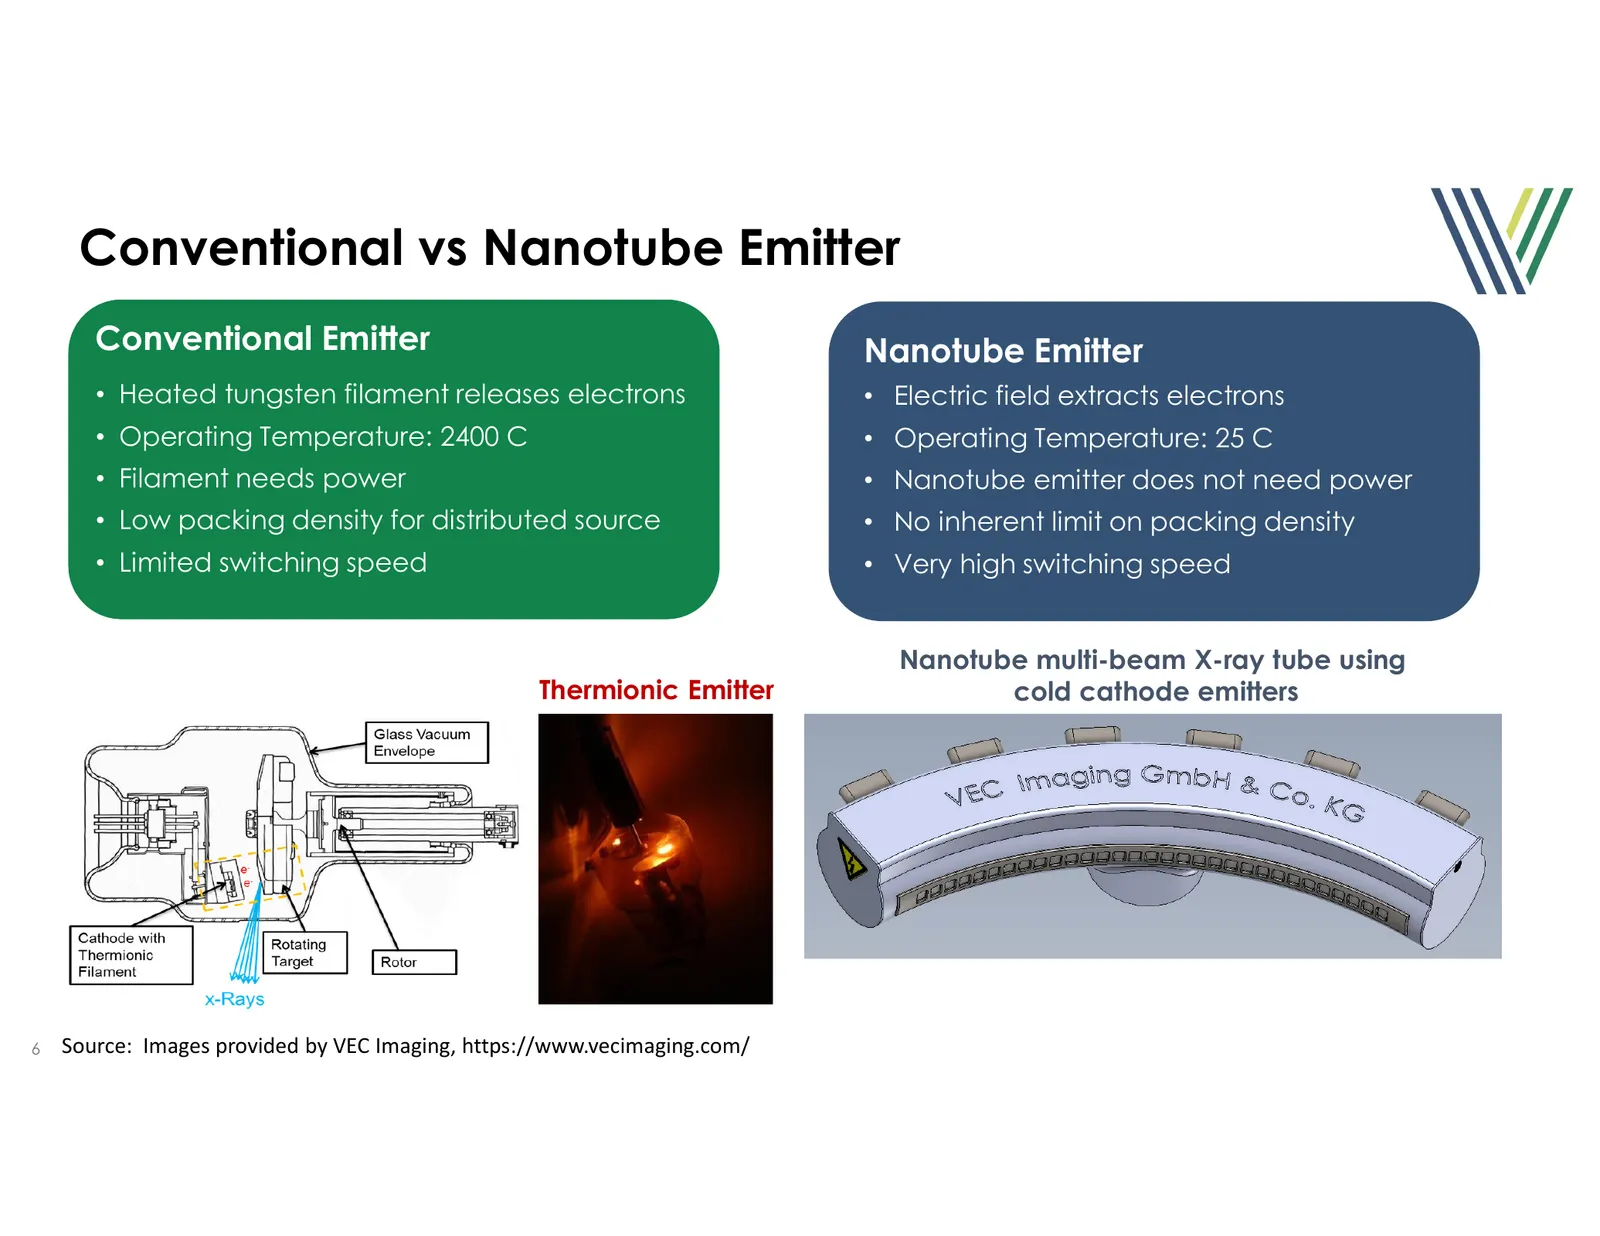
Slide 6: Conventional vs Nanotube Emitter
Conventional vs Nanotube Emitter Conventional Emitter Nanotube Emitter • Heated tungsten filament releases electrons • Electric field extracts electrons • Operating Temperature: 2400 C • Operating Temperature: 25 C • Filament needs power • Nanotube emitter does not need power • Low packing density f
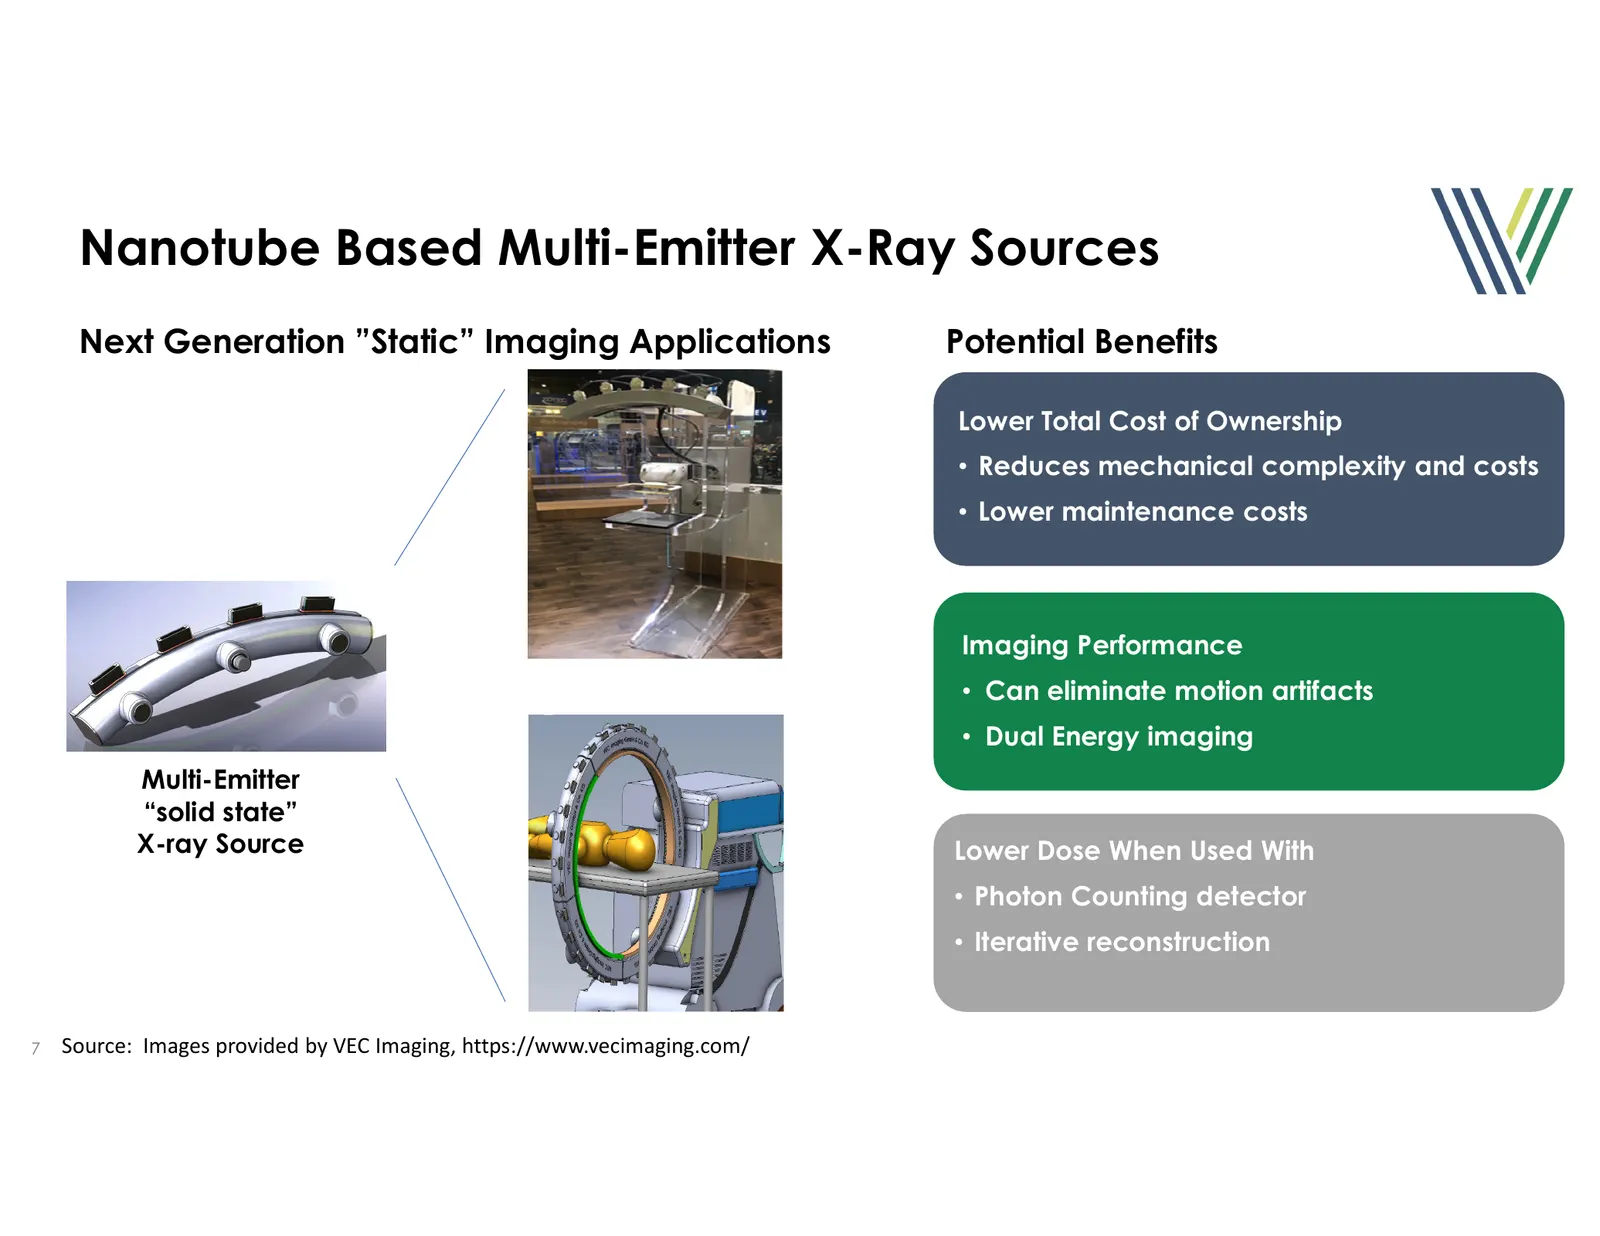
Slide 7: Nanotube Based Multi-Emitter X-Ray Sources
Nanotube Based Multi-Emitter X-Ray Sources Next Generation ”Static” Imaging Applications Potential Benefits Lower Total Cost of Ownership • Reduces mechanical complexity and costs • Lower maintenance costs Imaging Performance • Can eliminate motion artifacts • Dual Energy imaging Multi-Emitter “soli
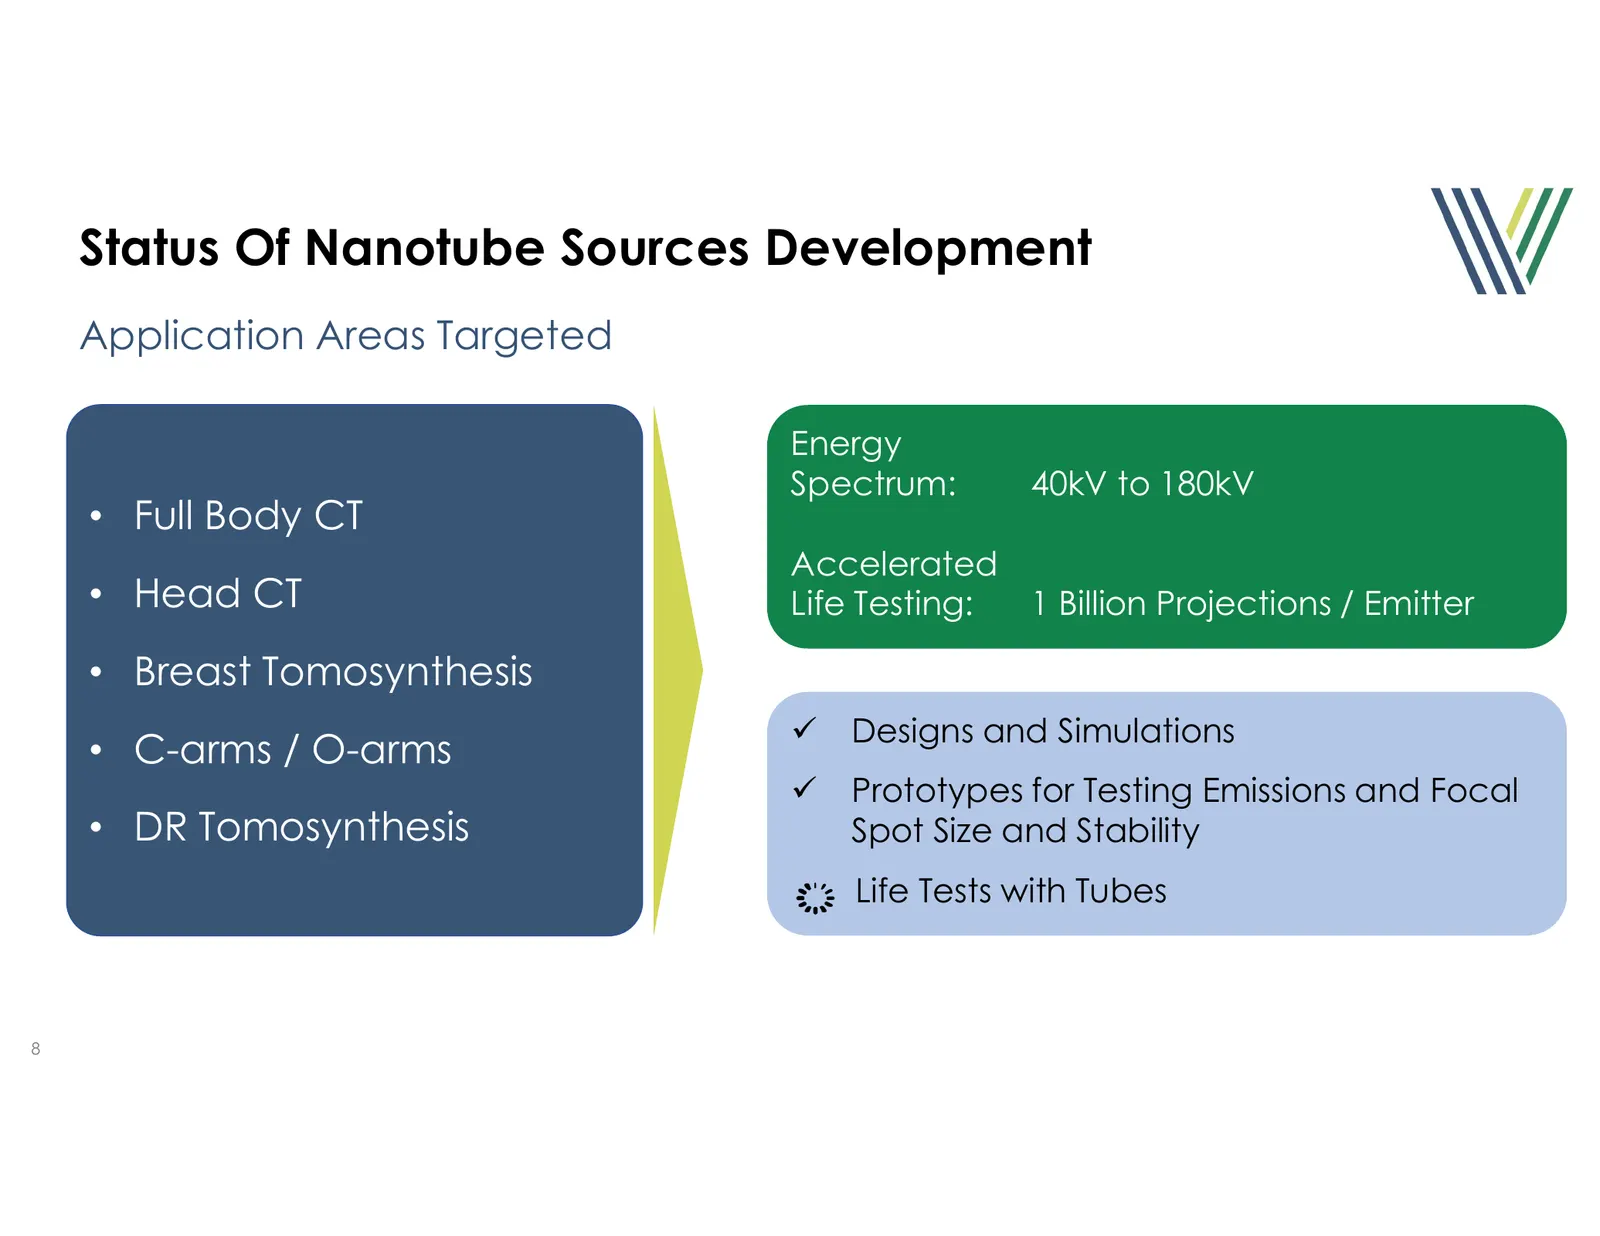
Slide 8: Status Of Nanotube Sources Development
Status Of Nanotube Sources Development Application Areas Targeted Energy Spectrum: 40kV to 180kV • Full Body CT Accelerated • Head CT Life Testing: 1 Billion Projections / Emitter • Breast Tomosynthesis Designs and Simulations • C-arms / O-arms Prototypes for Testing Emissions and Focal • DR Tom
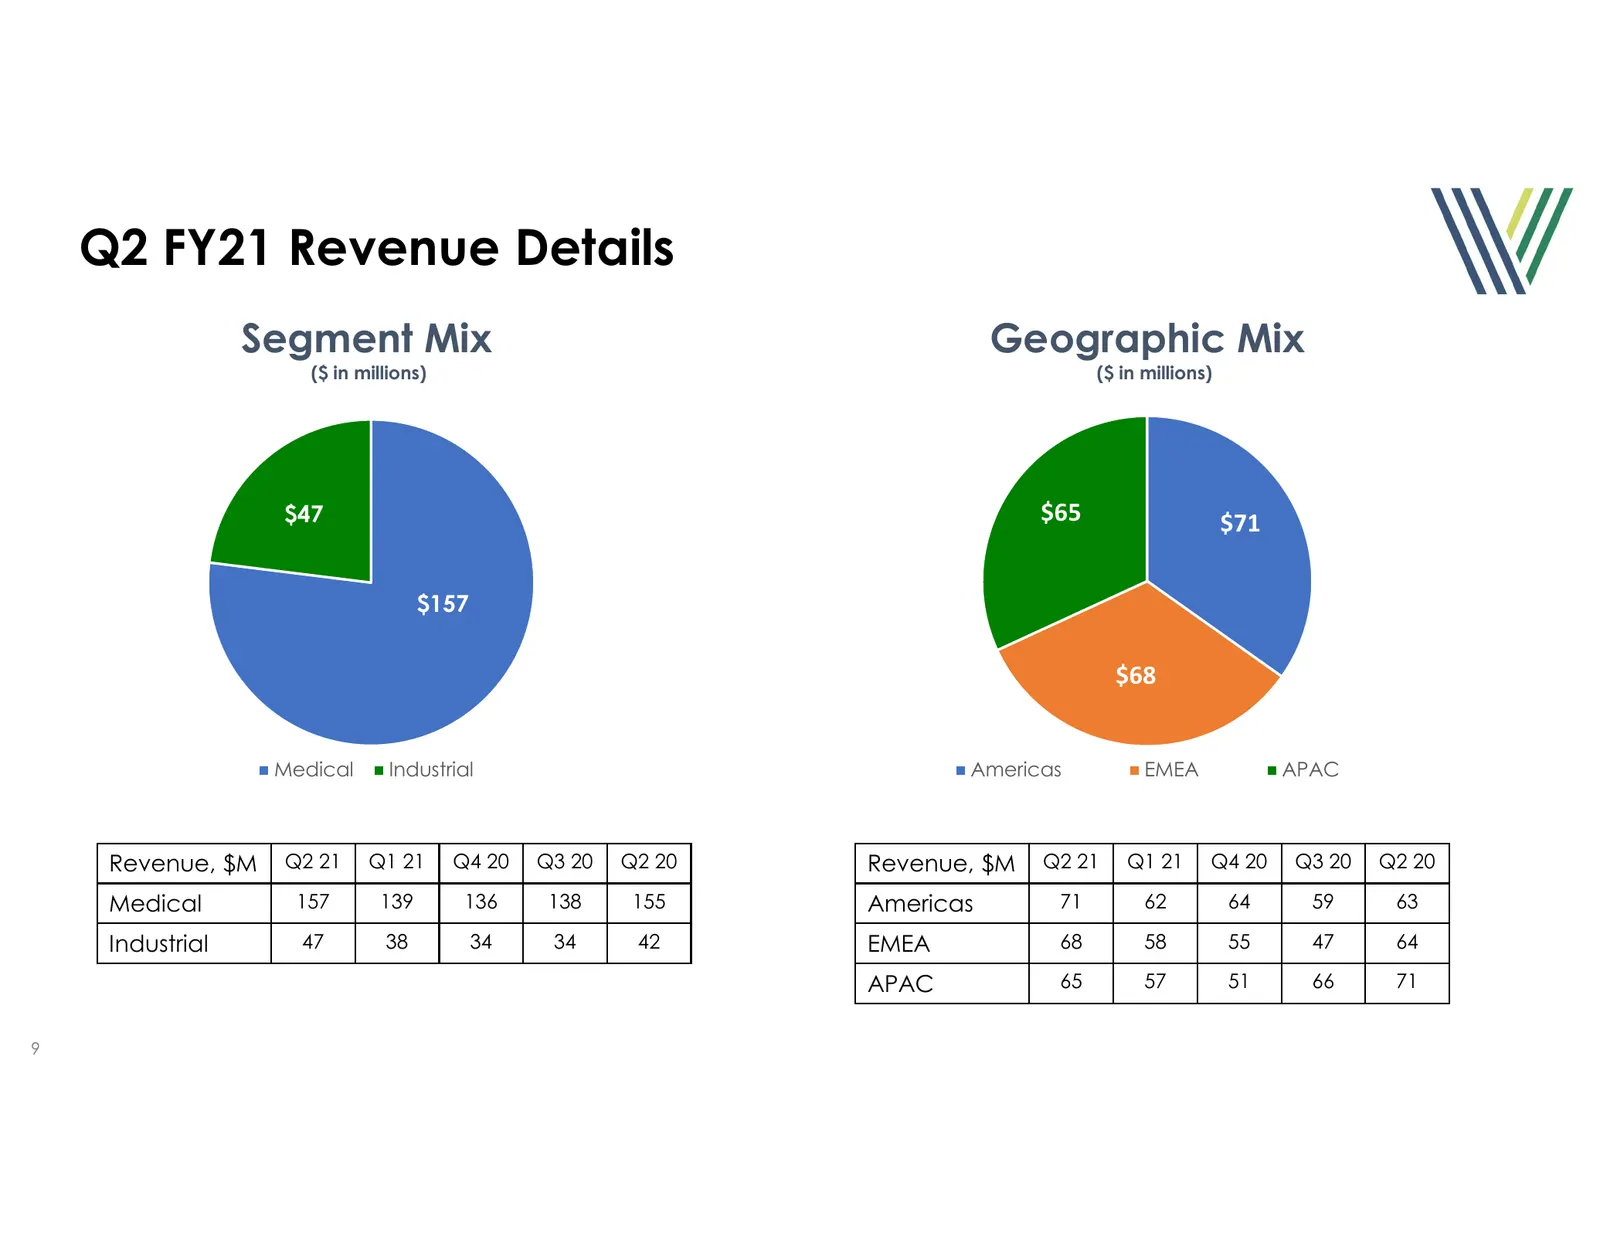
Slide 9: Q2 FY21 Revenue Details
Q2 FY21 Revenue Details Segment Mix Geographic Mix ($ in millions) ($ in millions) $47 $65 $71 $157 $68 Medical Industrial Americas EMEA APAC Revenue, $M Q2 21 Q1 21 Q4 20 Q3 20 Q2 20 Revenue, $M Q2 21 Q1 21 Q4 20 Q3 20 Q2 20 Medical 157 139 136 138 155 Americas 71 62 64 59 63 Industrial 47 38 34 34
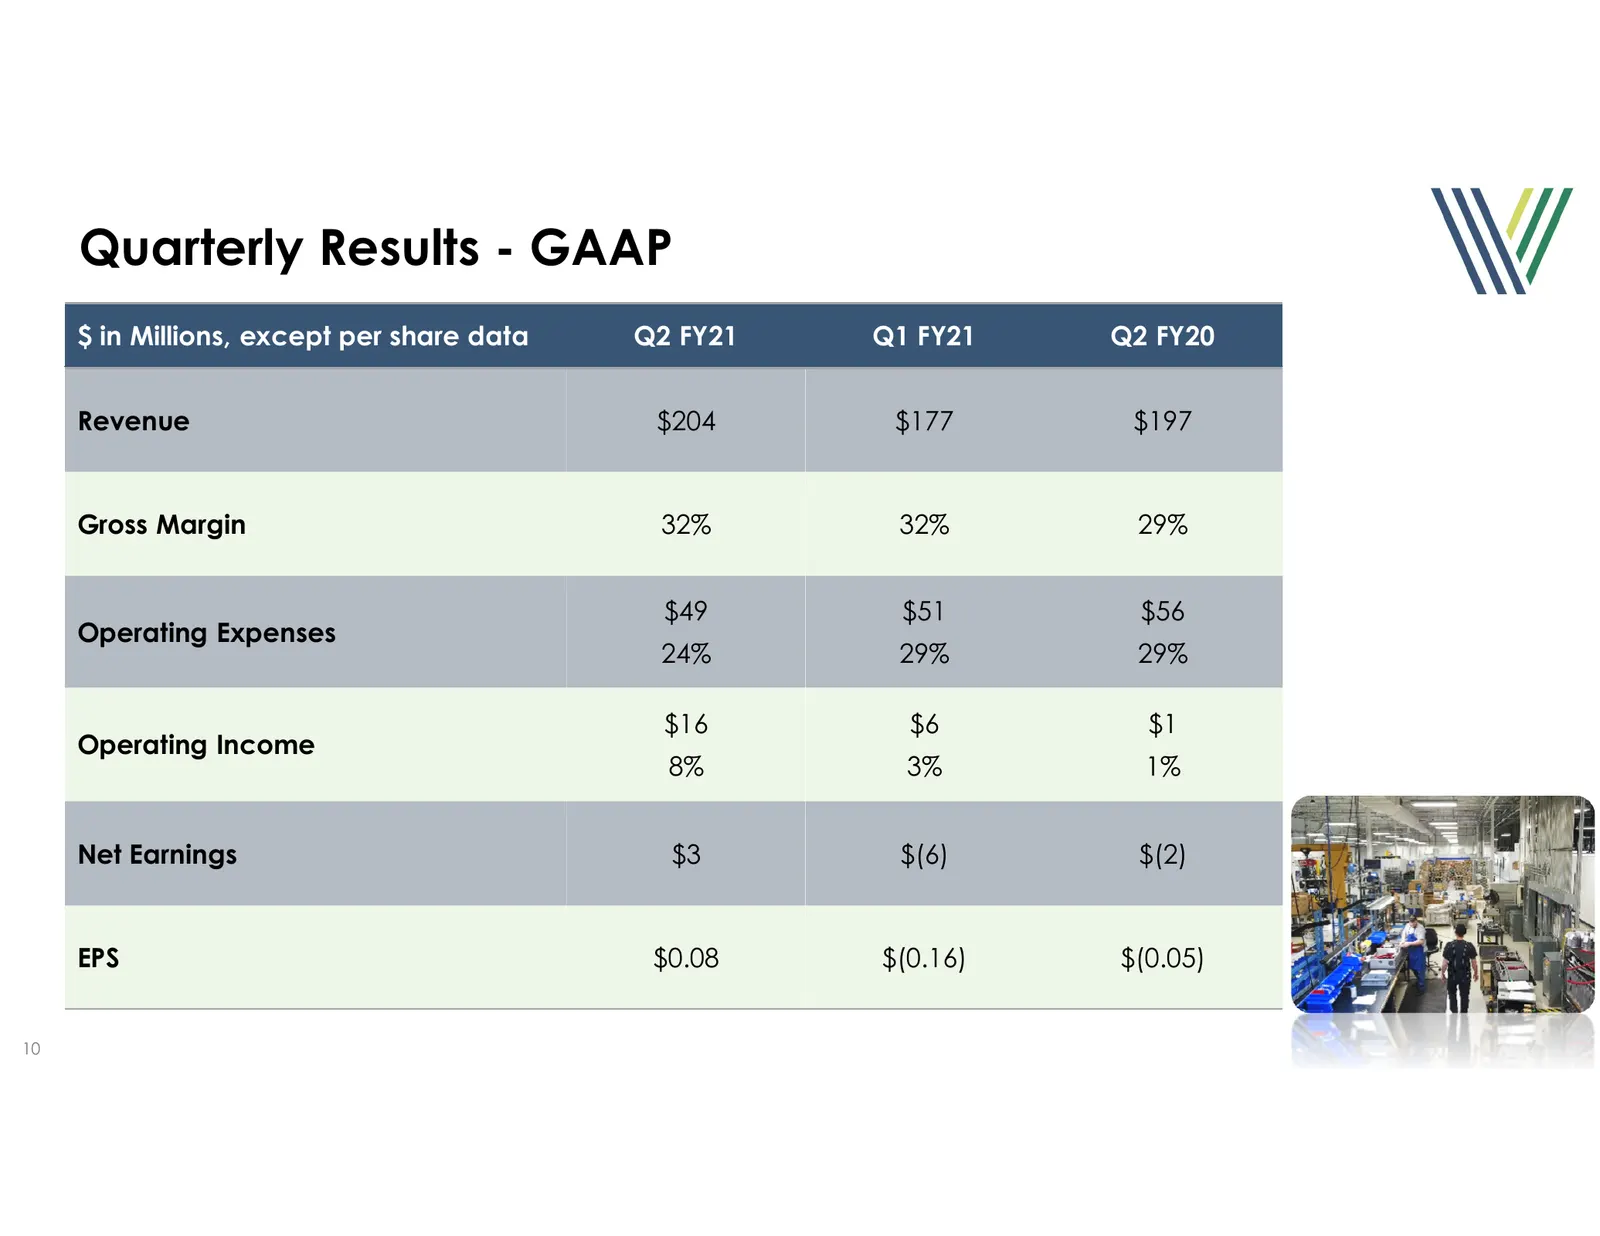
Slide 10: Quarterly Results - GAAP
Quarterly Results - GAAP $ in Millions, except per share data Q2 FY21 Q1 FY21 Q2 FY20 Revenue $204 $177 $197 Gross Margin 32% 32% 29% $49 $51 $56 Operating Expenses 24% 29% 29% $16 $6 $1 Operating Income 8% 3% 1% Net Earnings $3 $(6) $(2) EPS $0.08 $(0.16) $(0.05) 10 Proprietary and Confidential Inf
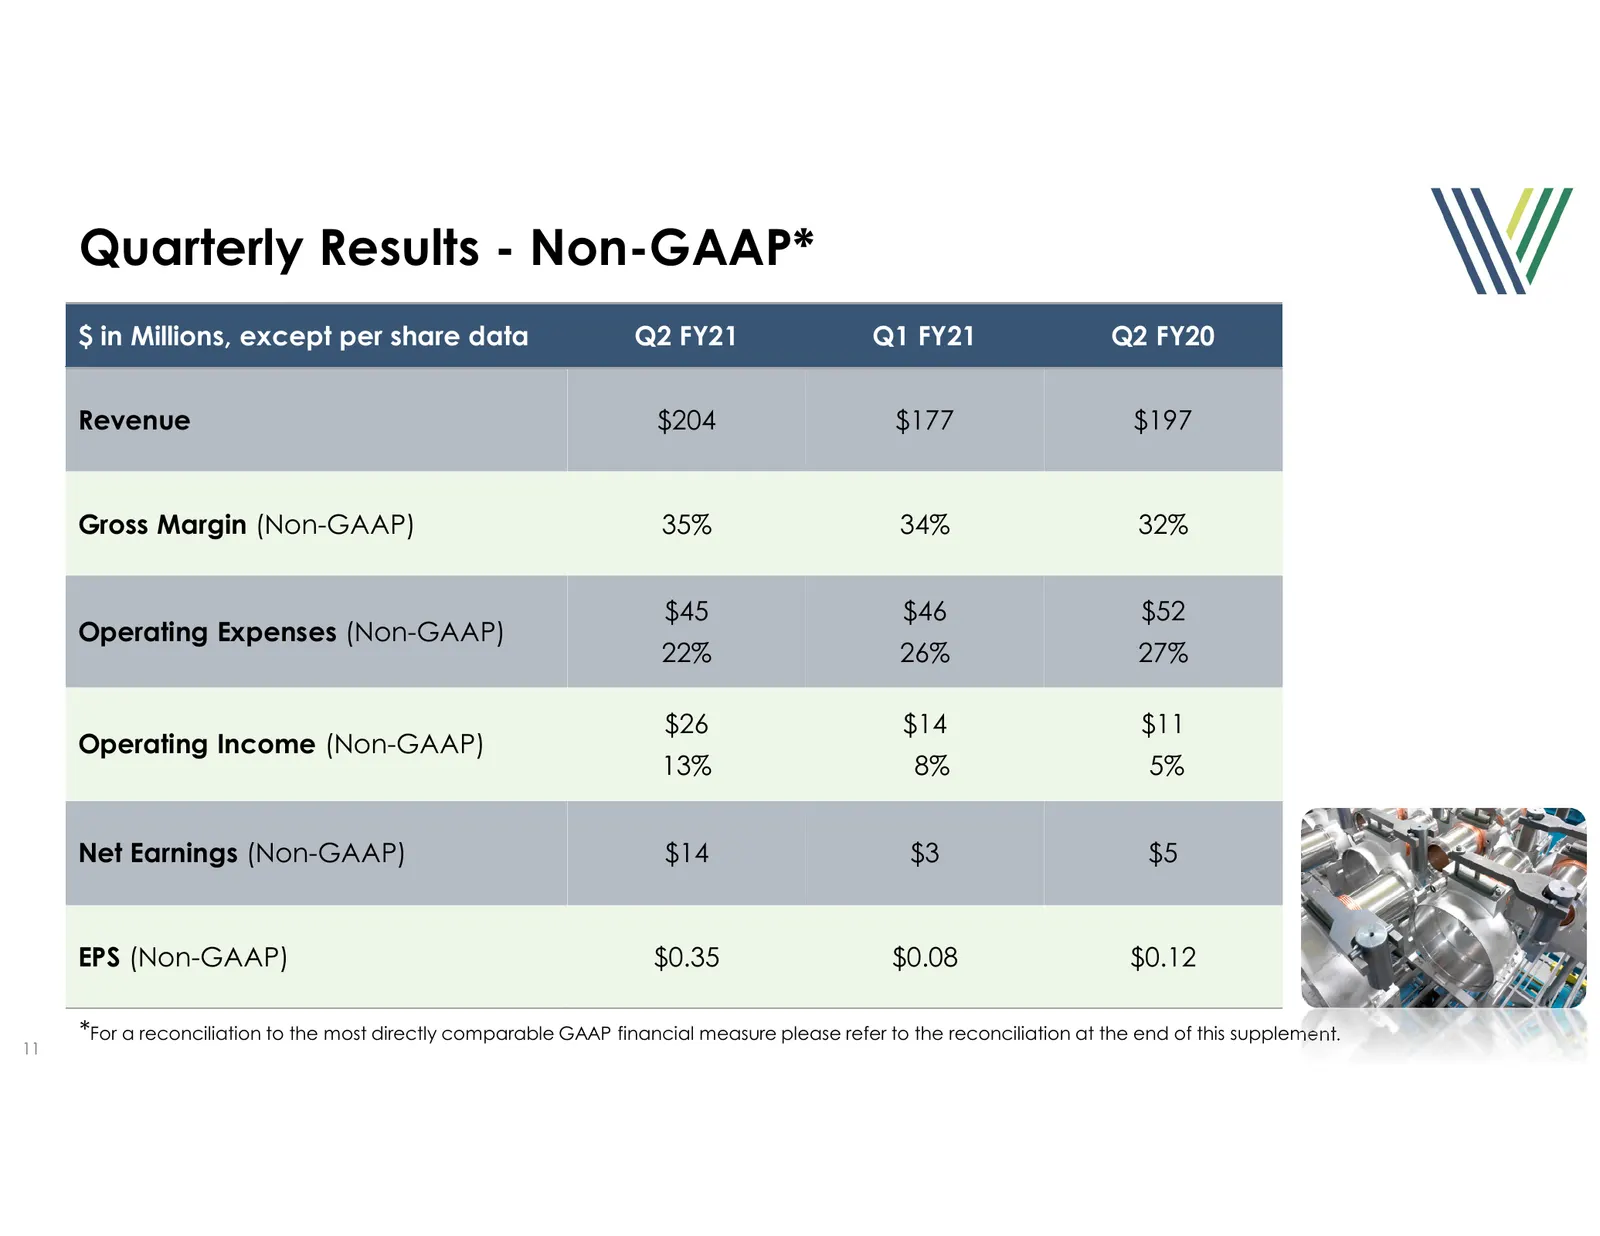
Slide 11: Quarterly Results - Non-GAAP
Quarterly Results - Non-GAAP* $ in Millions, except per share data Q2 FY21 Q1 FY21 Q2 FY20 Revenue $204 $177 $197 Gross Margin (Non-GAAP) 35% 34% 32% $45 $46 $52 Operating Expenses (Non-GAAP) 22% 26% 27% $26 $14 $11 Operating Income (Non-GAAP) 13% 8% 5% Net Earnings (Non-GAAP) $14 $3 $5 EPS (Non-GAA
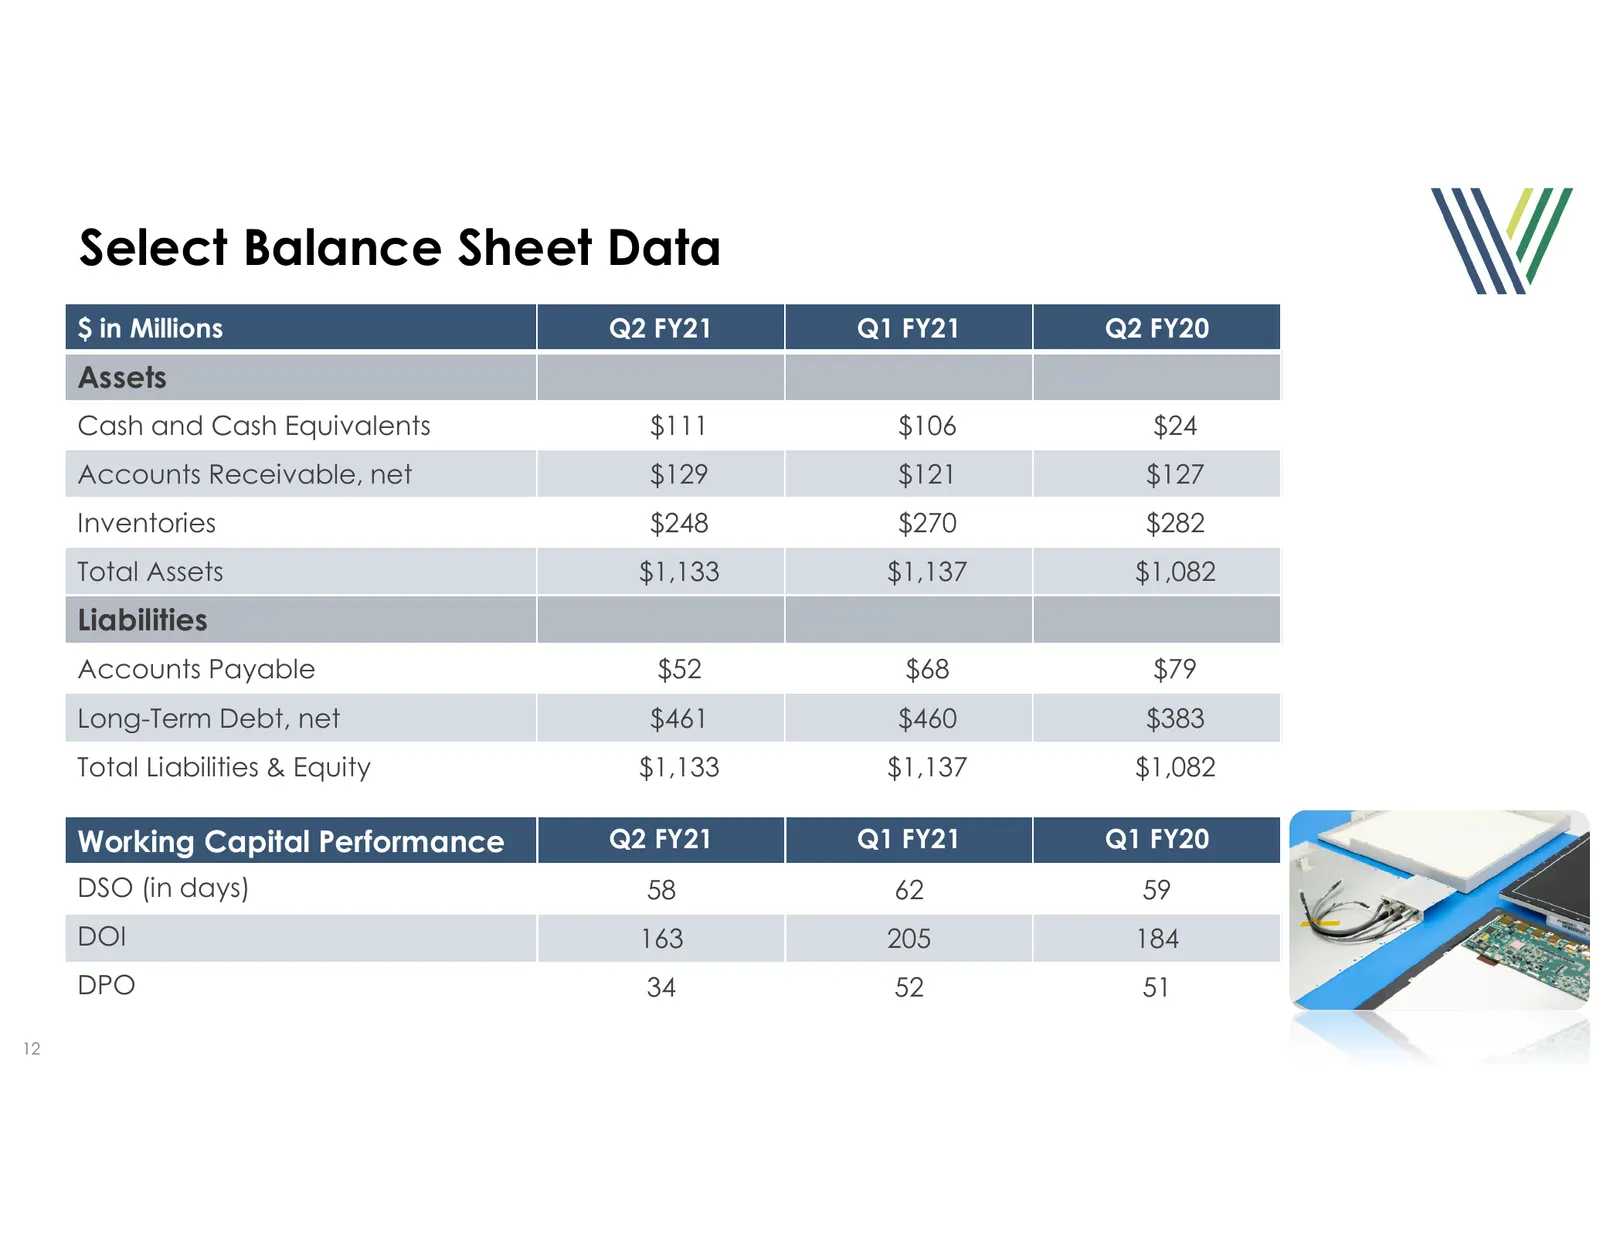
Slide 12: Select Balance Sheet Data
Select Balance Sheet Data $ in Millions Q2 FY21 Q1 FY21 Q2 FY20 Assets Cash and Cash Equivalents $111 $106 $24 Accounts Receivable, net $129 $121 $127 Inventories $248 $270 $282 Total Assets $1,133 $1,137 $1,082 Liabilities Accounts Payable $52 $68 $79 Long-Term Debt, net $461 $460 $383 Total Liabil
Slide 13: Select Debt and Cash Flow Data
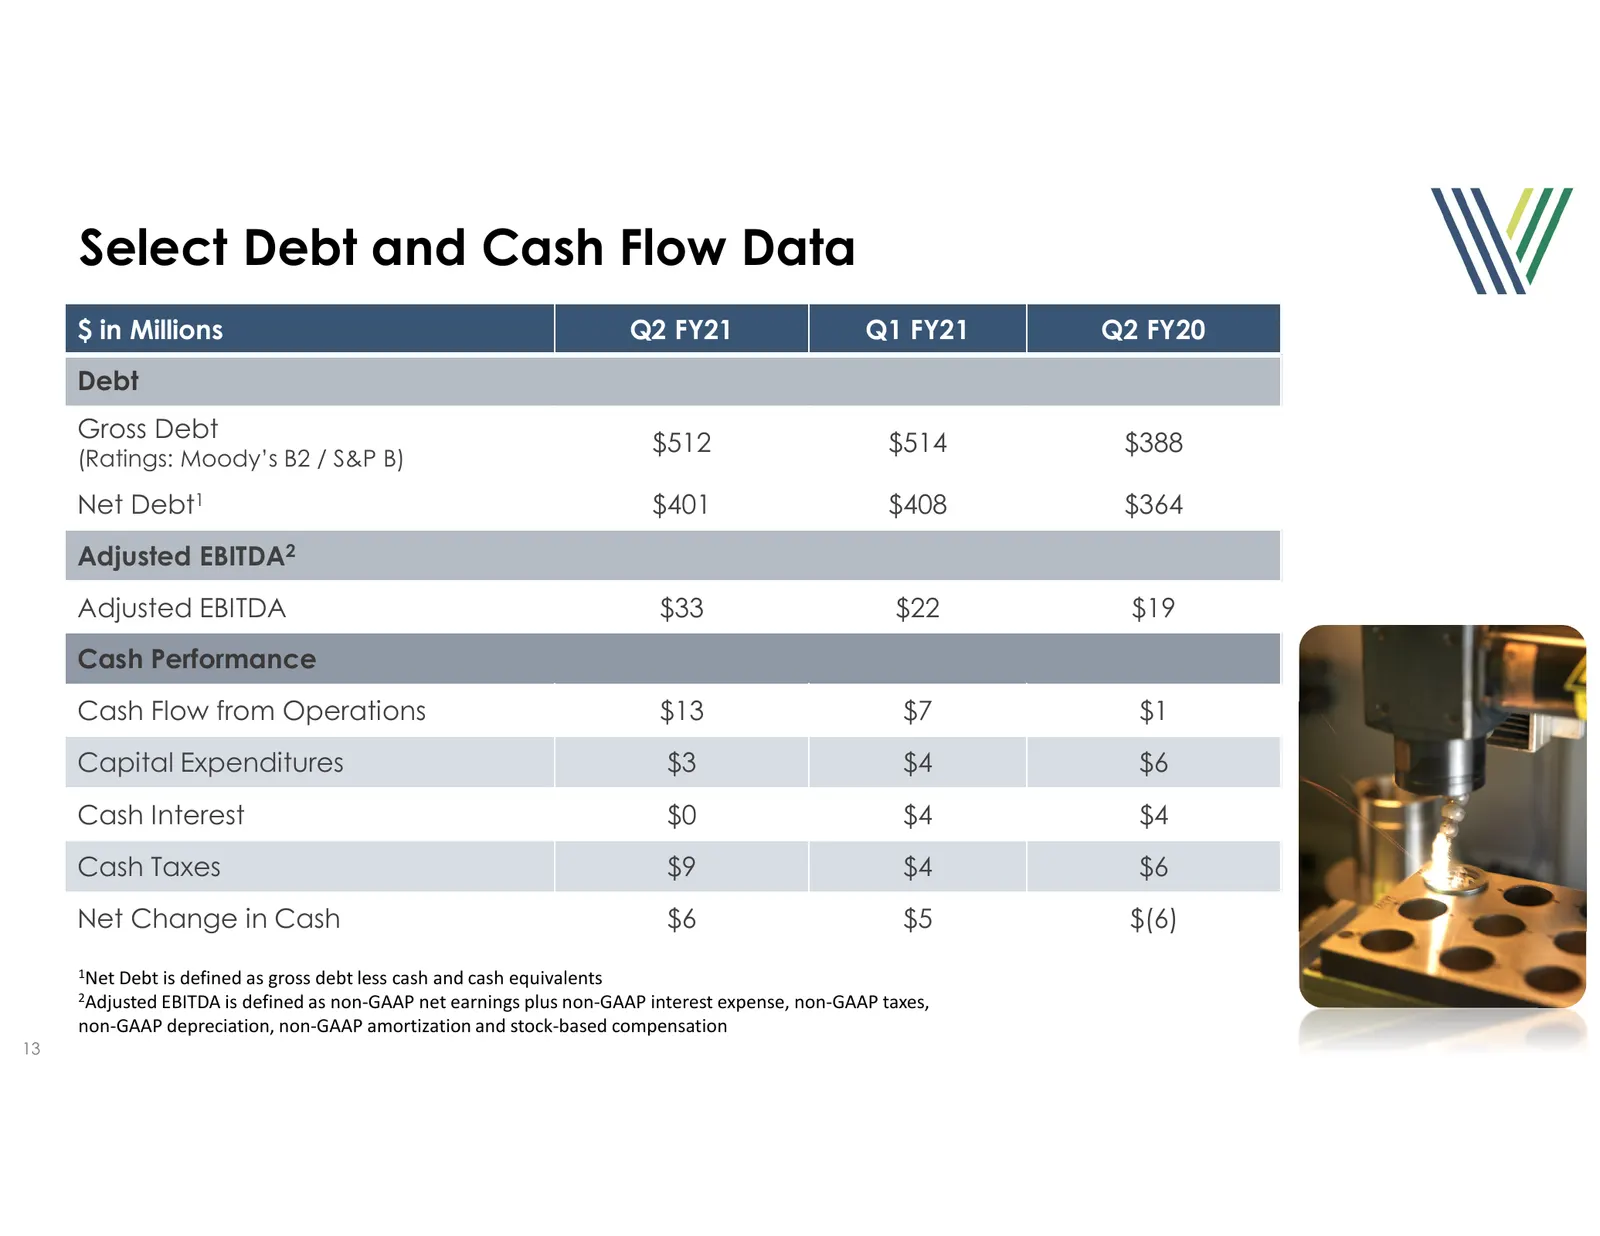
Select Debt and Cash Flow Data $ in Millions Q2 FY21 Q1 FY21 Q2 FY20 Debt Gross Debt $512 $514 $388 (Ratings: Moody’s B2 / S&P B) Net Debt1 $401 $408 $364 Adjusted EBITDA2 Adjusted EBITDA $33 $22 $19 Cash Performance Cash Flow from Operations $13 $7 $1 Capital Expenditures $3 $4 $6 Cash Interest $0
Slide 14: Outlook Q3 FY21
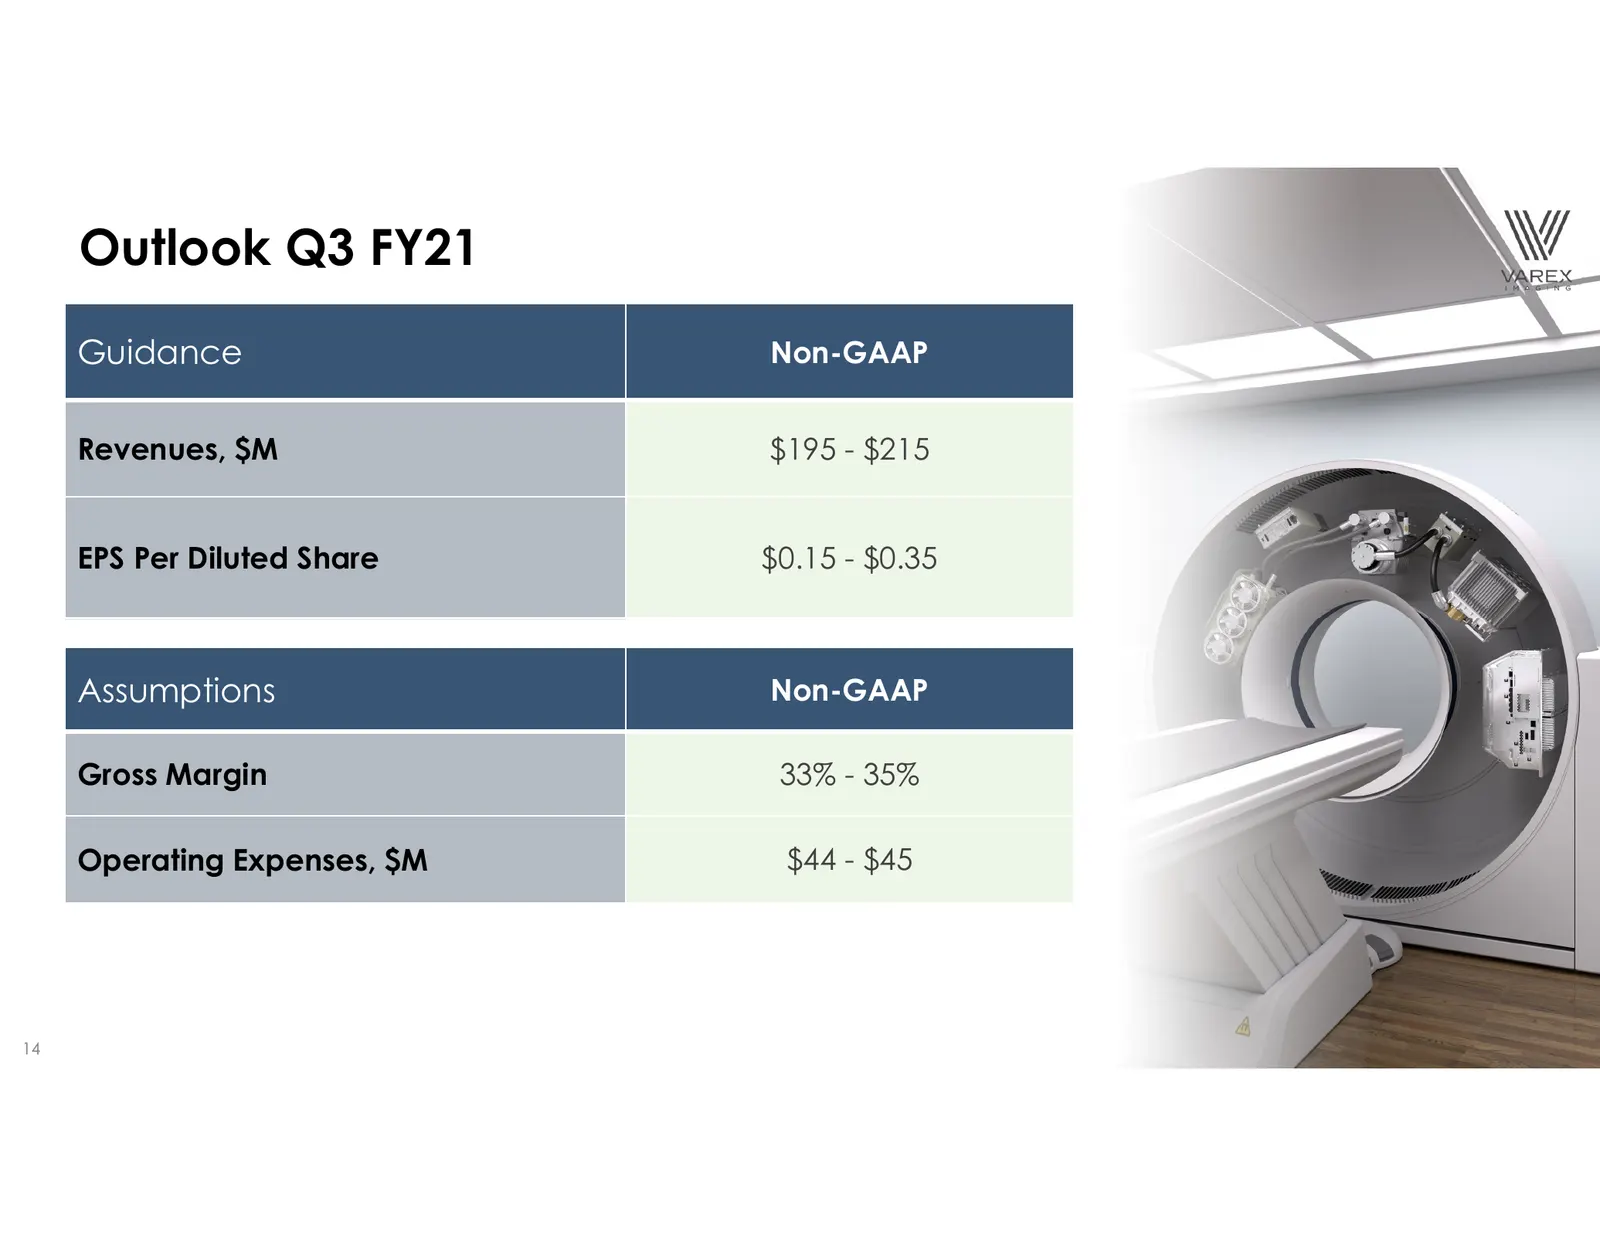
Outlook Q3 FY21 Guidance Non-GAAP Revenues, $M $195 - $215 EPS Per Diluted Share $0.15 - $0.35 Assumptions Non-GAAP Gross Margin 33% - 35% Operating Expenses, $M $44 - $45 14
Slide 15: Q&A
Solutions in Sight™ Q&A Proprietary and Confidential Information
Slide 16: Non-GAAP Reconciliation
Solutions in Sight™ Non-GAAP Reconciliation Proprietary and Confidential Information
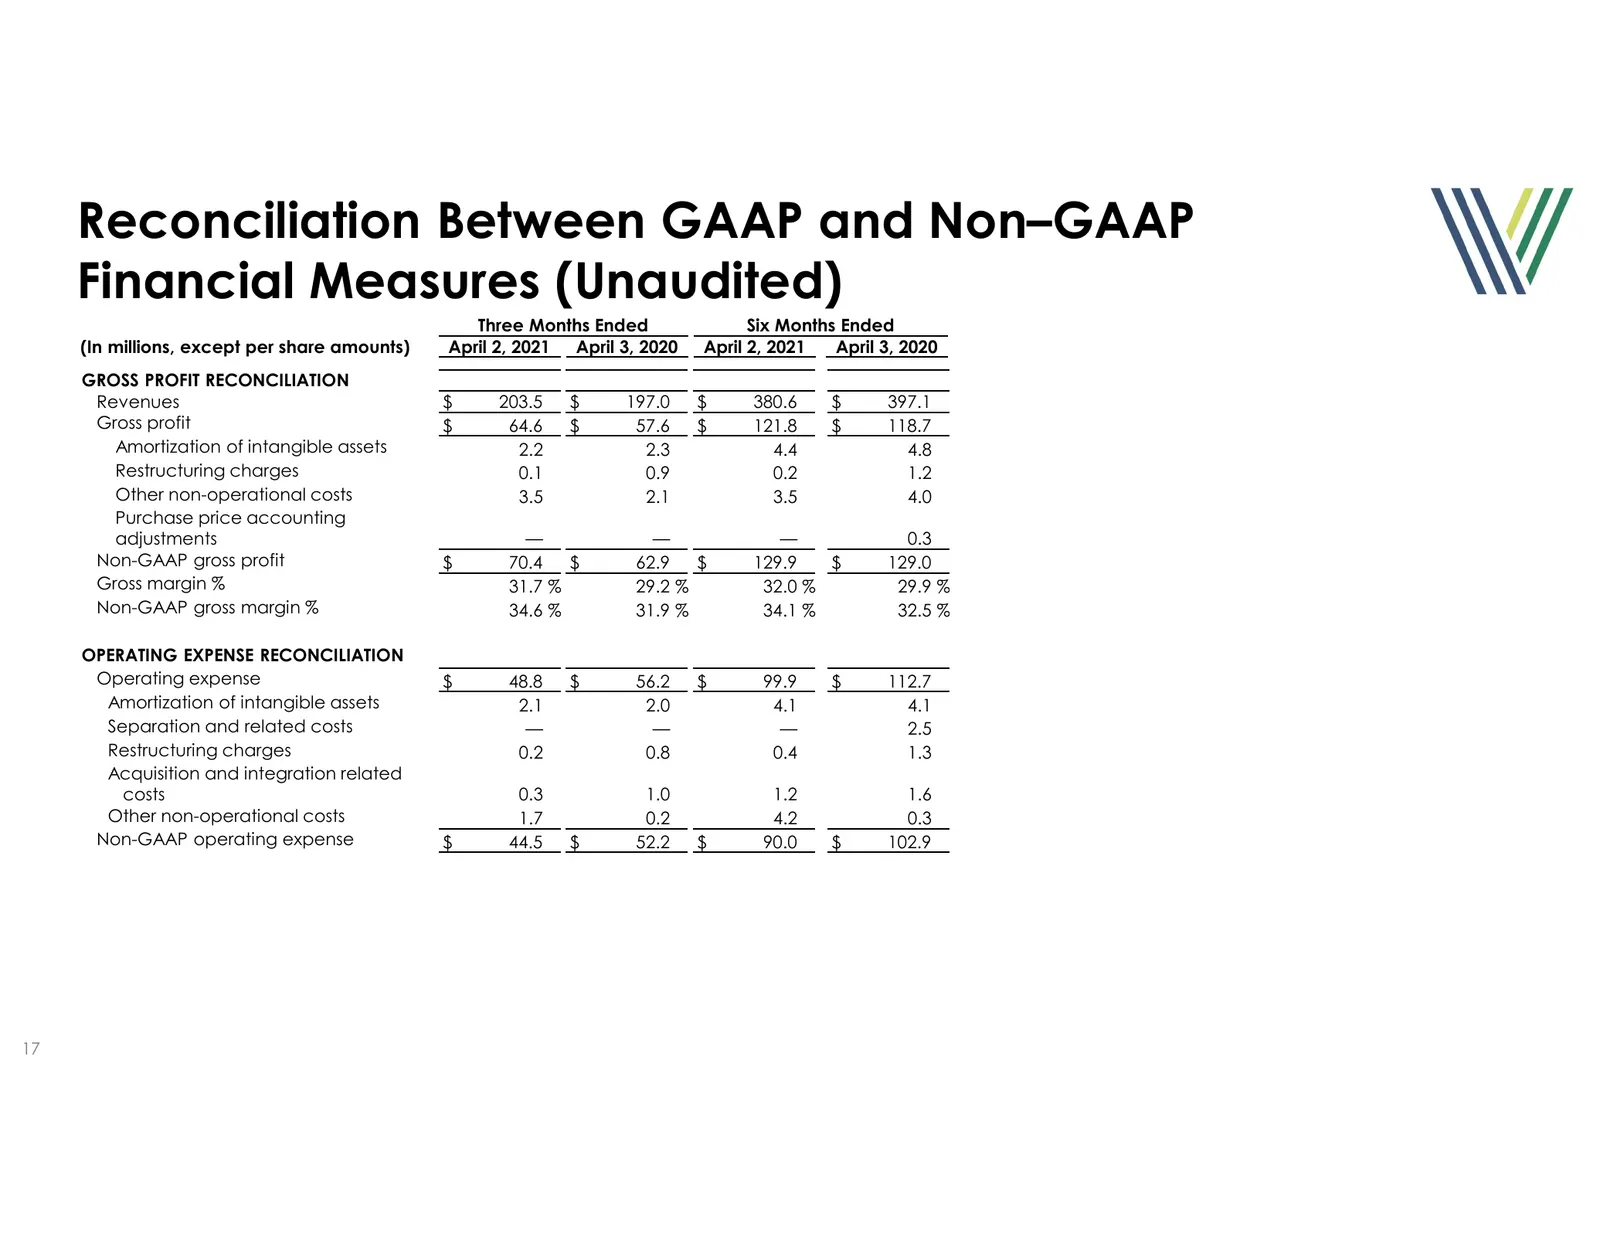
Slide 17: Reconciliation Between GAAP and Non-GAAP Financial Measures (Unaudited)
Reconciliation Between GAAP and Non–GAAP Financial Measures (Unaudited) Three Months Ended Six Months Ended (In millions, except per share amounts) April 2, 2021 April 3, 2020 April 2, 2021 April 3, 2020 GROSS PROFIT RECONCILIATION Revenues $ 203.5 $ 197.0 $ 380.6 $ 397.1 Gross profit $ 64.6 $ 57.6
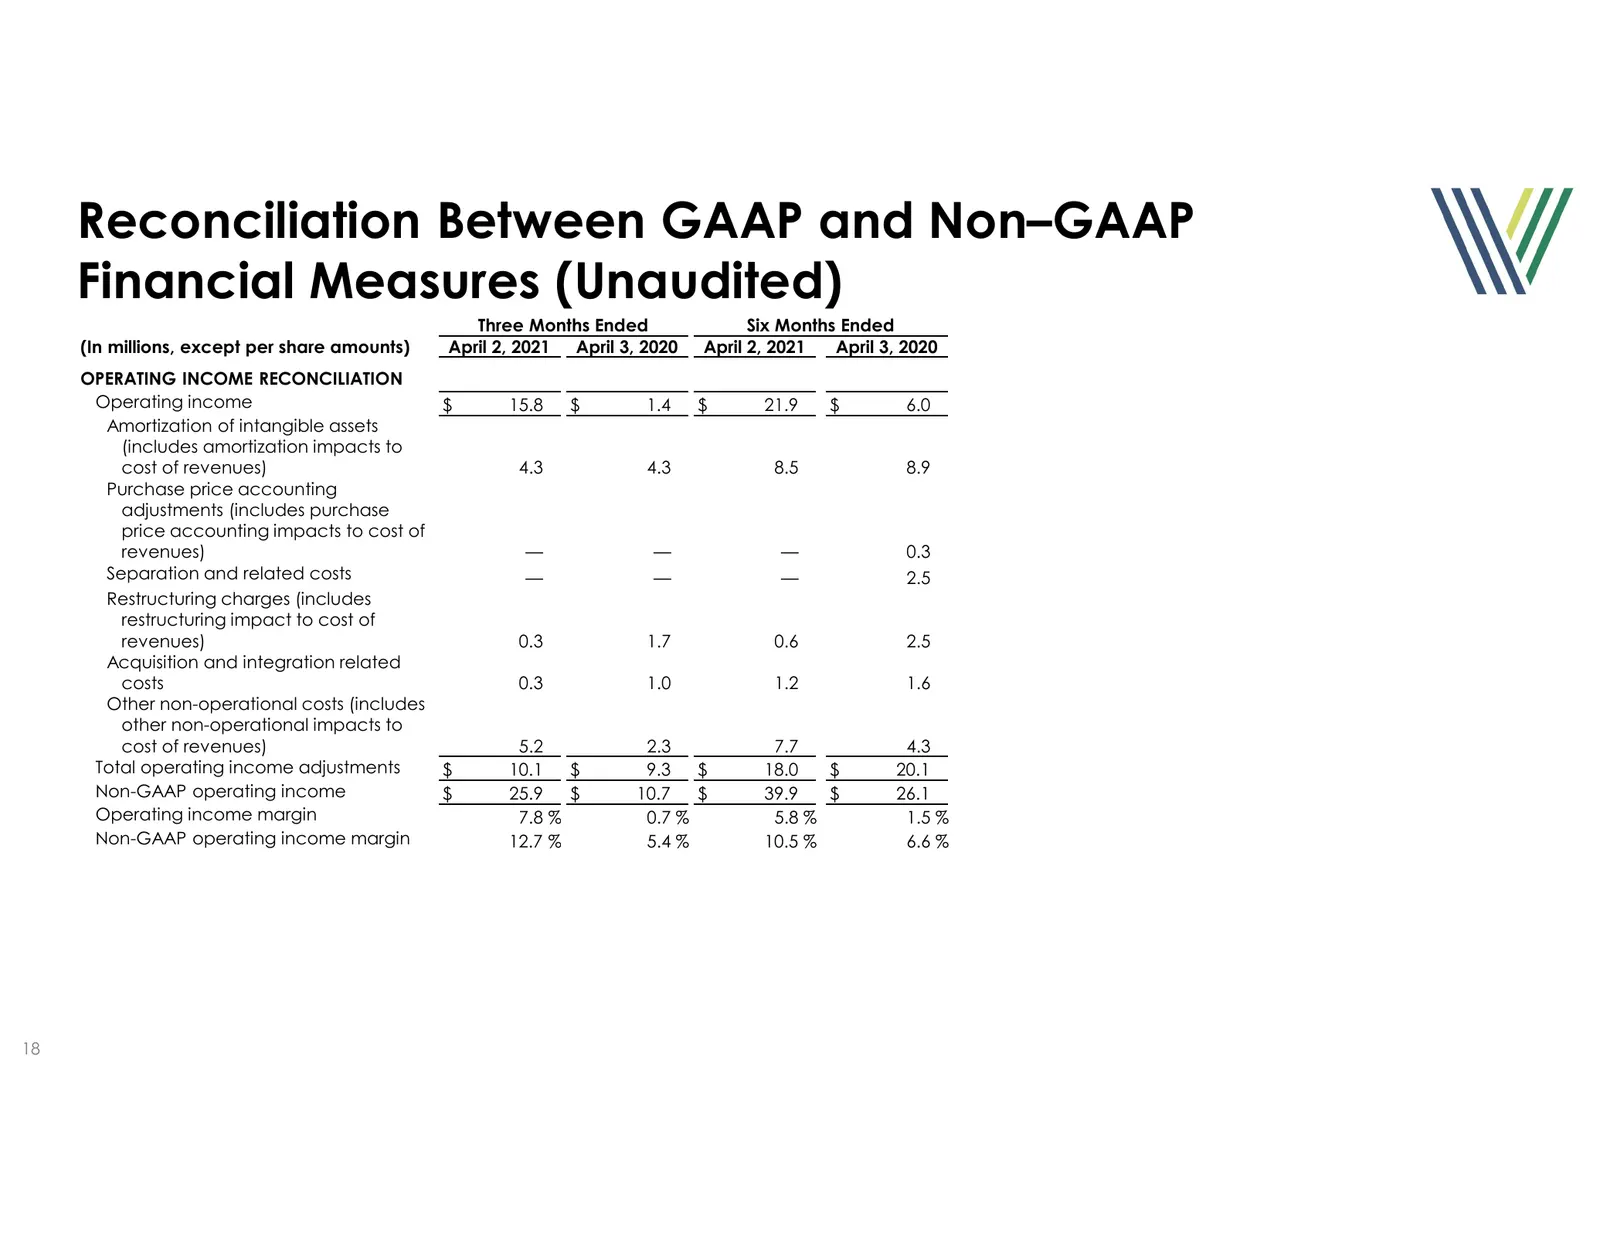
Slide 18: Reconciliation Between GAAP and Non-GAAP Financial Measures (Unaudited)
Reconciliation Between GAAP and Non–GAAP Financial Measures (Unaudited) Three Months Ended Six Months Ended (In millions, except per share amounts) April 2, 2021 April 3, 2020 April 2, 2021 April 3, 2020 OPERATING INCOME RECONCILIATION Operating income $ 15.8 $ 1.4 $ 21.9 $ 6.0 Amortization of intan
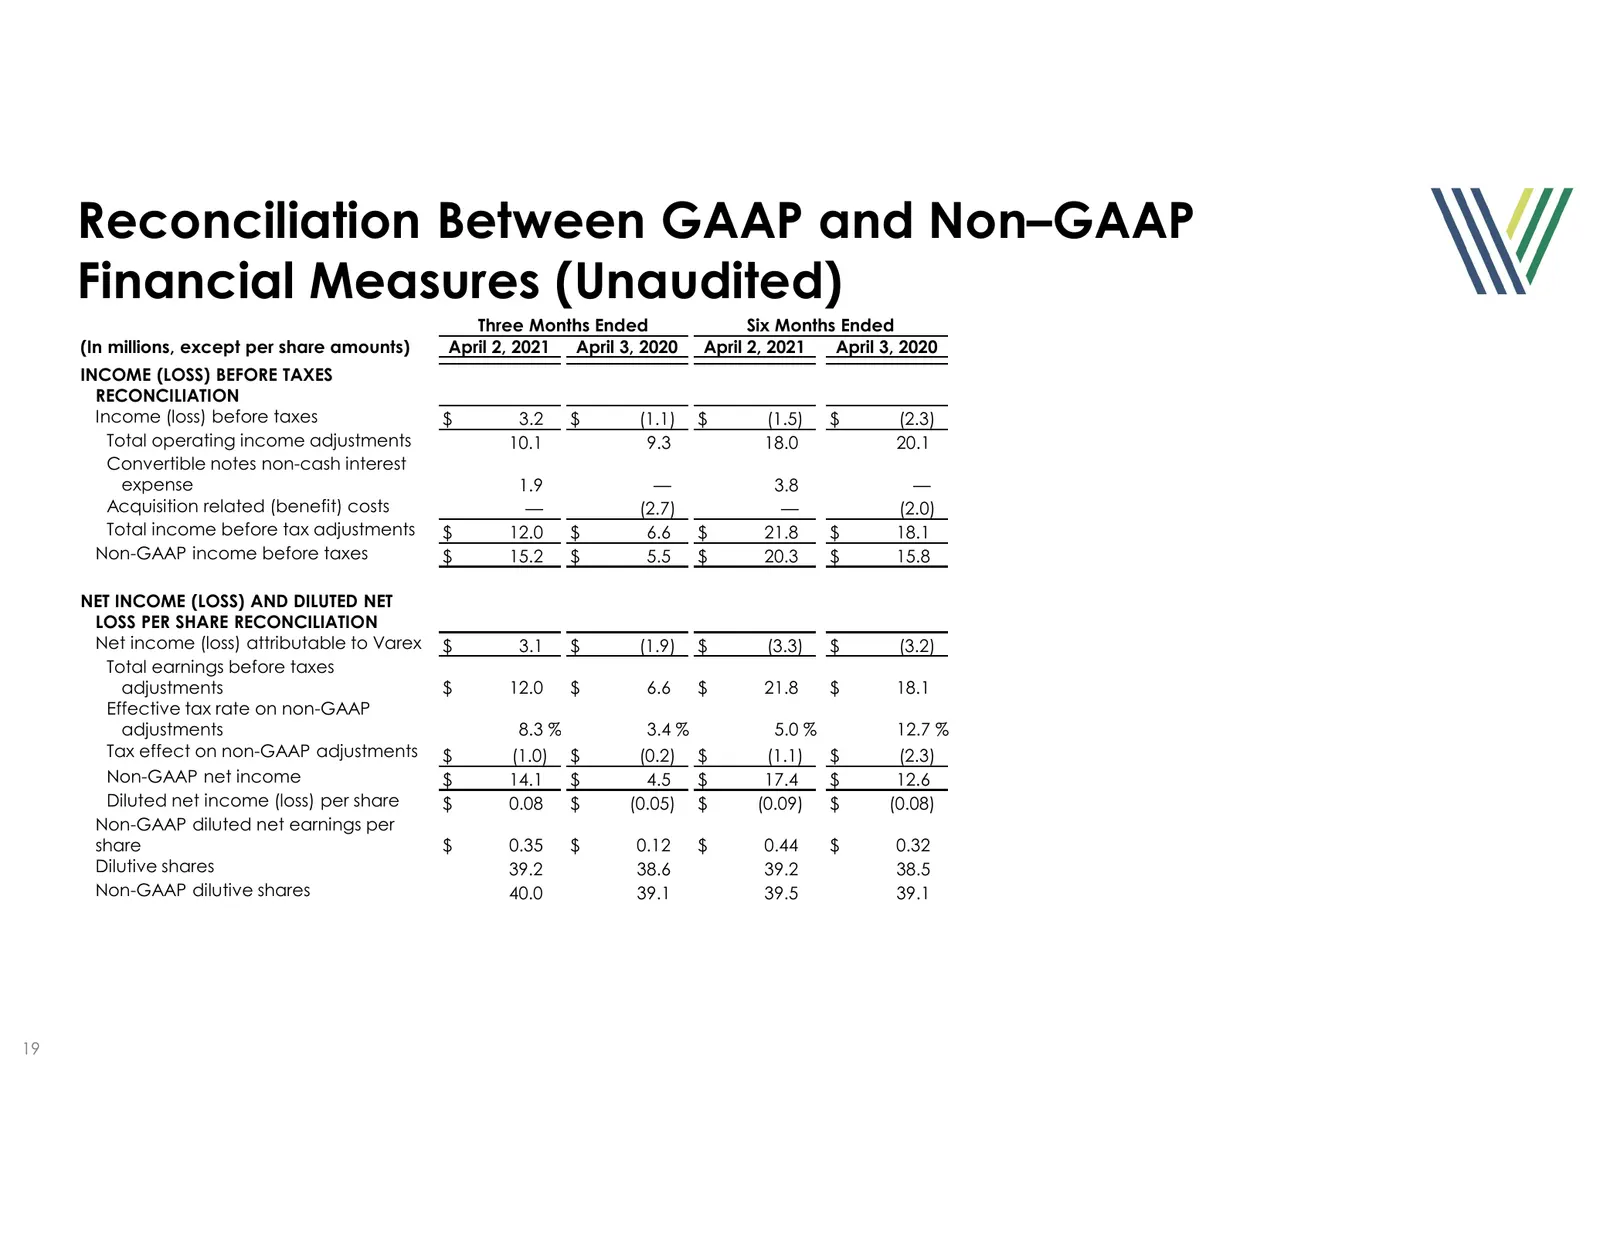
Slide 19: Reconciliation Between GAAP and Non-GAAP Financial Measures (Unaudited)
Reconciliation Between GAAP and Non–GAAP Financial Measures (Unaudited) Three Months Ended Six Months Ended (In millions, except per share amounts) April 2, 2021 April 3, 2020 April 2, 2021 April 3, 2020 INCOME (LOSS) BEFORE TAXES RECONCILIATION Income (loss) before taxes $ 3.2 $ (1.1) $ (1.5) $ (2.
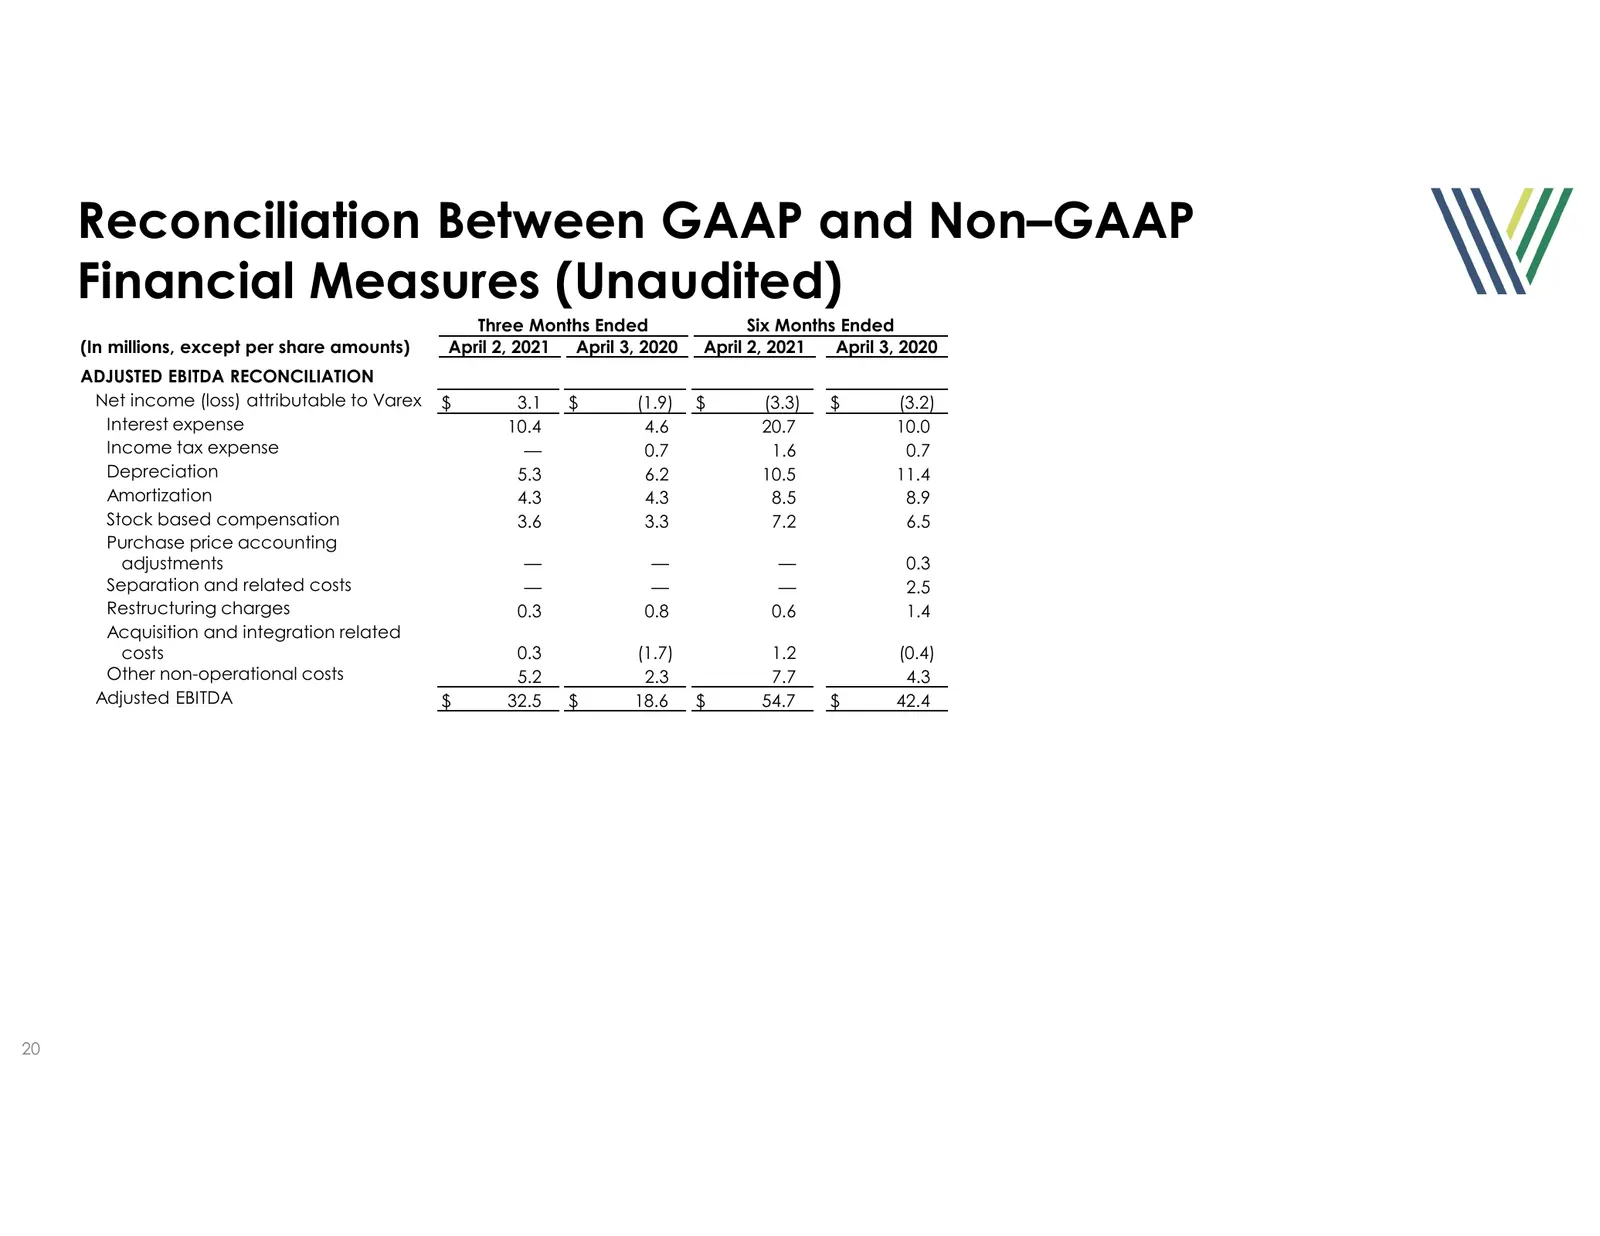
Slide 20: Reconciliation Between GAAP and Non-GAAP Financial Measures (Unaudited)
Reconciliation Between GAAP and Non–GAAP Financial Measures (Unaudited) Three Months Ended Six Months Ended (In millions, except per share amounts) April 2, 2021 April 3, 2020 April 2, 2021 April 3, 2020 ADJUSTED EBITDA RECONCILIATION Net income (loss) attributable to Varex $ 3.1 $ (1.9) $ (3.3) $ (
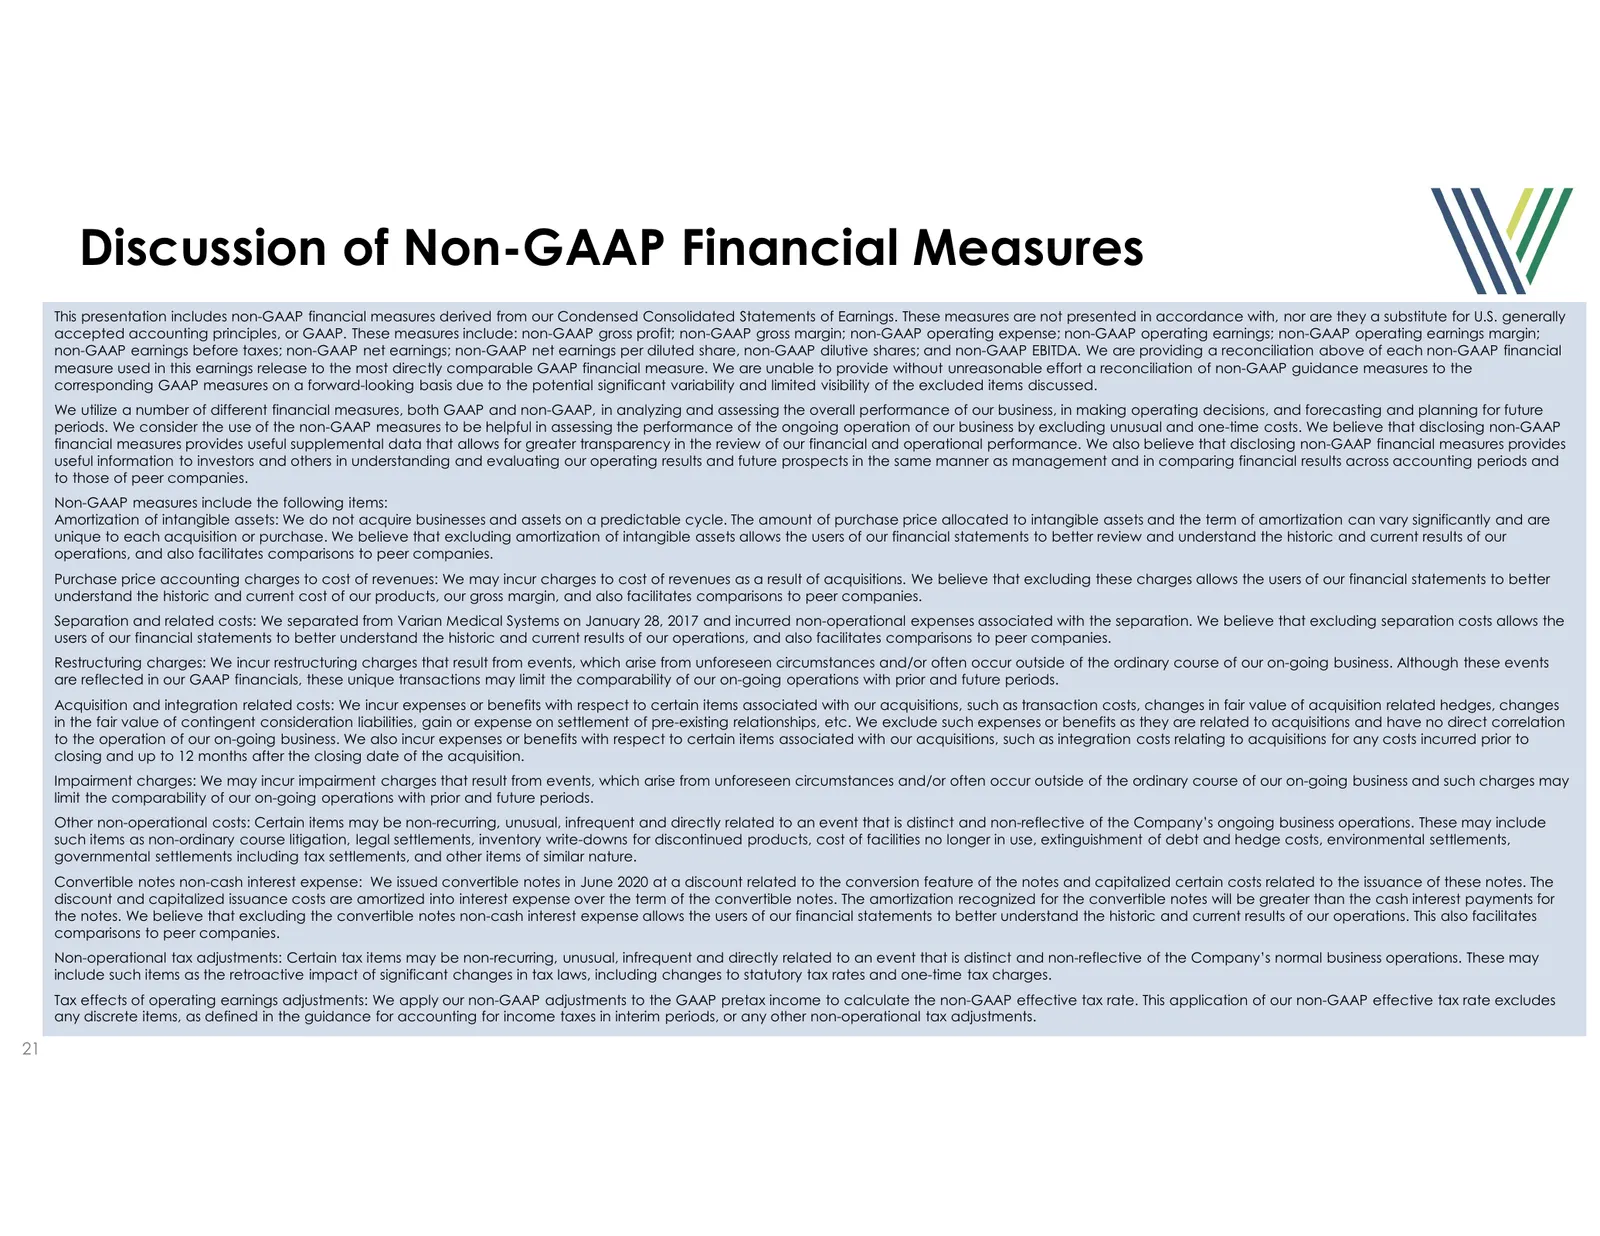
Slide 21: Discussion of Non-GAAP Financial Measures
Discussion of Non-GAAP Financial Measures This presentation includes non-GAAP financial measures derived from our Condensed Consolidated Statements of Earnings. These measures are not presented in accordance with, nor are they a substitute for U.S. generally accepted accounting principles, or GAAP.

Slide 22: Solutions in Sight™
\ if VAREX \ Solutions in Sight™
Source: Internet Archive copy of vareximaging.com
More decks from Varex Imaging Corporation
 Q2 2026 Earnings Presentation21 slides · May 7, 2026
 Q1 2026 Earnings Presentation22 slides · Feb 10, 2026
 Q4 2025 Earnings Presentation23 slides · Nov 18, 2025
 Q3 2025 Earnings Presentation21 slides · Aug 7, 2025
 Q2 2025 Earnings Presentation22 slides · May 8, 2025
 Investor Presentation (March 2025)23 slides · March 2025