SunTrust Banks — 2016 Goldman Sachs Financial Services Conference
24 slides from SunTrust Banks's conference presentation, Dec 6, 2016
Slide 1: 2016 Goldman Sachs Financial Services Conference
2016 Goldman Sachs Financial Services Conference William H. Rogers Jr., Chairman and Chief Executive Officer, SunTrust Banks, Inc. December 6, 2016
Slide 2: Forward-looking statements and non-GAAP notice
2 The following should be read in conjunction with the financial statements, notes and other information contained in the Company’s 2015 Annual Report on Form 10-K, Quarterly Reports on Form 10-Q, and Current Reports on Form 8-K. This presentation includes non-GAAP financial measures to describe Sun
Slide 3: Investment Thesis: Why invest in SunTrust?
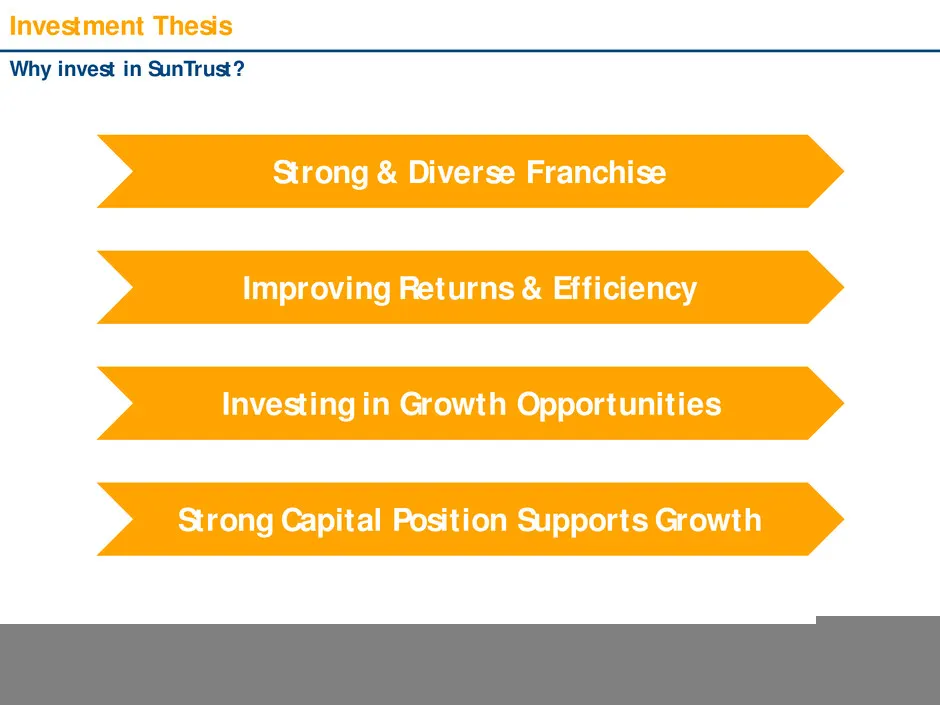
3 Investment Thesis Why invest in SunTrust? Investing in Growth Opportunities Strong & Diverse Franchise Improving Returns & Efficiency Strong Capital Position Supports Growth
Slide 4: SunTrust Overview
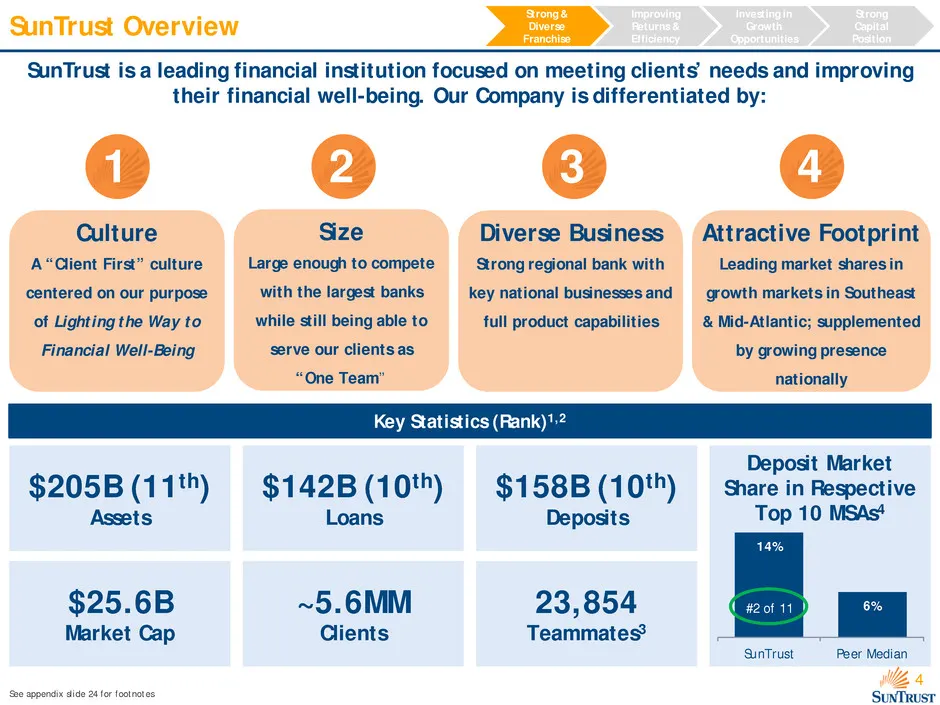
4 SunTrust Overview SunTrust is a leading financial institution focused on meeting clients’ needs and improving their financial well-being. Our Company is differentiated by: 1 Size Large enough to compete with the largest banks while still being able to serve our clients as “One Team” 2 Diverse Busi
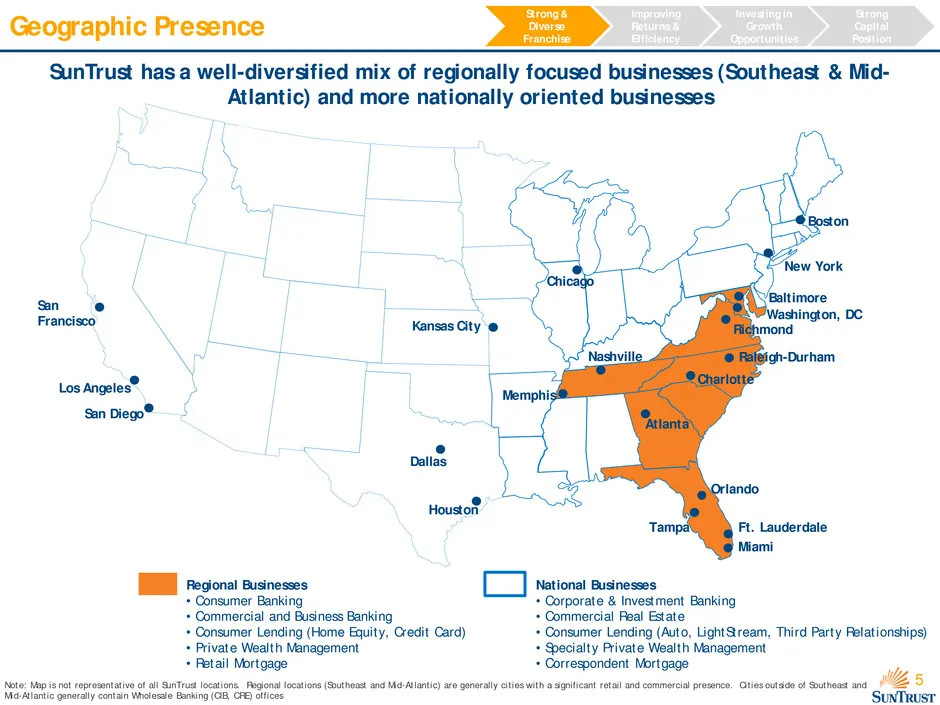
Slide 5: Geographic Presence
5 Geographic Presence Regional Businesses • Consumer Banking • Commercial and Business Banking • Consumer Lending (Home Equity, Credit Card) • Private Wealth Management • Retail Mortgage National Businesses • Corporate & Investment Banking • Commercial Real Estate • Consumer Lending (Auto, LightStre
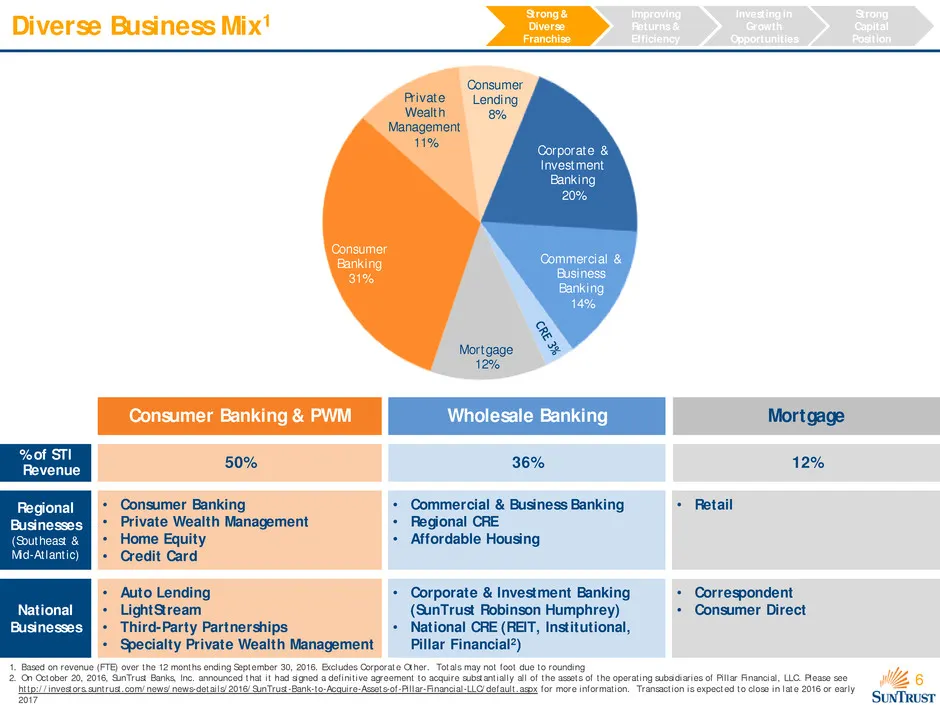
Slide 6: Diverse Business Mix
6 Corporate & Investment Banking 20% Commercial & Business Banking 14% Mortgage 12% Consumer Banking 31% Private Wealth Management 11% Consumer Lending 8% Diverse Business Mix1 Investing in Growth Opportunities Strong & Diverse Franchise Improving Returns & Efficiency Strong Capital Position Consume
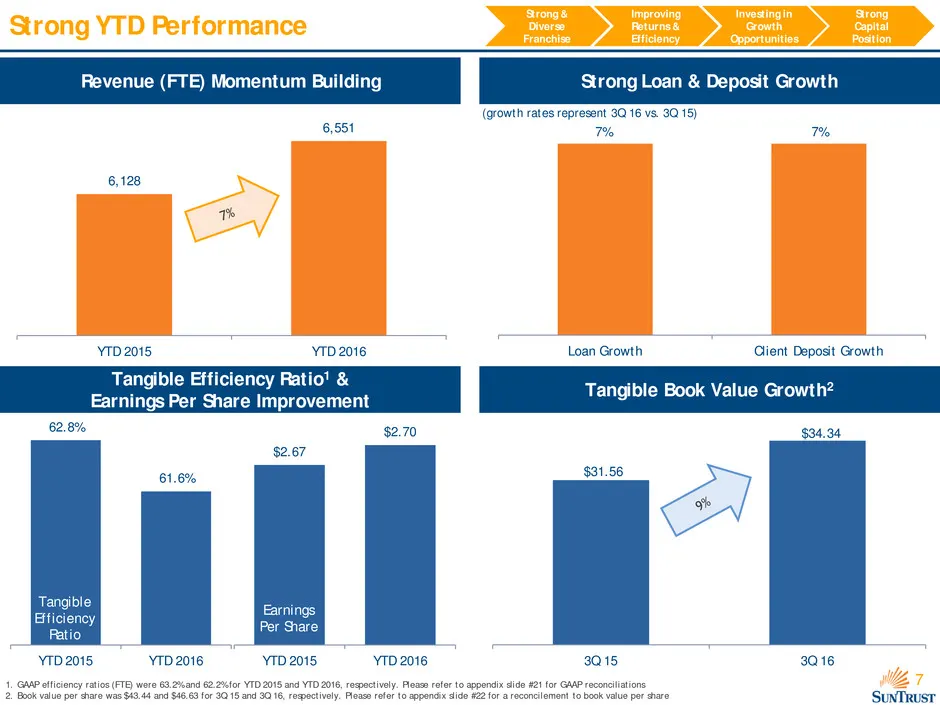
Slide 7: Strong YTD Performance
7 6,128 6,551 YTD 2015 YTD 2016 $31.56 $34.34 3Q 15 3Q 16 Strong YTD Performance Investing in Growth Opportunities Strong & Diverse Franchise Improving Returns & Efficiency Strong Capital Position 1. GAAP efficiency ratios (FTE) were 63.2% and 62.2% for YTD 2015 and YTD 2016, respectively. Please re
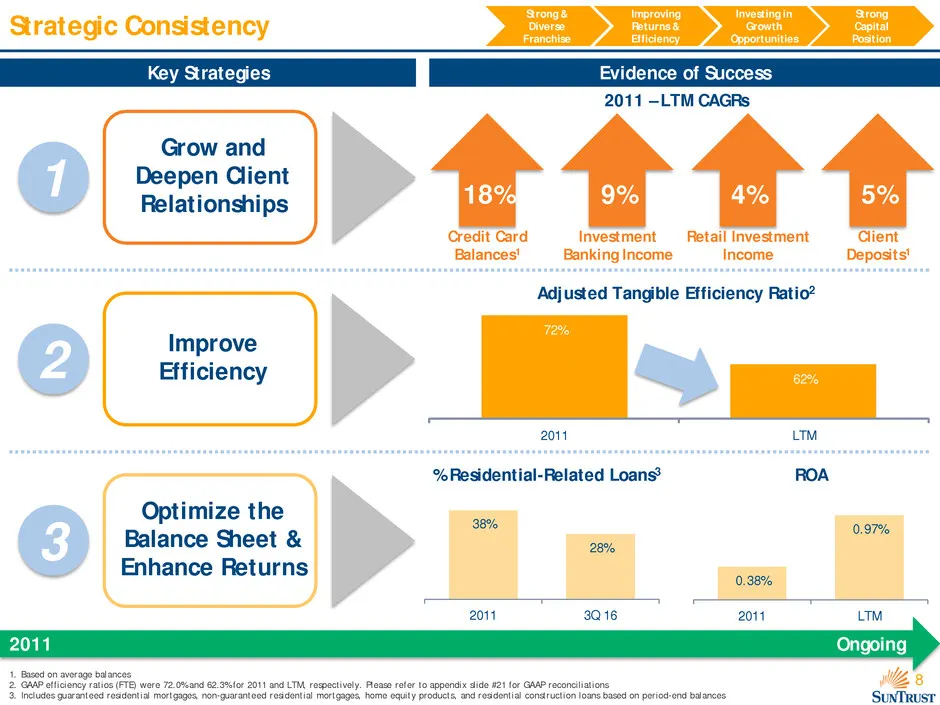
Slide 8: Strategic Consistency
8 Strategic Consistency Key Strategies Evidence of Success 2011 Ongoing Grow and Deepen Client Relationships 2011 – LTM CAGRs 9% Investment Banking Income 18% Credit Card Balances1 5% Client Deposits1 1 Adjusted Tangible Efficiency Ratio2 Improve Efficiency 2 Optimize the Balance Sheet & Enhance Ret
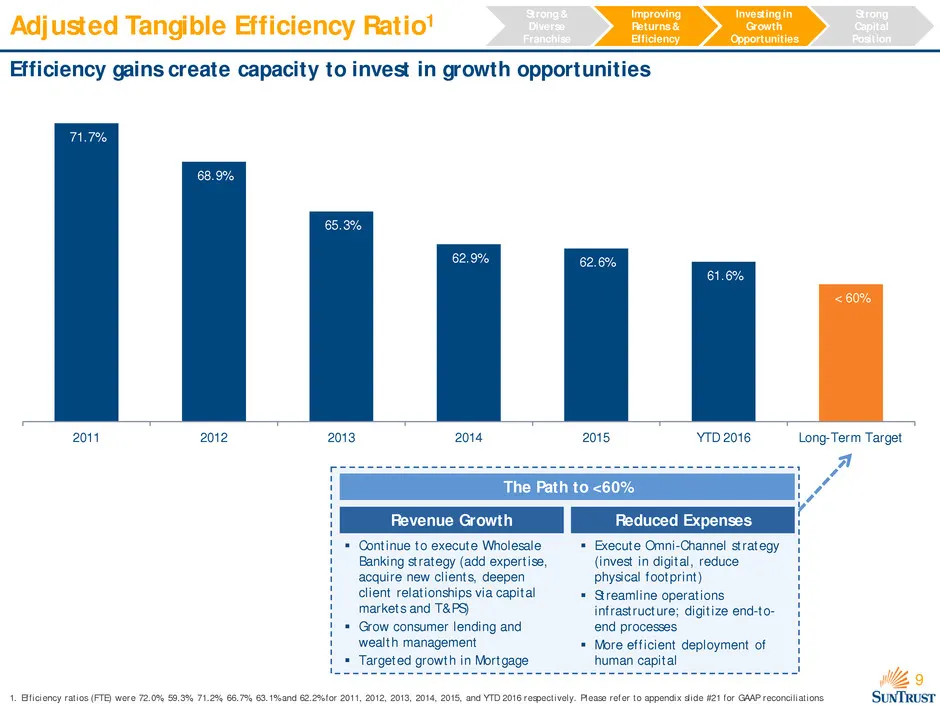
Slide 9: Adjusted Tangible Efficiency Ratio
9 Adjusted Tangible Efficiency Ratio1 Efficiency gains create capacity to invest in growth opportunities Investing in Growth Opportunities Strong & Diverse Franchise Improving Returns & Efficiency Strong Capital Position 1. Efficiency ratios (FTE) were 72.0%, 59.3%, 71.2%, 66.7%, 63.1% and 62.2% for
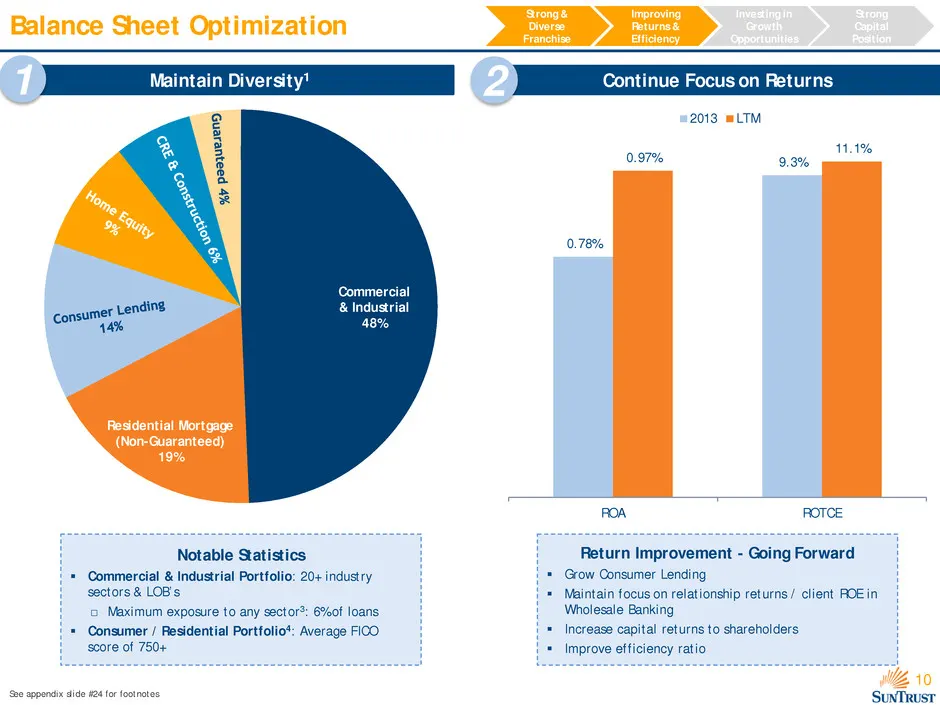
Slide 10: Balance Sheet Optimization
10 Balance Sheet Optimization Investing in Growth Opportunities Strong & Diverse Franchise Improving Returns & Efficiency Strong Capital Position Commercial & Industrial 49% Residential Mortgage (Non-Guaranteed) 18% Maintain Diversity1 1 Continue Focus on Returns 2 2 8 Residential Mortgage (Non-Guar
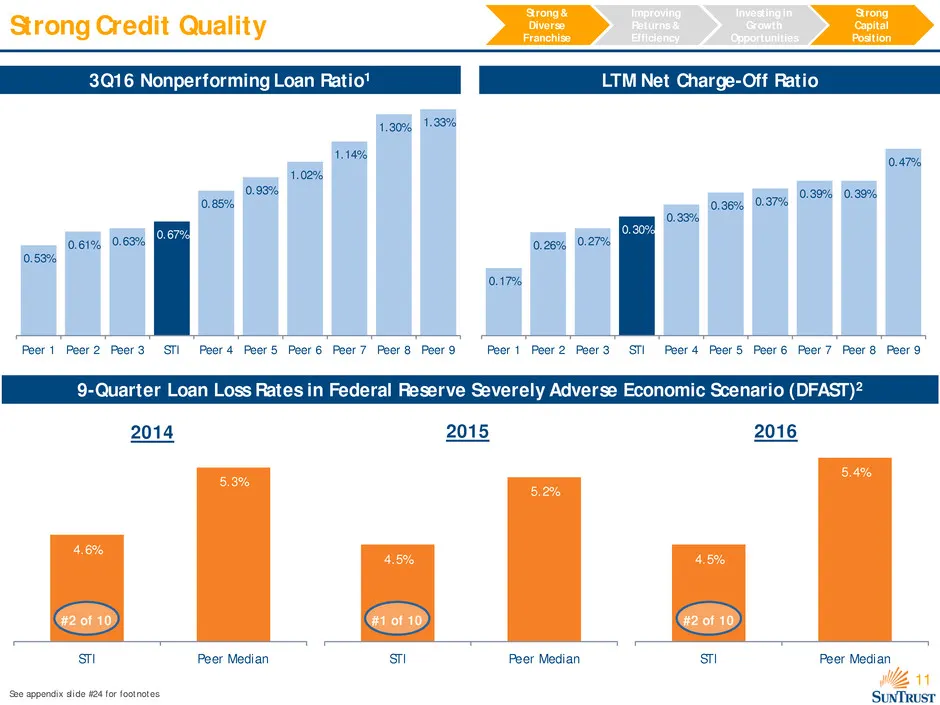
Slide 11: Strong Credit Quality
11 4.6% 5.3% STI Peer Median 4.5% 5.2% STI Peer Median 4.5% 5.4% STI Peer Median #2 of 10 Strong Credit Quality 3Q16 Nonperforming Loan Ratio1 LTM Net Charge-Off Ratio Investing in Growth Opportunities Strong & Diverse Franchise Improving Returns & Efficiency Strong Capital Position See appendix sli
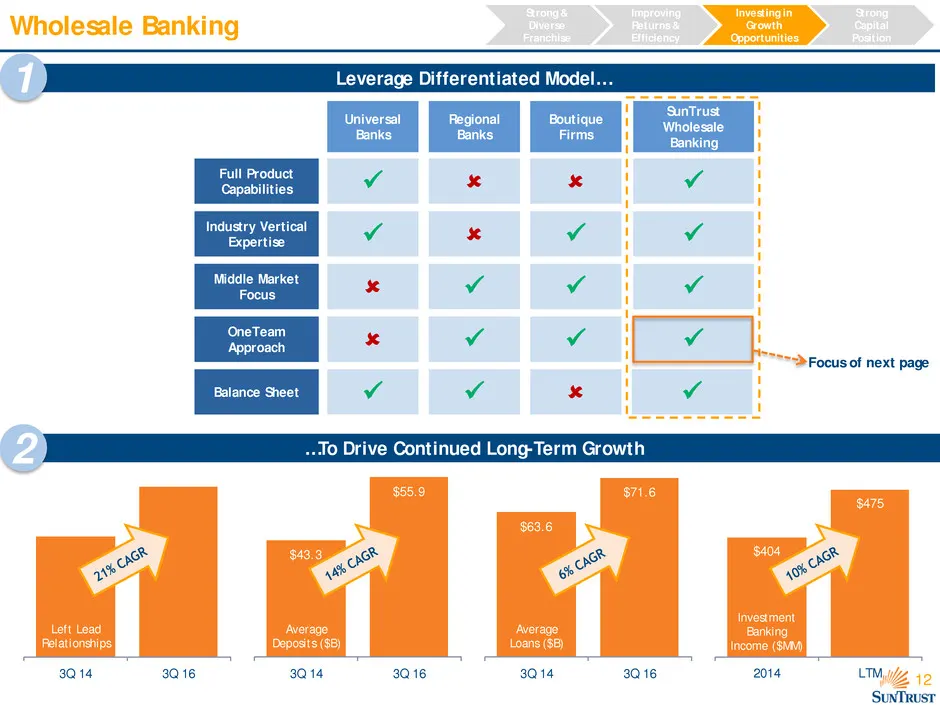
Slide 12: Wholesale Banking
12 $43.3 $55.9 3Q 14 3Q 16 $63.6 $71.6 3Q 14 3Q 16 $404 $475 2014 LTM3Q 14 3Q 16 Wholesale Banking Investing in Growth Opportunities Strong & Diverse Franchise Improving Returns & Efficiency Strong Capital Position …To Drive Continued Long-Term Growth Left Lead Relationships Average Loans ($B) Avera
Slide 13: Wholesale Banking: Broad Industry Expertise
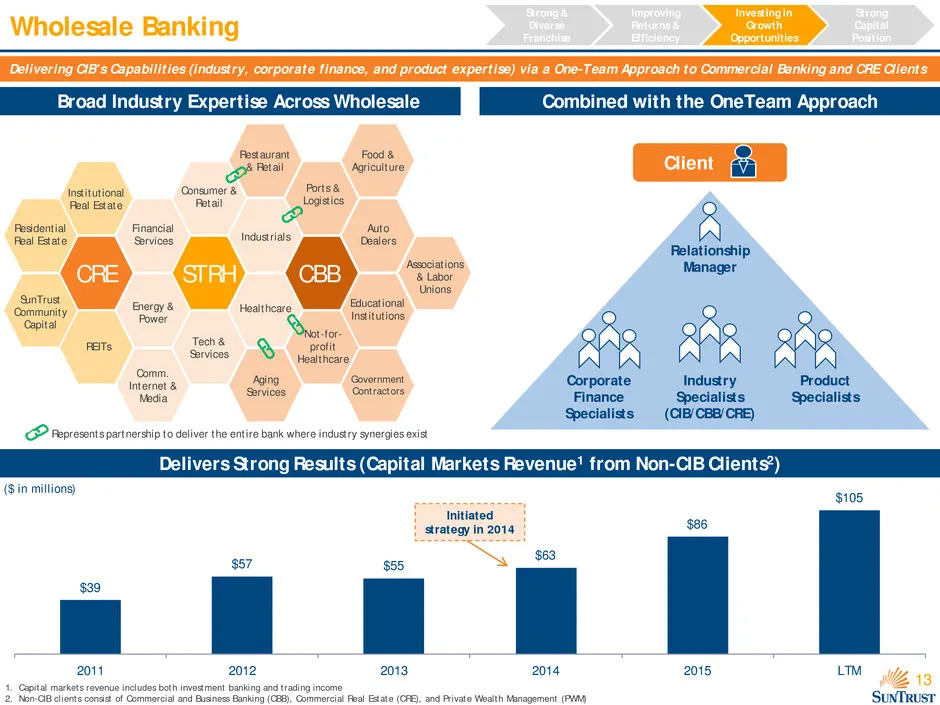
13 Wholesale Banking Broad Industry Expertise Across Wholesale Combined with the OneTeam Approach Delivers Strong Results (Capital Markets Revenue1 from Non-CIB Clients2) CRE STRH CBB Residential Real Estate Institutional Real Estate SunTrust Community Capital Financial Services Energy & Power REITs
Slide 14: Consumer Banking: More Efficient Branch Network
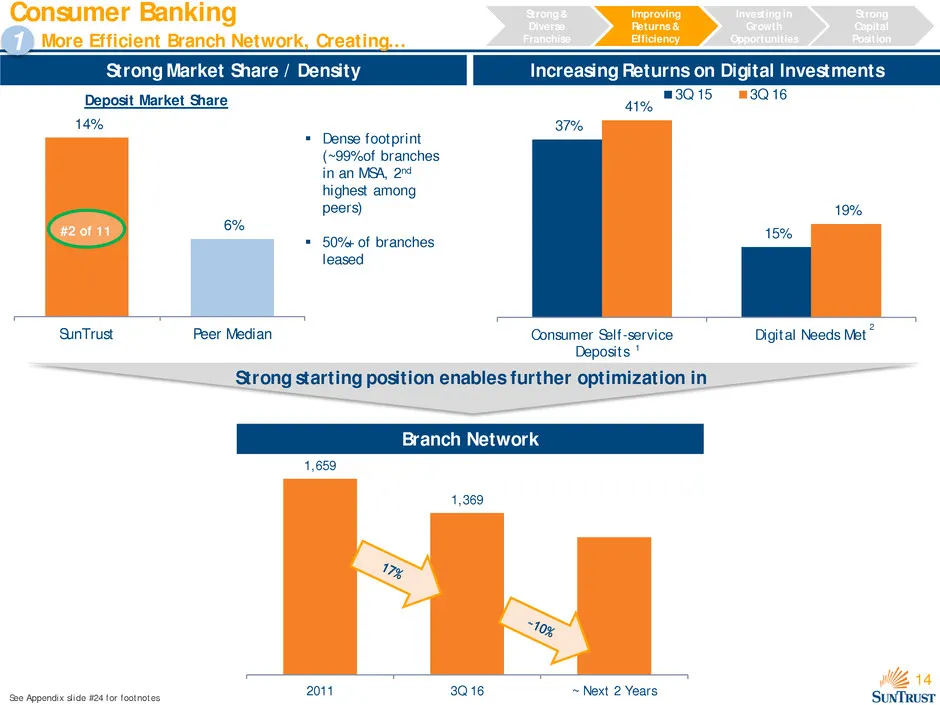
14 14% 6% SunTrust Peer Median Consumer Banking More Efficient Branch Network, Creating… Investing in Growth Opportunities Strong & Diverse Franchise Improving Returns & Efficiency Strong Capital Position See Appendix slide #24 for footnotes Increasing Returns on Digital Investments 1,659 1,369 2011
Slide 15: Consumer Banking: Further Capacity to Invest
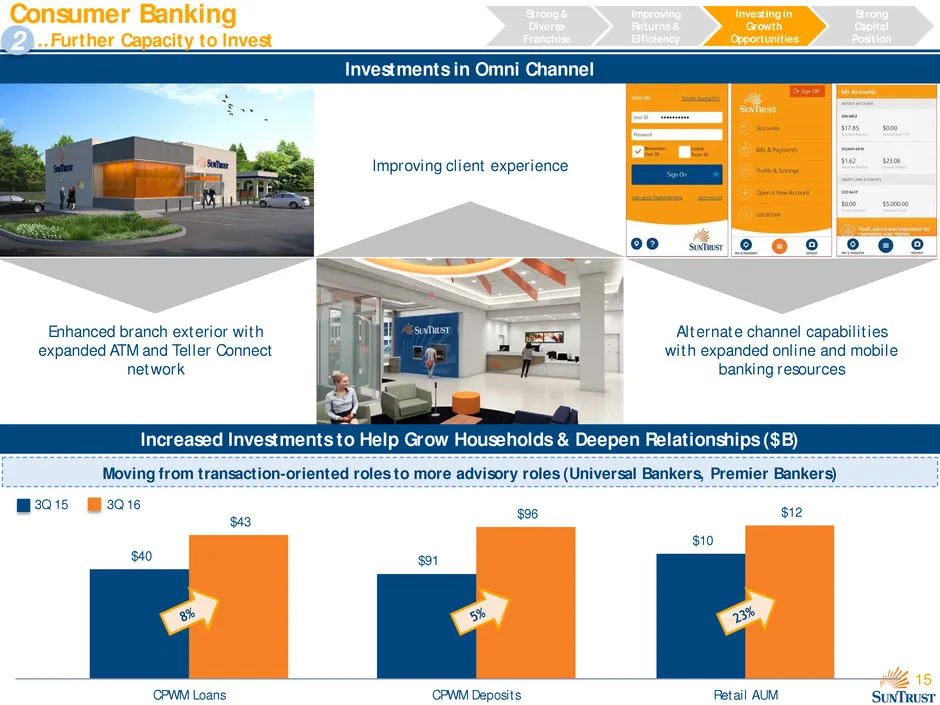
15 Consumer Banking …Further Capacity to Invest Investing in Growth Opportunities Strong & Diverse Franchise Improving Returns & Efficiency Strong Capital Position Investments in Omni Channel 2 Increased Investments to Help Grow Households & Deepen Relationships ($B) 3Q 15 3Q 16 Moving from transact
Slide 16: LightStream Spotlight
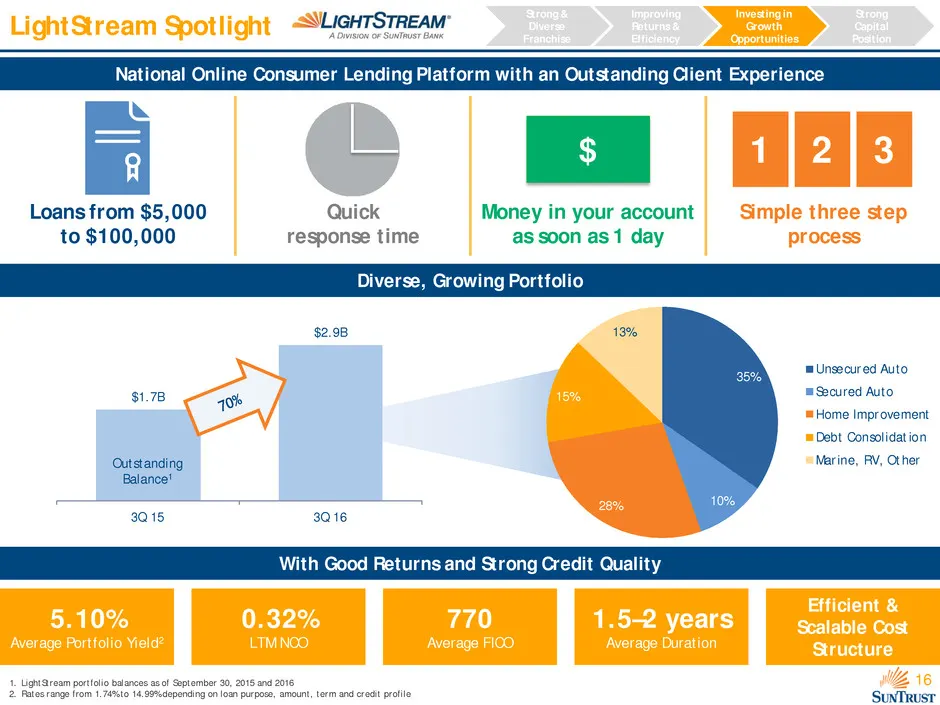
16 LightStream Spotlight Investing in Growth Opportunities Strong & Diverse Franchise Improving Returns & Efficiency Strong Capital Position 1. LightStream portfolio balances as of September 30, 2015 and 2016 2. Rates range from 1.74% to 14.99% depending on loan purpose, amount, term and credit prof
Slide 17: Mortgage Banking
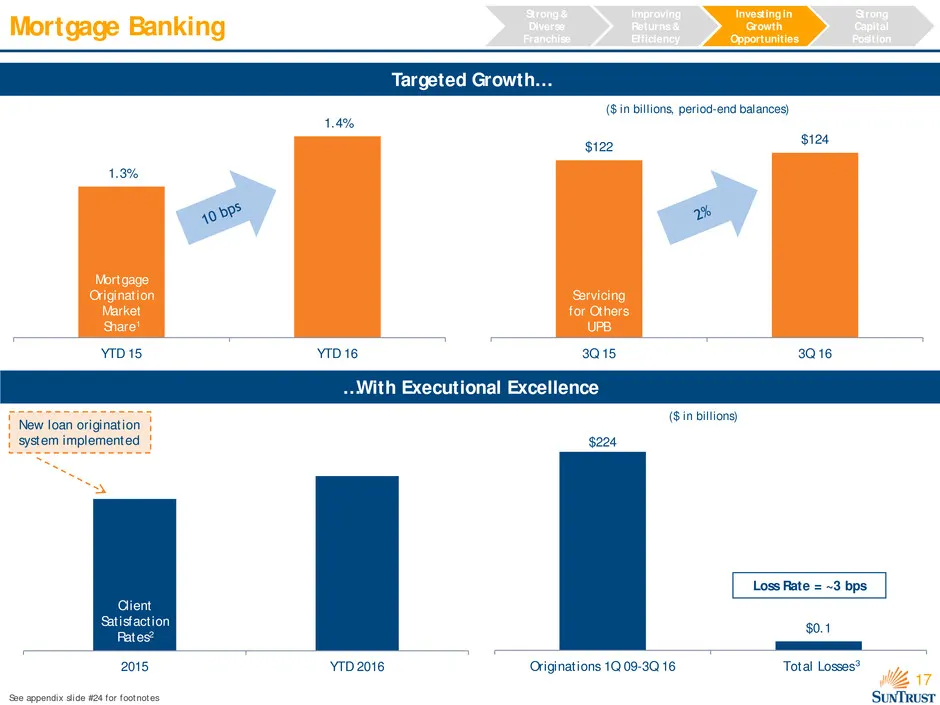
17 1.3% 1.4% YTD 15 YTD 16 2015 YTD 2016 $122 $124 3Q 15 3Q 16 Mortgage Banking Investing in Growth Opportunities Strong & Diverse Franchise Improving Returns & Efficiency Strong Capital Position ($ in billions) Loss Rate = ~3 bps 3 …With Executional Excellence Client Satisfaction Rates2 Servicing f
Slide 18: Strong Capital Position Supports Growth
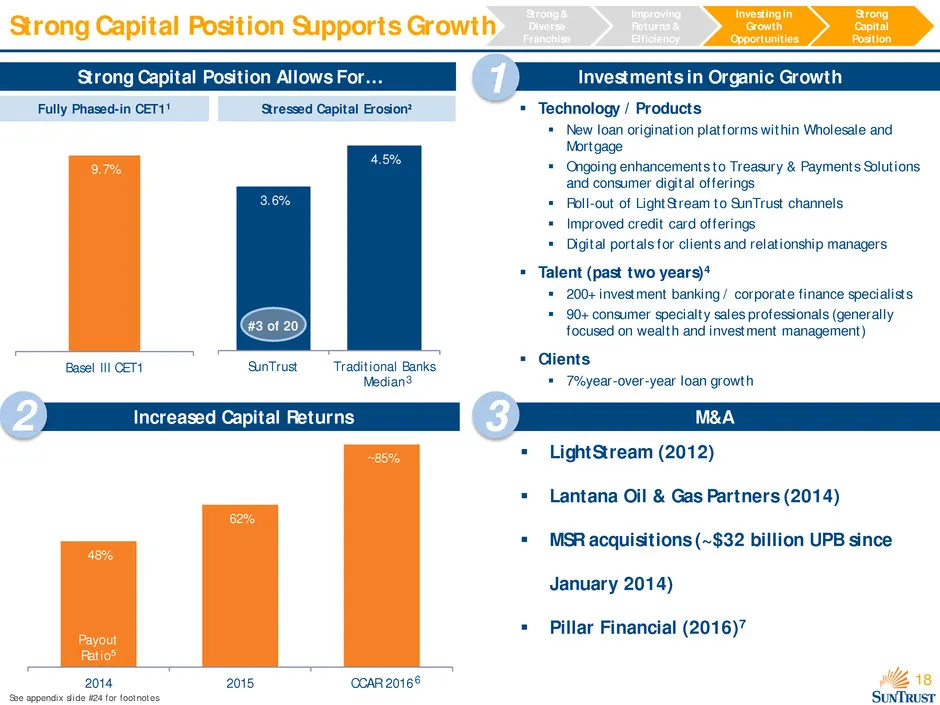
18 3.6% 4.5% SunTrust Traditional Banks Median 48% 62% ~85% 2014 2015 CCAR 2016 Strong Capital Position Supports Growth LightStream (2012) Lantana Oil & Gas Partners (2014) MSR acquisitions (~$32 billion UPB since January 2014) Pillar Financial (2016)7 Increased Capital Returns M&A Investmen
Slide 19: Why Invest in SunTrust?
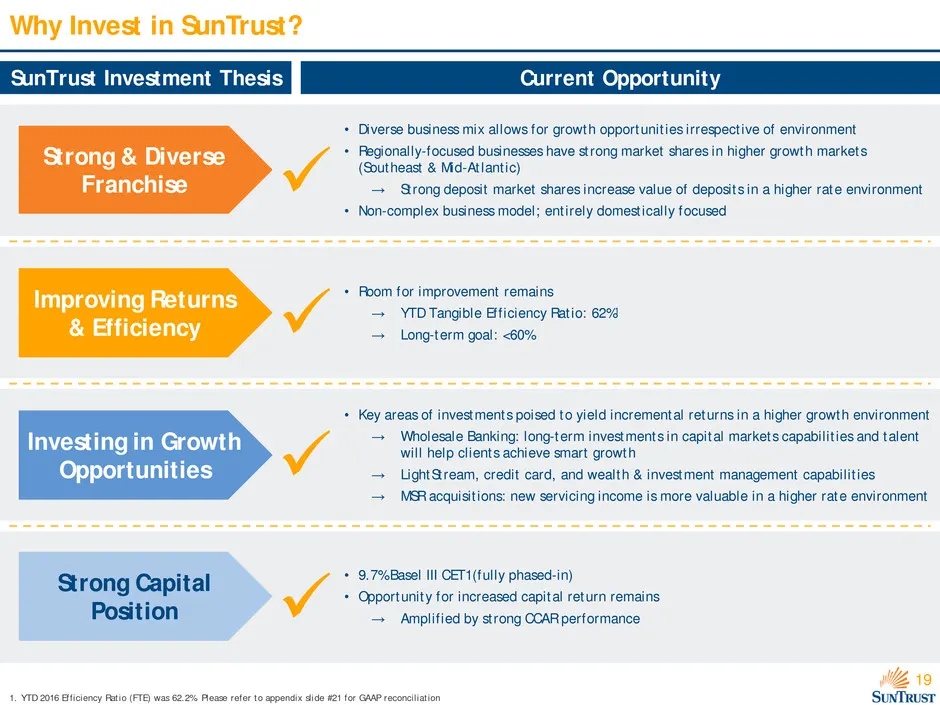
19 Why Invest in SunTrust? Current Opportunity SunTrust Investment Thesis Strong & Diverse Franchise • Diverse business mix allows for growth opportunities irrespective of environment • Regionally-focused businesses have strong market shares in higher growth markets (Southeast & Mid-Atlantic) → St

Slide 20: Appendix
Appendix
Slide 21: Reconciliation of Adjusted Tangible Efficiency Ratio
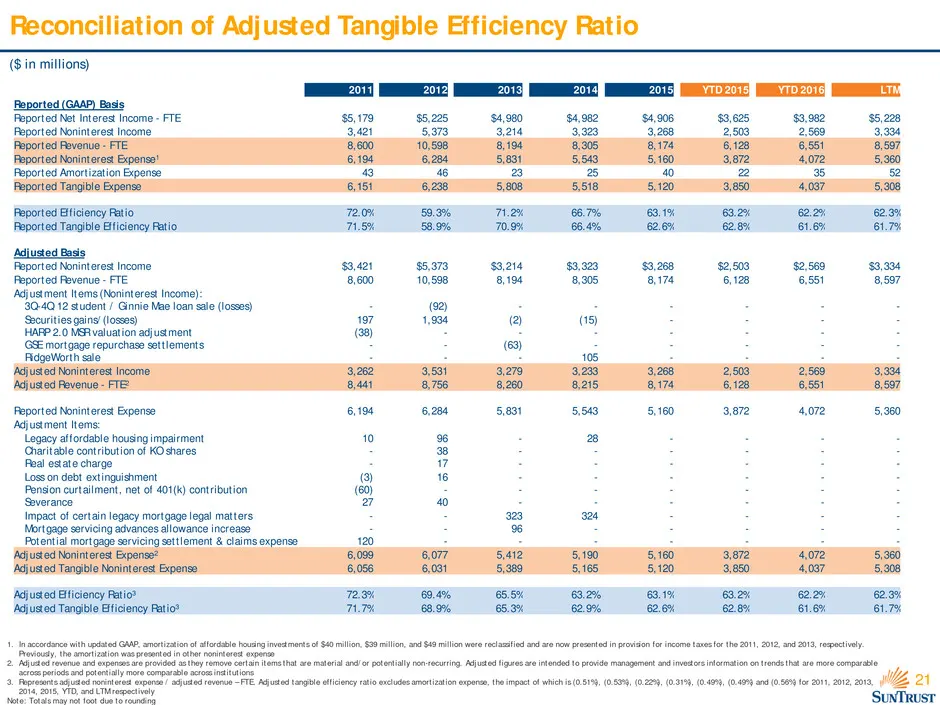
21 Reconciliation of Adjusted Tangible Efficiency Ratio ($ in millions) 1. In accordance with updated GAAP, amortization of affordable housing investments of $40 million, $39 million, and $49 million were reclassified and are now presented in provision for income taxes for the 2011, 2012, and 2013,
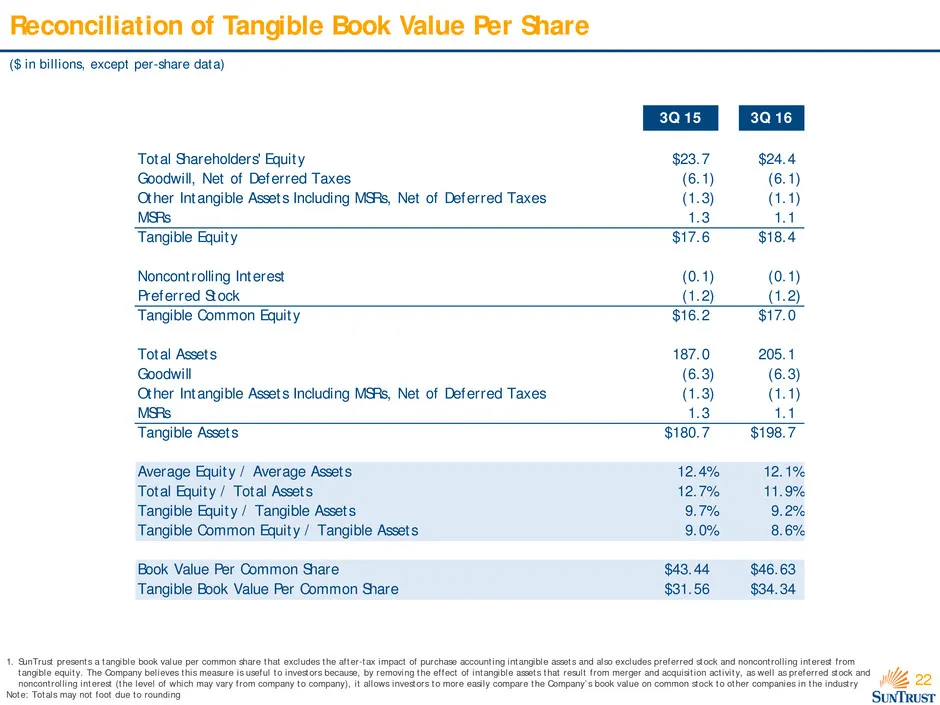
Slide 22: Reconciliation of Tangible Book Value Per Share
22 Reconciliation of Tangible Book Value Per Share ($ in billions, except per-share data) 1. SunTrust presents a tangible book value per common share that excludes the after-tax impact of purchase accounting intangible assets and also excludes preferred stock and noncontrolling interest from tangibl
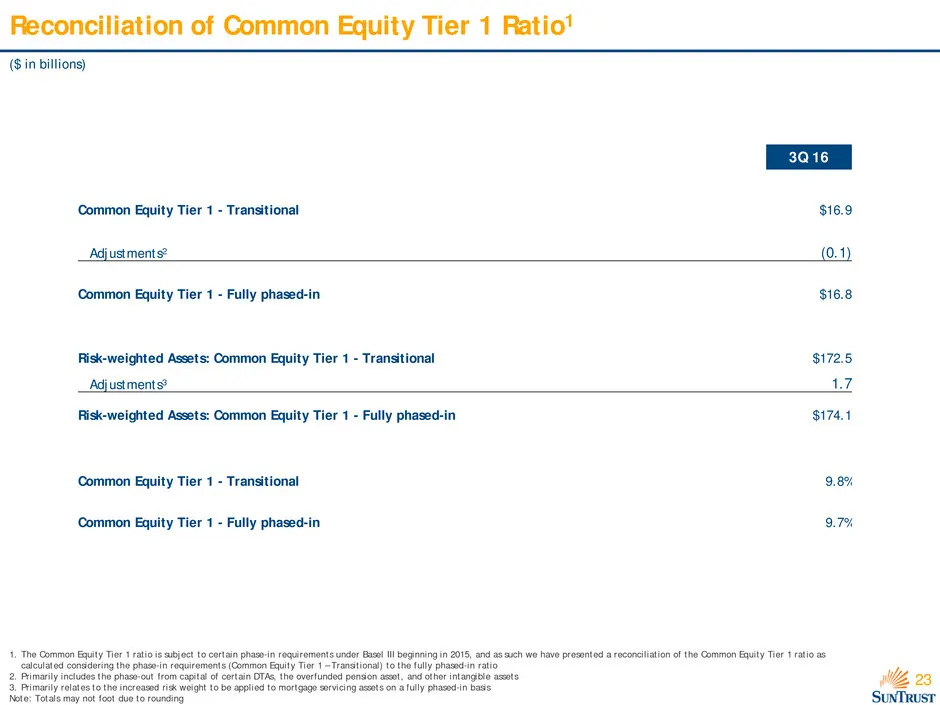
Slide 23: Reconciliation of Common Equity Tier 1 Ratio
23 Reconciliation of Common Equity Tier 1 Ratio1 ($ in billions) 1. The Common Equity Tier 1 ratio is subject to certain phase-in requirements under Basel III beginning in 2015, and as such we have presented a reconciliation of the Common Equity Tier 1 ratio as calculated considering the phase-in re
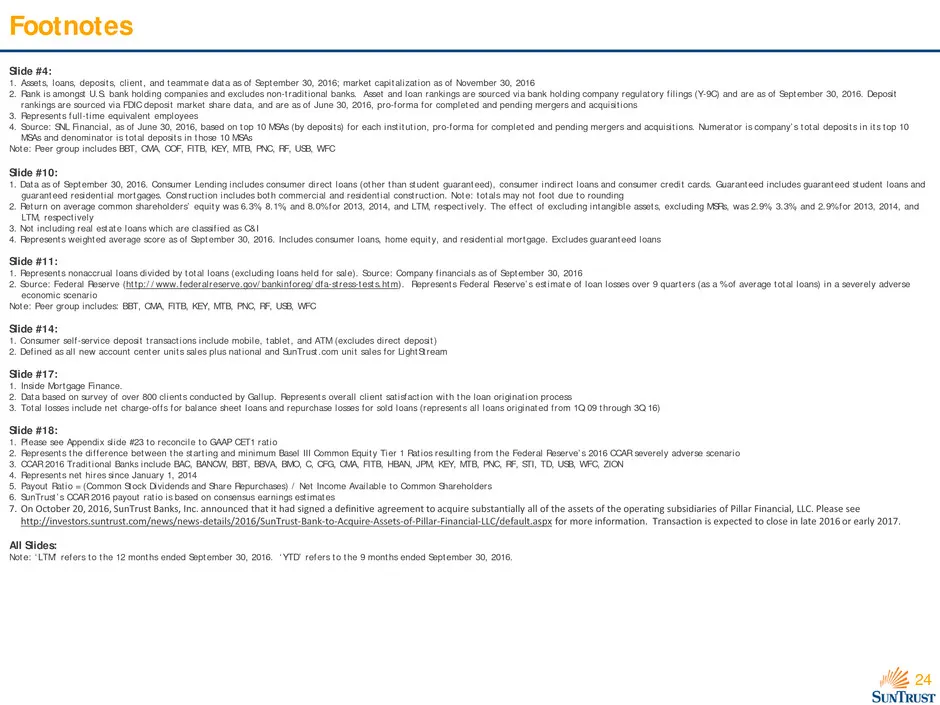
Slide 24: Footnotes
24 Footnotes Slide #4: 1. Assets, loans, deposits, client, and teammate data as of September 30, 2016; market capitalization as of November 30, 2016 2. Rank is amongst U.S. bank holding companies and excludes non-traditional banks. Asset and loan rankings are sourced via bank holding company regulat
Source: SEC EDGAR · 8-K filed Dec 6, 2016
More decks from SunTrust Banks Inc
 Q3 2019 Earnings Presentation21 slides · Oct 17, 2019
 Q2 2019 Earnings Presentation22 slides · Jul 18, 2019
 Q1 2019 Earnings Presentation22 slides · Apr 18, 2019
 Merger or Acquisition (February 2019)38 slides · Feb 7, 2019
 Q4 2018 Earnings Presentation23 slides · Jan 18, 2019
 2018 Goldman Sachs US Financial Services Conference30 slides · Dec 4, 2018