PowerSecure International — 26th Annual ROTH Conference 2014
30 slides from PowerSecure International's conference presentation, Mar 11, 2014
Slide 1: 26th Annual ROTH Conference
26 th Annual ROTH Conference March 11, 2014 Sidney Hinton, Chief Executive Officer Exhibit 99.2

Slide 2: Forward Looking Statements
Forward Looking Statements Safe Harbor All forward-looking statements made in this presentation are made under the safe harbor provisions of the Private Securities Litigation Reform Act of 1995. Forward-looking statements, which are all statements other than statements of historical facts and includ

Slide 3: PowerSecure: Who We Are Today
NYSE: POWR Backlog: $248M (36% YoY Growth) >750 Employees Growing Operating Margins, E.P.S., Adjusted EBITDA Strong Balance Sheet TTM Revenues: $270M (67% YoY Growth) Headquarters: Wake Forest, NC PowerSecure: Who We Are Today
Slide 4: PowerSecure: Utility Focused
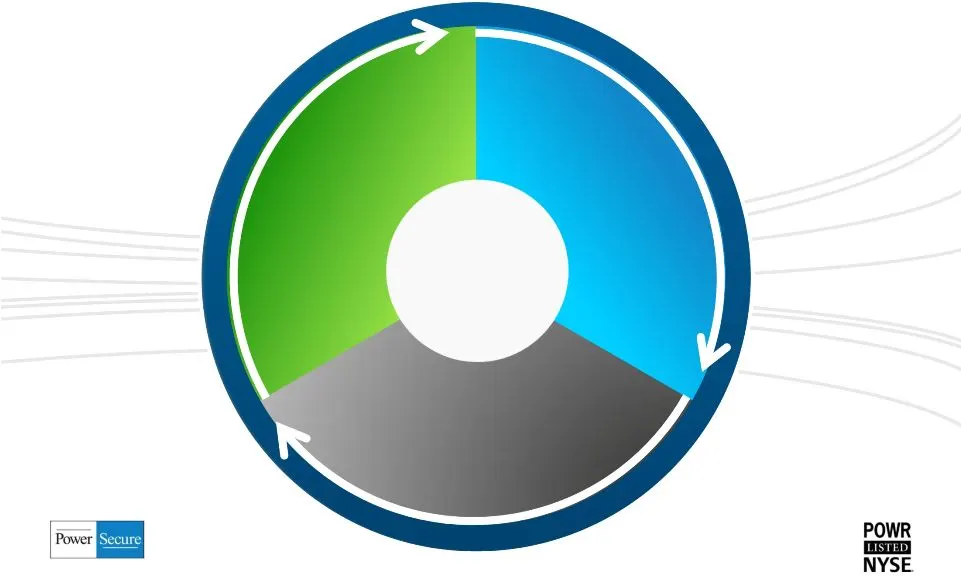
Energy Efficiency Products/Services Utility Infrastructure Solutions Distributed Generation Systems PowerSecure: Utility Focused Utilities and Their Large Customers

Slide 5: POWR NYSE
POWR puisteD] NYSE

Slide 6: 4Q 2013 Results
Revenue Distributed Generation Utility Infrastructure Energy Efficiency Total Revenue GAAP Gross Profit GAAP Gross Profit % Revenue non-GAAP Gross Profit non - GAAP Gross Profit % Revenue GAAP Operating Income GAAP Operating Profit % Revenue non-GAAP Operating Income non-GAAP Operating Profit % Reve
Slide 7: 2011 Progression
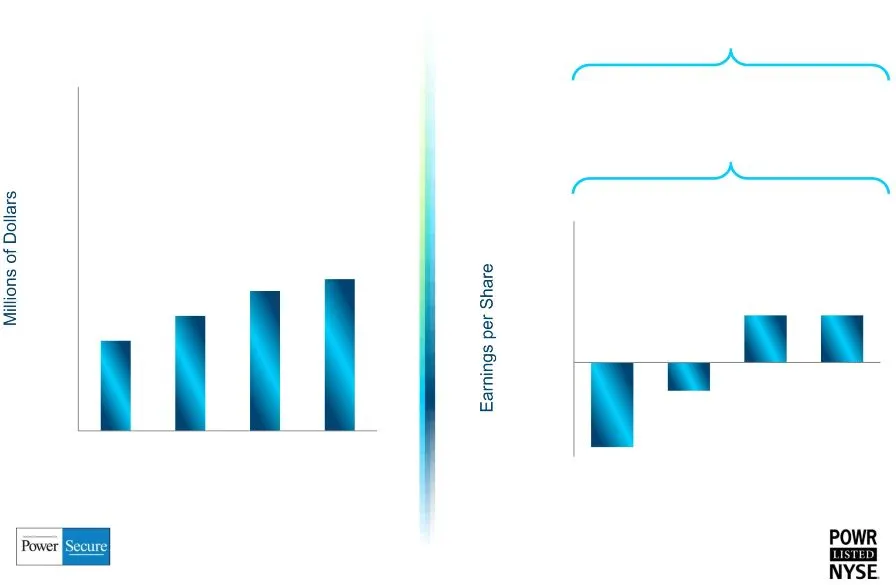
2011 Progression Revenue E.P.S. -- Non-GAAP E.P.S. -- GAAP $0.25 $0.90 $0.05 $0.06 See non-GAAP discussion and reconciliation $24 $30 $37 $40 $0 $10 $20 $30 $40 $50 $60 $70 $80 $90 1Q11 2Q11 3Q11 4Q11 ($0.09) ($0.03) $0.05 $0.05 ($0.10) ($0.05) $0.00 $0.05 $0.10 $0.15 1Q11 2Q11 3Q11 4Q11
Slide 8: 2012 Progression
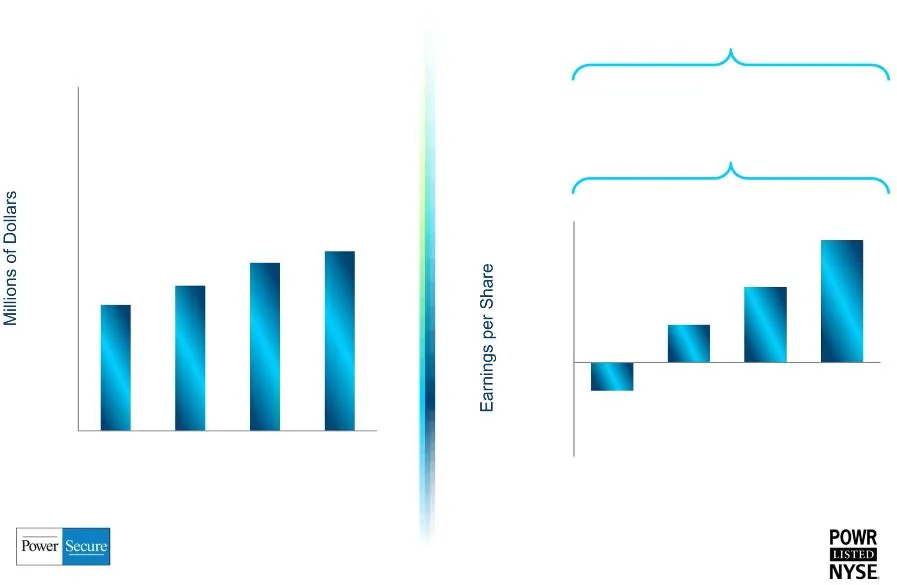
Revenue 2012 Progression E.P.S. -- Non-GAAP E.P.S. -- GAAP ($0.03) $0.09 $0.03 $0.08 See non-GAAP discussion and reconciliation $33 $38 $44 $47 $0 $10 $20 $30 $40 $50 $60 $70 $80 $90 1Q12 2Q12 3Q12 4Q12 ($0.03) $0.04 $0.08 $0.13 ($0.10) ($0.05) $0.00 $0.05 $0.10 $0.15 1Q12 2Q12 3Q12 4Q12
Slide 9: 2013 Progression
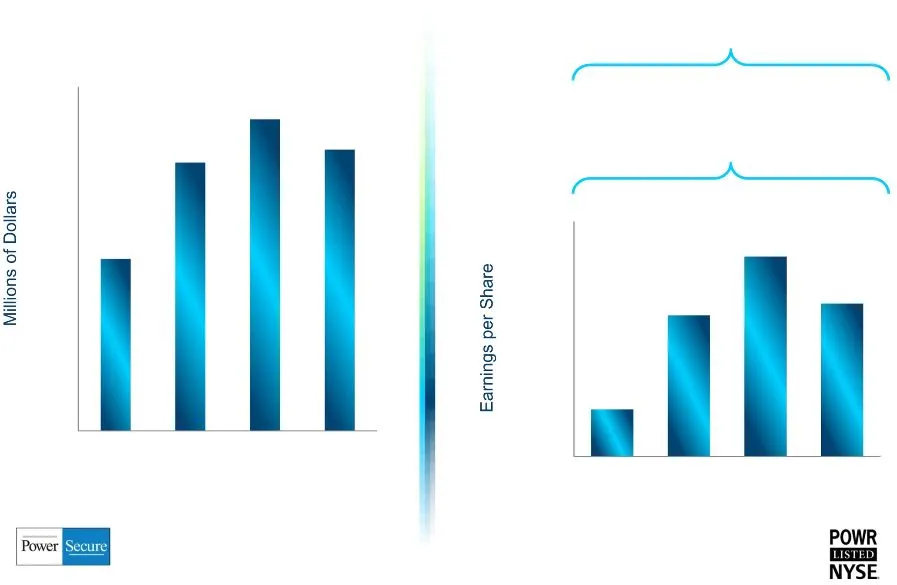
Revenue 2013 Progression E.P.S. -- Non-GAAP E.P.S. -- GAAP See non-GAAP discussion and reconciliation $0.04 $0.11 $0.17 ($0.09) $45 $70 $82 $74 $0 $10 $20 $30 $40 $50 $60 $70 $80 $90 1Q13 2Q13 3Q13 4Q13 $0.04 $0.12 $0.17 $0.13 $0.00 $0.05 $0.10 $0.15 $0.20 1Q13 2Q13 3Q13 4Q13

Slide 10: Robust Balance Sheet
• At end of Q4 2013: - $50.9 M in Cash - $27 M term debt at 3.73% - Untapped $20 M revolver • Potential uses of capital: - Additional investment in company-owned DG projects - Potential acquisitions - Working capital - Equipment to support growth in UI Robust Balance Sheet
Slide 11: Recent Acquisitions Add Value: Encari
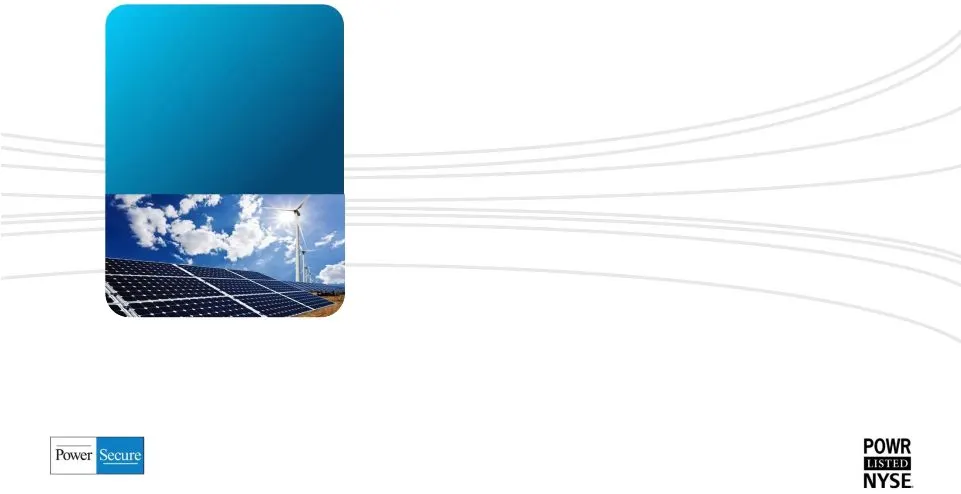
Purchased Encari for $4.8M October 2013 • Provides cyber security and NERC-CIP compliance consulting services to utility industry • Opportunity for PowerSecure to expand UI service offerings to world-class Encari customer base • PowerSecure can bring Encari’s expertise to existing UI customers • Acc
Slide 12: Recent Acquisitions Add Value: ESCO services
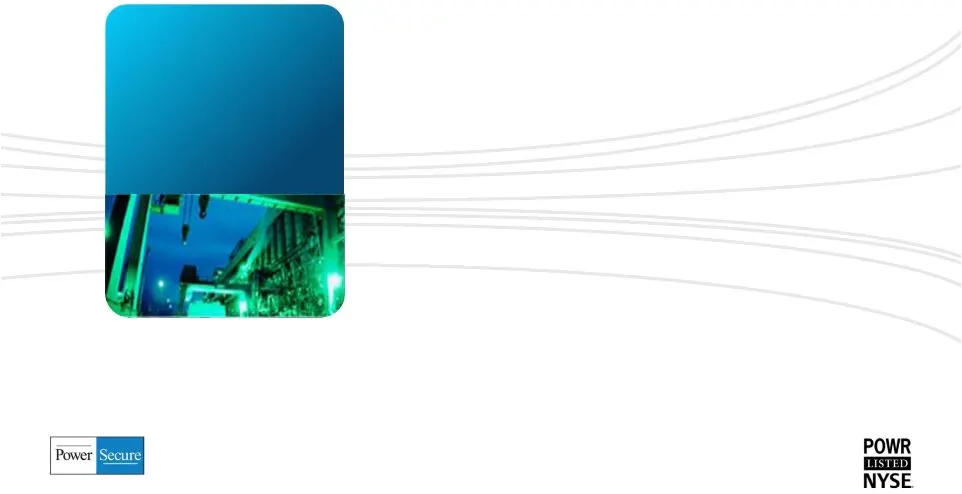
Purchased ESCO services business for $5.5M February 2013 Recent Acquisitions Add Value • Successful 20-yr old business serving major ESCOs with lighting, mechanical, water and building envelope solutions to deliver energy efficiency savings • Significantly expands our Energy Efficiency offerings • O
Slide 13: Recent Acquisitions Add Value: Solais
Purchased Solais lighting business for $15 M April 2013 Recent Acquisitions Add Value • Solais has significant sourcing and manufacturing expertise • Adds substantial efficiencies to manufacturing of PowerSecure’s existing LED solutions • Outstanding proprietary portfolio of LED lamps and fixtures f
Slide 14: 2014 Expectation: >$300M in Revenues
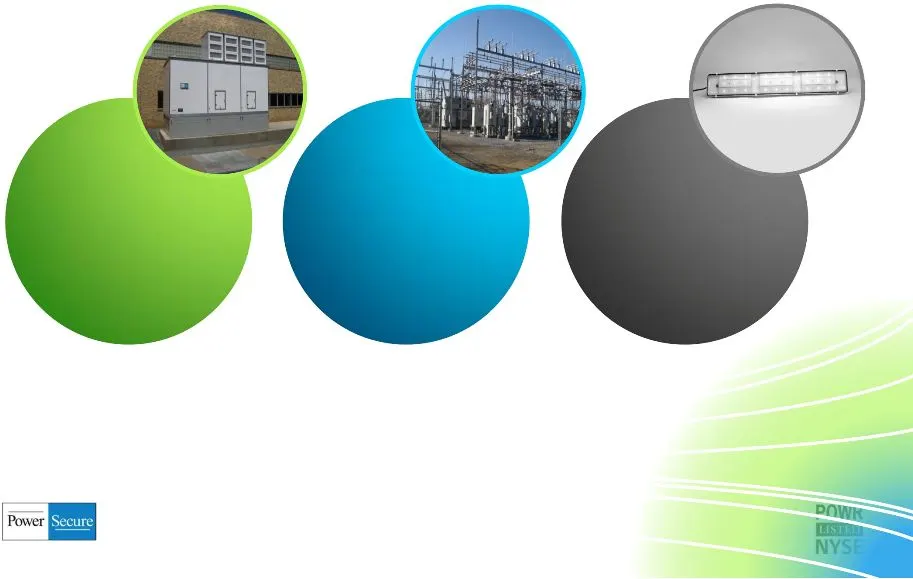
Utility Infrastructure Distributed Generation Energy Efficiency 2014 Expectation: >$300M in Revenues
Slide 15: DG: Hospital & Data Center Growth Drivers
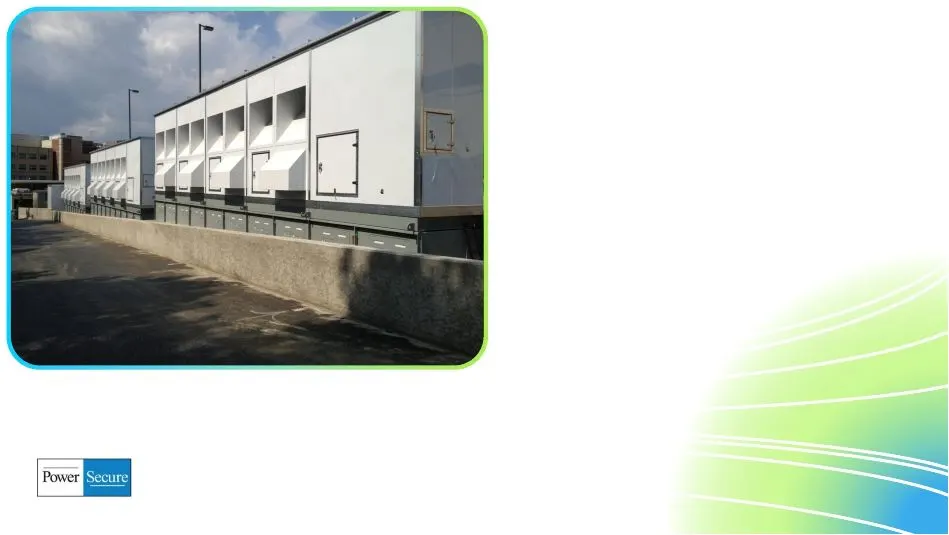
DG: Hospital & Data Center Growth Drivers • Hospital revenues +144% in 2013 • Data center revenues +86% in 2013 • Average DG project size up 28% from 2012 to 2013 • Focused hospital and data center sales teams • Proprietary PowerBlock solution drivers higher ROI for customers • 70% bi-fuel capabilit
Slide 16: PowerSecure Distributed Generation: Differentiated Solution
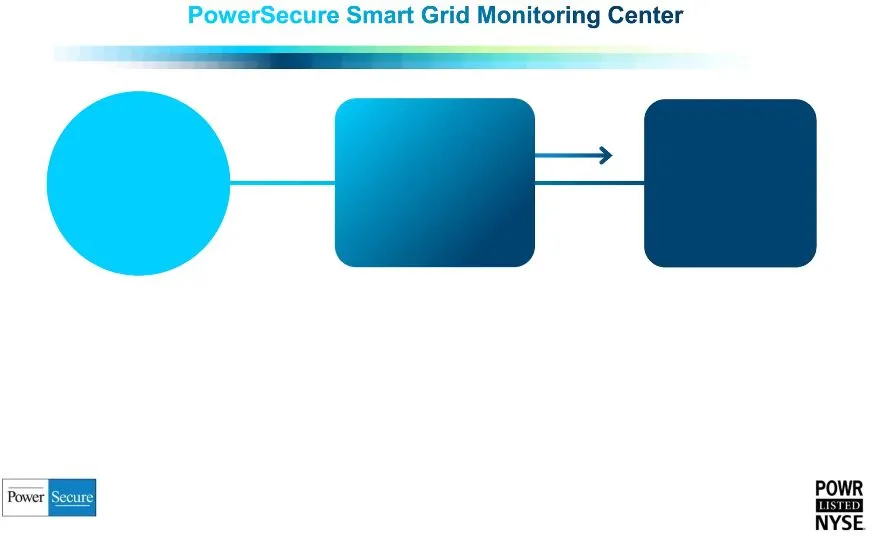
Electric Utility Customer Facility Interactive Distributed Generation ® System PowerSecure Distributed Generation: Differentiated Solution=Superior Reliability & ROI • 24/7 monitoring: standby and peak shaving • Proprietary internet-based monitoring, dispatch and control • “No Pain” demand response
Slide 17: Utility Infrastructure: Direct Service to our Utility Customers
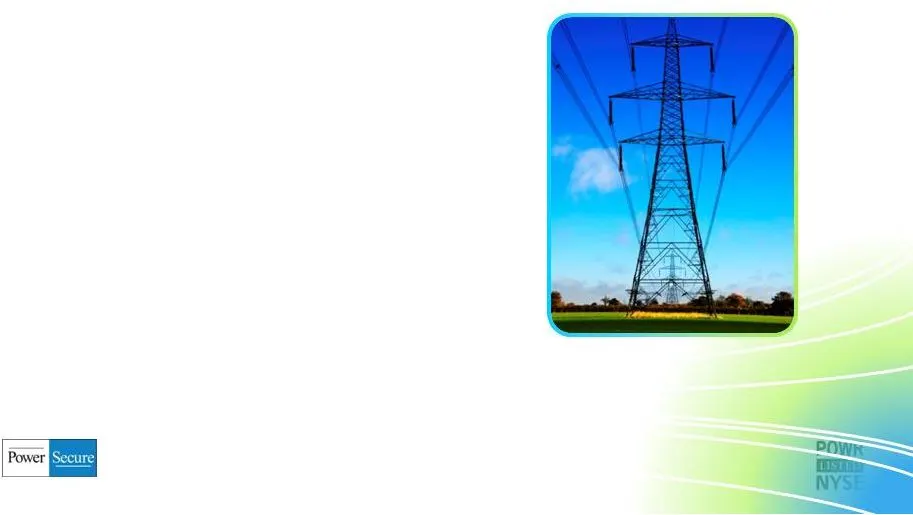
• T&D maintenance and construction • Substation products and services • Advanced metering and lighting installation • Storm repair and restoration • Utility engineering and design • Regulatory consulting and rate design Utility Infrastructure: Direct Service to our Utility Customers
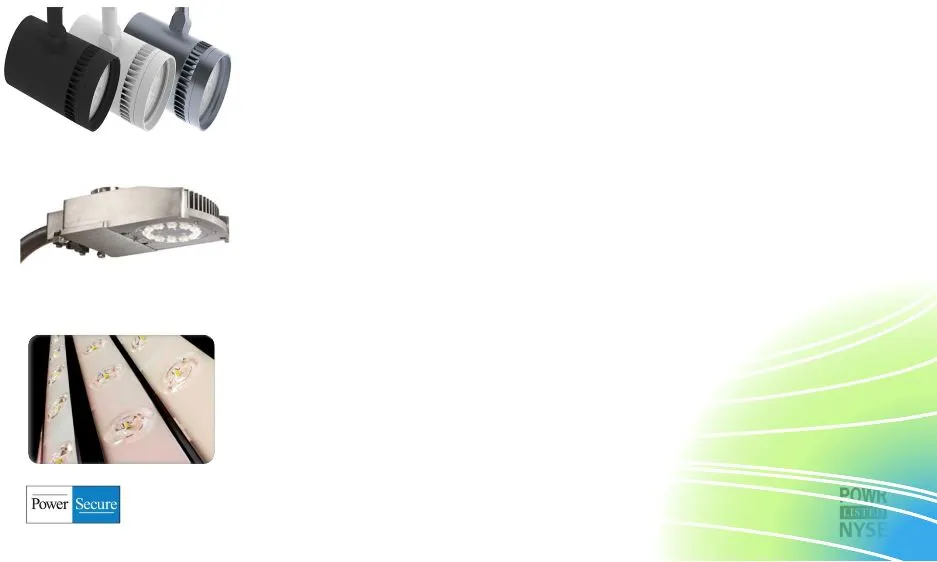
Slide 18: Energy Efficiency: LED Solutions
• Department store/high-end retail lighting - Solais product line adds new customers • Utility lighting Energy Efficiency: LED Solutions - Utilities and municipalities - Energy and maintenance savings drive payback - Opportunity: millions of lights across U.S. • Grocery, drug, and convenience stores
Slide 19: PowerSecure: Utility Focused
Energy Efficiency Products/Services Utility Infrastructure Solutions Distributed Generation Systems PowerSecure: Utility Focused Utilities and Their Large Customers

Slide 20: Thank you
Thank you

Slide 21: Non-GAAP Financial Measures Discussion
Our references to our fourth quarter and full year 2013, and fourth quarter and full year 2012 “non- GAAP pro forma” financial measures of cost of sales, gross margins, gross margins as a percentage of revenue, operating expenses, operating expenses as a percentage of revenue, operating income, oper

Slide 22: Non-GAAP Financial Measures Discussion
For the fourth quarter of 2012, our non-GAAP financial measures refer to our GAAP results, excluding a $1.1 million pre-tax charge related to a restructuring and cost reduction plan that was initiated during the third quarter of 2012, and extended into the fourth quarter of 2012, to position the com

Slide 23: Non-GAAP Financial Measures
Non-GAAP Financial Measures References to our fourth quarter and full year 2012 and 2013 Adjusted EBITDA, which we define as our earnings before interest, taxes, depreciation and amortization, as discussed and shown in this release, constitutes a non-GAAP “pro forma” financial measure. We believe th
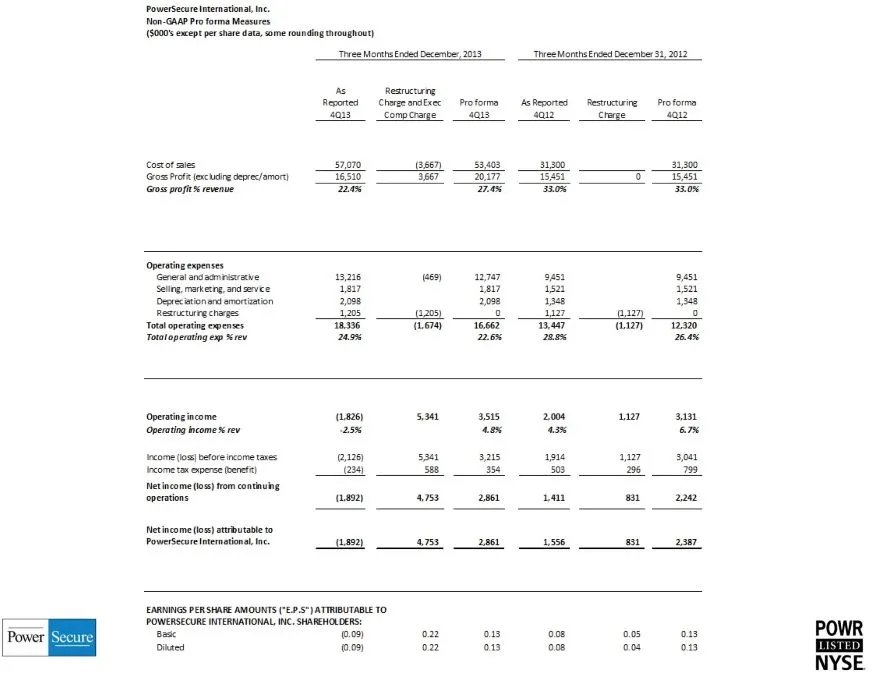
Slide 24: Non-GAAP Proforma Measures
| Powersecure International, Inc. Non-GAAP Proforma Measures ($0005 exept per share data, some rounding toughout) Ac Reanuctrng Recoted ChageandEsec Proforma AsReportes estururg Proform 4013 _compoaye __ 403 san crage an costot ses 57070 (3867 _ $3408 1300 1.300 Gos Pofe lxcudire deprelaron) 16510 3
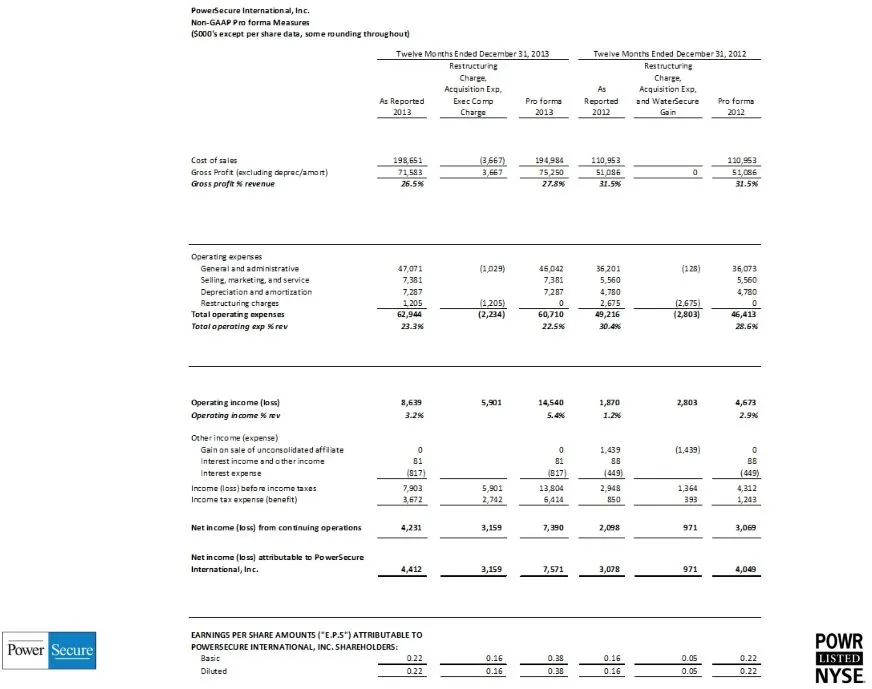
Slide 25: (5000S except per sar ct, sme oundng HwouEhout
(5000S except per sar ct, sme oundng HwouEhout “wee Mor nde December 32013 wave Mant Ended nce, 20:2 Actapered —"EnecCore Proform Report nectar con stone snes sen stam _ sea sos oes hate actadng cpecfaron) on ber Lies noes T swe ‘Gorrprofes reenoe 758 as ase 338 Geresiandaerinarsive aon oo) aso0 eam
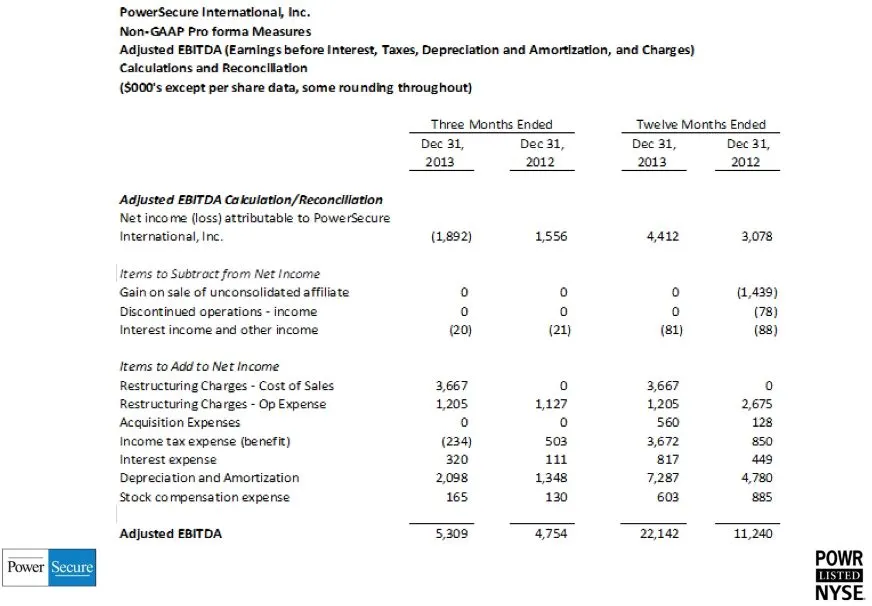
Slide 26: Adjusted EBITDA Calculations and Reconciliation
PowerSecure Intemational, Inc. Non-GAAP Pro forma Measures Adjusted EBITDA (Eamings before Interest, Taxes, Depreciation and Amortization, and Charges) Calculations and Reconclllation (5000's except per share data, some rounding throughout) ‘Three Months Ended Twelve Months Ended Dec 31, Dec 3i, Dec

Slide 27: Non-GAAP Pro forma Measures Discussion
Our references to our quarterly and full year 2012, and quarterly and full year 2011 “Non-GAAP Pro forma” financial measures of operating expenses, operating expenses as a percentage of revenue, operating income, operating income as a percentage of revenue, net income from continuing operations, net

Slide 28: Non-GAAP Financial Measures
Non-GAAP Financial Measures We believe providing non-GAAP measures which show our pro forma results with these items adjusted is valuable and useful as it allows our management and our board of directors to measure, monitor and evaluate our operating performance in 2011, 2012, and in future periods
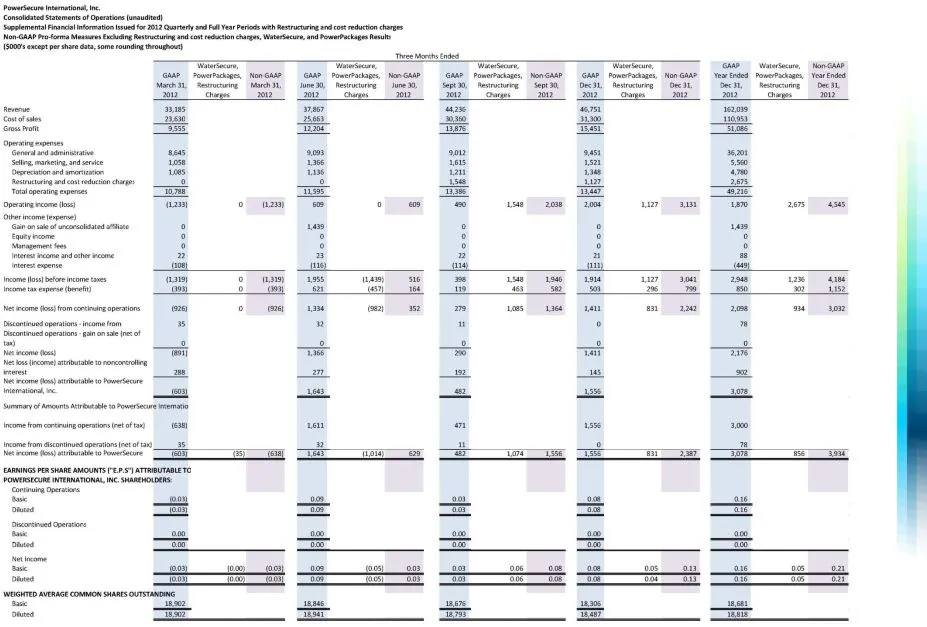
Slide 29: Non-GAAP Financial Measures
Non-GAAP Financial Measures
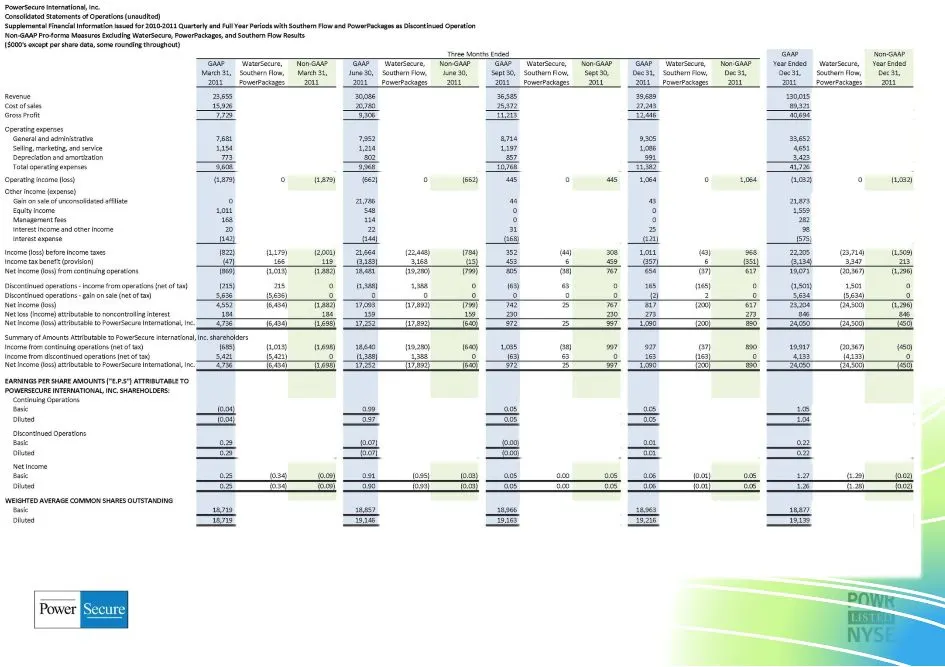
Slide 30: bracorierencenna nae
bracorierencenna nae ‘ition some Cpt ame ‘Spams inate ano Qu io Pik thrown owes tin pion ‘routers tan cag asec Fowernp ndsochon ow ase (recap gerne ana onercsagormap) Meuse) sent, womse | llama aveenren | anwsh [Samat soaenton "spat [mat sommmncs, Dest | Gest” sweemnen, “Owae feu ecrmugs "Su "Sh owr
Source: SEC EDGAR · 8-K filed Mar 11, 2014
More decks from PowerSecure International Inc
 Investor Presentation (January 2016)19 slides · Jan 13, 2016
 Q3 2015 Earnings Presentation19 slides · Nov 9, 2015
 Investor Presentation (September 2015)19 slides · Sep 2, 2015
 Investor Presentation (August 2015)16 slides · Aug 10, 2015
 Investor Presentation (May 2015)21 slides · May 26, 2015
 Investor Presentation (May 2015)18 slides · May 6, 2015