Imcd N.V. · EURONEXT:IMCD
Imcd — H1 2016 Earnings Presentation
18 slides from Imcd's earnings presentation, Aug 23, 2016

Slide 1: Conference Call Half year results 2016
CONFERENCE CALL Half year results 2016 IMCD N.V. 23 AUGUST 2016
Slide 2: Disclaimer
Disclaimer Disclaimer This presentation may contain forward looking statements. These statements are based on current expectations, estimates and projections of IMCD’s management and information currently available to the company. IMCD cautions that such statements contain elements of risk and uncer
Slide 3: Presenting team
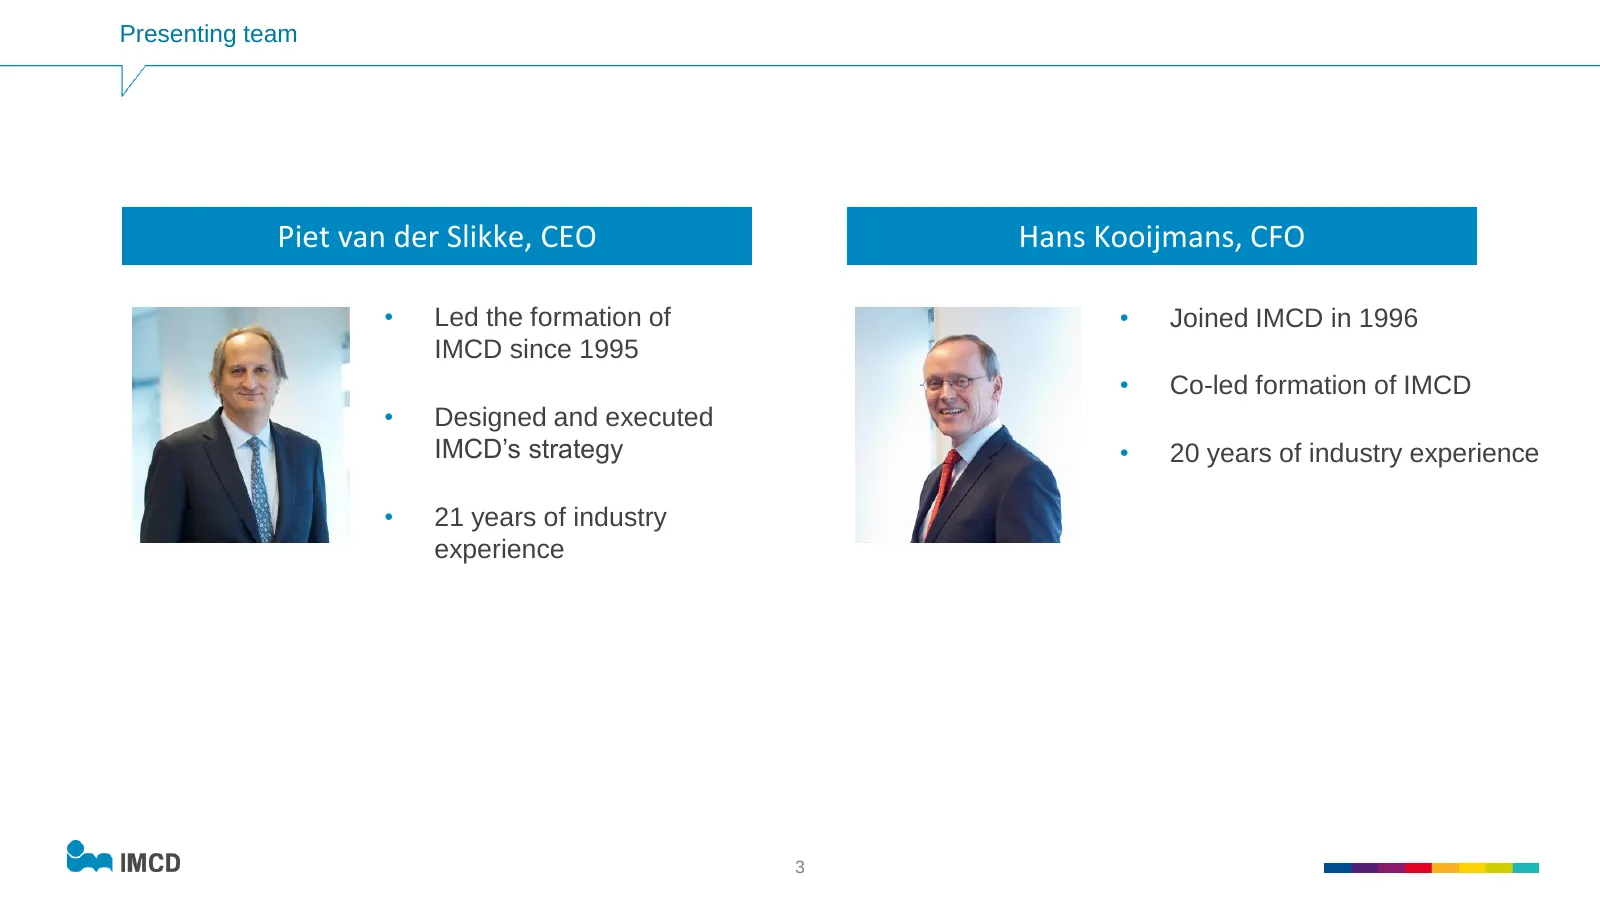
Presenting team Piet van der Slikke, CEO Hans Kooijmans, CFO • Led the formation of • Joined IMCD in 1996 IMCD since 1995 • Co-led formation of IMCD • Designed and executed IMCD’s strategy • 20 years of industry experience • 21 years of industry experience 3
Slide 4: Agenda
Agenda • Company profile • Highlights first half year 2016 • Financials first half year 2016 • Outlook • Q&A 4
Slide 5: Company profile
Company profile IMCD is a market-leader in the sales, marketing and distribution of speciality chemicals and food ingredients. Its dedicated local experts provide market-focused solutions to suppliers and customers across Europe, Africa, Asia-Pacific and Americas, offering a range of comprehensive p
Slide 6: Agenda
Agenda • Company profile • Highlights first half year 2016 • Financials first half year 2016 • Outlook • Q&A 6
Slide 7: Highlights first half year 2016
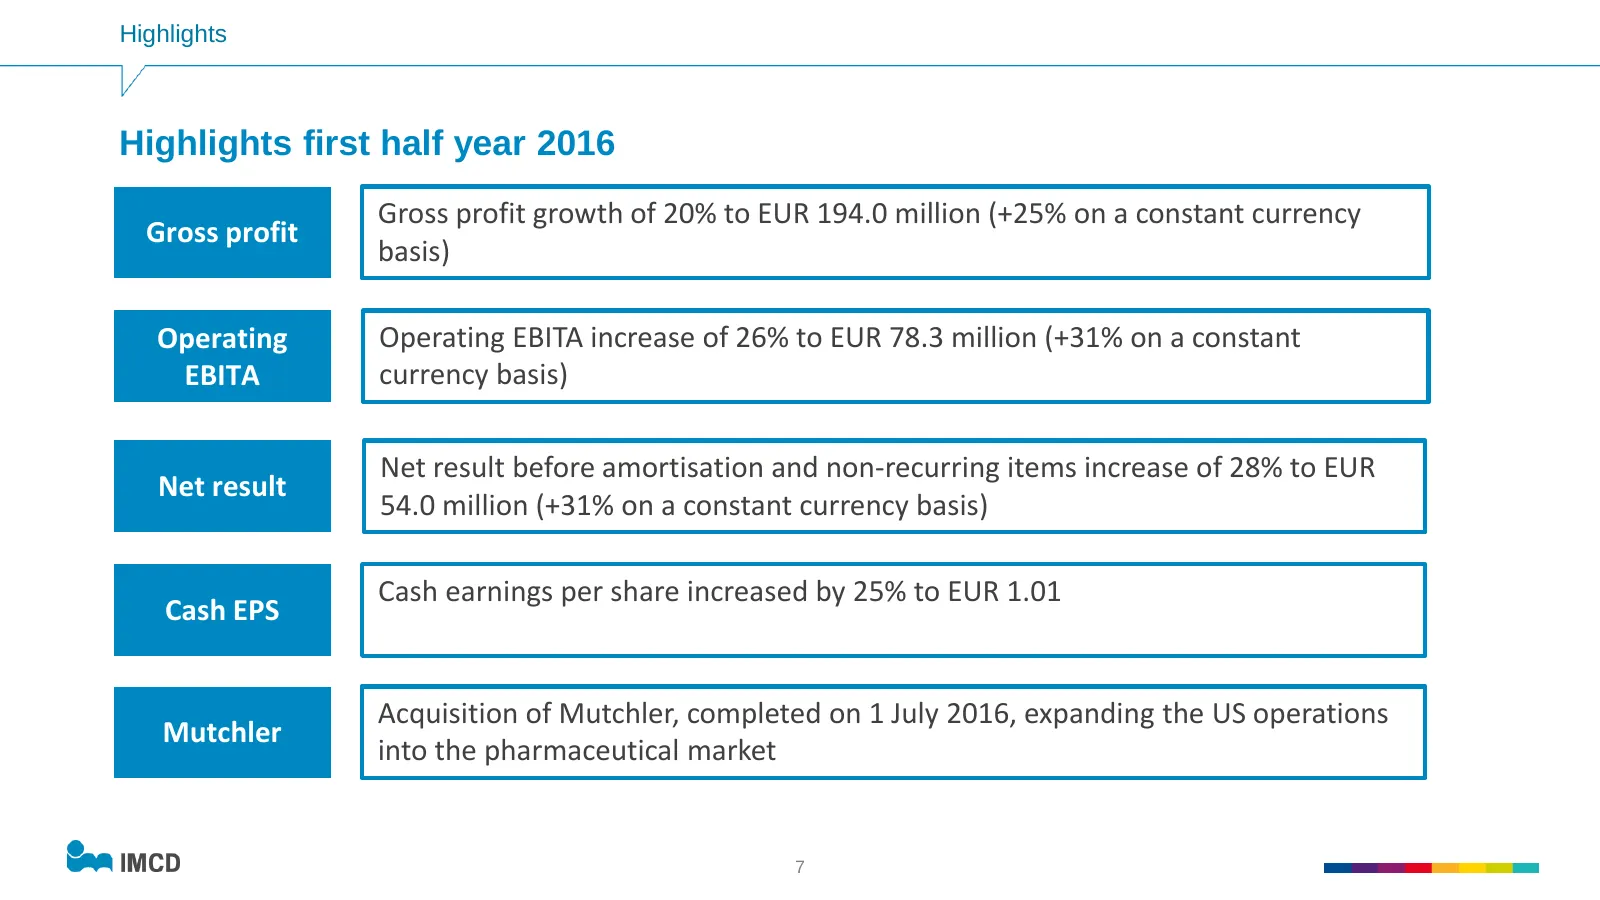
Highlights Highlights first half year 2016 Gross profit growth of 20% to EUR 194.0 million (+25% on a constant currency Gross profit basis) Operating Operating EBITA increase of 26% to EUR 78.3 million (+31% on a constant EBITA currency basis) Net result before amortisation and non-recurring items i
Slide 8: Agenda
Agenda • Company profile • Highlights first half year 2016 • Financials first half year 2016 • Outlook • Q&A 8
Slide 9: Income statement
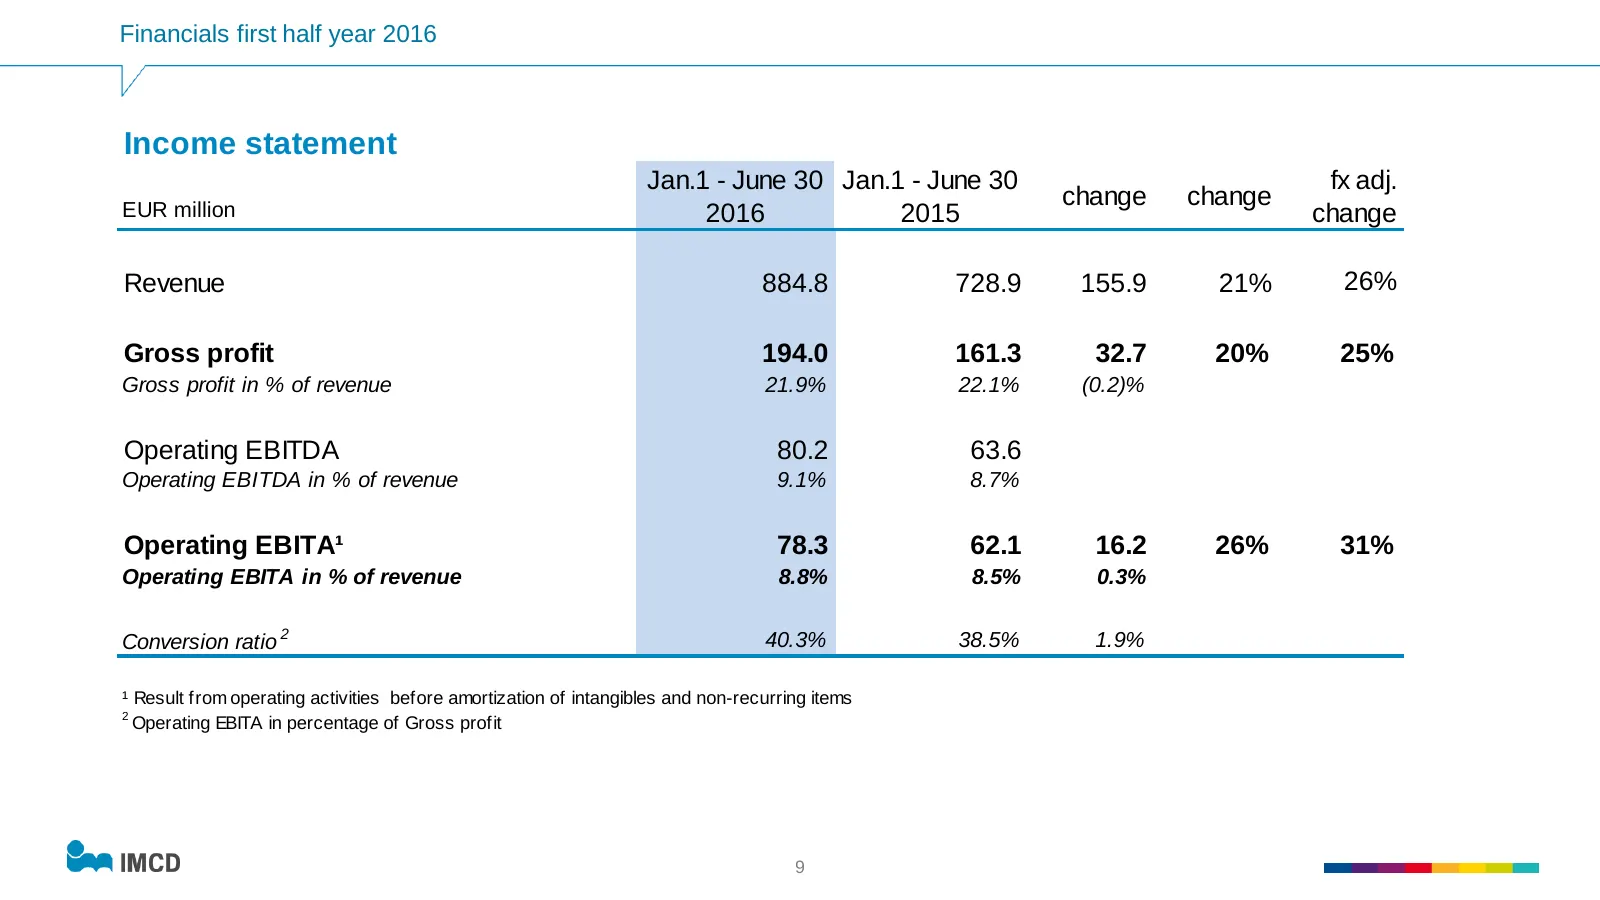
Financials first half year 2016 Income statement Jan.1 - June 30 Jan.1 - June 30 fx adj. EUR million change change 2016 2015 change Revenue 884.8 728.9 155.9 21% 26% Gross profit 194.0 161.3 32.7 20% 25% Gross profit in % of revenue 21.9% 22.1% (0.2)% Operating EBITDA 80.2 63.6 Operating EBITDA in %
Slide 10: Income statement (continued)
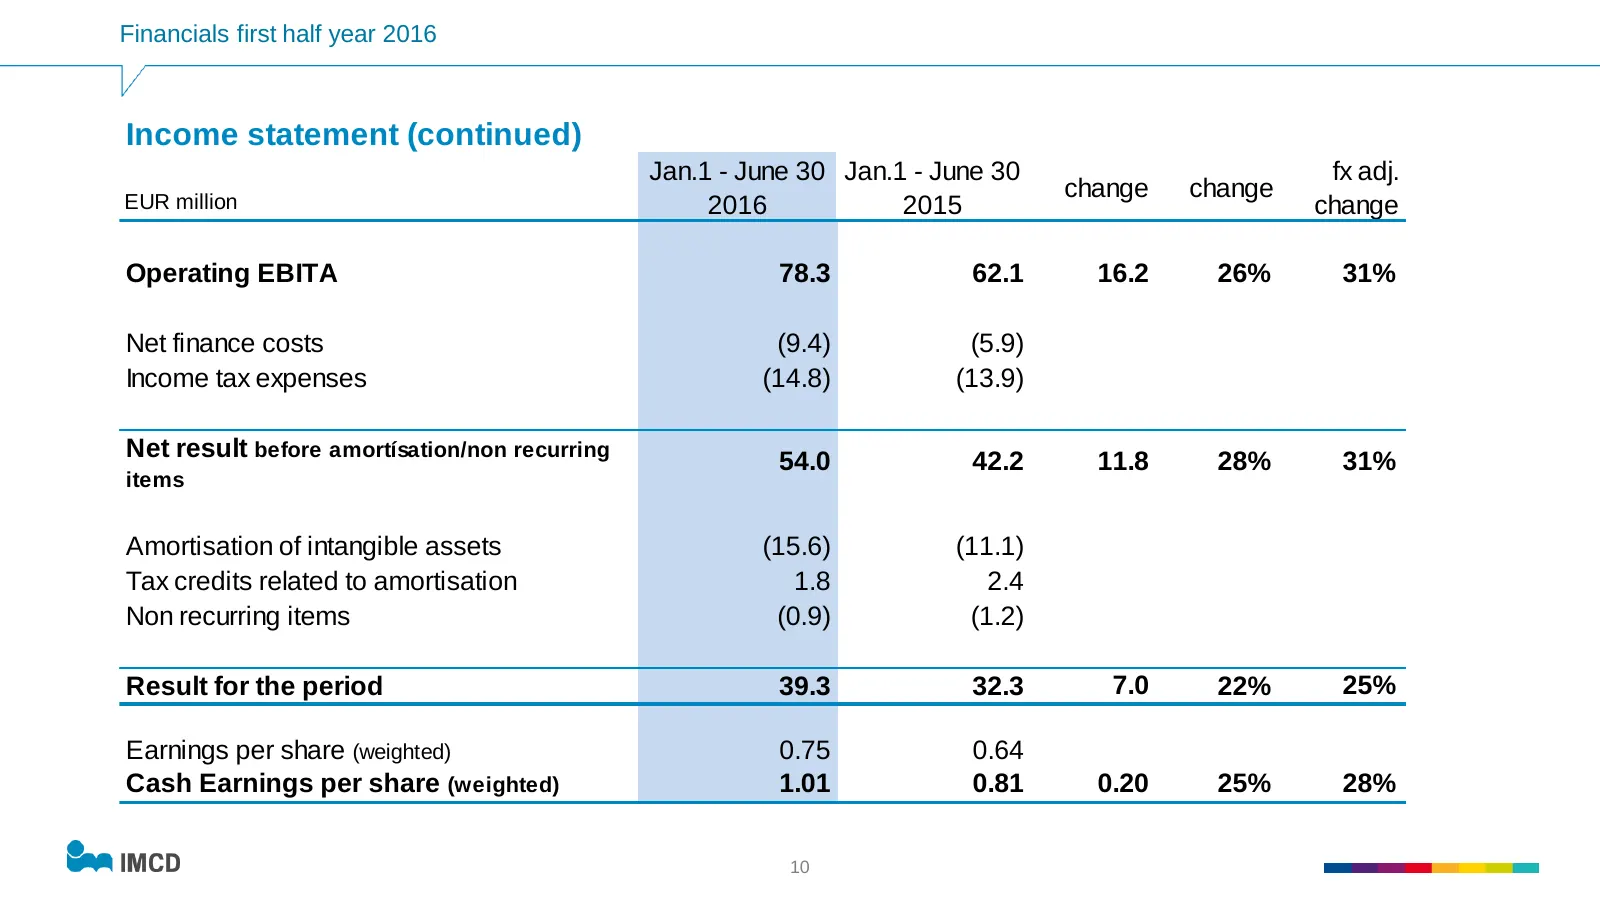
Financials first half year 2016 Income statement (continued) Jan.1 - June 30 Jan.1 - June 30 fx adj. EUR million change change 2016 2015 change Operating EBITA 78.3 62.1 16.2 26% 31% Net finance costs (9.4) (5.9) Income tax expenses (14.8) (13.9) Net result before amortísation/non recurring 54.0 42.
Slide 11: Income statement by region
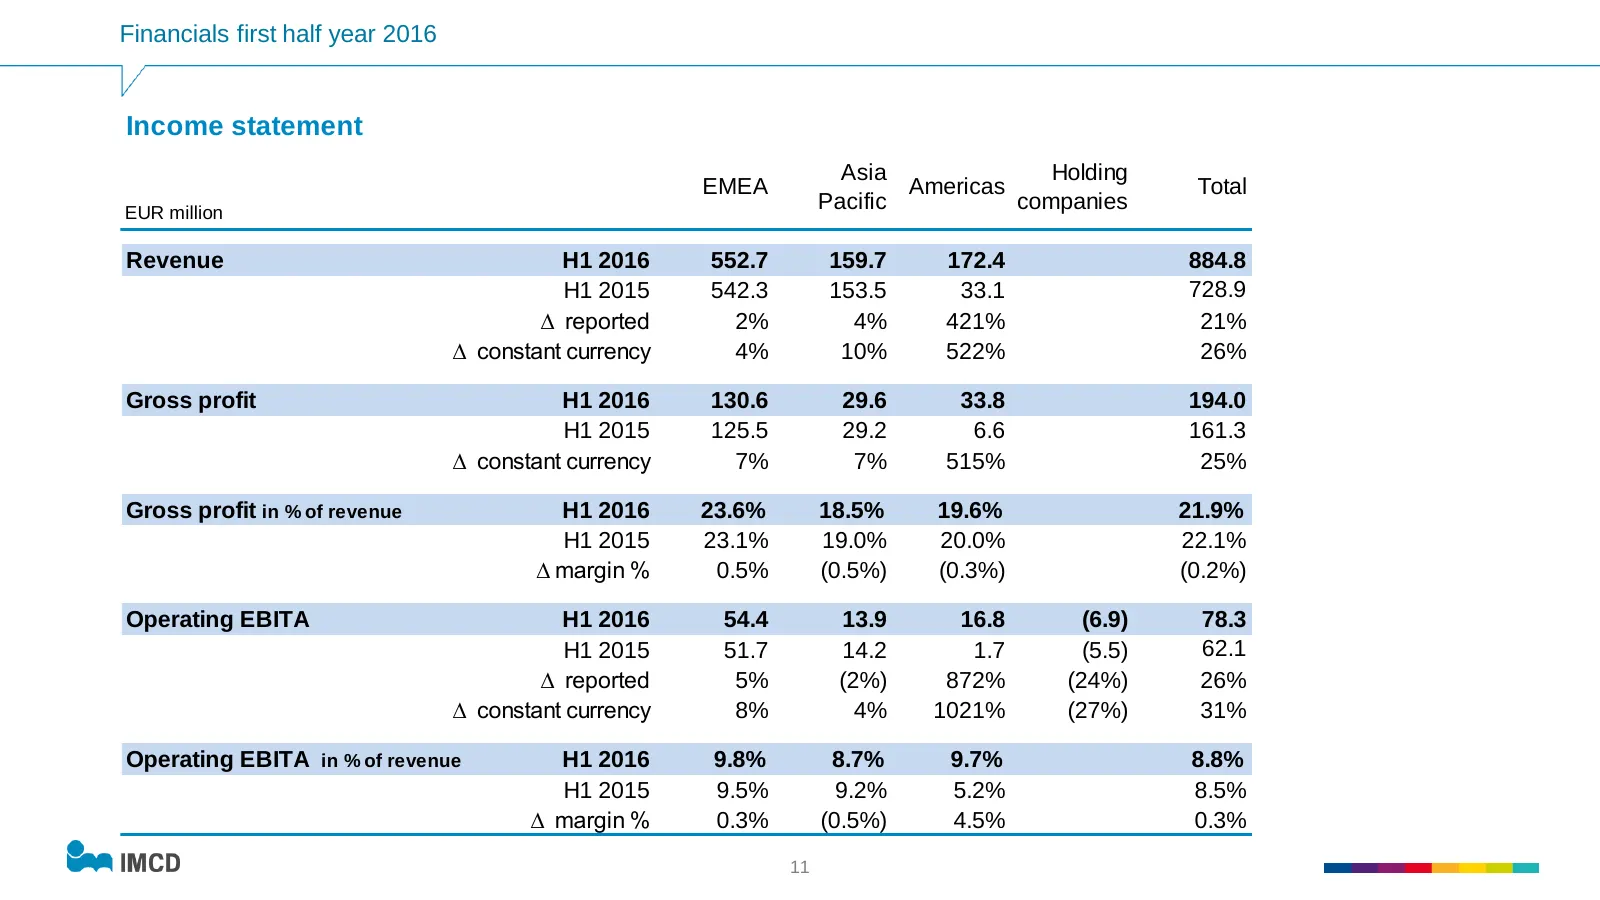
Financials first half year 2016 Income statement Asia Holding EMEA Americas Total EUR million Pacific companies Revenue H1 2016 552.7 159.7 172.4 884.8 H1 2015 542.3 153.5 33.1 728.9 ∆ reported 2% 4% 421% 21% ∆ constant currency 4% 10% 522% 26% Gross profit H1 2016 130.6 29.6 33.8 194.0 H1 2015 125.
Slide 12: Balance Sheet
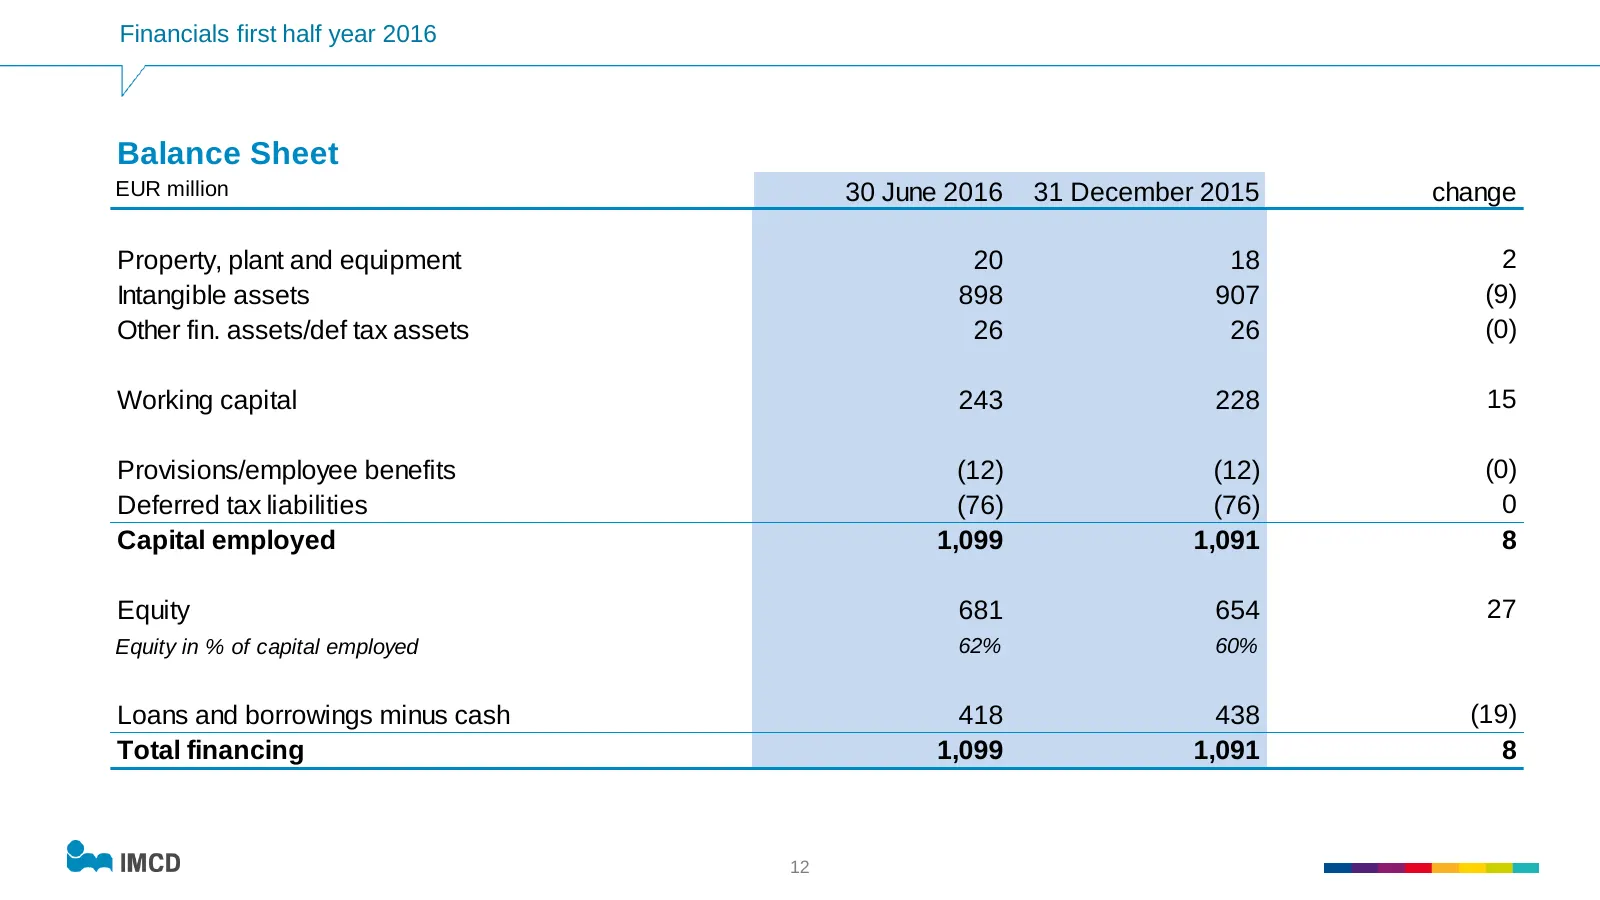
Financials first half year 2016 Balance Sheet EUR million 30 June 2016 31 December 2015 change Property, plant and equipment 20 18 2 Intangible assets 898 907 (9) Other fin. assets/def tax assets 26 26 (0) Working capital 243 228 15 Provisions/employee benefits (12) (12) (0) Deferred tax liabilities
Slide 13: Working capital
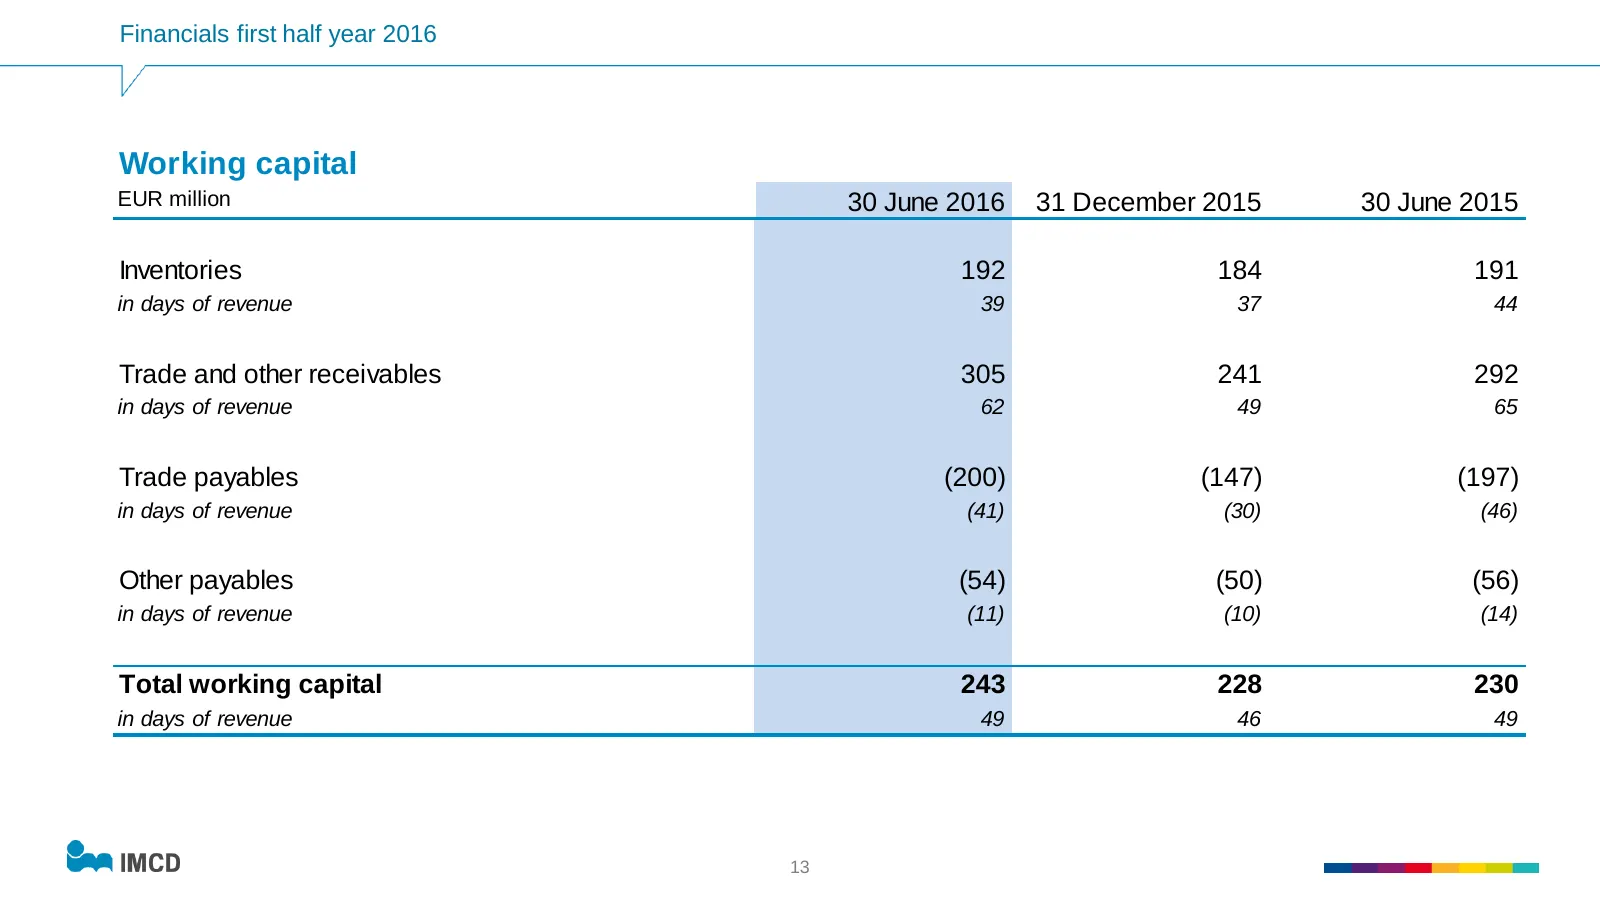
Financials first half year 2016 Working capital EUR million 30 June 2016 31 December 2015 30 June 2015 Inventories 192 184 191 in days of revenue 39 37 44 Trade and other receivables 305 241 292 in days of revenue 62 49 65 Trade payables (200) (147) (197) in days of revenue (41) (30) (46) Other paya
Slide 14: Net Debt
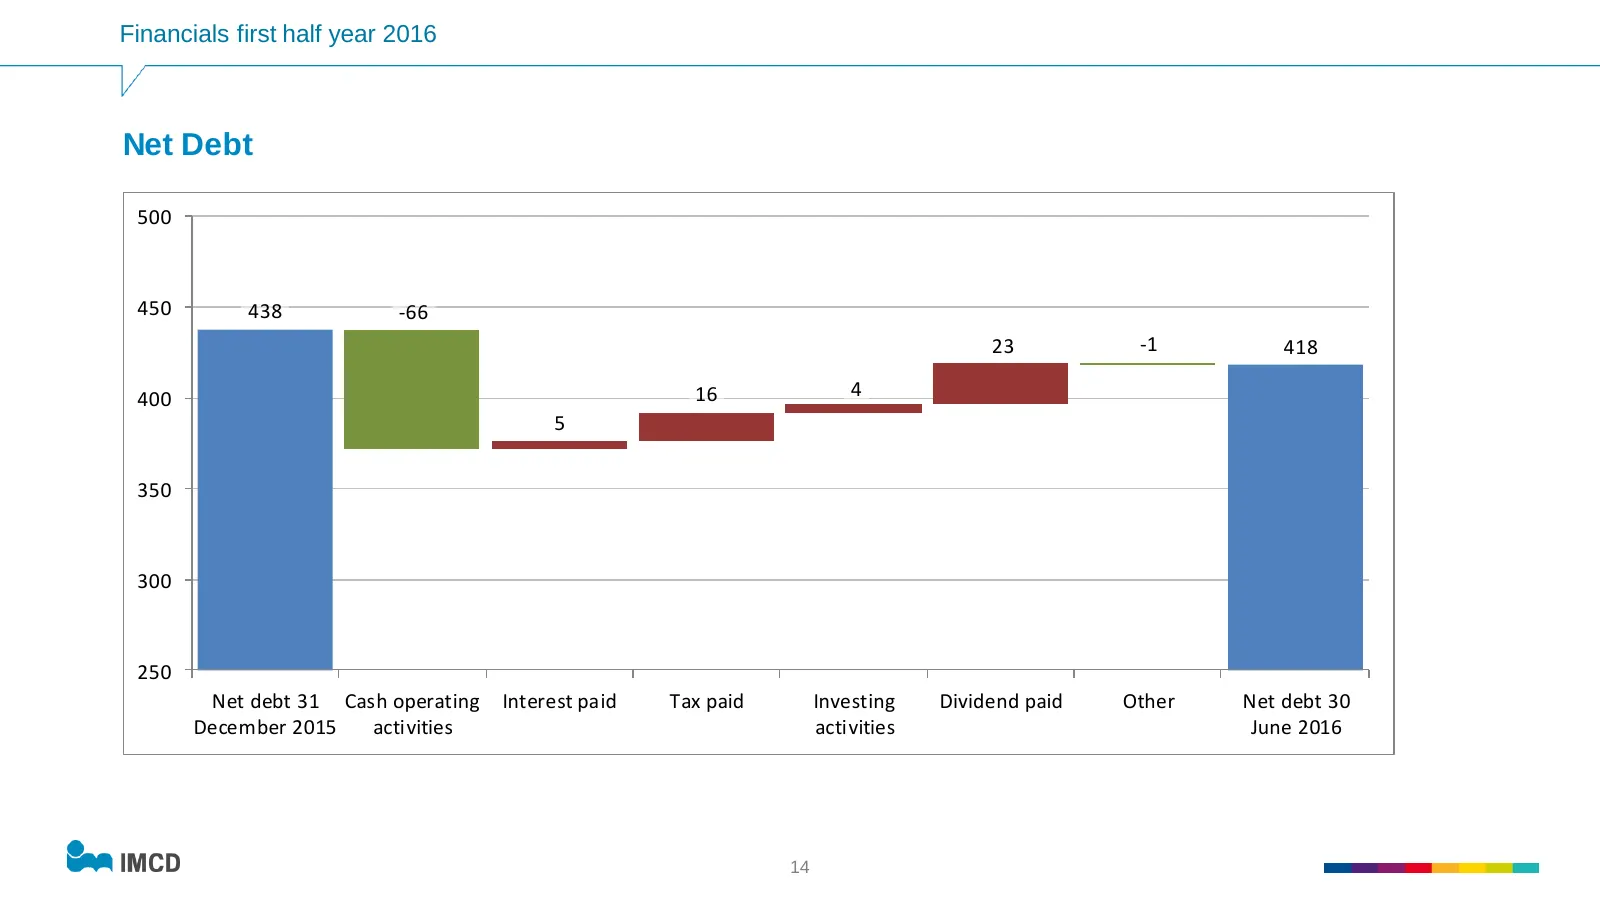
Financials first half year 2016 Net Debt 500 450 438 -66 23 -1 418 400 16 4 5 350 300 250 Net debt 31 Cash operating Interest paid Tax paid Investing Dividend paid Other Net debt 30 December 2015 activities activities June 2016 14
Slide 15: Free cash flow
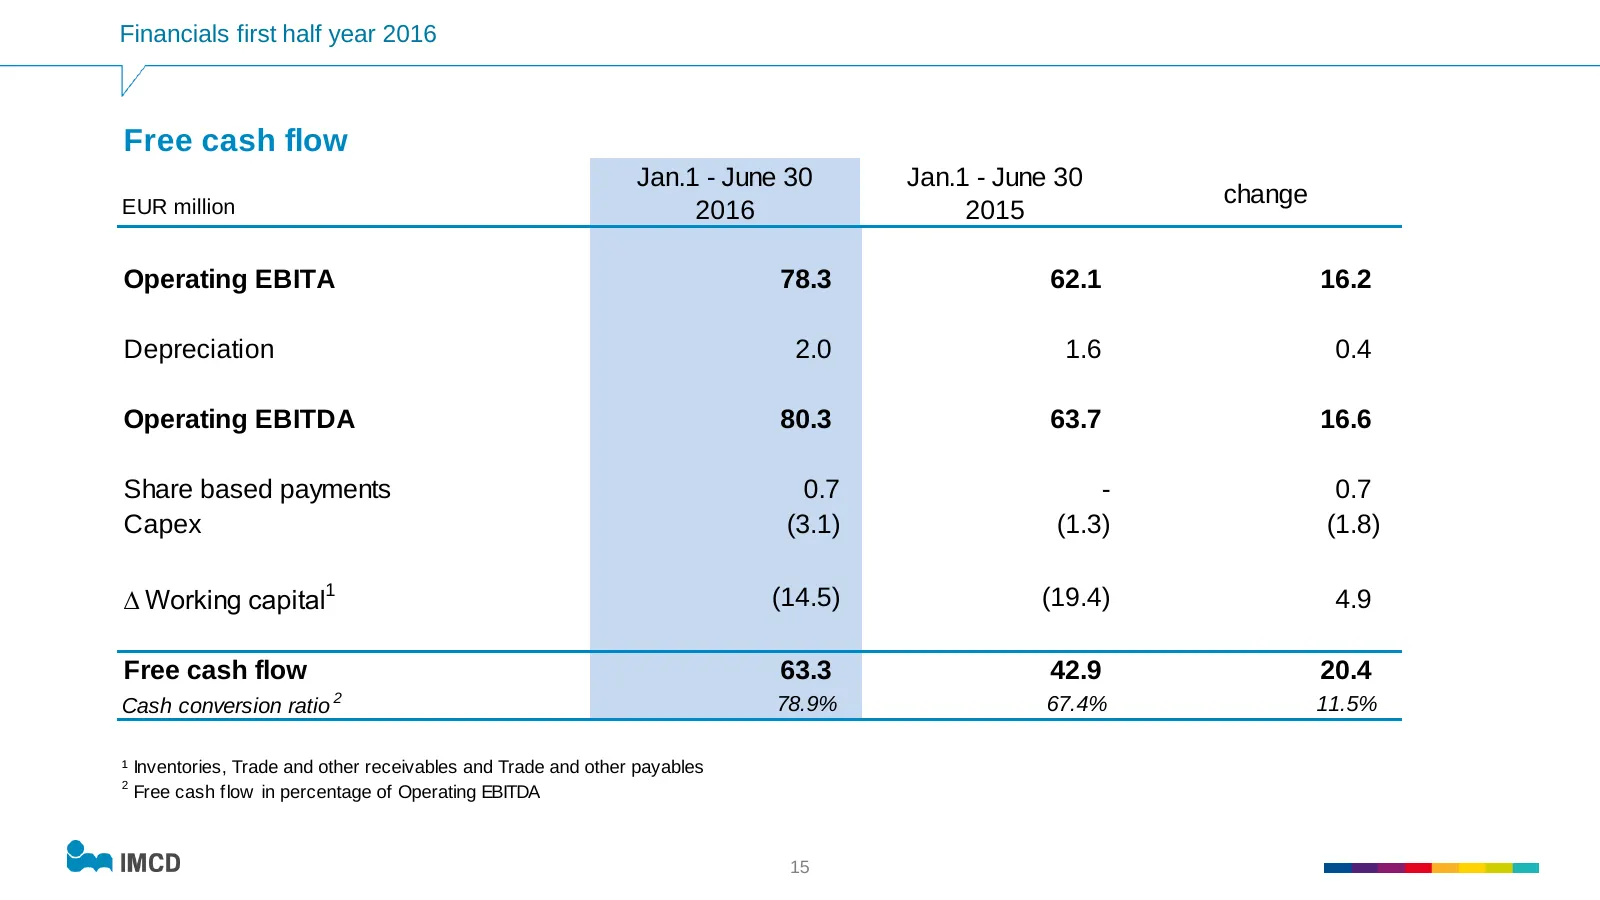
Financials first half year 2016 Free cash flow Jan.1 - June 30 Jan.1 - June 30 EUR million change 2016 2015 Operating EBITA 78.3 62.1 16.2 Depreciation 2.0 1.6 0.4 Operating EBITDA 80.3 63.7 16.6 Share based payments 0.7 - 0.7 Capex (3.1) (1.3) (1.8) ∆ Working capital1 (14.5) (19.4) 4.9 Free cash fl
Slide 16: Agenda
Agenda • Company profile • Highlights first half year 2016 • Financials first half year 2016 • Outlook • Q&A 16
Slide 17: Outlook
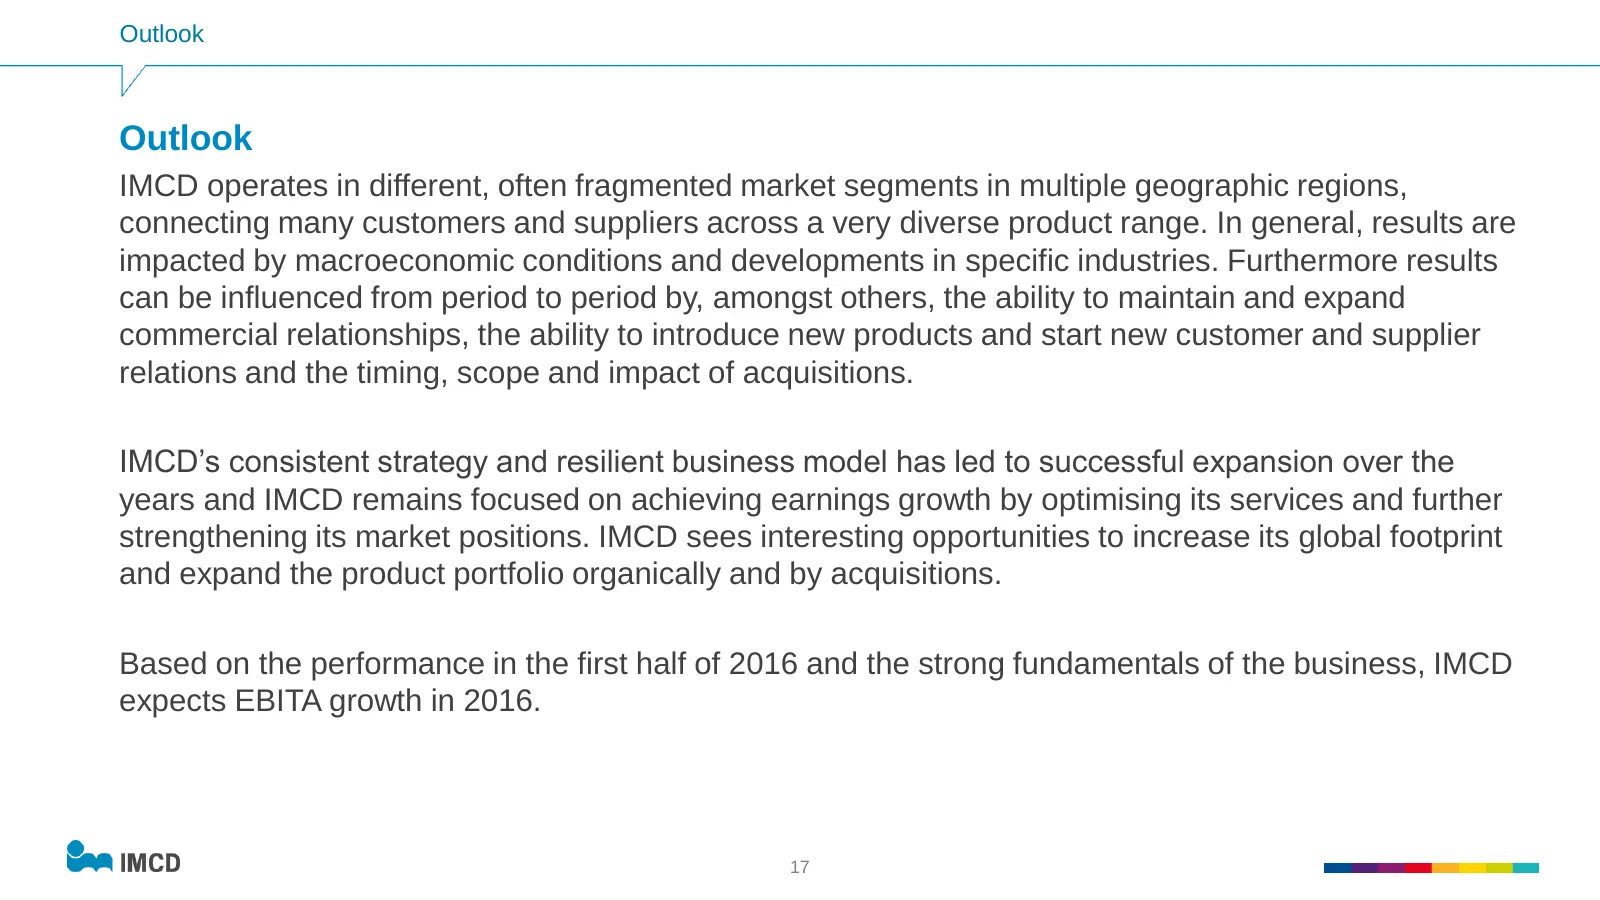
Outlook Outlook IMCD operates in different, often fragmented market segments in multiple geographic regions, connecting many customers and suppliers across a very diverse product range. In general, results are impacted by macroeconomic conditions and developments in specific industries. Furthermore
Slide 18: Agenda
Agenda • Company profile • Highlights first half year 2016 • Financials first half year 2016 • Outlook • Q&A 18
Source: Internet Archive copy of imcdgroup.com
More decks from Imcd N.V.
 Q2 2026 Earnings Presentation23 slides · Jul 29, 2026
 Q1 2026 Earnings Presentation17 slides · Apr 30, 2026
 Q4 2025 Earnings Presentation25 slides · Feb 18, 2026
 Q3 2025 Earnings Presentation18 slides · Nov 6, 2025
 Q2 2025 Earnings Presentation23 slides · Jul 30, 2025
 Q1 2025 Earnings Presentation17 slides · Apr 25, 2025