Emaar Properties (P.J.S.C) · DFM:EMAAR
Emaar Properties (P.J.S.C) — Emaar Malls PJSC — Investor Presentation (February 2020)
38 slides from Emaar Properties (P.J.S.C)'s investor presentation, February 2020
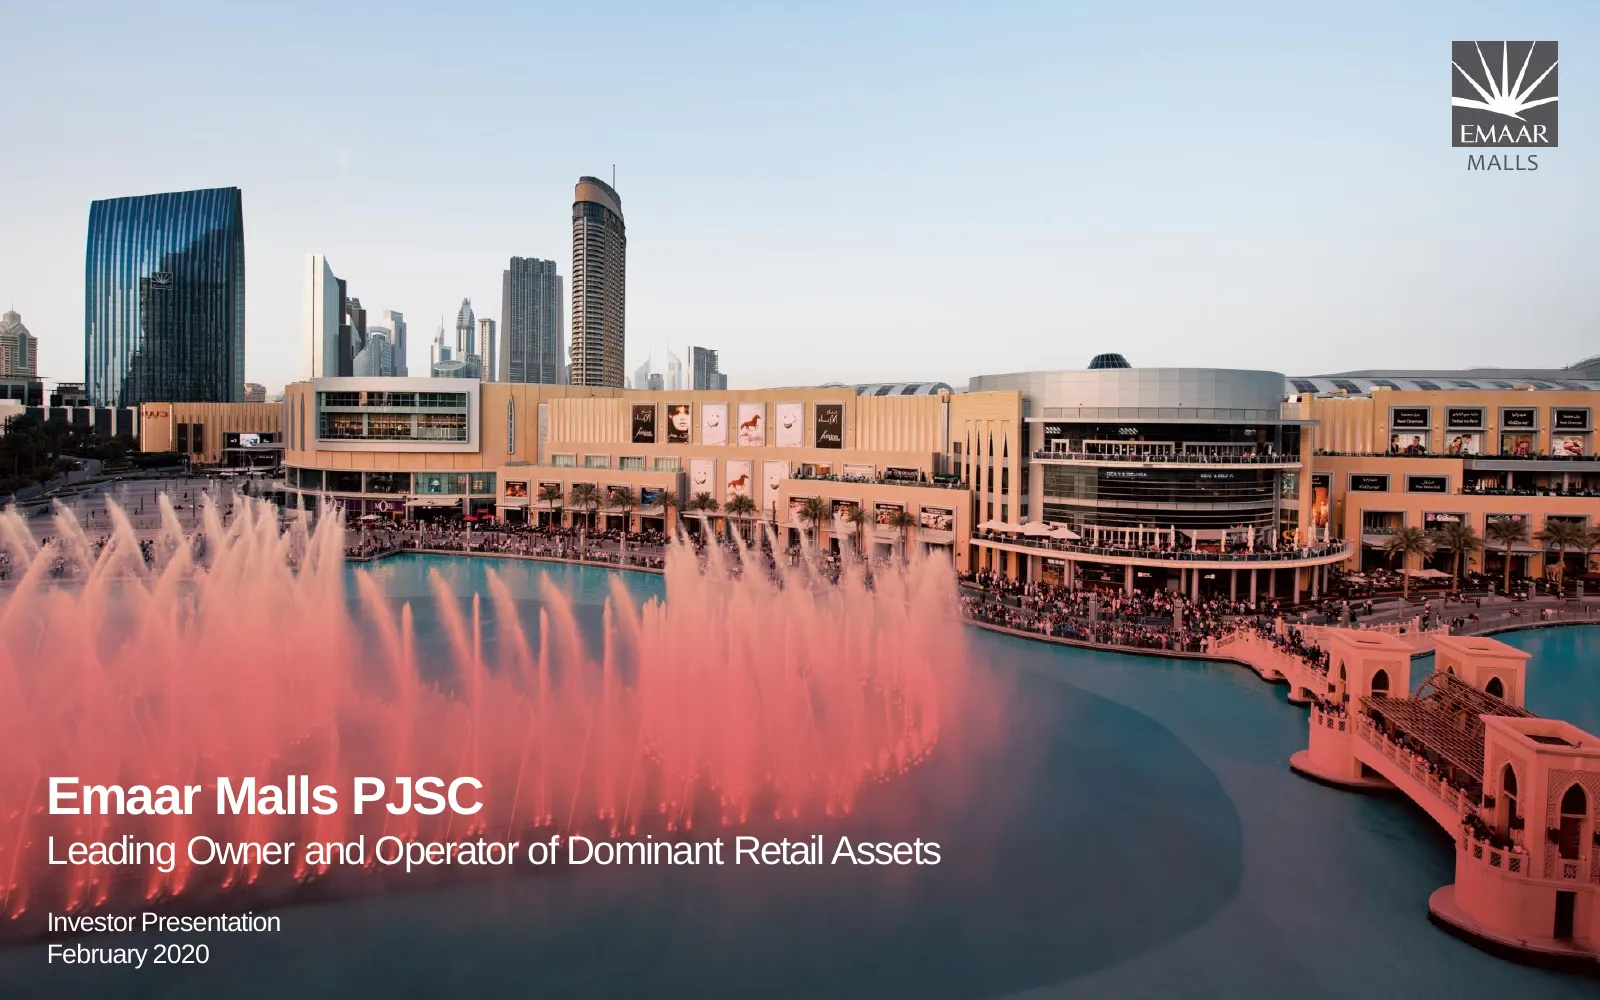
Slide 1: Emaar Malls PJSC Investor Presentation
MALLS Emaar Malls PJSC Leading Owner and Operator of Dominant Retail Assets Investor Presentation February 2020 0 | EMAAR MALLS
Slide 2: Disclaimer
Disclaimer Emaar Malls PJSC gives notice that: The particulars of this presentation do not constitute any part of an offer or a contract. Given that the presentation contains information based on forecasts and roll outs, all statements contained in this presentation are made without responsibility o
Slide 3: Discussion Summary
Discussion Summary Investment Rationale Business Overview Business Strategy & Outlook Q4 & FY 2019 Results Update Annexure 2 | EMAAR MALLS
Slide 4: Investment Rationale
Investment Rationale 3 | EMAAR MALLS
Slide 5: Emaar Malls at a Glance
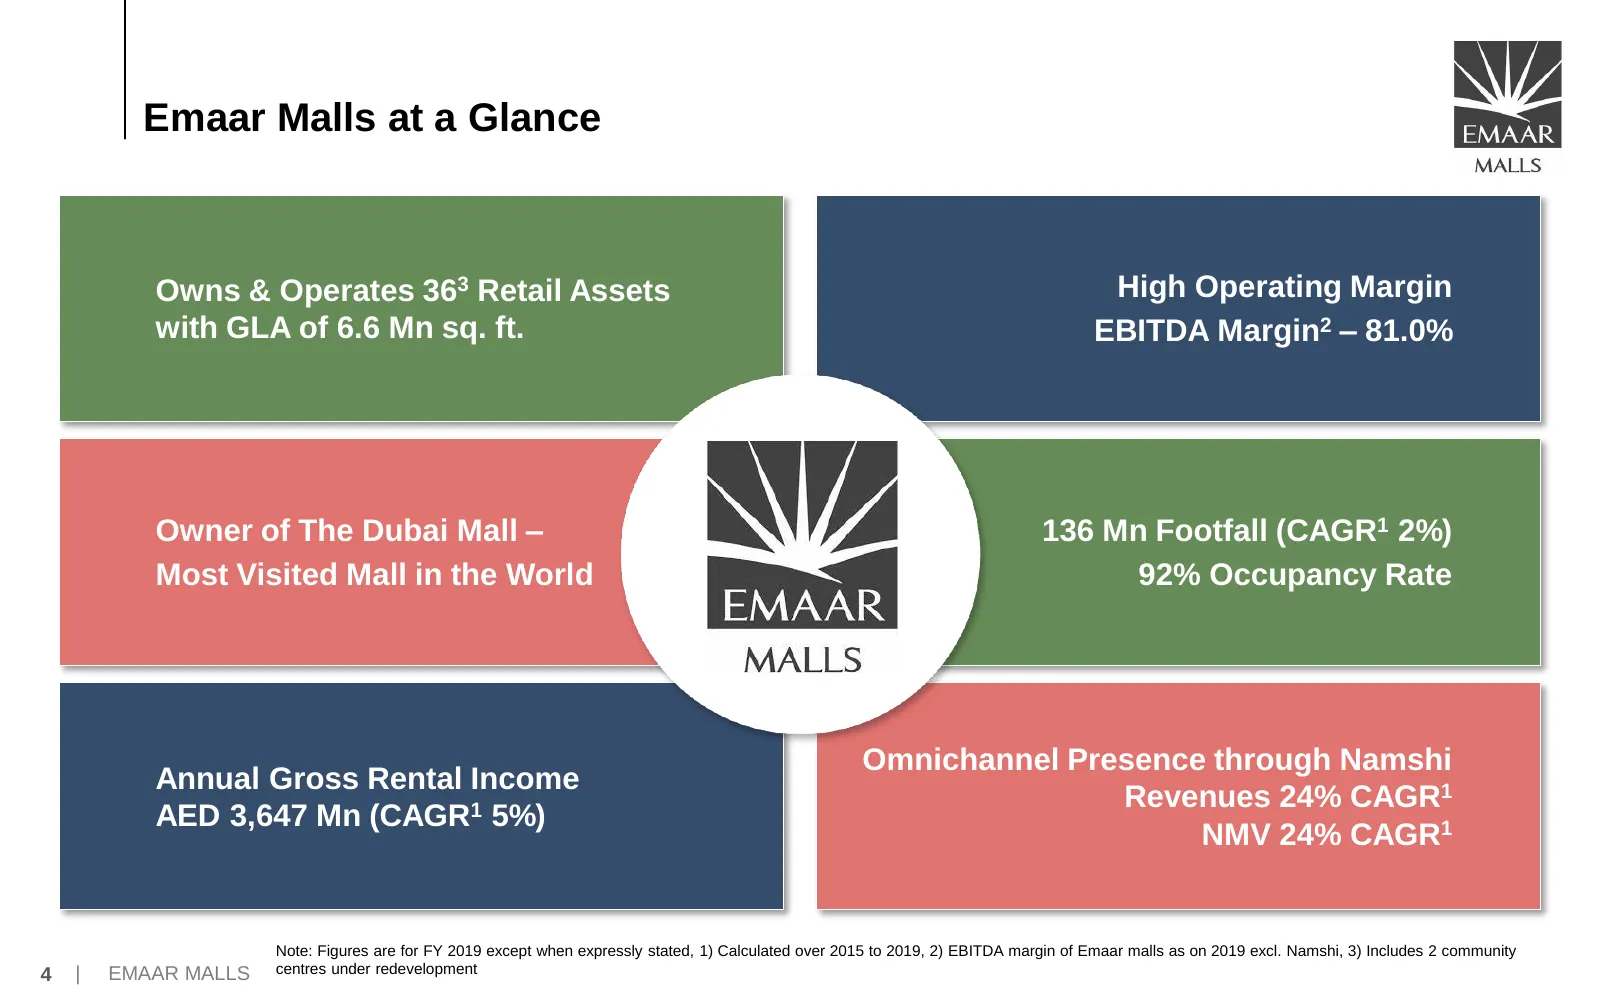
Emaar Malls at a Glance Owns & Operates 363 Retail Assets High Operating Margin with GLA of 6.6 Mn sq. ft. EBITDA Margin2 – 81.0% Owner of The Dubai Mall – 136 Mn Footfall (CAGR1 2%) Most Visited Mall in the World 92% Occupancy Rate Omnichannel Presence through Namshi Annual Gross Rental Income Reve
Slide 6: Strong Performance Track Record
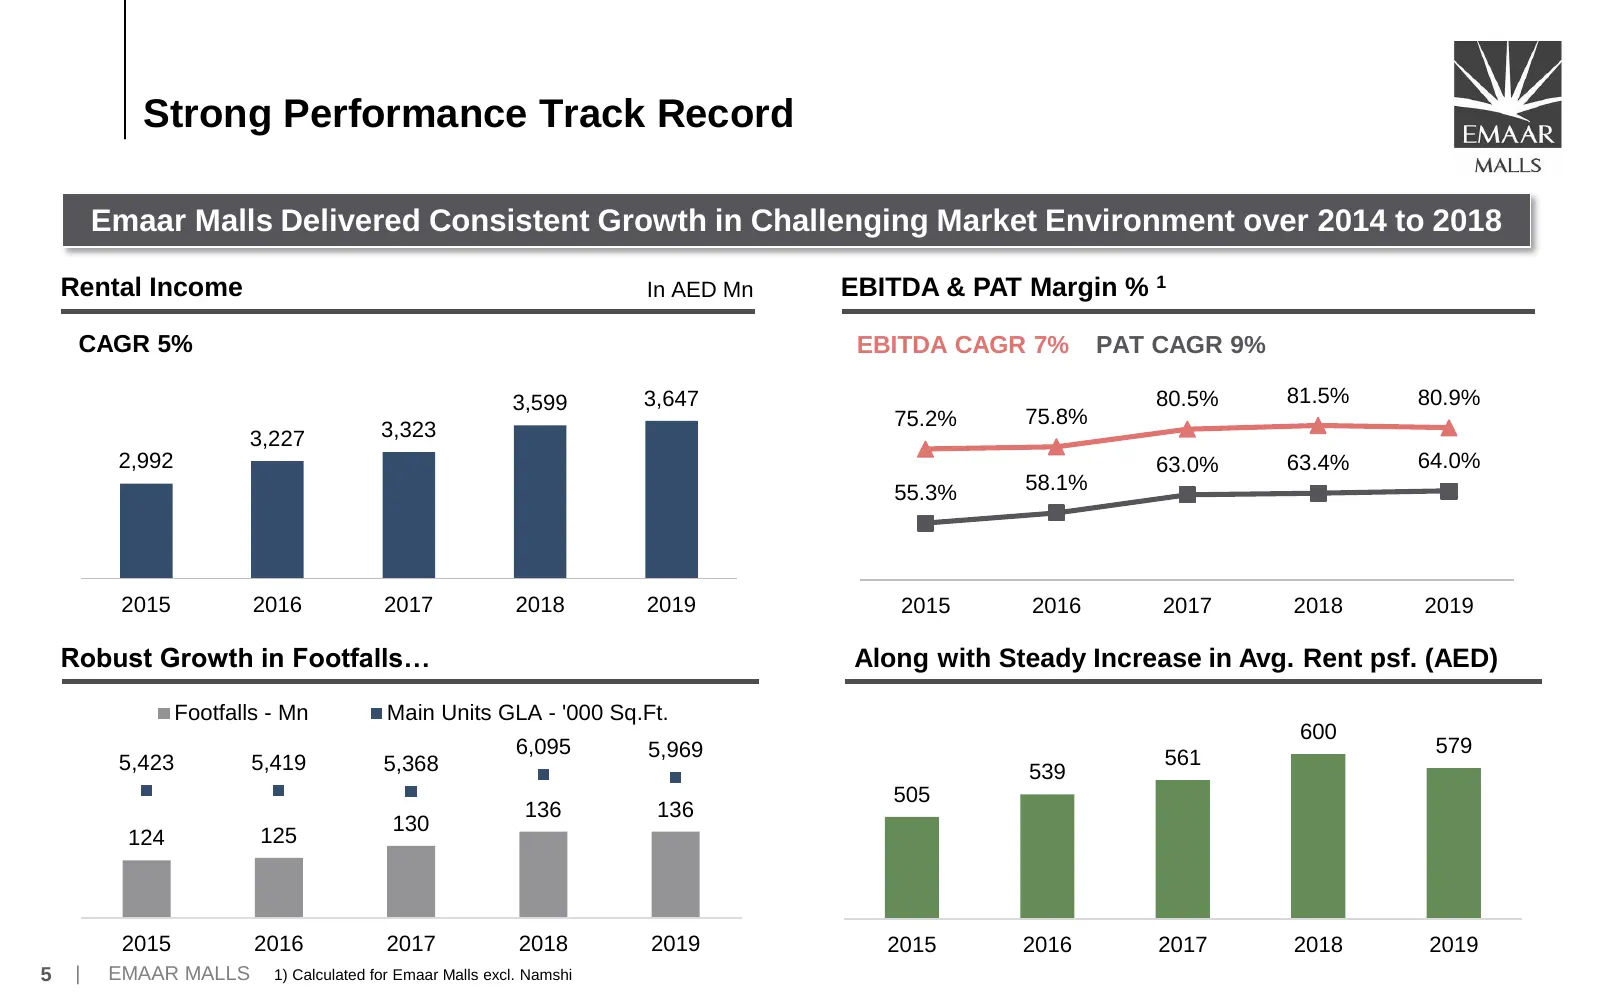
Strong Performance Track Record Emaar Malls Delivered Consistent Growth in Challenging Market Environment over 2014 to 2018 Rental Income In AED Mn EBITDA & PAT Margin % 1 CAGR 5% EBITDA CAGR 7% PAT CAGR 9% 3,599 3,647 80.5% 81.5% 80.9% 75.2% 75.8% 3,227 3,323 2,992 63.0% 63.4% 64.0% 55.3% 58.1% 201
Slide 7: Consistently Outperformed the Retail Market
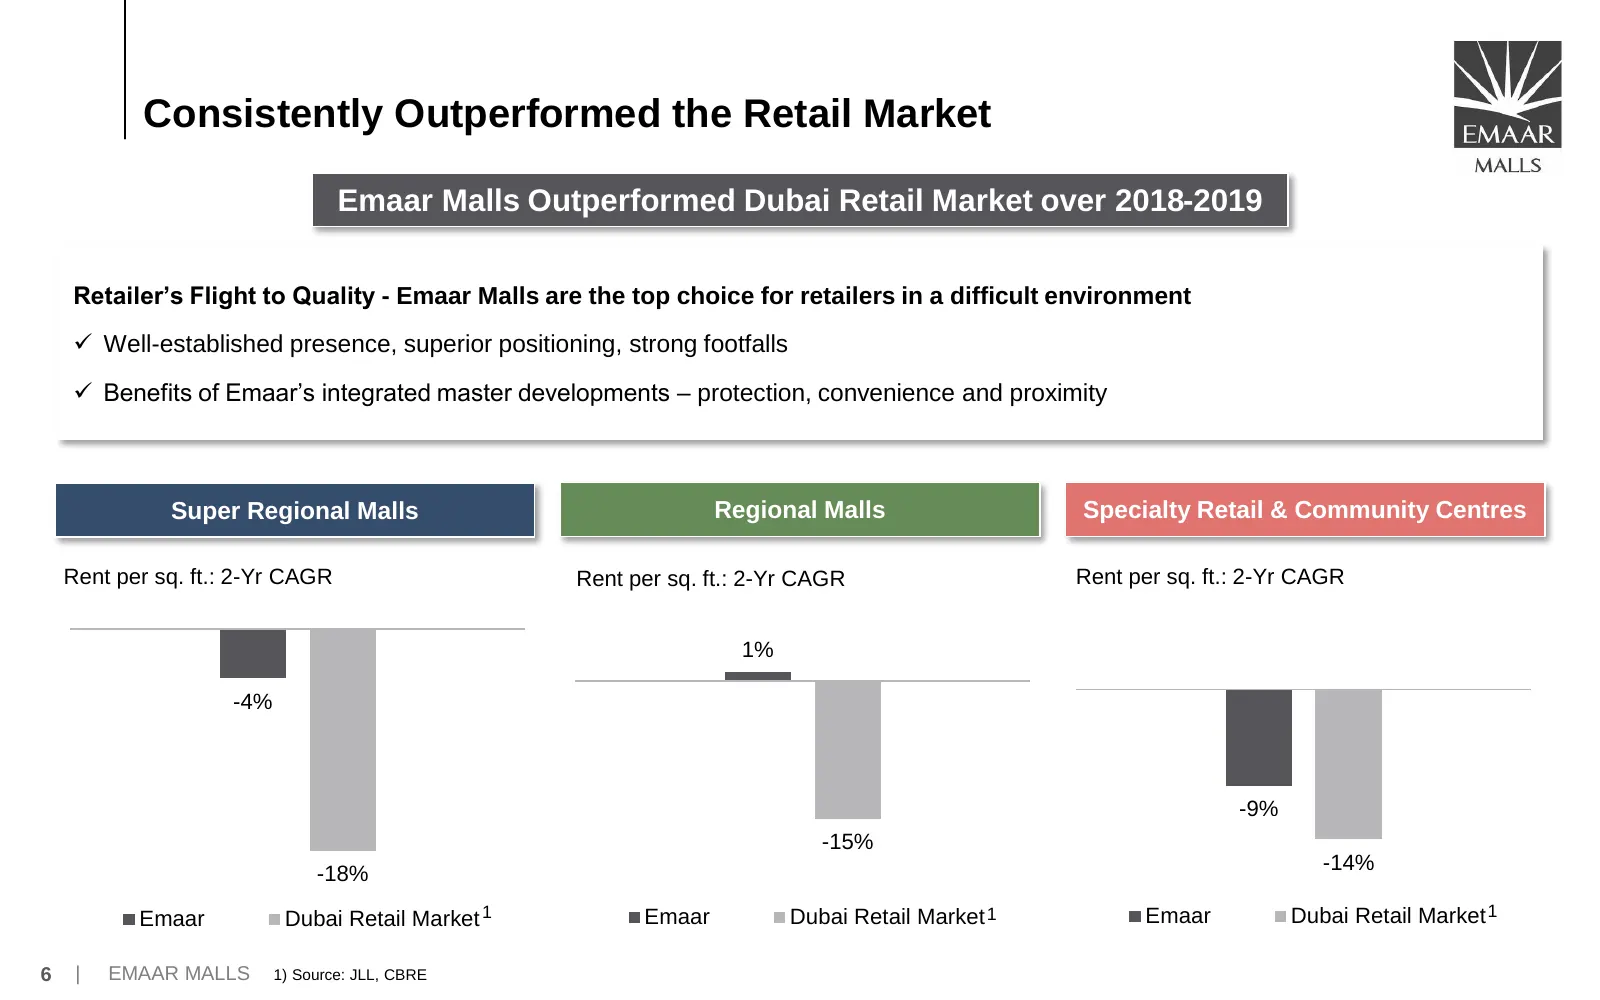
Consistently Outperformed the Retail Market Emaar Malls Outperformed Dubai Retail Market over 2018-2019 Retailer’s Flight to Quality - Emaar Malls are the top choice for retailers in a difficult environment ✓ Well-established presence, superior positioning, strong footfalls ✓ Benefits of Emaar’s int
Slide 8: Healthy Dividend Payout
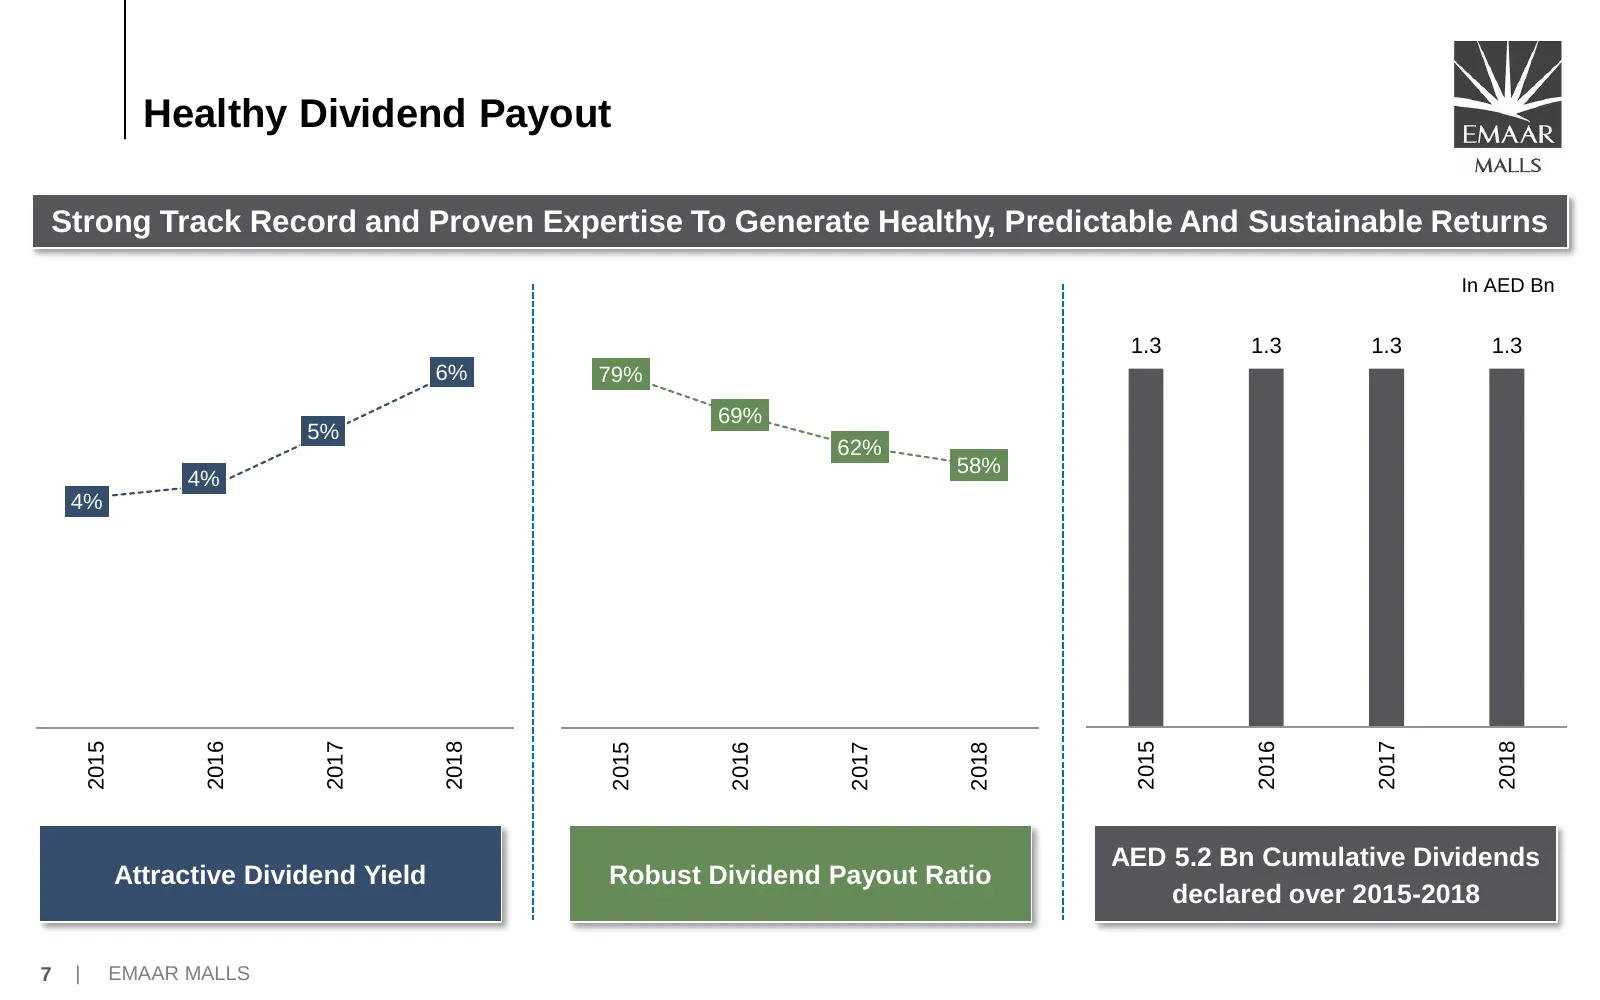
Healthy Dividend Payout Strong Track Record and Proven Expertise To Generate Healthy, Predictable And Sustainable Returns In AED Bn 1.3 1.3 1.3 1.3 6% 79% 69% 5% 62% 58% 4% 4% 2015 2016 2017 2018 2015 2016 2017 2018 2015 2016 2017 2018 AED 5.2 Bn Cumulative Dividends Attractive Dividend Yield Robust
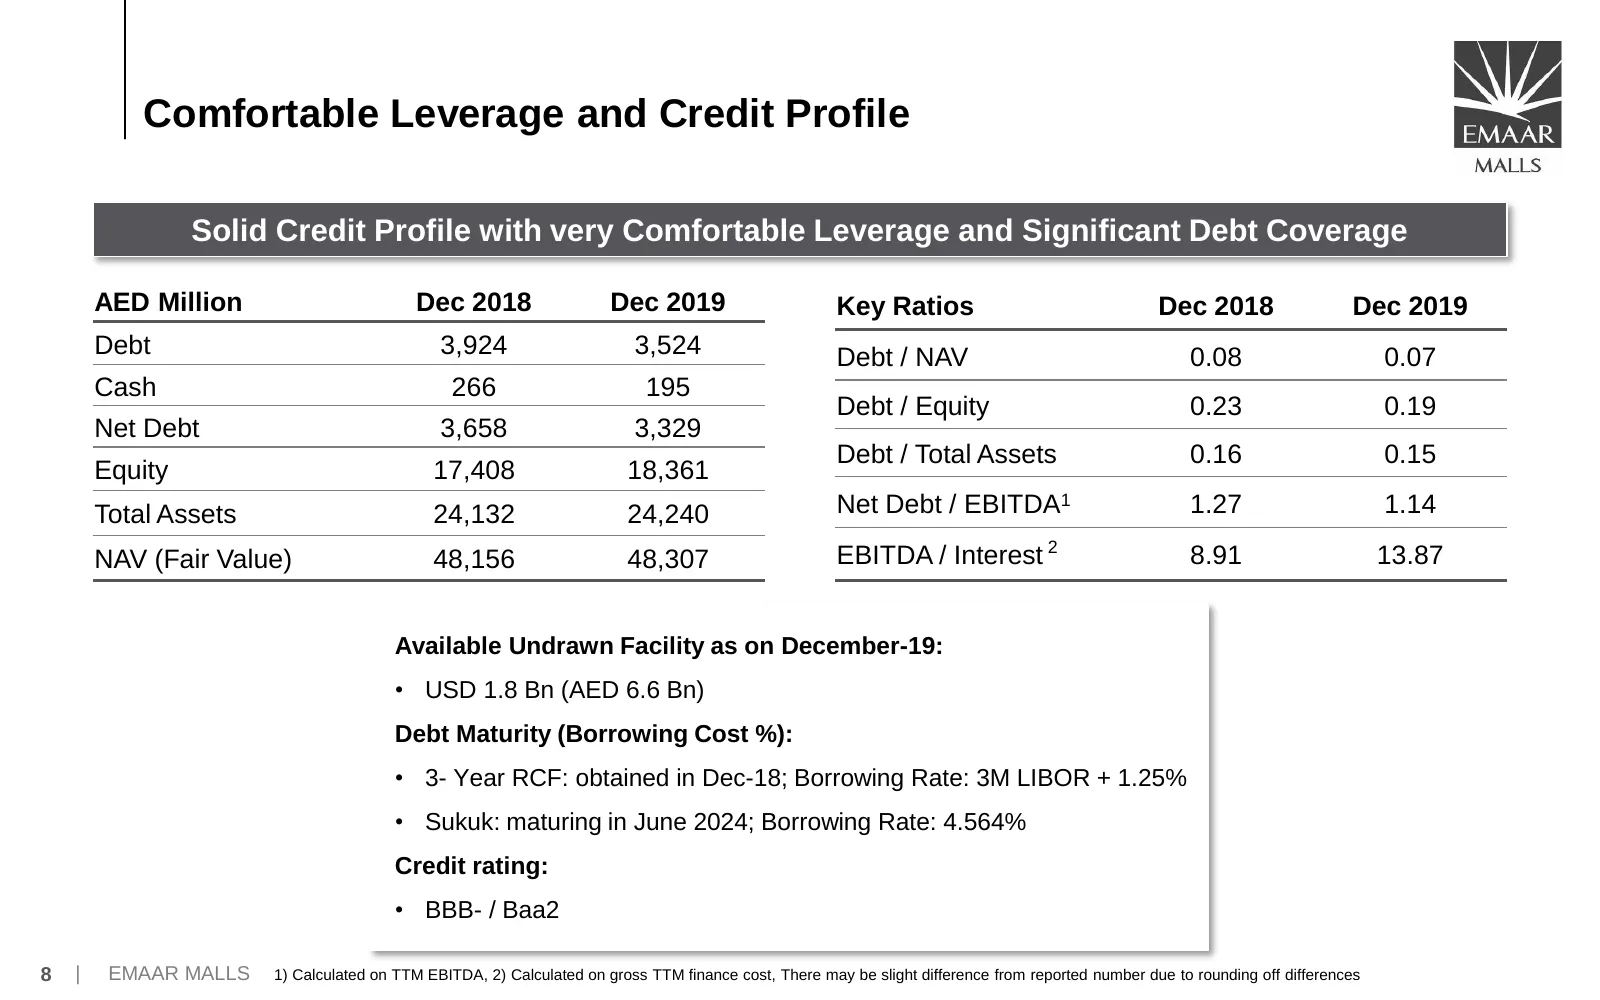
Slide 9: Comfortable Leverage and Credit Profile
Comfortable Leverage and Credit Profile Solid Credit Profile with very Comfortable Leverage and Significant Debt Coverage AED Million Dec 2018 Dec 2019 Key Ratios Dec 2018 Dec 2019 Debt 3,924 3,524 Debt / NAV 0.08 0.07 Cash 266 195 Debt / Equity 0.23 0.19 Net Debt 3,658 3,329 Debt / Total Assets 0.1
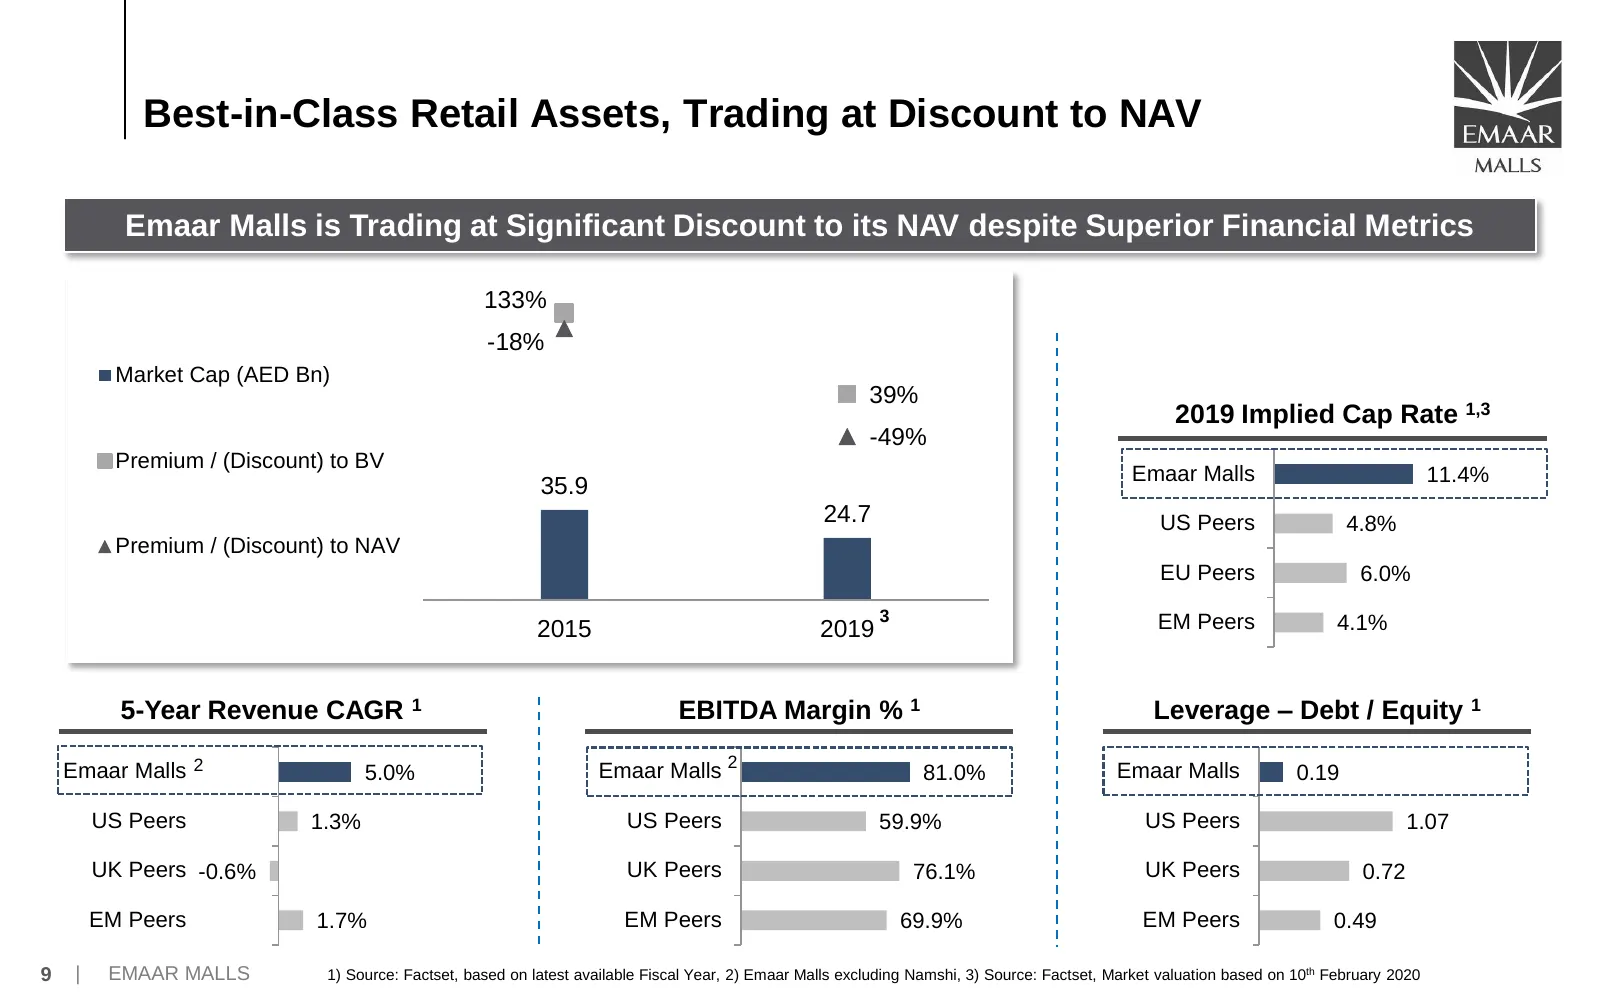
Slide 10: Best-in-Class Retail Assets, Trading at Discount to NAV
Best-in-Class Retail Assets, Trading at Discount to NAV Emaar Malls is Trading at Significant Discount to its NAV despite Superior Financial Metrics 133% -18% Market Cap (AED Bn) 39% 2019 Implied Cap Rate 1,3 -49% Premium / (Discount) to BV Emaar Malls 11.4% 35.9 24.7 US Peers 4.8% Premium / (Discou
Slide 11: Business Overview
Business Overview 10 | EMAAR MALLS
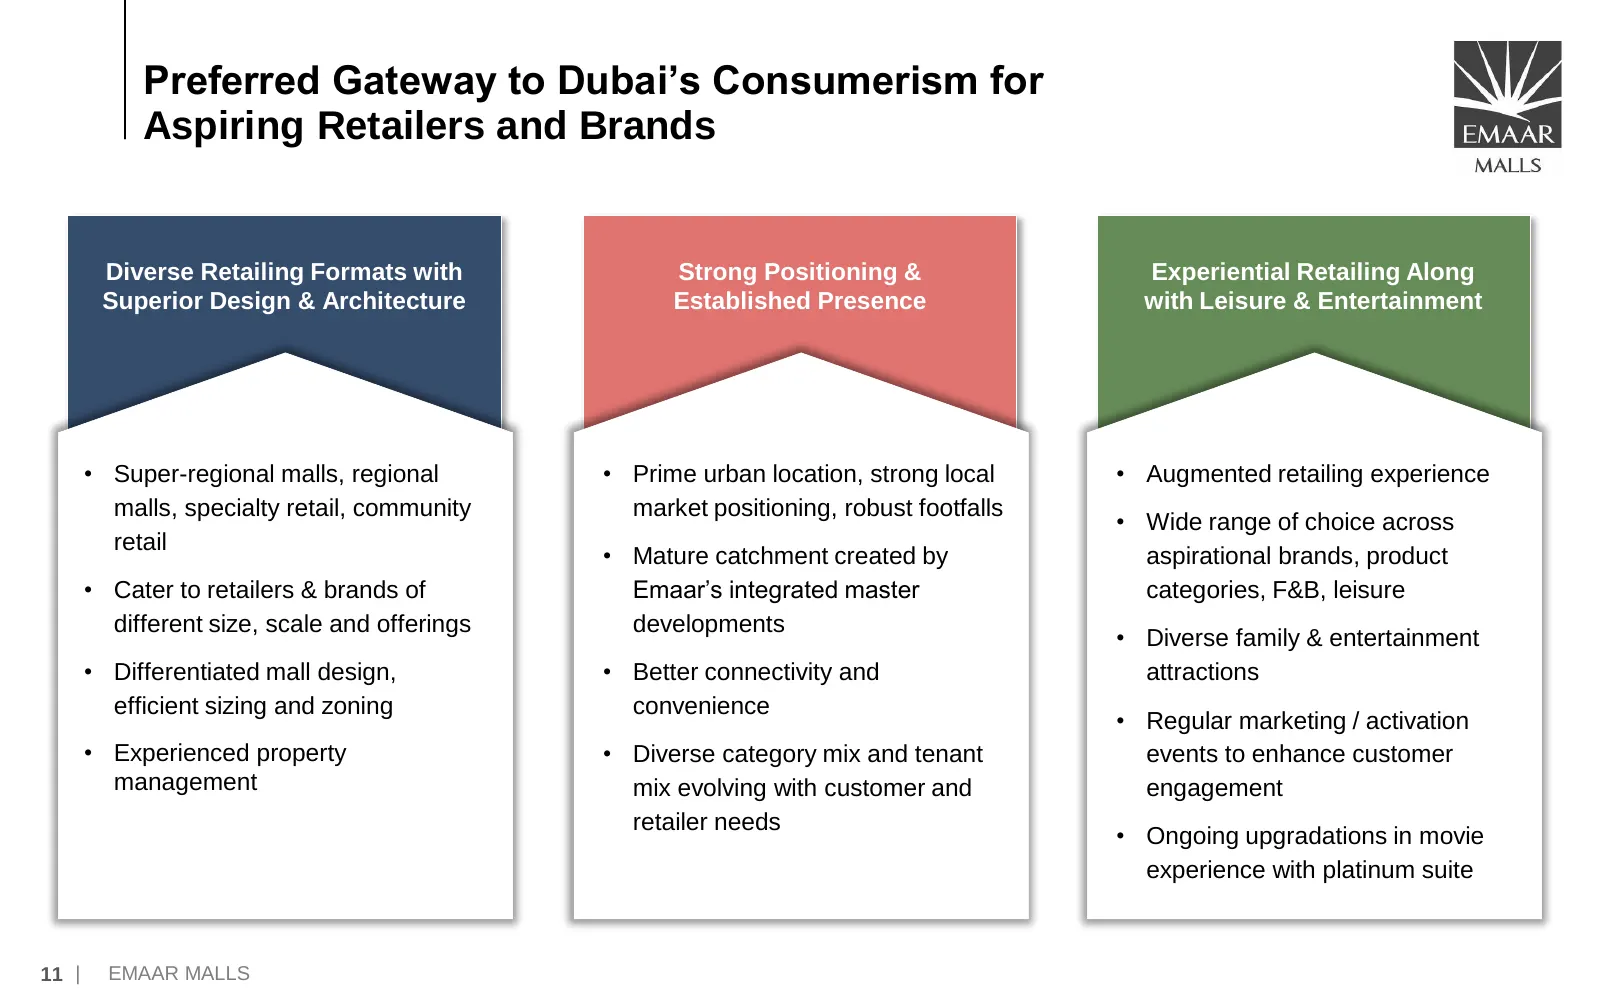
Slide 12: Preferred Gateway to Dubai's Consumerism for Aspiring Retailers and Brands
Preferred Gateway to Dubai’s Consumerism for Aspiring Retailers and Brands Diverse Retailing Formats with Strong Positioning & Experiential Retailing Along Superior Design & Architecture Established Presence with Leisure & Entertainment • Super-regional malls, regional • Prime urban location, strong
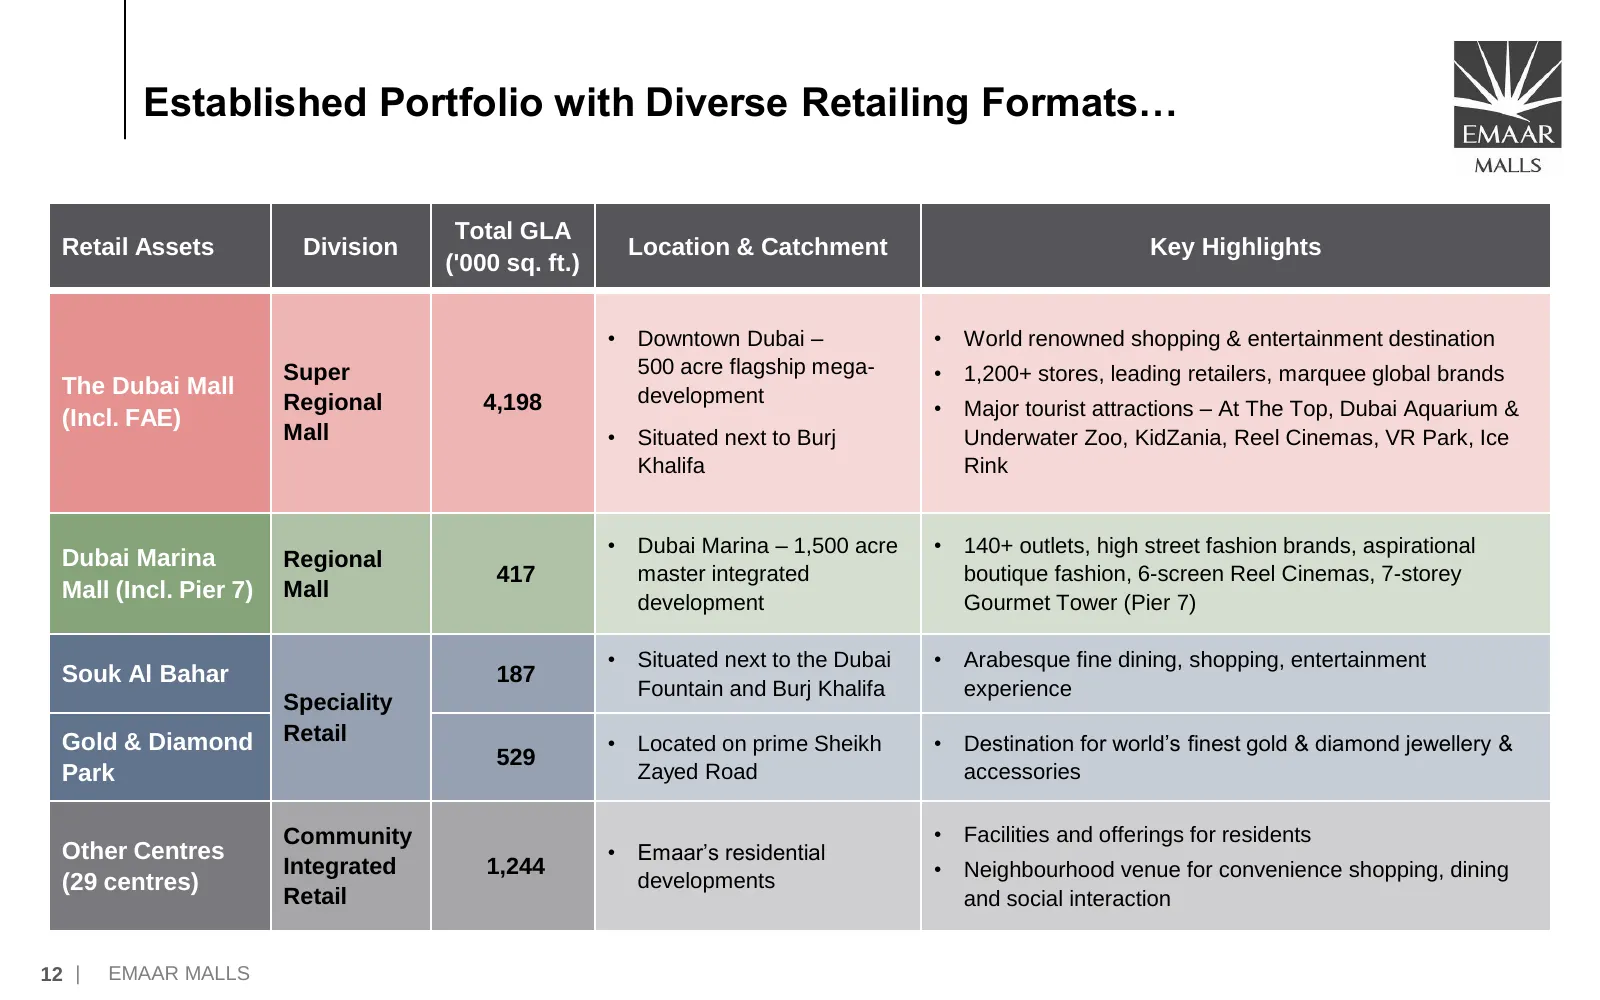
Slide 13: Established Portfolio with Diverse Retailing Formats
Established Portfolio with Diverse Retailing Formats… Total GLA Retail Assets Division Location & Catchment Key Highlights ('000 sq. ft.) • Downtown Dubai – • World renowned shopping & entertainment destination Super 500 acre flagship mega- • 1,200+ stores, leading retailers, marquee global brands T
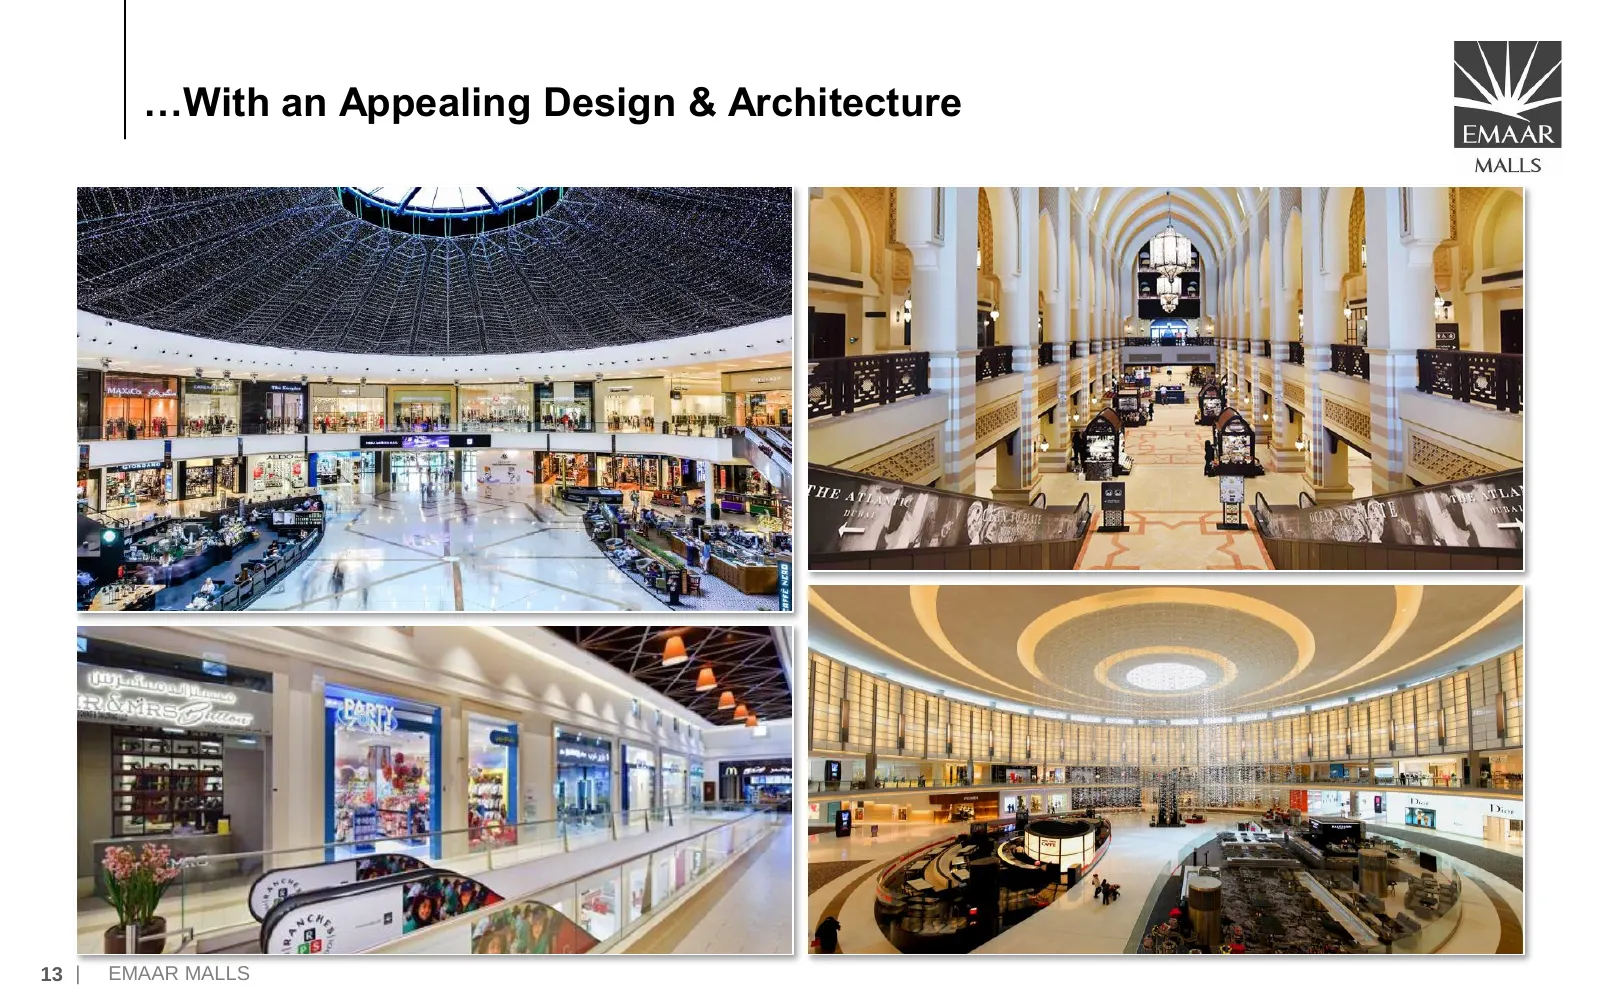
Slide 14: With an Appealing Design & Architecture
…With an Appealing Design & Architecture 13 | EMAAR MALLS
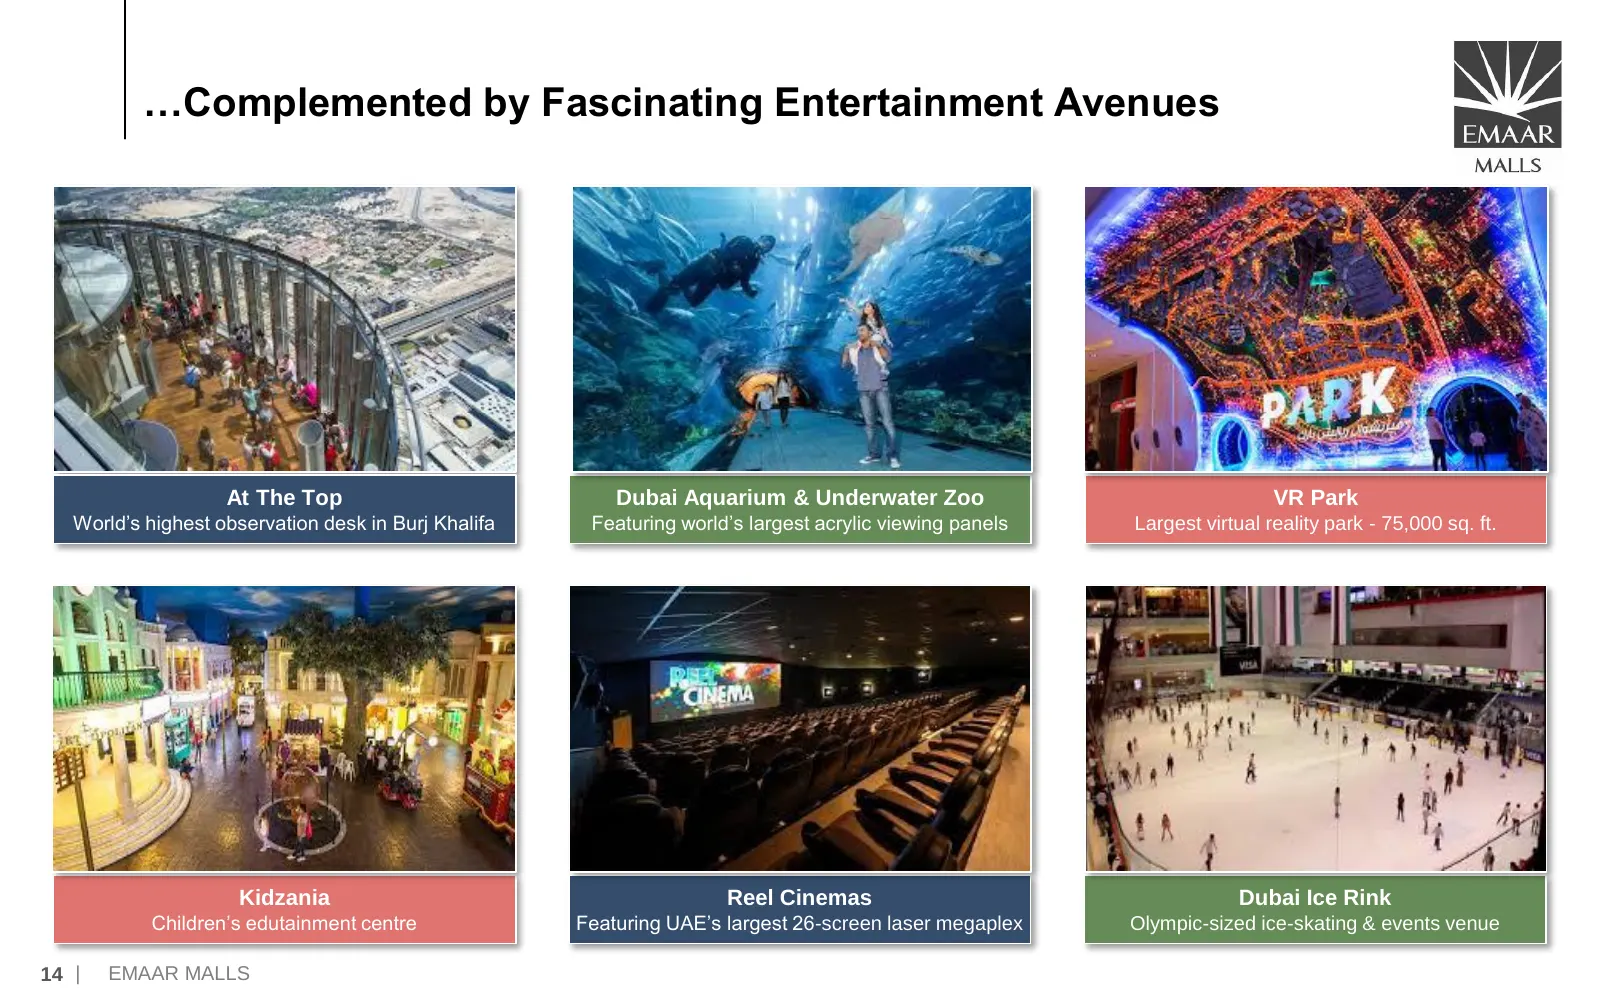
Slide 15: Complemented by Fascinating Entertainment Avenues
…Complemented by Fascinating Entertainment Avenues At The Top Dubai Aquarium & Underwater Zoo VR Park World’s highest observation desk in Burj Khalifa Featuring world’s largest acrylic viewing panels Largest virtual reality park - 75,000 sq. ft. Kidzania Reel Cinemas Dubai Ice Rink Children’s edutai
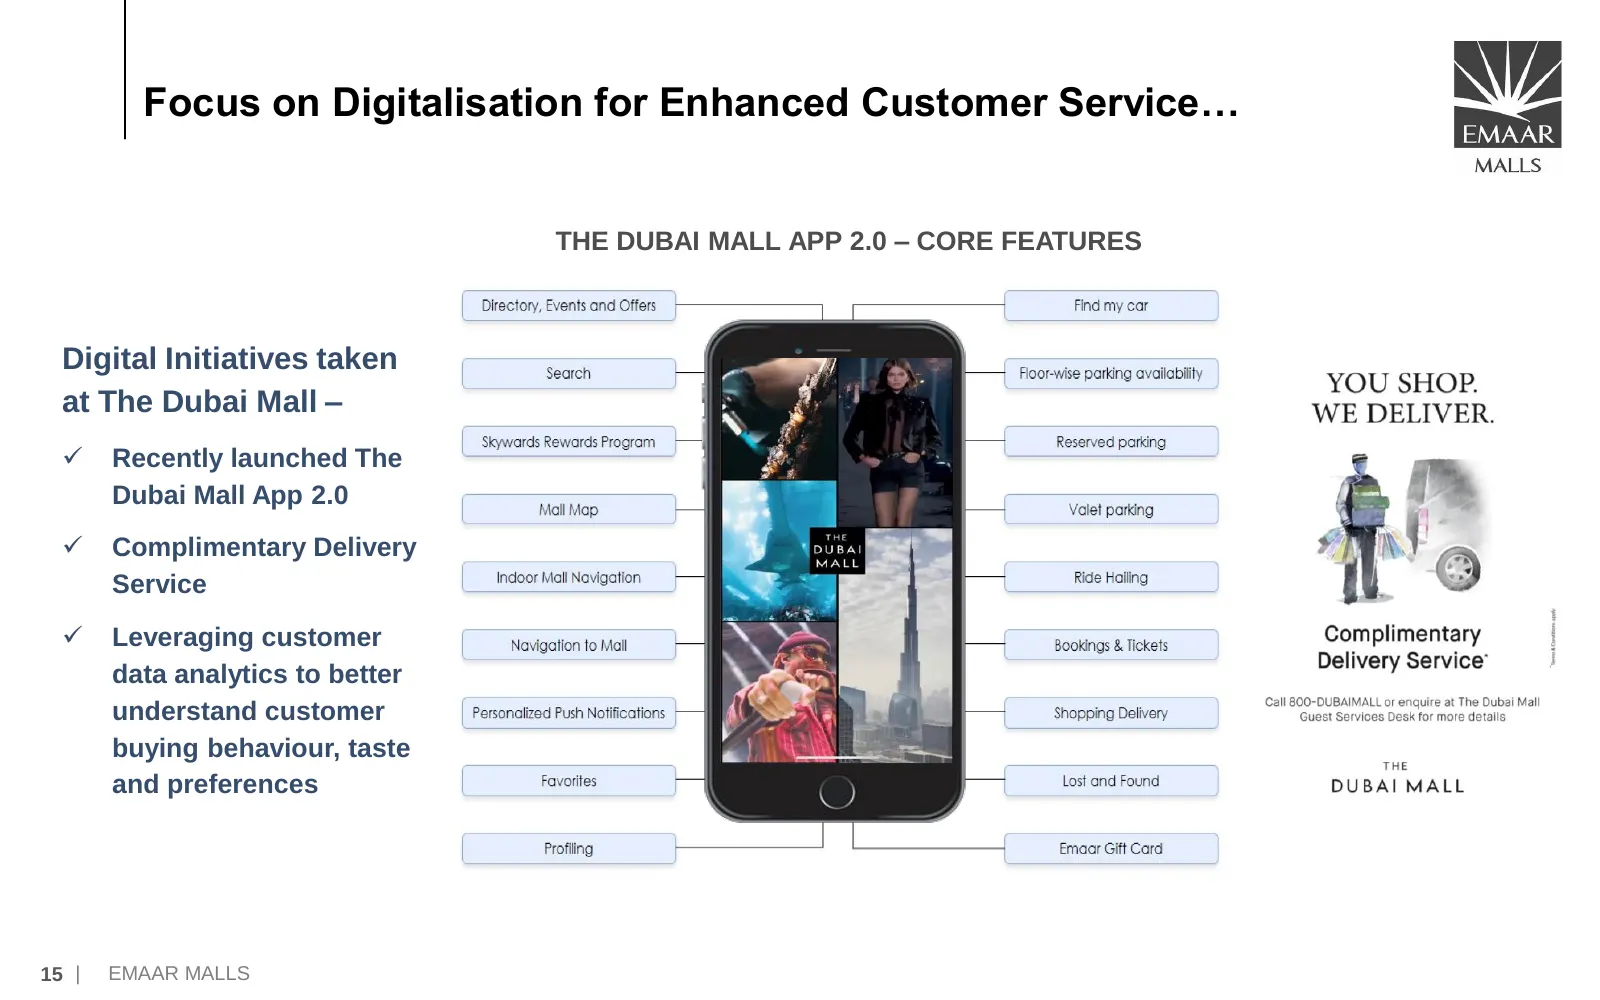
Slide 16: Focus on Digitalisation for Enhanced Customer Service
Focus on Digitalisation for Enhanced Customer Service… THE DUBAI MALL APP 2.0 – CORE FEATURES Digital Initiatives taken at The Dubai Mall – ✓ Recently launched The Dubai Mall App 2.0 ✓ Complimentary Delivery Service ✓ Leveraging customer data analytics to better understand customer buying behaviour,
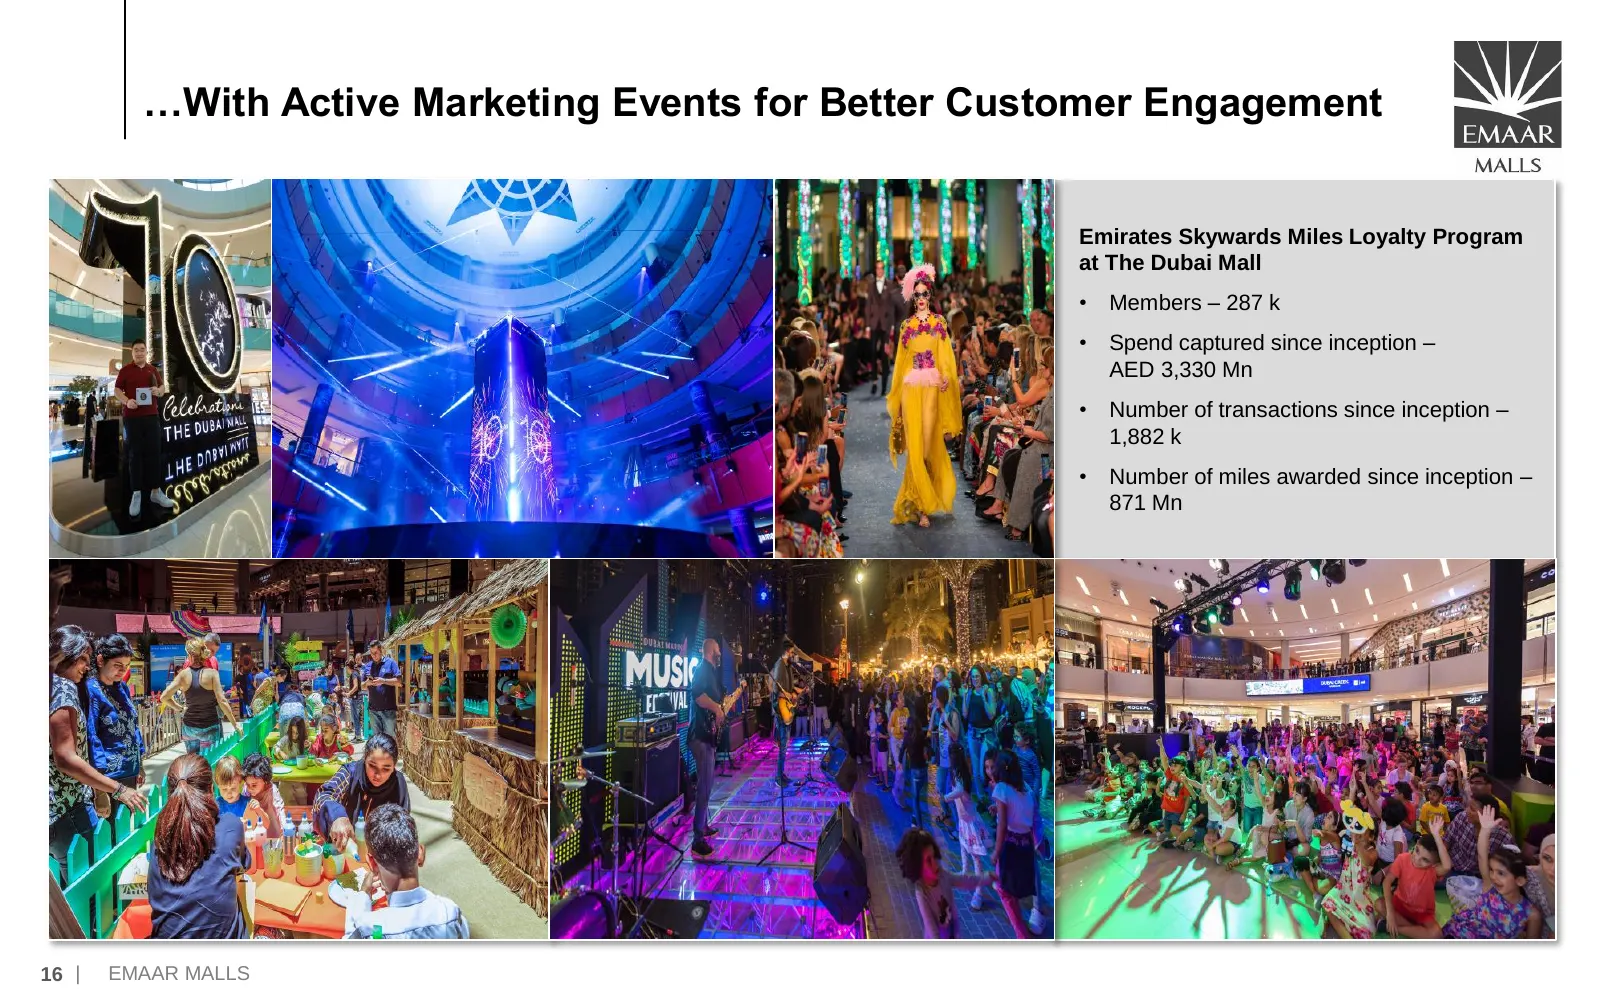
Slide 17: With Active Marketing Events for Better Customer Engagement
…With Active Marketing Events for Better Customer Engagement Emirates Skywards Miles Loyalty Program at The Dubai Mall • Members – 287 k • Spend captured since inception – AED 3,330 Mn • Number of transactions since inception – 1,882 k • Number of miles awarded since inception – 871 Mn 16 | EMAAR MA
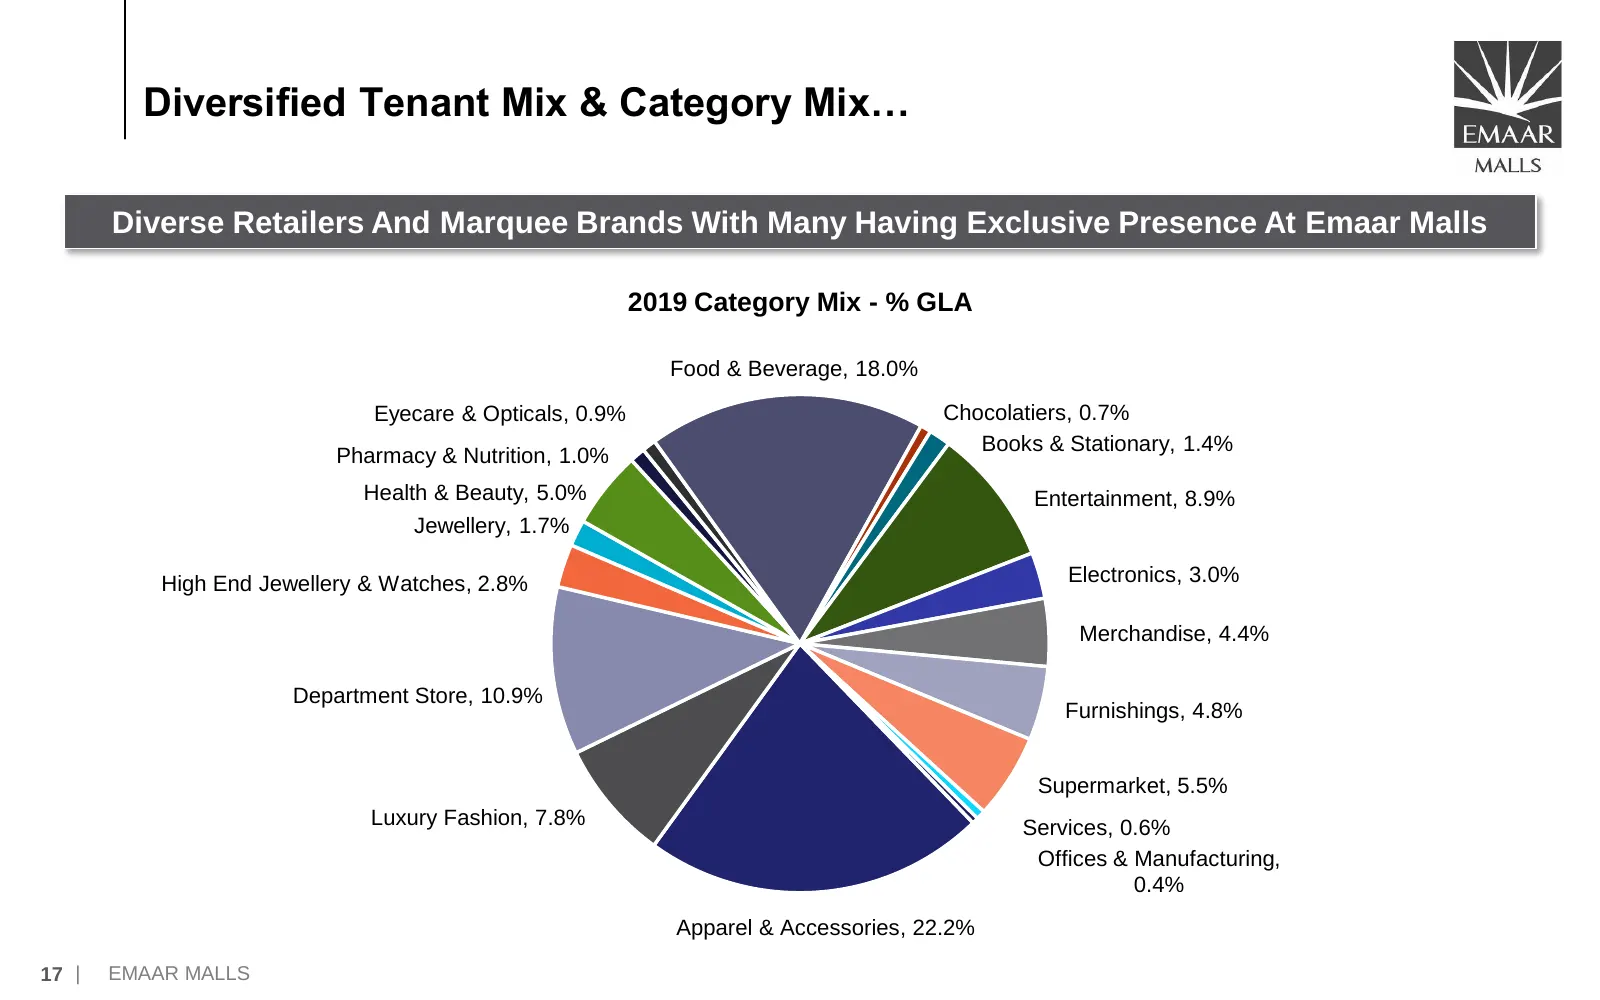
Slide 18: Diversified Tenant Mix & Category Mix
Diversified Tenant Mix & Category Mix… Diverse Retailers And Marquee Brands With Many Having Exclusive Presence At Emaar Malls 2019 Category Mix - % GLA Food & Beverage, 18.0% Eyecare & Opticals, 0.9% Chocolatiers, 0.7% Books & Stationary, 1.4% Pharmacy & Nutrition, 1.0% Health & Beauty, 5.0% Entert
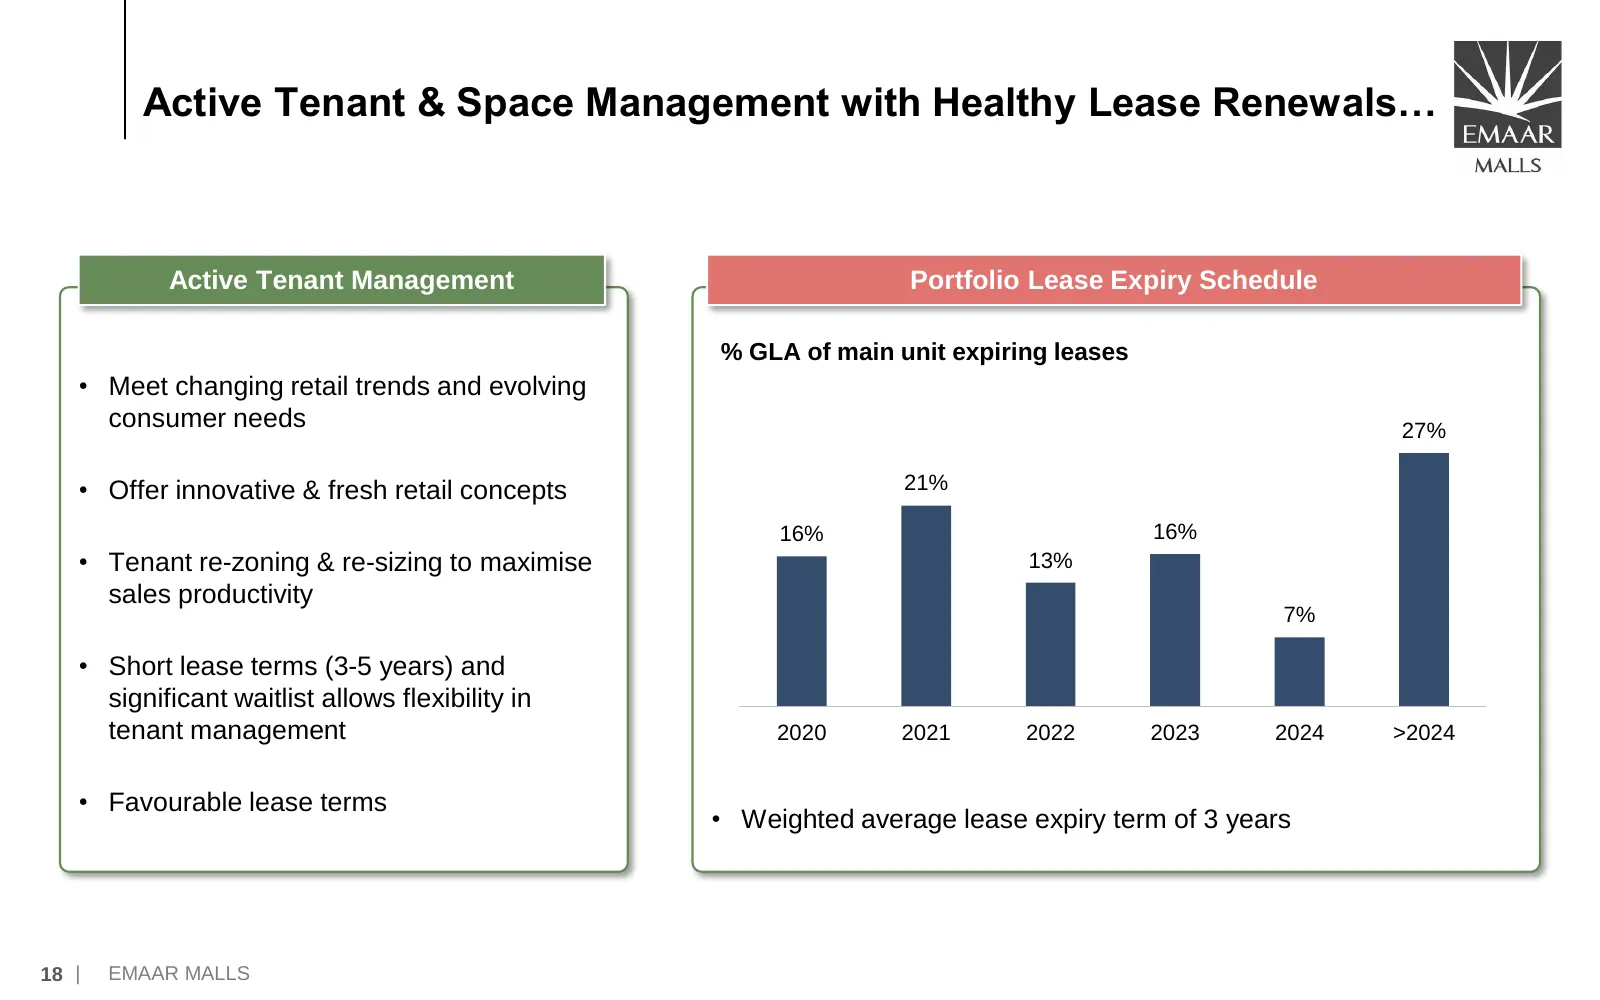
Slide 19: Active Tenant & Space Management with Healthy Lease Renewals
Active Tenant & Space Management with Healthy Lease Renewals… Active Tenant Management Portfolio Lease Expiry Schedule % GLA of main unit expiring leases • Meet changing retail trends and evolving consumer needs 27% • Offer innovative & fresh retail concepts 21% 16% 16% • Tenant re-zoning & re-sizin
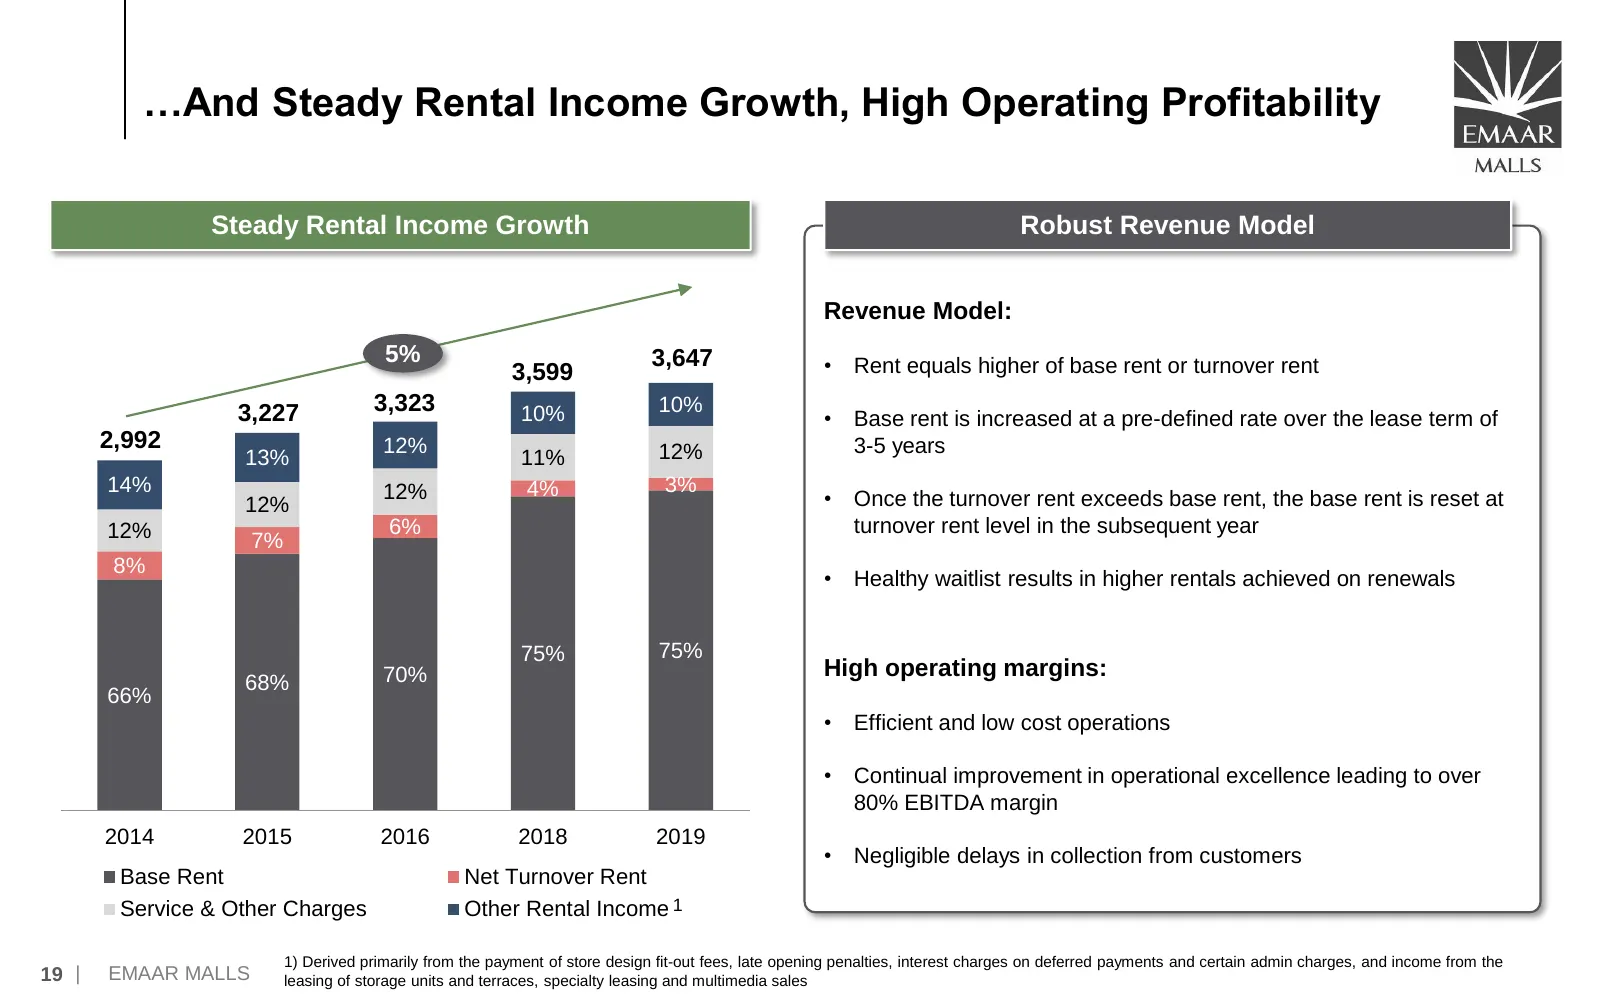
Slide 20: Steady Rental Income Growth, High Operating Profitability
…And Steady Rental Income Growth, High Operating Profitability Steady Rental Income Growth Robust Revenue Model Revenue Model: 5% 3,647 • Rent equals higher of base rent or turnover rent 3,599 3,227 3,323 10% 10% • Base rent is increased at a pre-defined rate over the lease term of 2,992 12% 12% 3-5
Slide 21: Omni-channel Presence Through Namshi
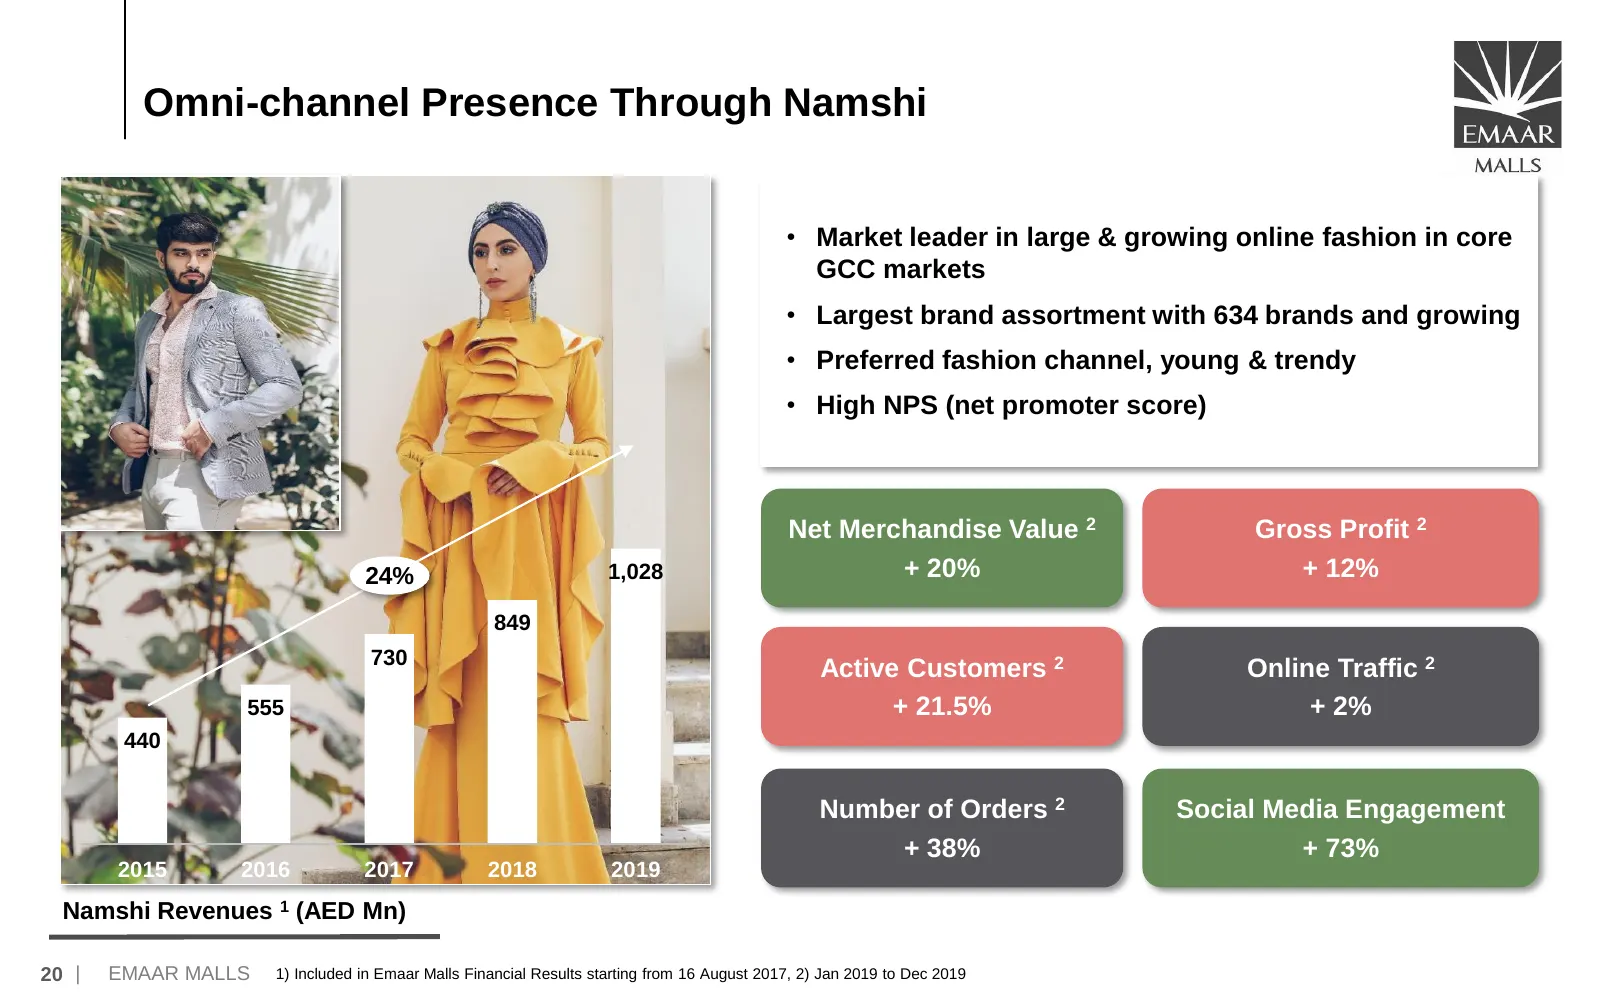
Omni-channel Presence Through Namshi • Market leader in large & growing online fashion in core GCC markets • Largest brand assortment with 634 brands and growing • Preferred fashion channel, young & trendy • High NPS (net promoter score) Net Merchandise Value 2 Gross Profit 2 24% 1,028 + 20% + 12% 8
Slide 22: Omni-channel Presence Through Namshi (Contd.)
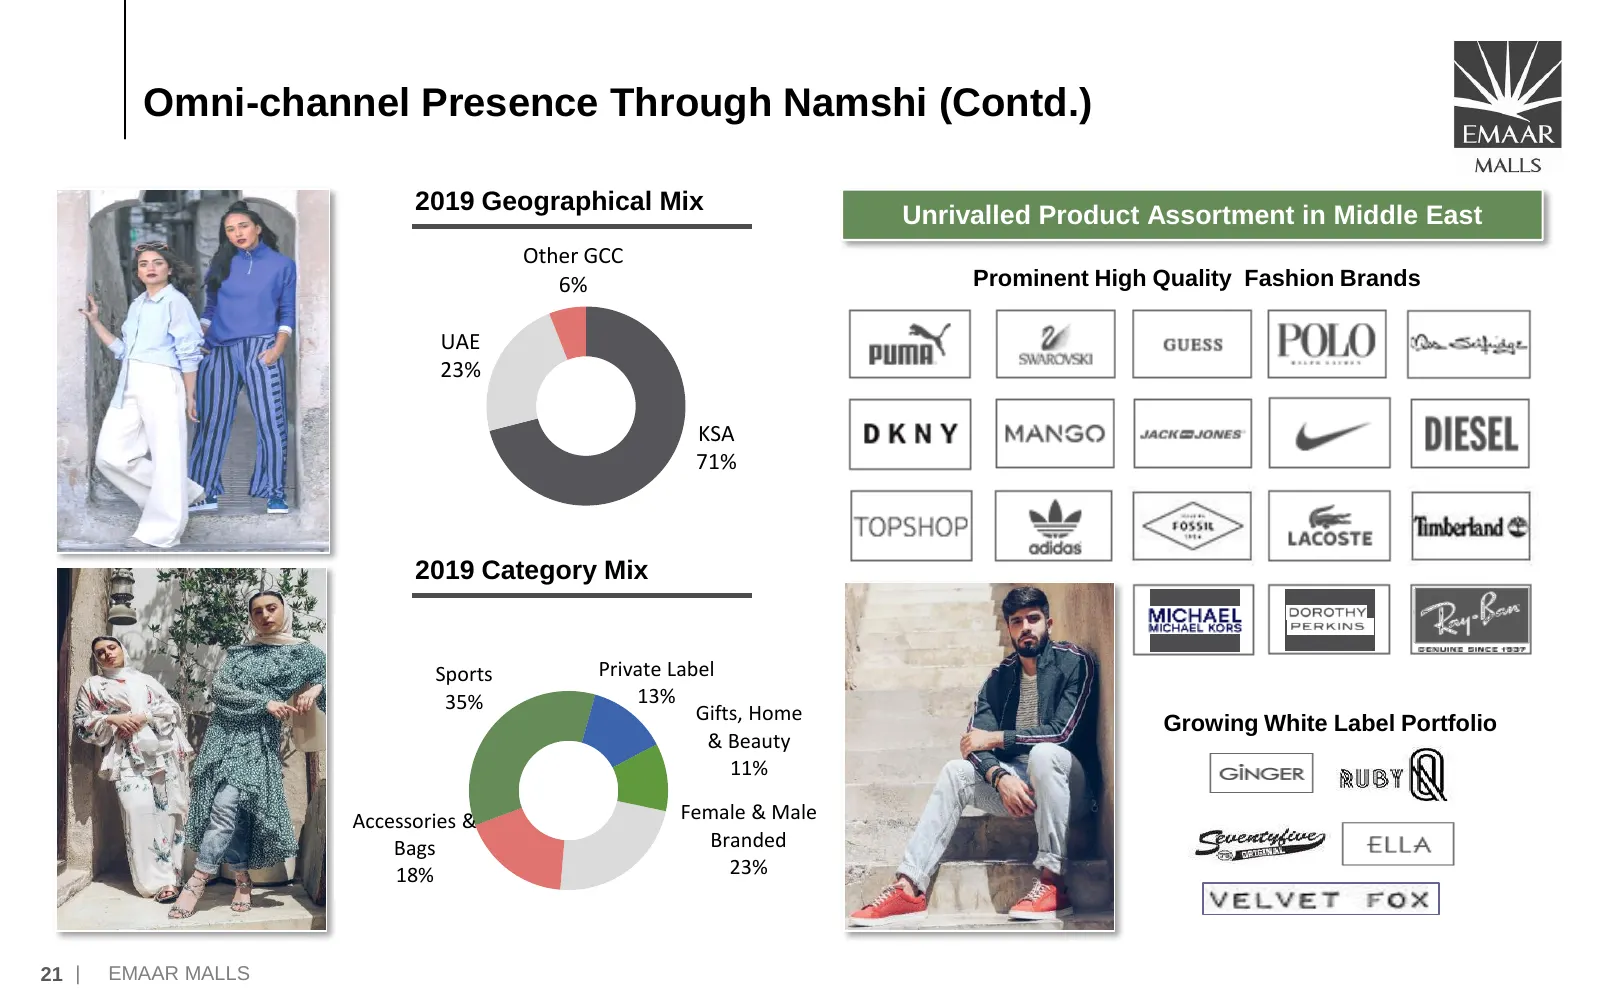
Omni-channel Presence Through Namshi (Contd.) 2019 Geographical Mix Unrivalled Product Assortment in Middle East Other GCC 6% Prominent High Quality Fashion Brands UAE 23% KSA 71% 2019 Category Mix Sports Private Label 35% 13% Gifts, Home Growing White Label Portfolio & Beauty 11% Accessories & Fema
Slide 23: Sustainability Initiatives
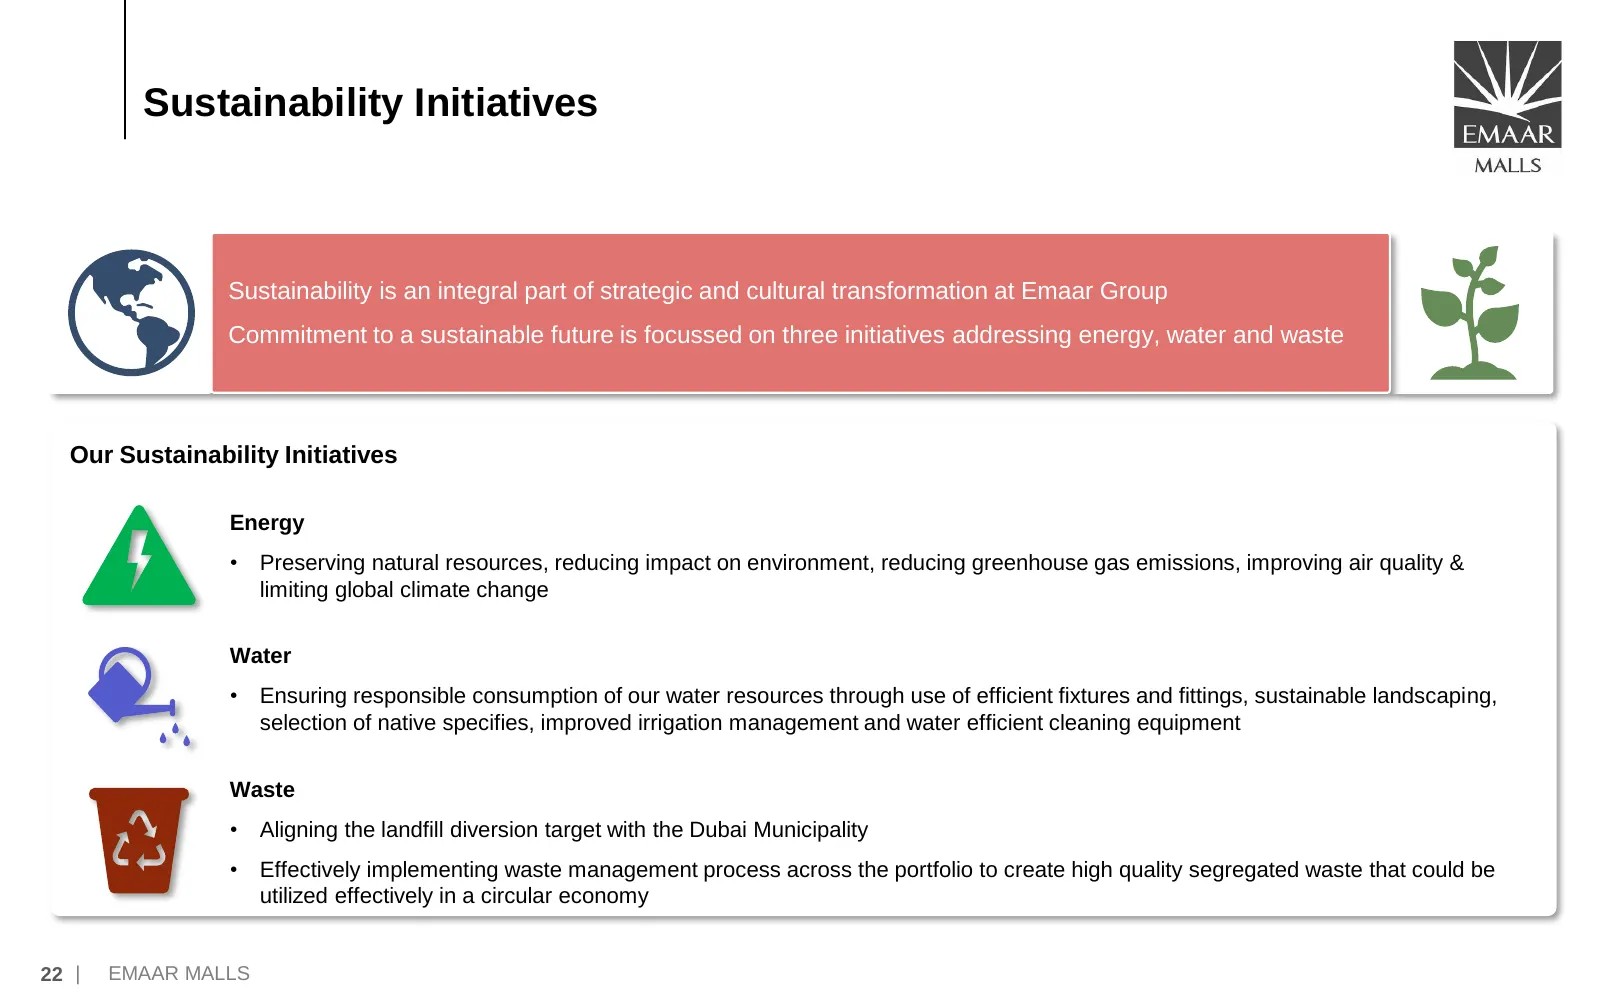
Sustainability Initiatives Sustainability is an integral part of strategic and cultural transformation at Emaar Group Commitment to a sustainable future is focussed on three initiatives addressing energy, water and waste Our Sustainability Initiatives Energy • Preserving natural resources, reducing
Slide 24: Business Strategy & Outlook
Business Strategy & Outlook 23 | EMAAR MALLS
Slide 25: Multi-format Omni-channel Growth Strategy
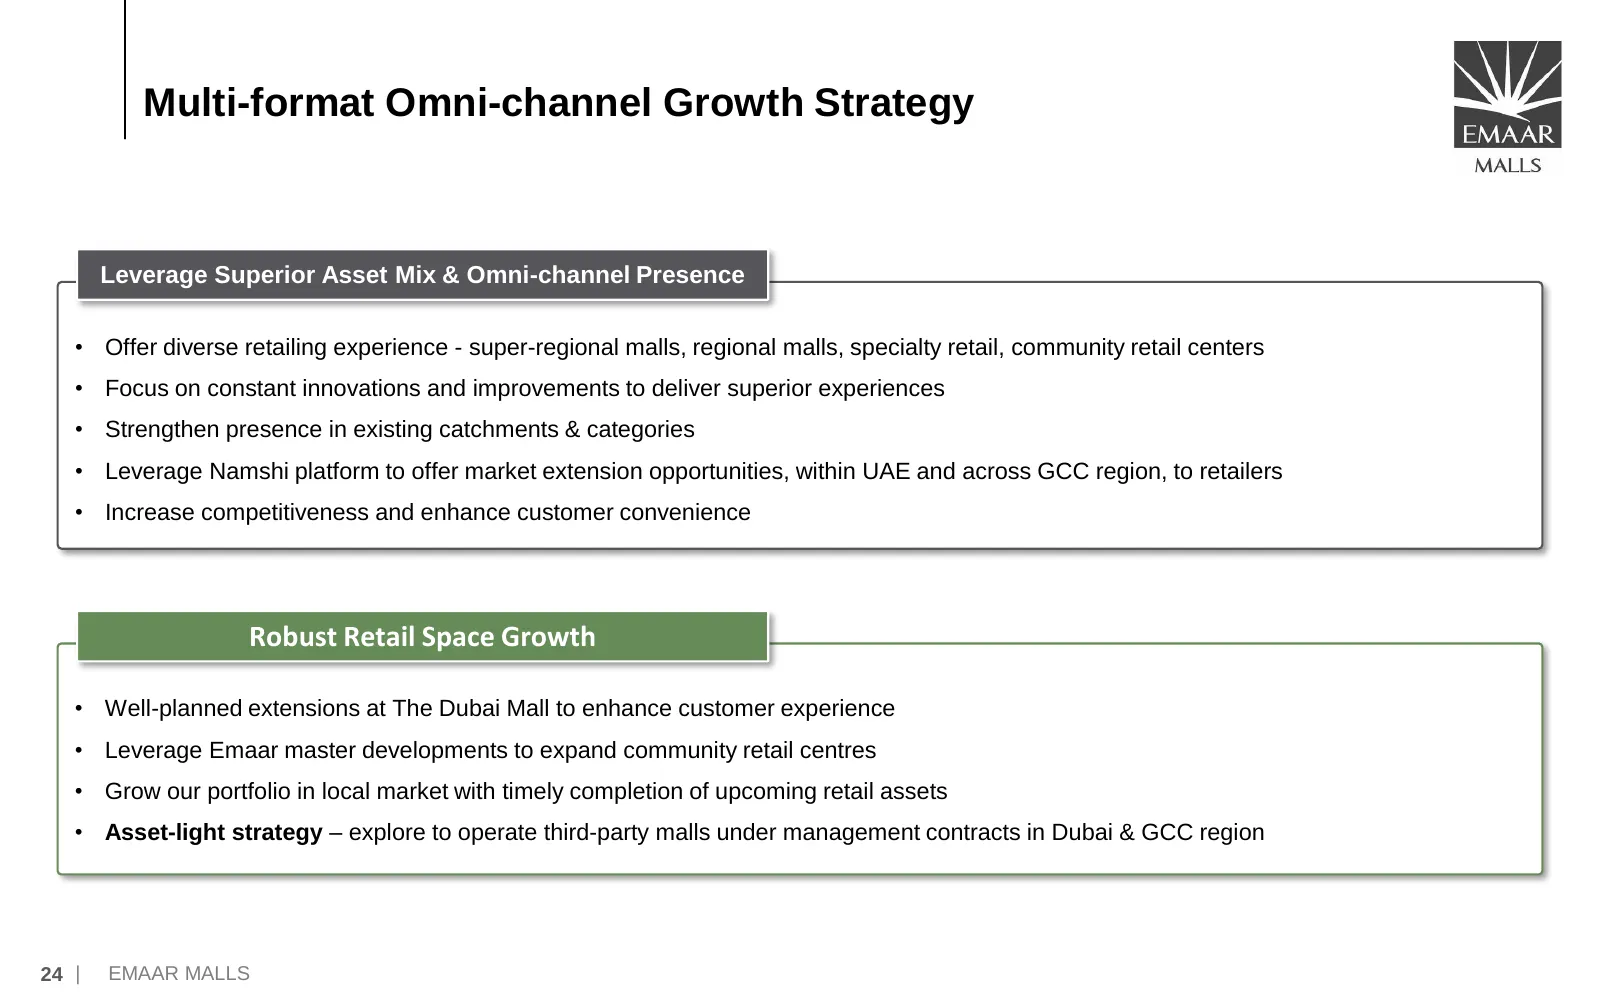
Multi-format Omni-channel Growth Strategy Leverage Superior Asset Mix & Omni-channel Presence • Offer diverse retailing experience - super-regional malls, regional malls, specialty retail, community retail centers • Focus on constant innovations and improvements to deliver superior experiences • Str
Slide 26: Adopt Low-Risk Model For Future Expansions
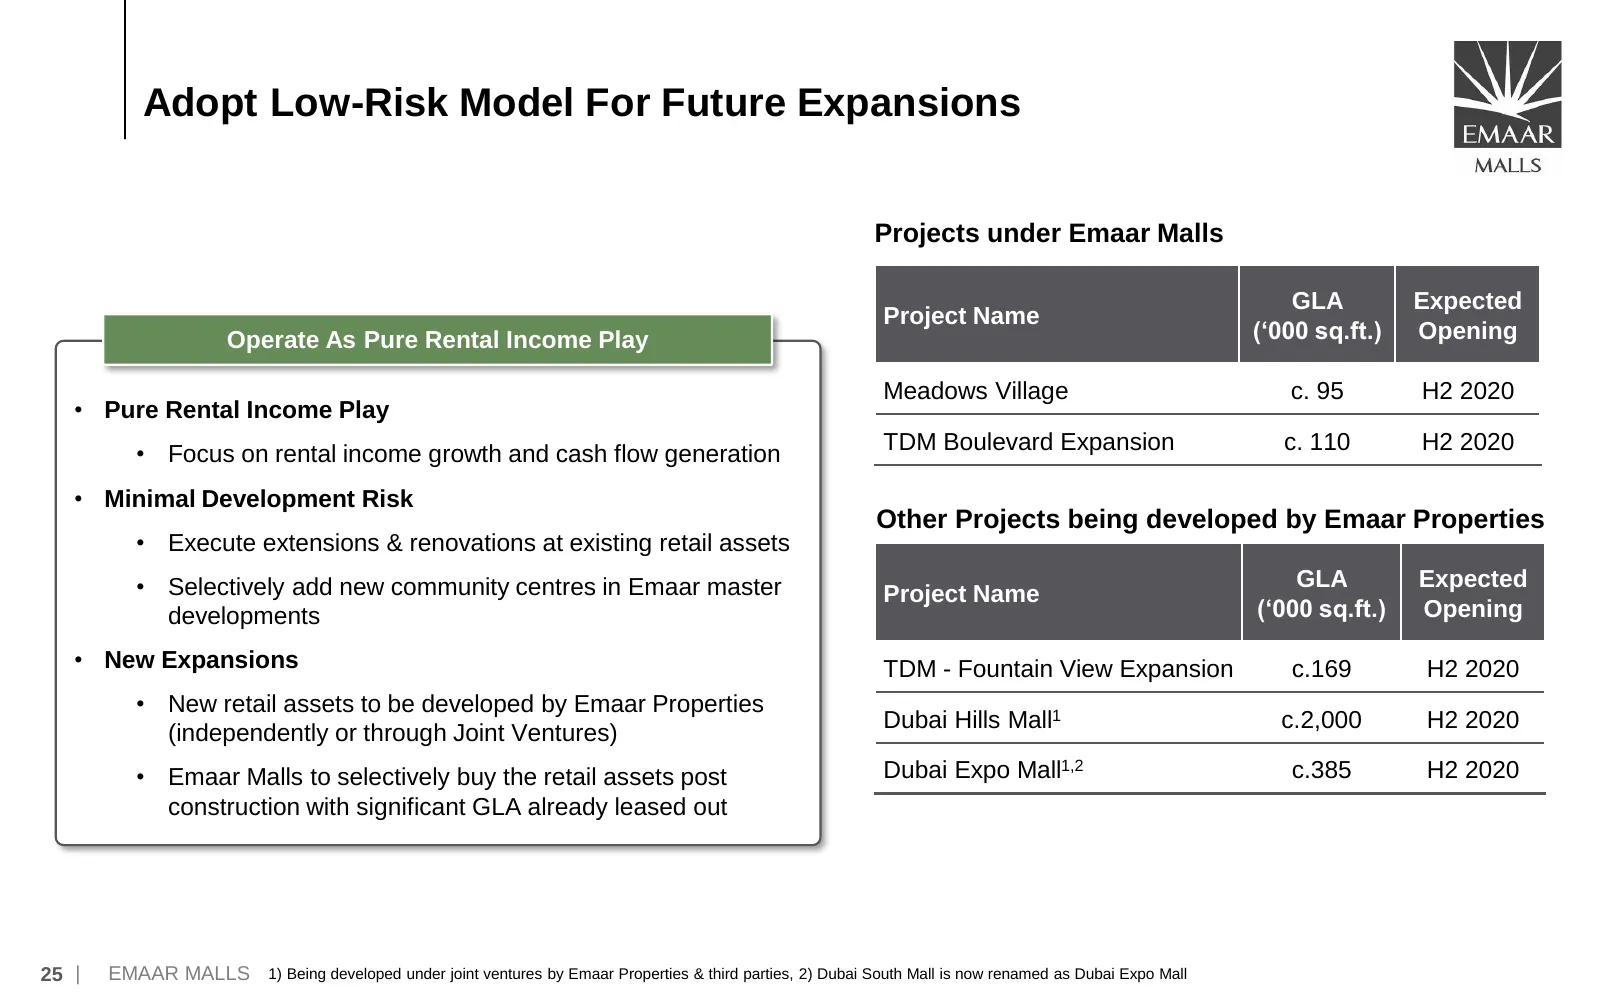
Adopt Low-Risk Model For Future Expansions Projects under Emaar Malls GLA Expected Project Name Operate As Pure Rental Income Play (‘000 sq.ft.) Opening Meadows Village c. 95 H2 2020 • Pure Rental Income Play TDM Boulevard Expansion c. 110 H2 2020 • Focus on rental income growth and cash flow genera
Slide 27: New Expansions – Strong Growth Potential (Dubai Hills Mall)
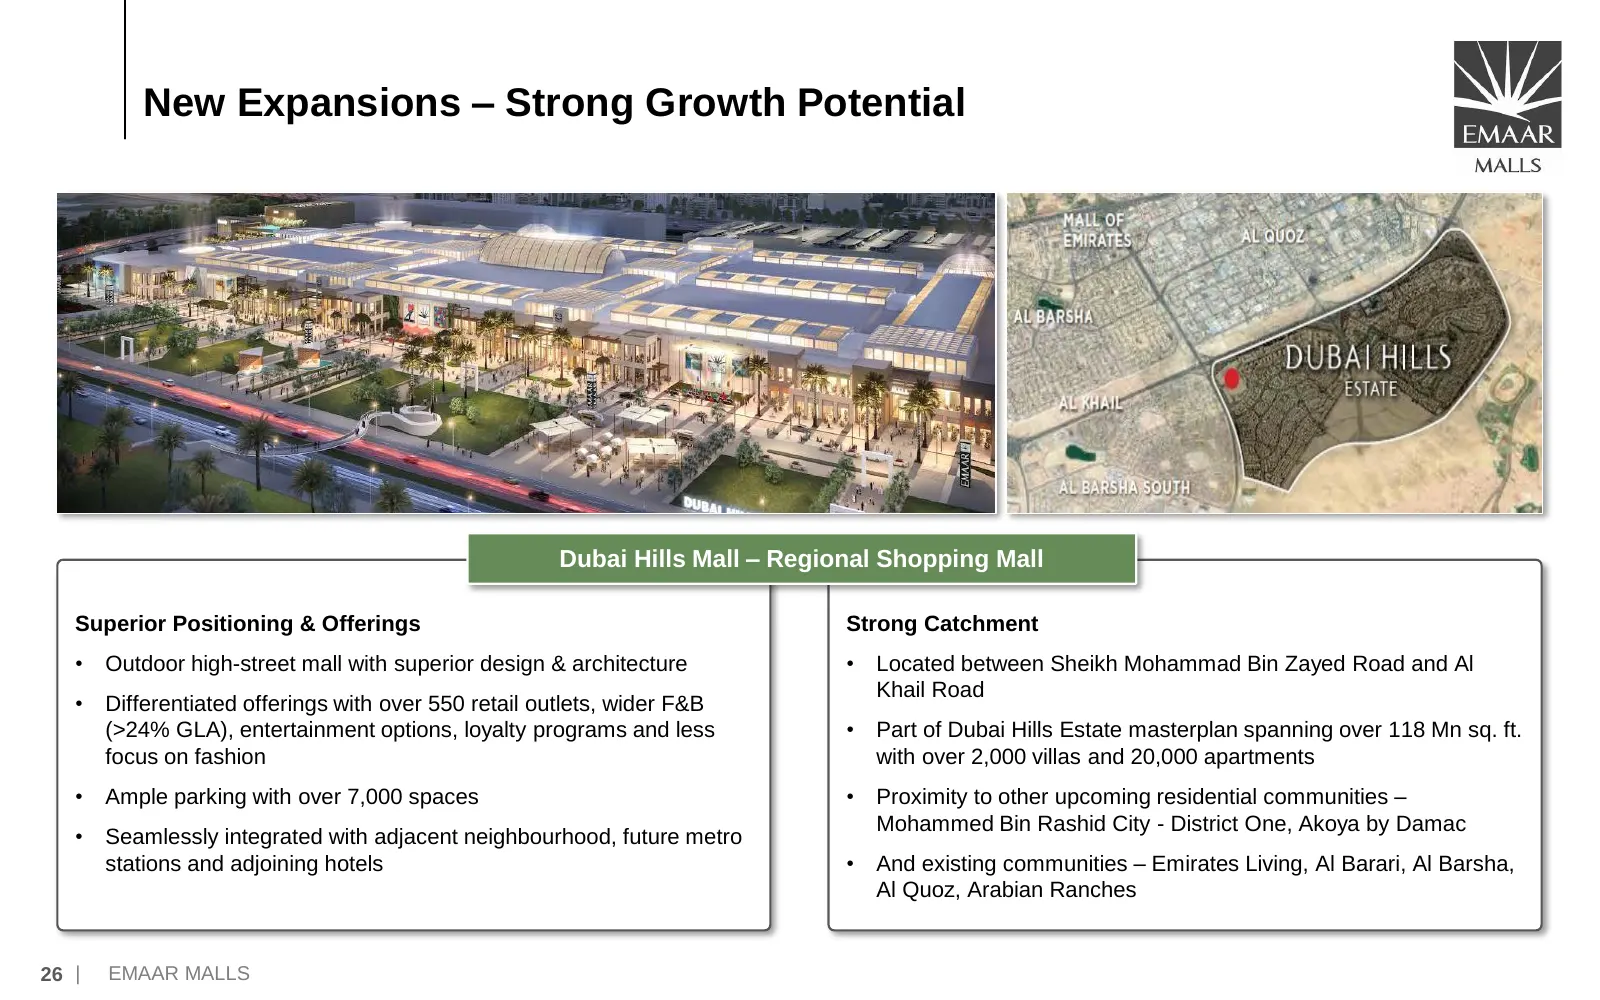
New Expansions – Strong Growth Potential Dubai Hills Mall – Regional Shopping Mall Superior Positioning & Offerings Strong Catchment • Outdoor high-street mall with superior design & architecture • Located between Sheikh Mohammad Bin Zayed Road and Al Khail Road • Differentiated offerings with over
Slide 28: New Expansions – Strong Growth Potential (Dubai Expo Mall)
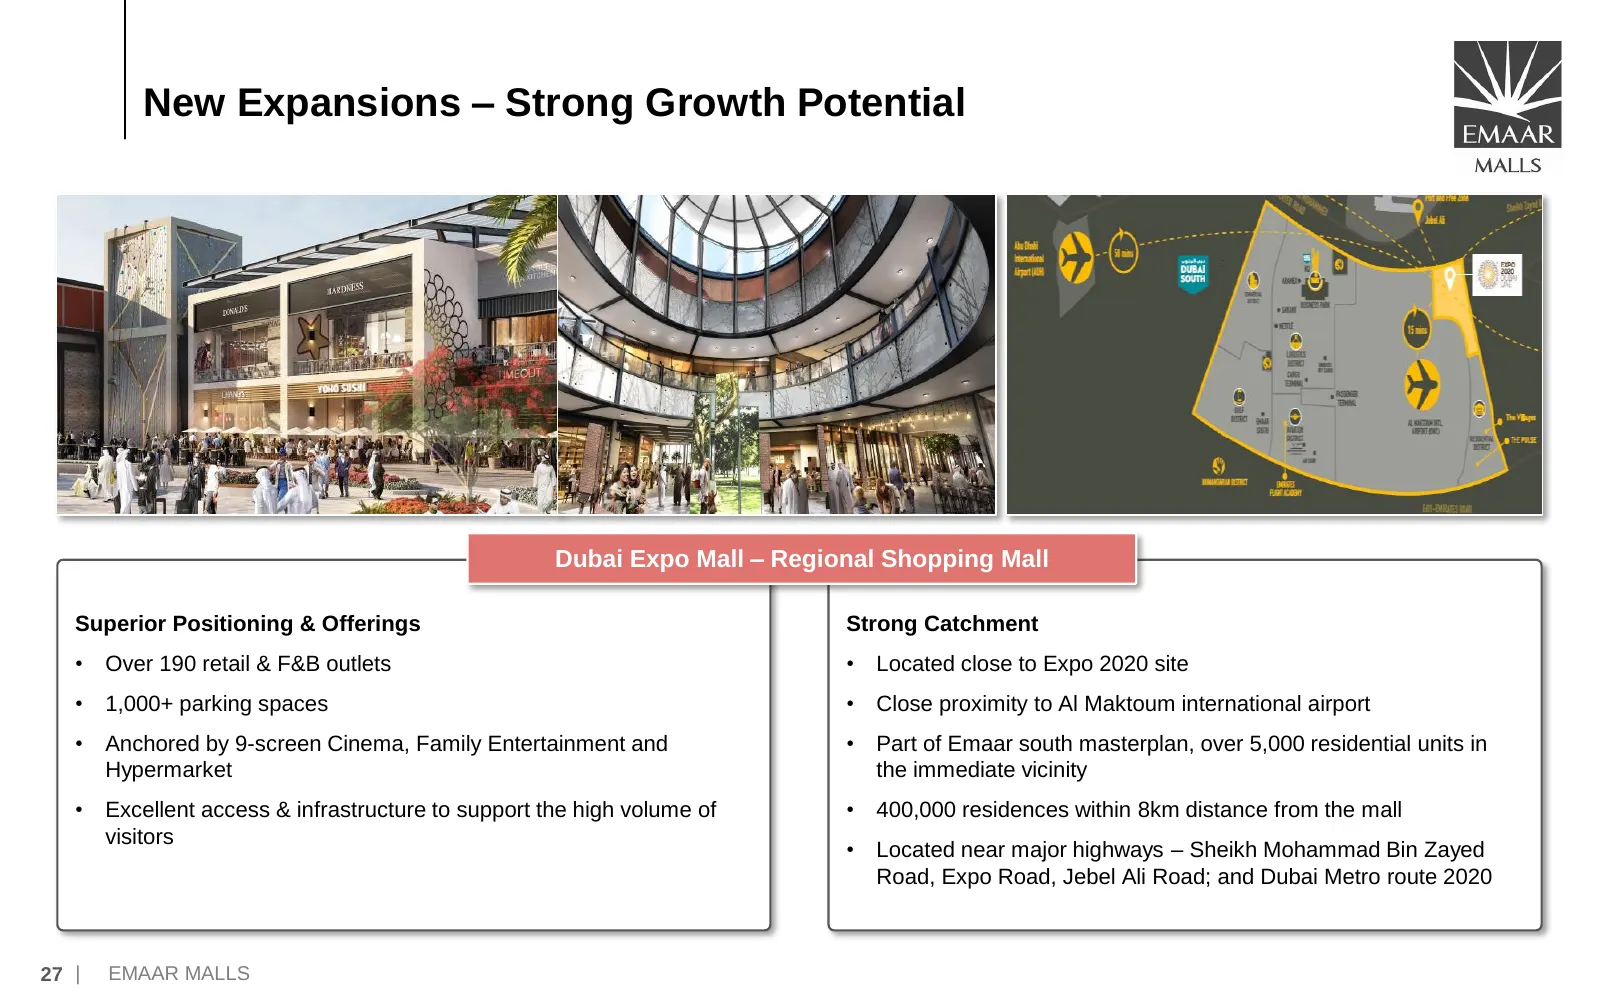
New Expansions – Strong Growth Potential Dubai Expo Mall – Regional Shopping Mall Superior Positioning & Offerings Strong Catchment • Over 190 retail & F&B outlets • Located close to Expo 2020 site • 1,000+ parking spaces • Close proximity to Al Maktoum international airport • Anchored by 9-screen C
Slide 29: FY 2019 Results Update
FY 2019 Results Update 28 | EMAAR MALLS
Slide 30: FY 2019 Key Highlights
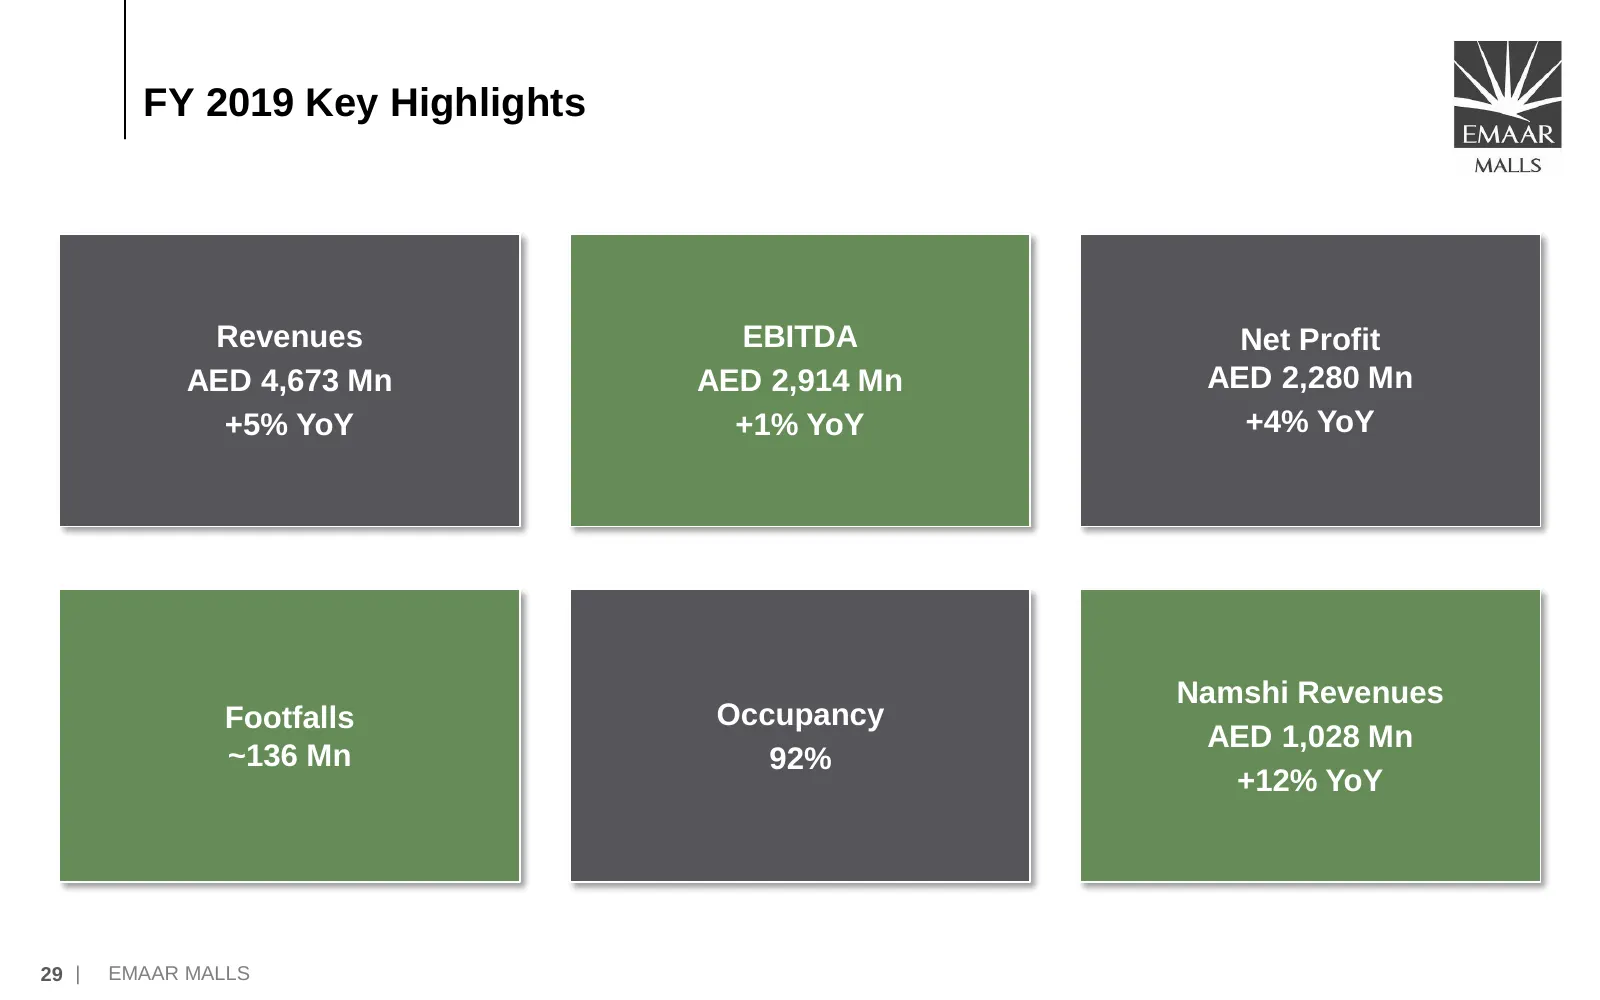
FY 2019 Key Highlights Revenues EBITDA Net Profit AED 4,673 Mn AED 2,914 Mn AED 2,280 Mn +5% YoY +1% YoY +4% YoY Namshi Revenues Footfalls Occupancy AED 1,028 Mn ~136 Mn 92% +12% YoY 29 | EMAAR MALLS
Slide 31: Emaar Malls – Result Highlights
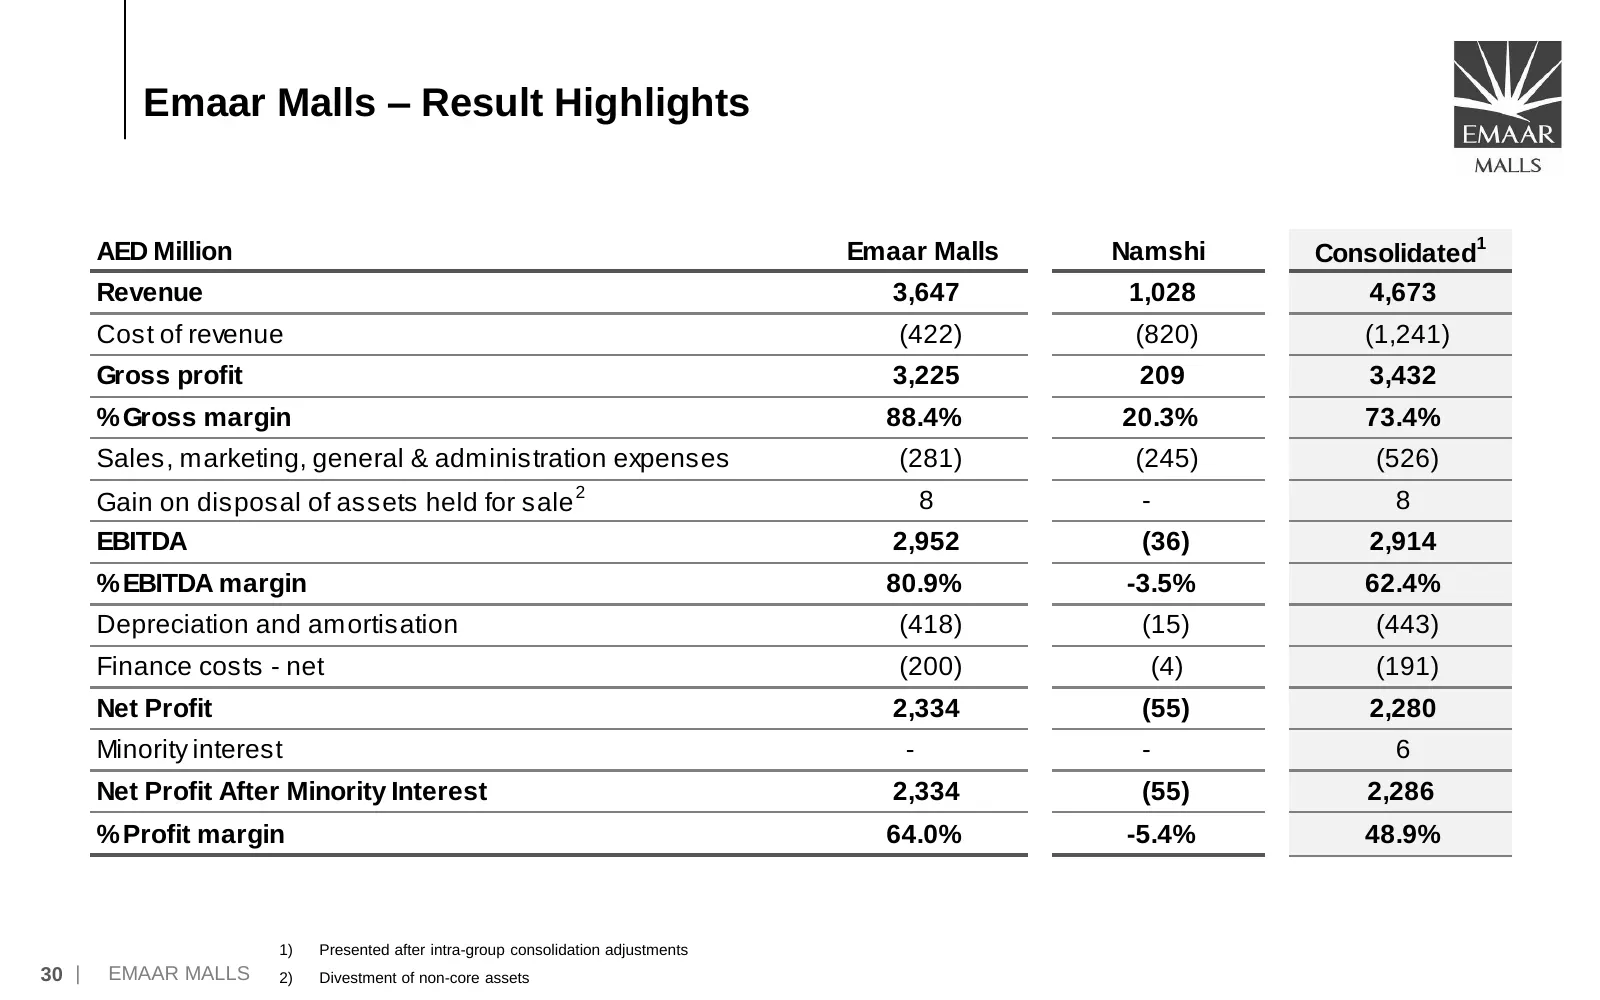
Emaar Malls – Result Highlights 1 AED Million Emaar Malls Namshi Consolidated Revenue 3,647 1,028 4,673 Cost of revenue (422) (820) (1,241) Gross profit 3,225 209 3,432 % Gross margin 88.4% 20.3% 73.4% Sales, marketing, general & administration expenses (281) (245) (526) Gain on disposal of assets h
Slide 32: Emaar Malls – Consolidated Result Highlights
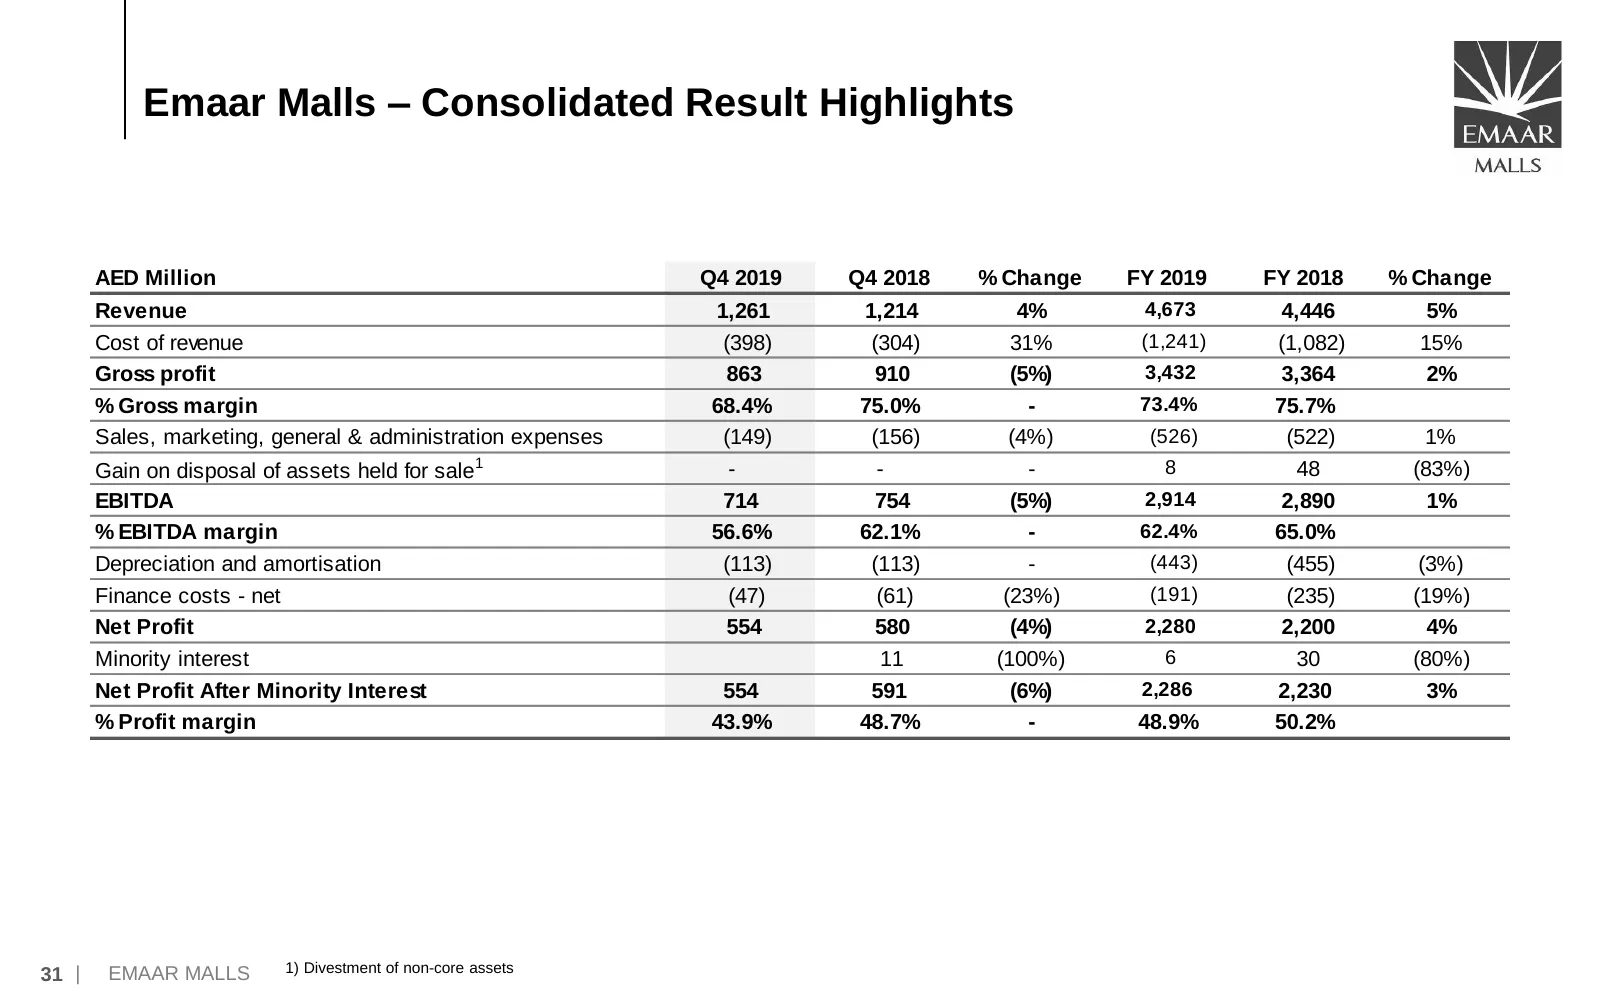
Emaar Malls – Consolidated Result Highlights AED Million Q4 2019 Q4 2018 % Change FY 2019 FY 2018 % Change Revenue 1,261 1,214 4% 4,673 4,446 5% Cost of revenue (398) (304) 31% (1,241) (1,082) 15% Gross profit 863 910 (5%) 3,432 3,364 2% % Gross margin 68.4% 75.0% - 73.4% 75.7% Sales, marketing, gen
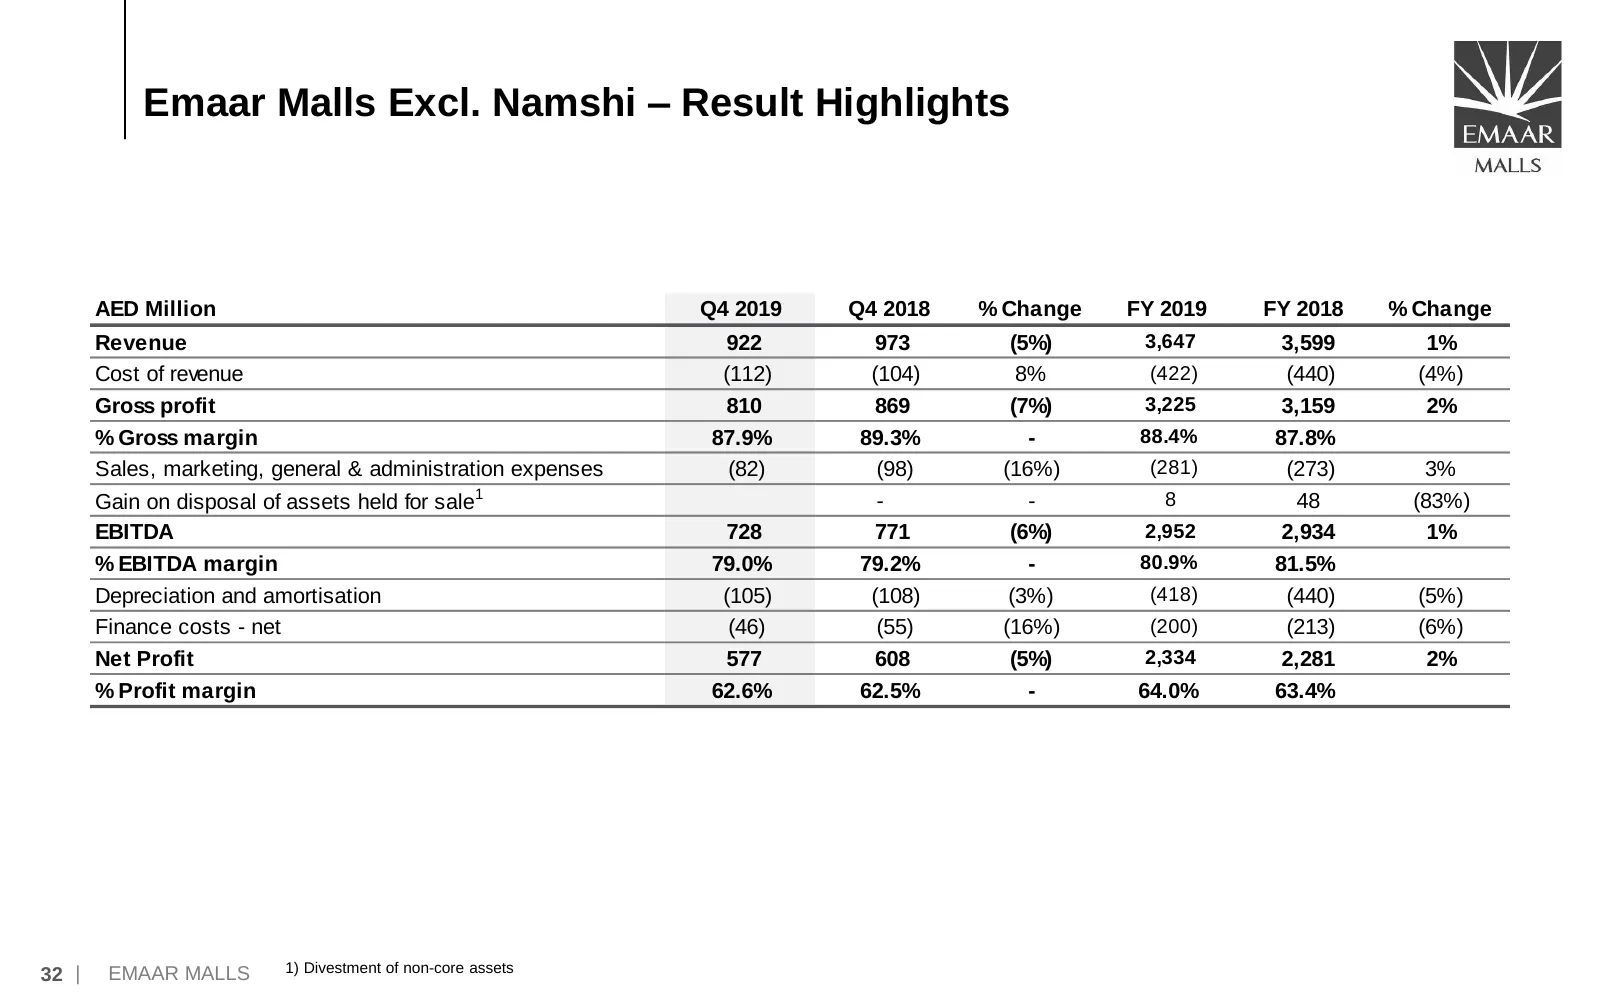
Slide 33: Emaar Malls Excl. Namshi – Result Highlights
Emaar Malls Excl. Namshi – Result Highlights AED Million Q4 2019 Q4 2018 % Change FY 2019 FY 2018 % Change Revenue 922 973 (5%) 3,647 3,599 1% Cost of revenue (112) (104) 8% (422) (440) (4%) Gross profit 810 869 (7%) 3,225 3,159 2% % Gross margin 87.9% 89.3% - 88.4% 87.8% Sales, marketing, general &
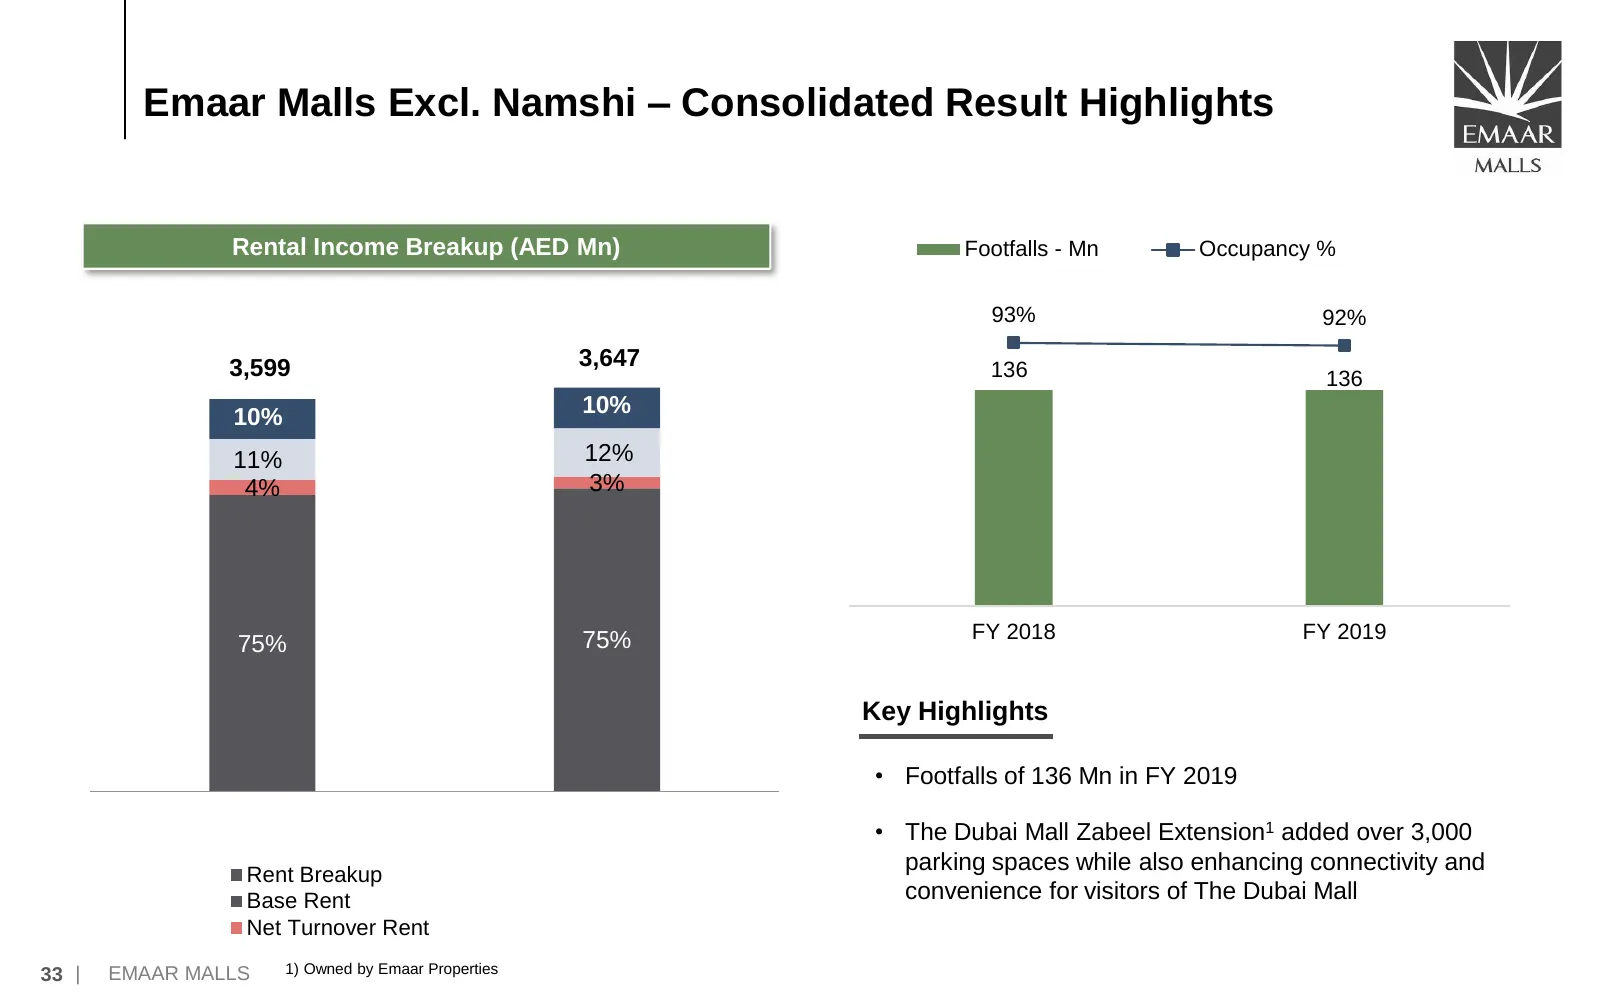
Slide 34: Emaar Malls Excl. Namshi – Consolidated Result Highlights
Emaar Malls Excl. Namshi – Consolidated Result Highlights Rental Income Breakup (AED Mn) Footfalls - Mn Occupancy % 93% 92% 3,599 3,647 136 136 10% 10% 11% 12% 4% 3% 75% FY 2018 FY 2019 75% Key Highlights • Footfalls of 136 Mn in FY 2019 • The Dubai Mall Zabeel Extension1 added over 3,000 Rent Break
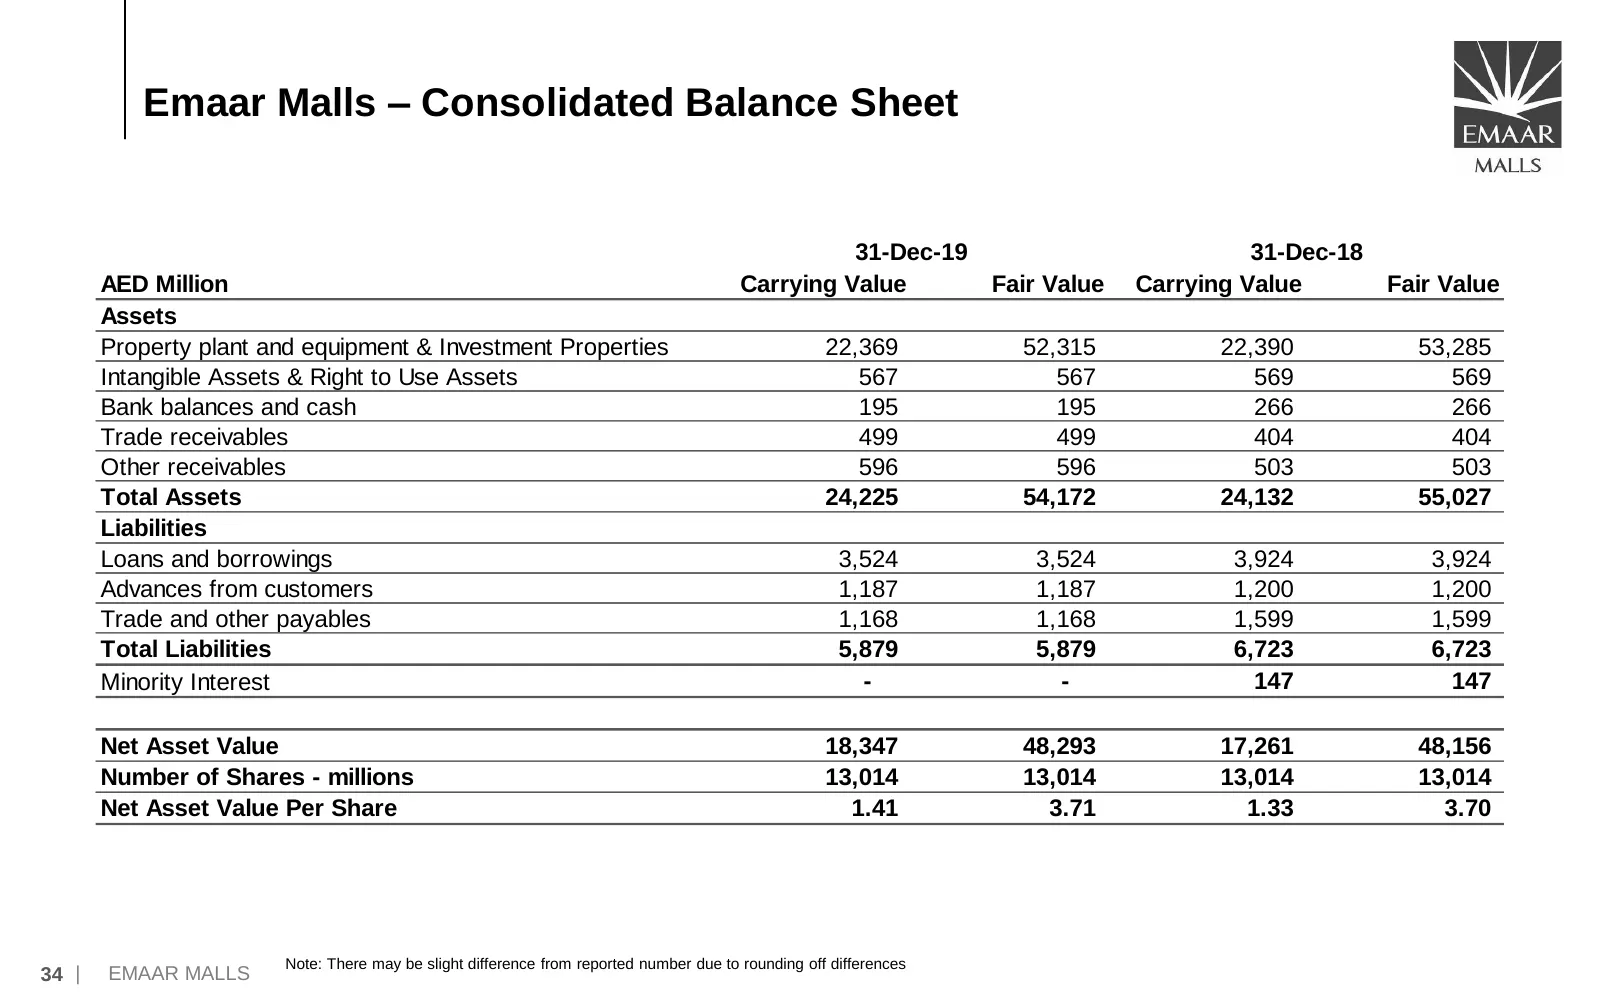
Slide 35: Emaar Malls – Consolidated Balance Sheet
Emaar Malls – Consolidated Balance Sheet 31-Dec-19 31-Dec-18 AED Million Carrying Value Fair Value Carrying Value Fair Value Assets Property plant and equipment & Investment Properties 22,369 52,315 22,390 53,285 Intangible Assets & Right to Use Assets 567 567 569 569 Bank balances and cash 195 195
Slide 36: Annexure
Annexure 35 | EMAAR MALLS
Slide 37: Emaar Group Overview
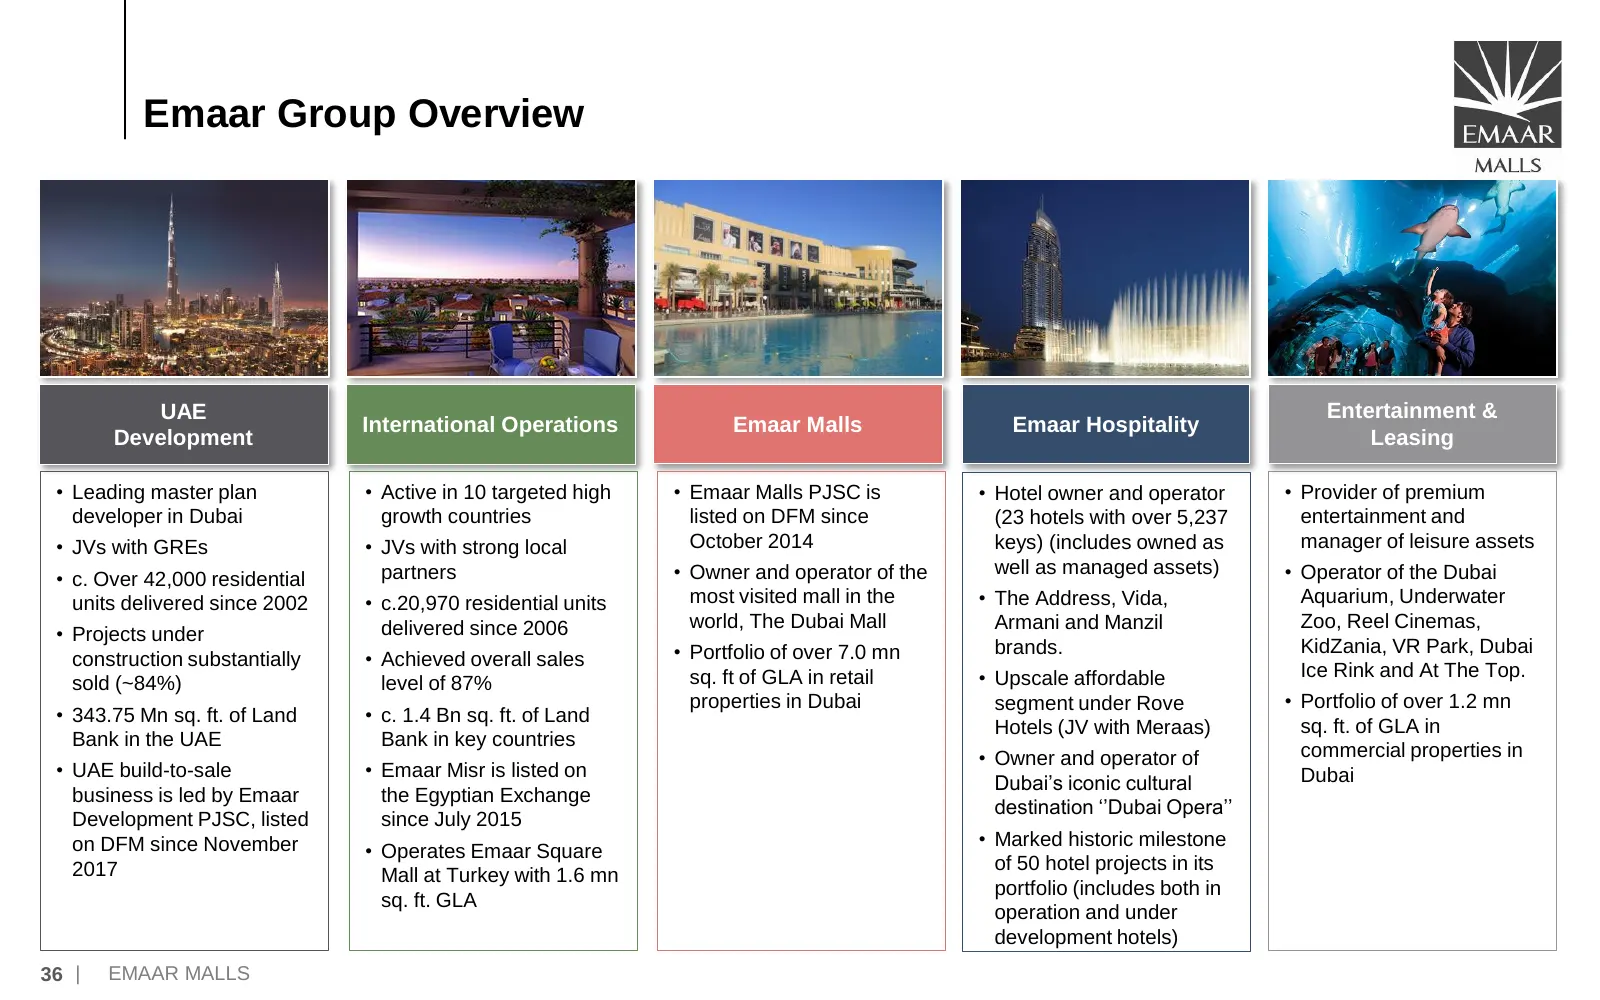
Emaar Group Overview UAE Entertainment & International Operations Emaar Malls Emaar Hospitality Development Leasing • Leading master plan • Active in 10 targeted high • Emaar Malls PJSC is • Hotel owner and operator • Provider of premium developer in Dubai growth countries listed on DFM since (23 ho
Slide 38: Thank You
Thank You EMAAR MALLS DICKENSON IR Name – Abhay Singhvi Name – Mehul Mehta / Mandar Kapse Email id - ASinghvi@emaar.ae Email id – emaar@dickensonworld.com 37 | EMAAR MALLS
Source: Internet Archive copy of propdubaidc.emaar.com
More decks from Emaar Properties (P.J.S.C)
 H1 2026 Earnings Presentation78 slides · 2026
 Emaar Properties — 9M 2025 Earnings Presentation69 slides · November 2025
 H1 2025 Earnings Presentation69 slides · August 2025
 Emaar Properties — Q1 2025 Earnings Presentation68 slides · May 2025
 Emaar Properties — FY2025 Earnings Presentation71 slides · May 2025
 FY2024 Earnings Presentation70 slides · Feb 24, 2025