HKT Trust and HKT Ltd · HKEX:6823
HKT Trust and HKT — HKT — H1 2015 Earnings Presentation
34 slides from HKT Trust and HKT's earnings presentation, Aug 5, 2015
Slide 1: 2015 Interim Results
2015 Interim Results For the six months ended June 30, 2015 August 5, 2015 – Hong Kong
Slide 2: Forward-Looking Statements
Forward-Looking Statements This presentation may contain "forward-looking statements" that are not historical in nature. These forward-looking statements, which include, without limitation, statements regarding HKT’s future results of operations, financial condition or business prospects, are based
Slide 3: Overview
Overview Alex Arena Group Managing Director 2
Slide 4: Adjusted Funds Flow H1'14 H1'15
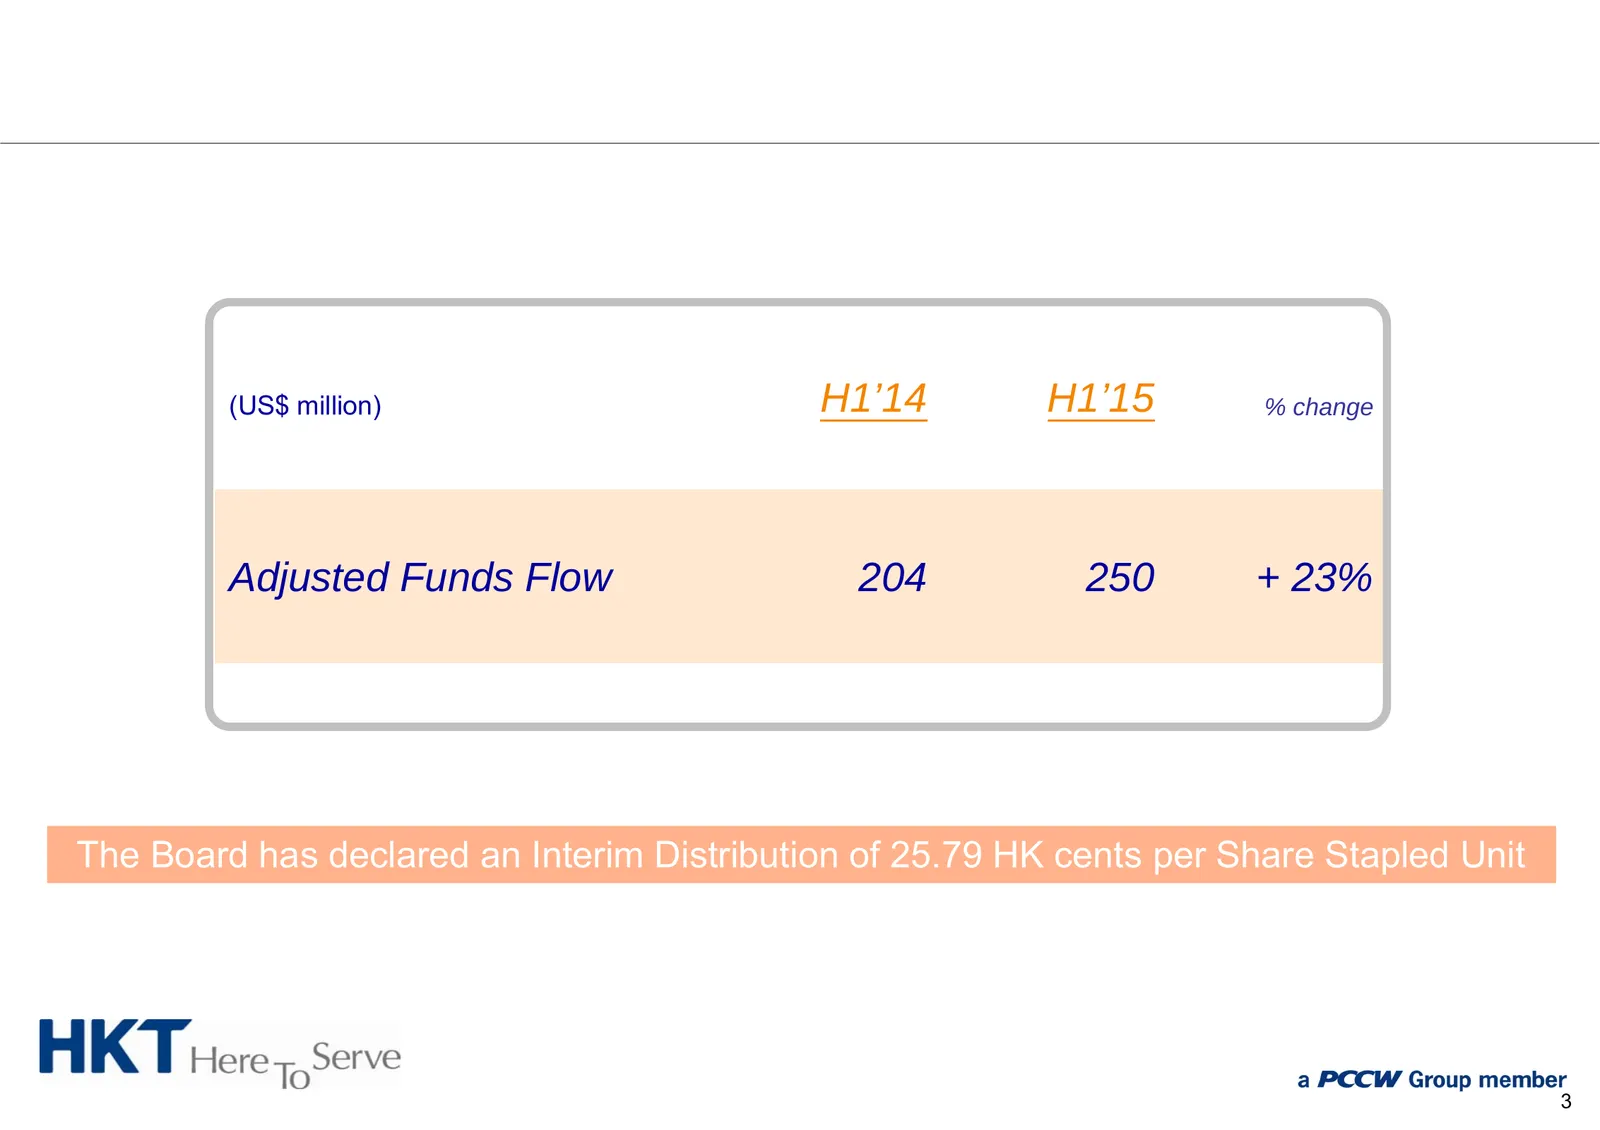
(US$ million) H1’14 H1’15 % change Adjusted Funds Flow 204 250 + 23% The Board has declared an Interim Distribution of 25.79 HK cents per Share Stapled Unit 3
Slide 5: Financial Review
Financial Review Susanna Hui Group Chief Financial Officer 4
Slide 6: Solid Growth in EBITDA and AFF
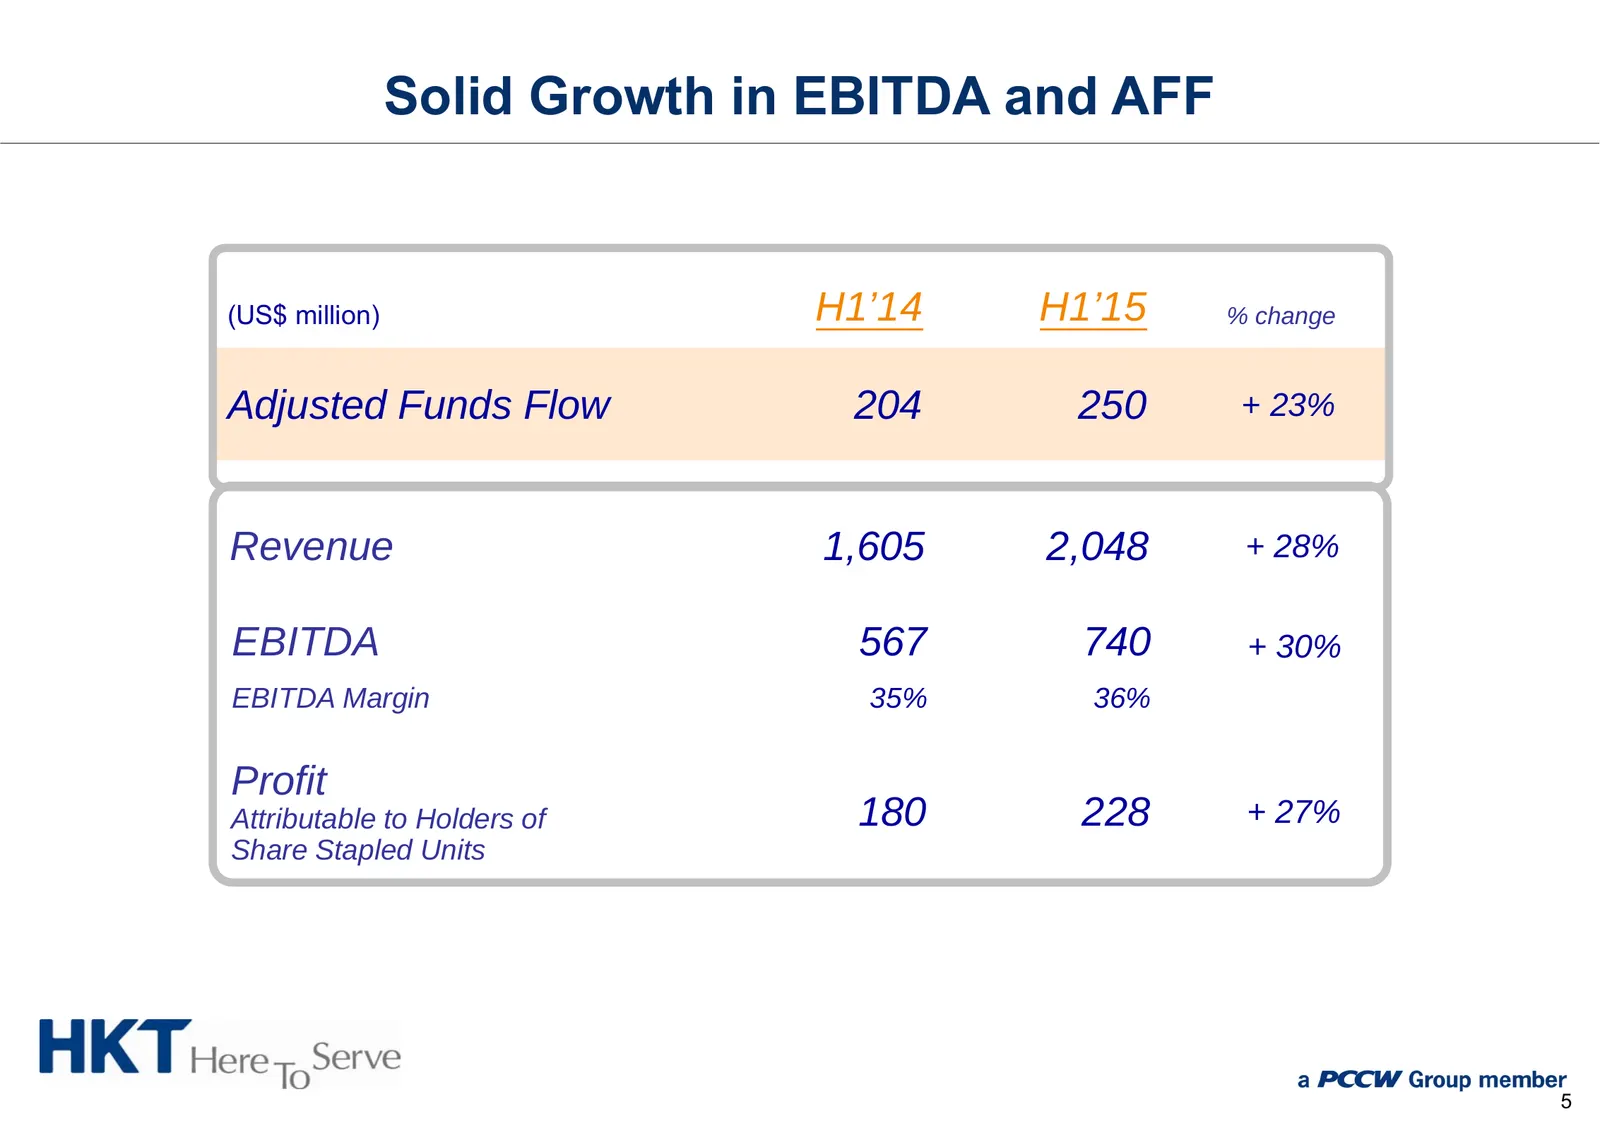
Solid Growth in EBITDA and AFF (US$ million) H1’14 H1’15 % change Adjusted Funds Flow 204 250 + 23% Revenue 1,605 2,048 + 28% EBITDA 567 740 + 30% EBITDA Margin 35% 36% Profit Attributable to Holders of 180 228 + 27% Share Stapled Units 5
Slide 7: Mobile Synergies Beginning to Materialize
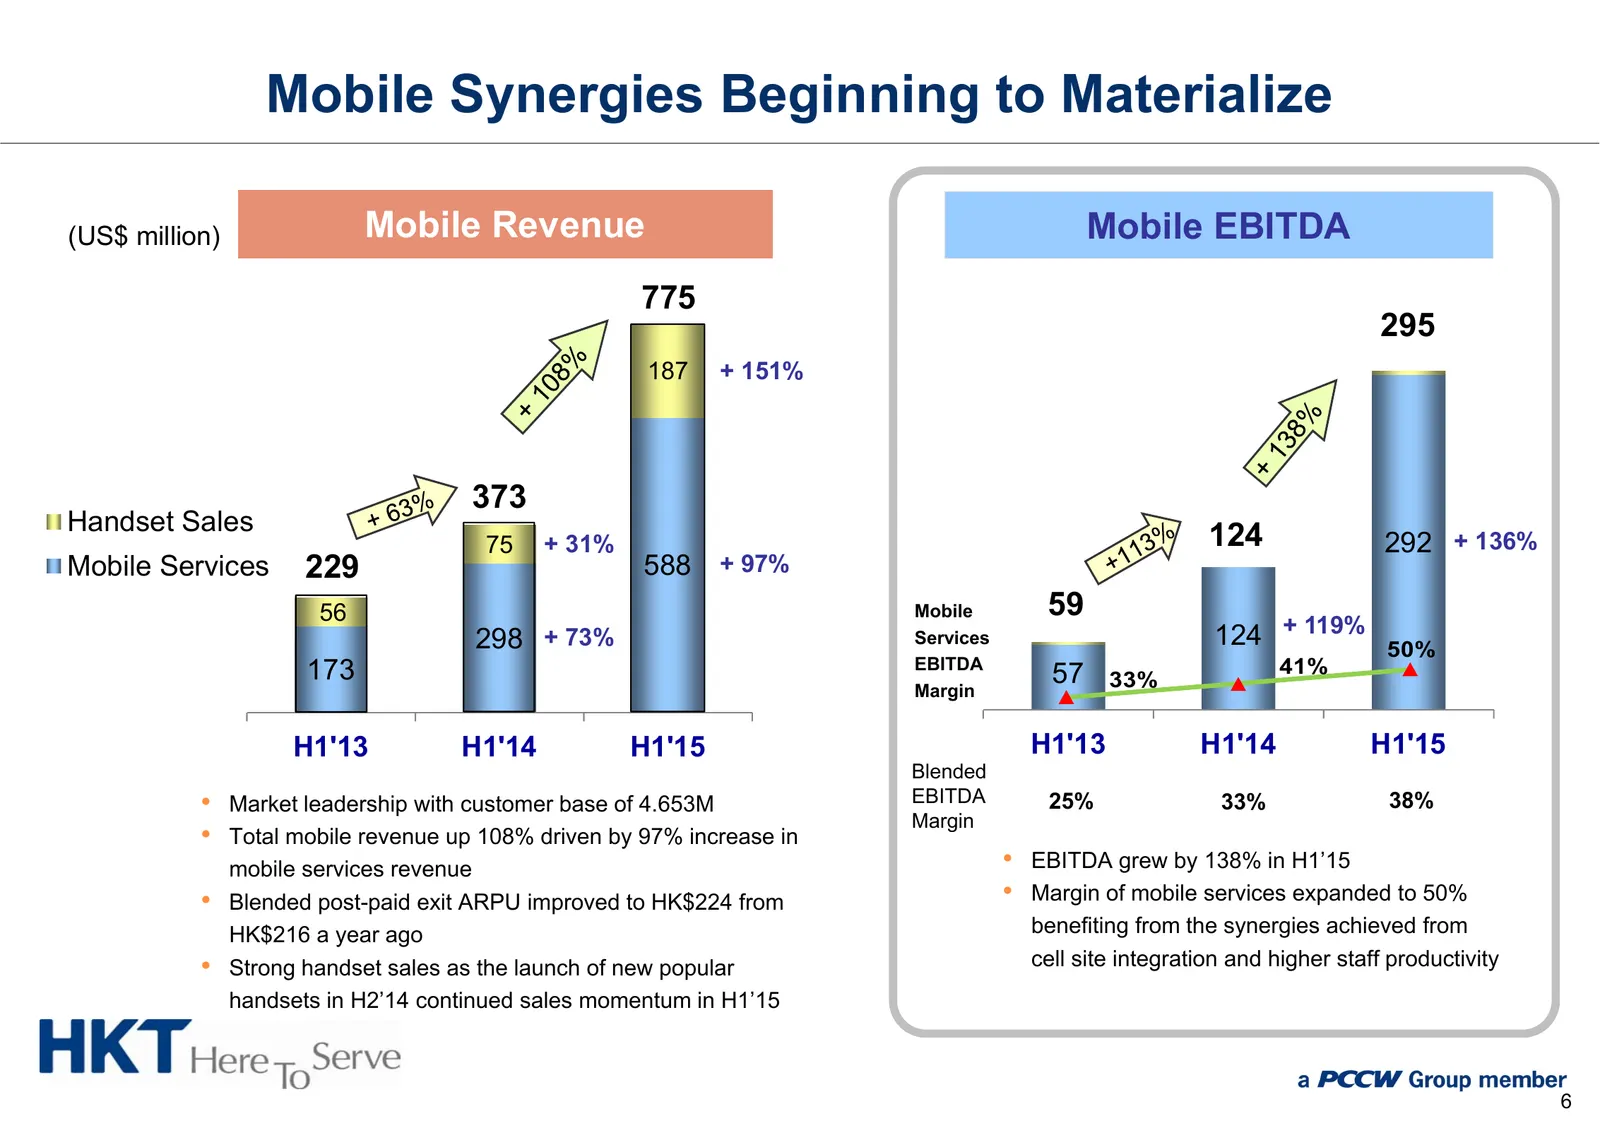
Mobile Synergies Beginning to Materialize (US$ million) Mobile Revenue Mobile EBITDA 775 295 187 + 151% 373 Handset Sales 75 + 31% 124 292 + 136% Mobile Services 229 588 + 97% 56 Mobile 59 298 + 73% Services 124 + 119% 50% 173 EBITDA 57 33% 41% Margin H1'13 H1'14 H1'15 H1'13 H1'14 H1'15 Blended • Ma
Slide 8: Pro-forma Comparison Shows Solid Mobile Growth
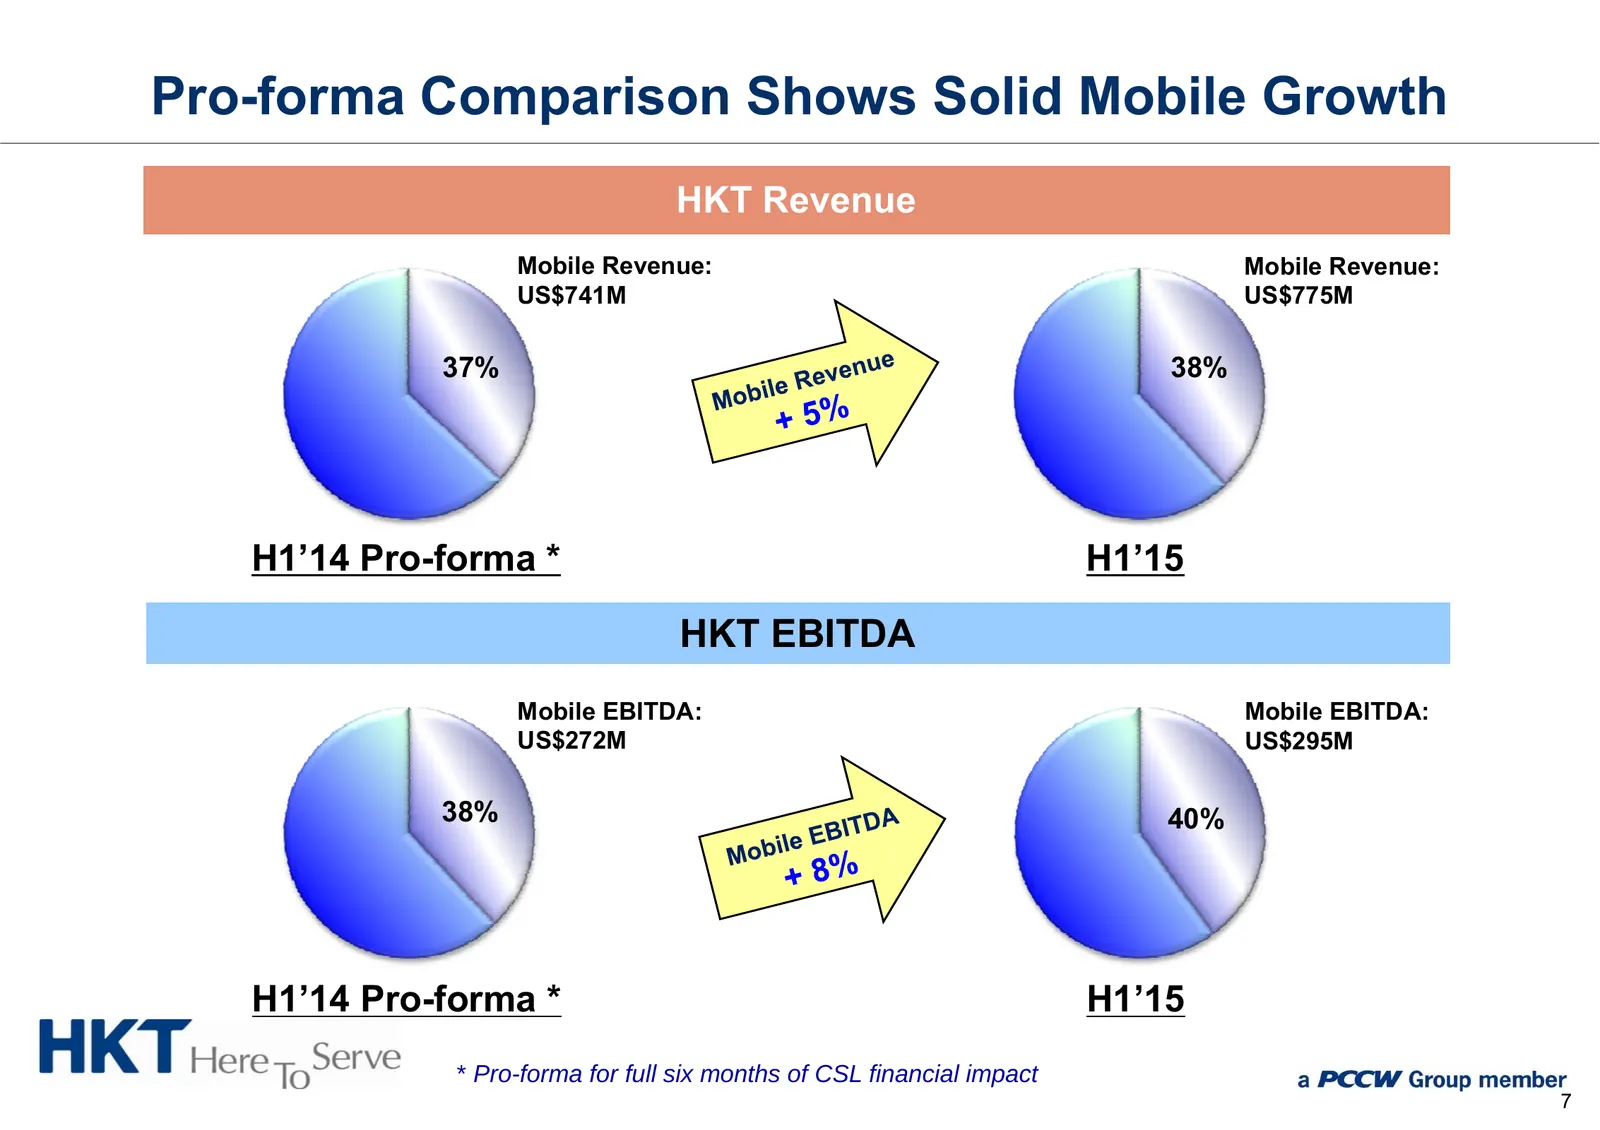
Pro-forma Comparison Shows Solid Mobile Growth HKT Revenue Mobile Revenue: Mobile Revenue: US$741M US$775M 37% 38% H1’14 Pro-forma * H1’15 HKT EBITDA Mobile EBITDA: Mobile EBITDA: US$272M US$295M 38% 40% H1’14 Pro-forma * H1’15 * Pro-forma for full six months of CSL financial impact 7
Slide 9: Sustained Growth within TSS
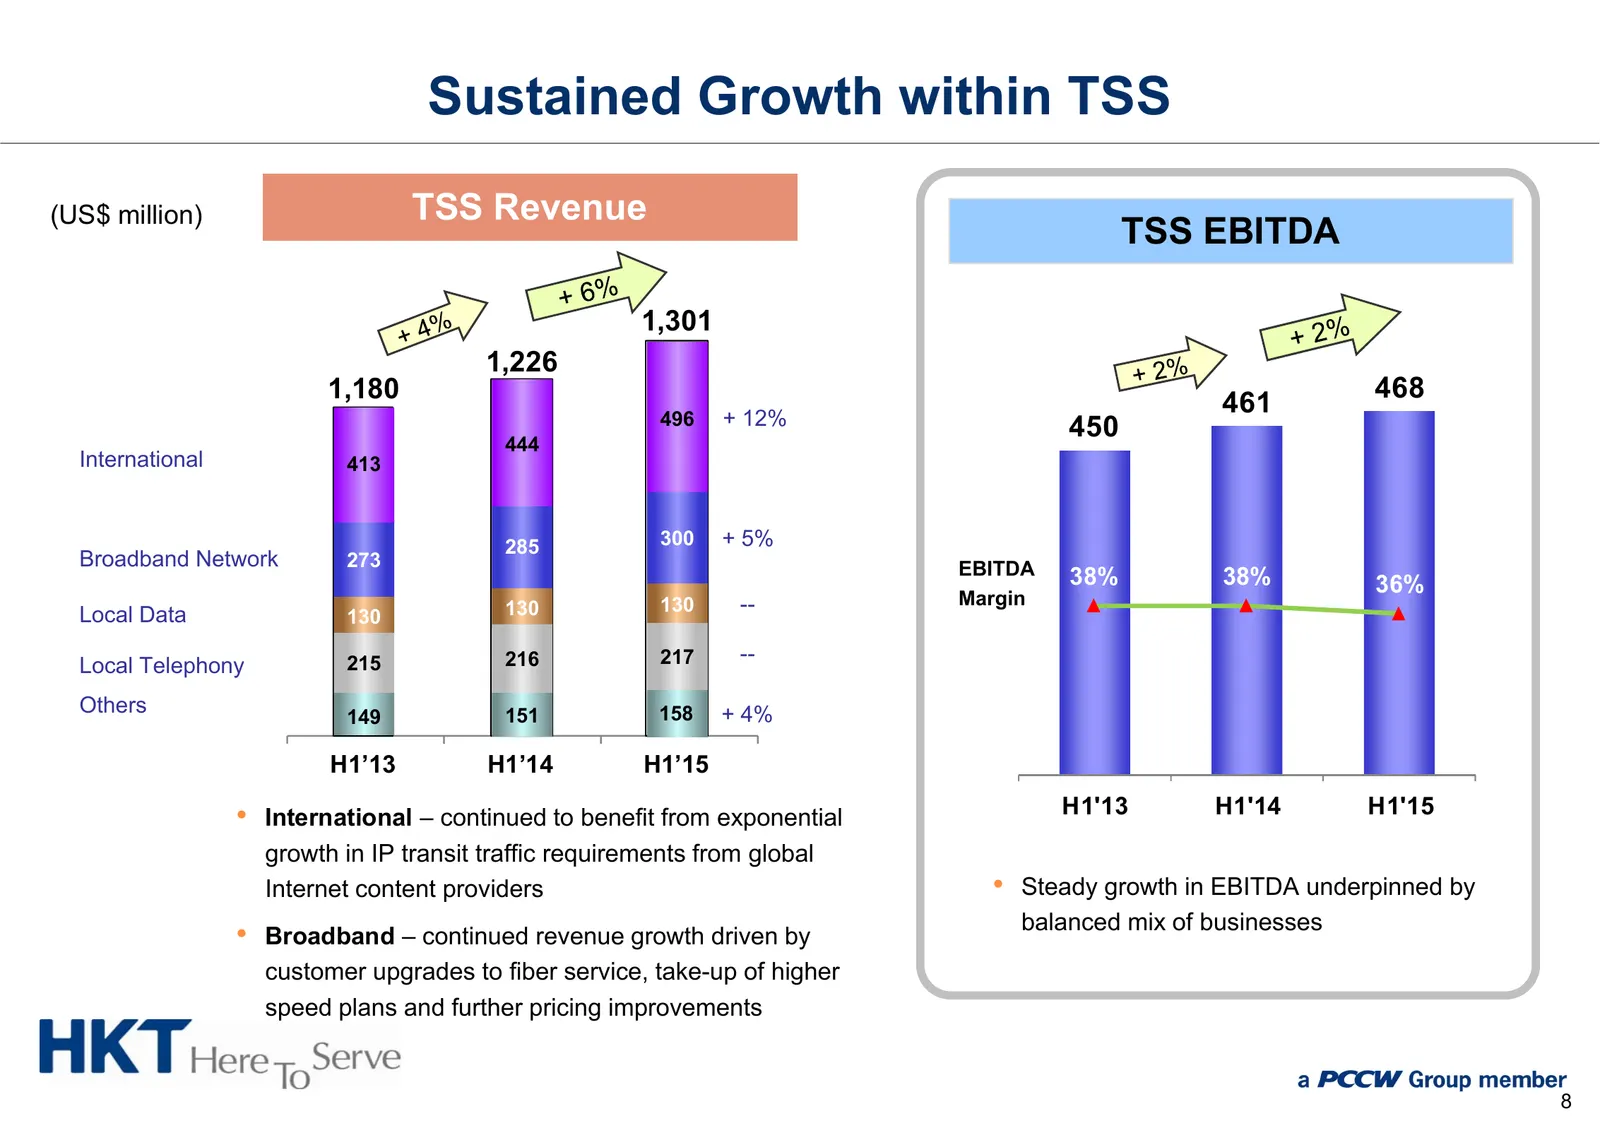
Sustained Growth within TSS (US$ million) TSS Revenue TSS EBITDA 1,301 1,226 1,180 468 496 + 12% 461 450 444 International 413 285 300 + 5% Broadband Network 273 EBITDA 38% 38% 36% 130 130 -- Margin Local Data 130 215 216 217 -- Local Telephony Others 149 151 158 + 4% H1’13 H1’14 H1’15 • Internation
Slide 10: Unlocking of Synergies On Track
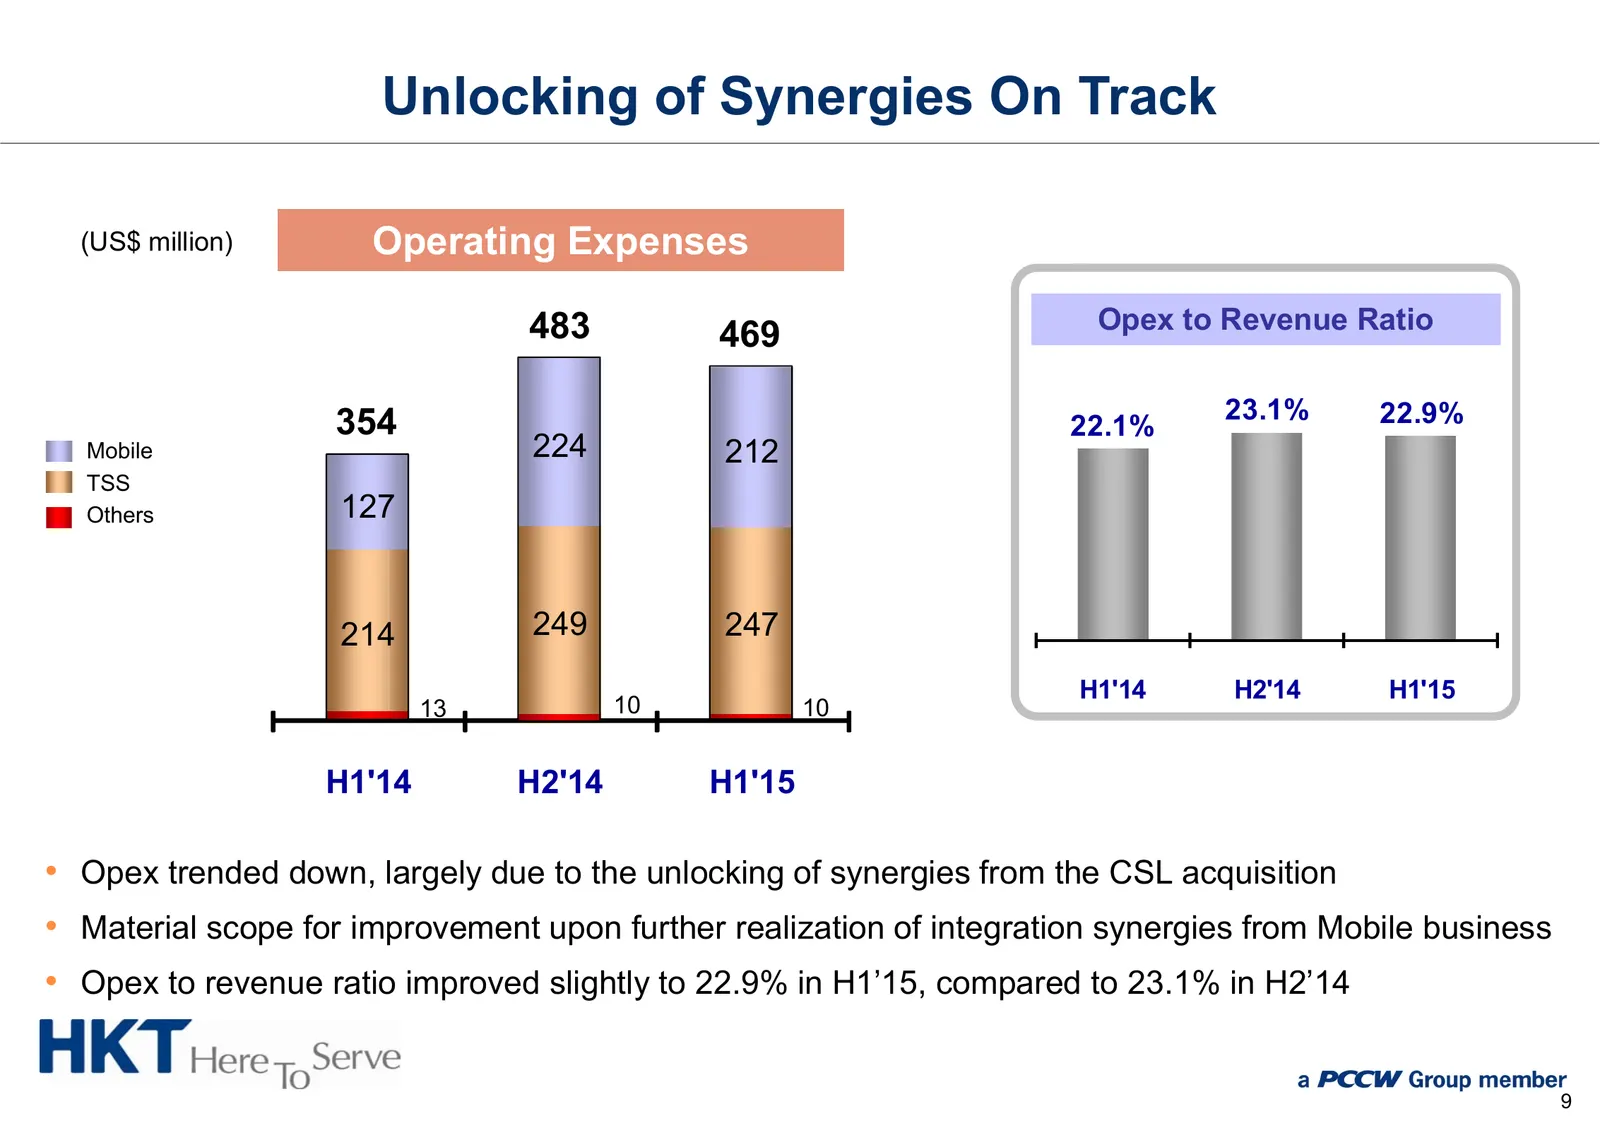
Unlocking of Synergies On Track (US$ million) Operating Expenses 483 Opex to Revenue Ratio 469 23.1% 22.9% 354 22.1% Mobile 224 212 TSS Others 127 214 249 247 H1'14 H2'14 H1'15 13 10 10 H1'14 H2'14 H1'15 • Opex trended down, largely due to the unlocking of synergies from the CSL acquisition • Materi
Slide 11: Customer Acquisition Costs
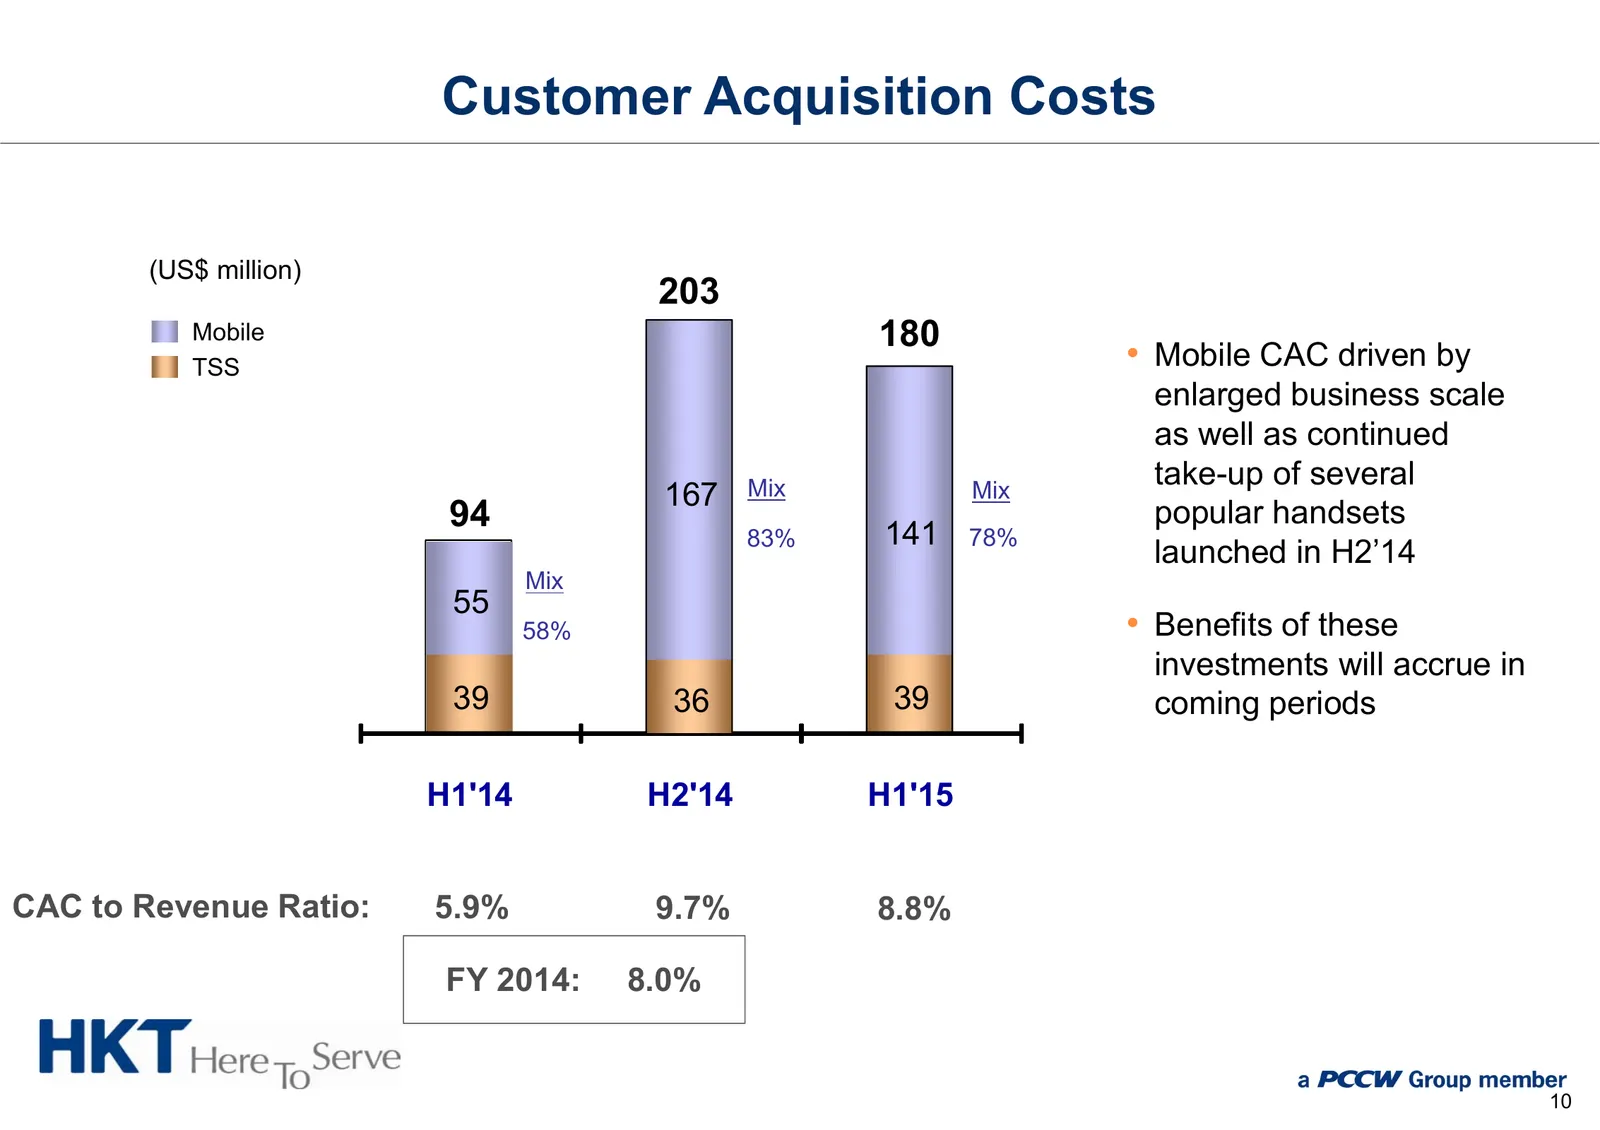
Customer Acquisition Costs (US$ million) 203 Mobile 180 TSS • Mobile CAC driven by enlarged business scale as well as continued Mix take-up of several 167 Mix 94 141 popular handsets 83% 78% launched in H2’14 Mix 55 58% • Benefits of these investments will accrue in 39 36 39 coming periods H1'14 H2'
Slide 12: Capex Efficiency Continues to Improve from Enhanced Scale and Fixed-Mobile Network Integration
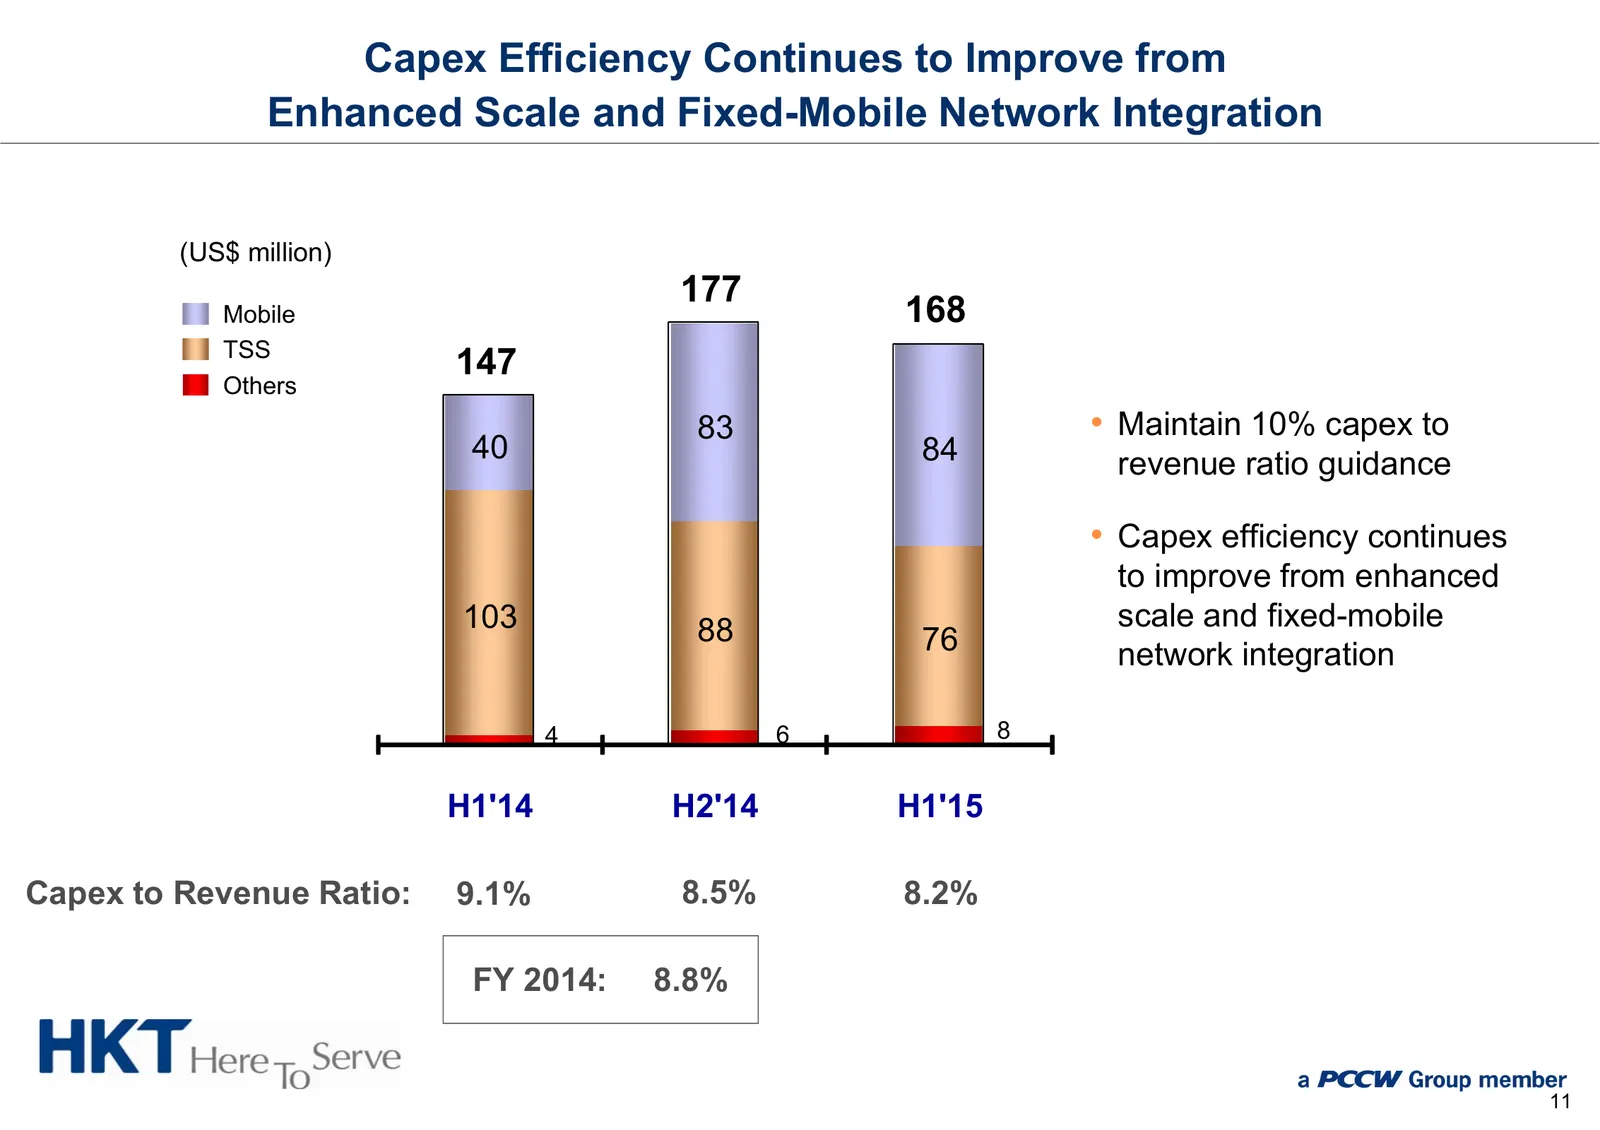
Capex Efficiency Continues to Improve from Enhanced Scale and Fixed-Mobile Network Integration (US$ million) 177 Mobile 168 TSS 147 Others 83 • Maintain 10% capex to 40 84 revenue ratio guidance • Capex efficiency continues to improve from enhanced 103 88 scale and fixed-mobile 76 network integratio
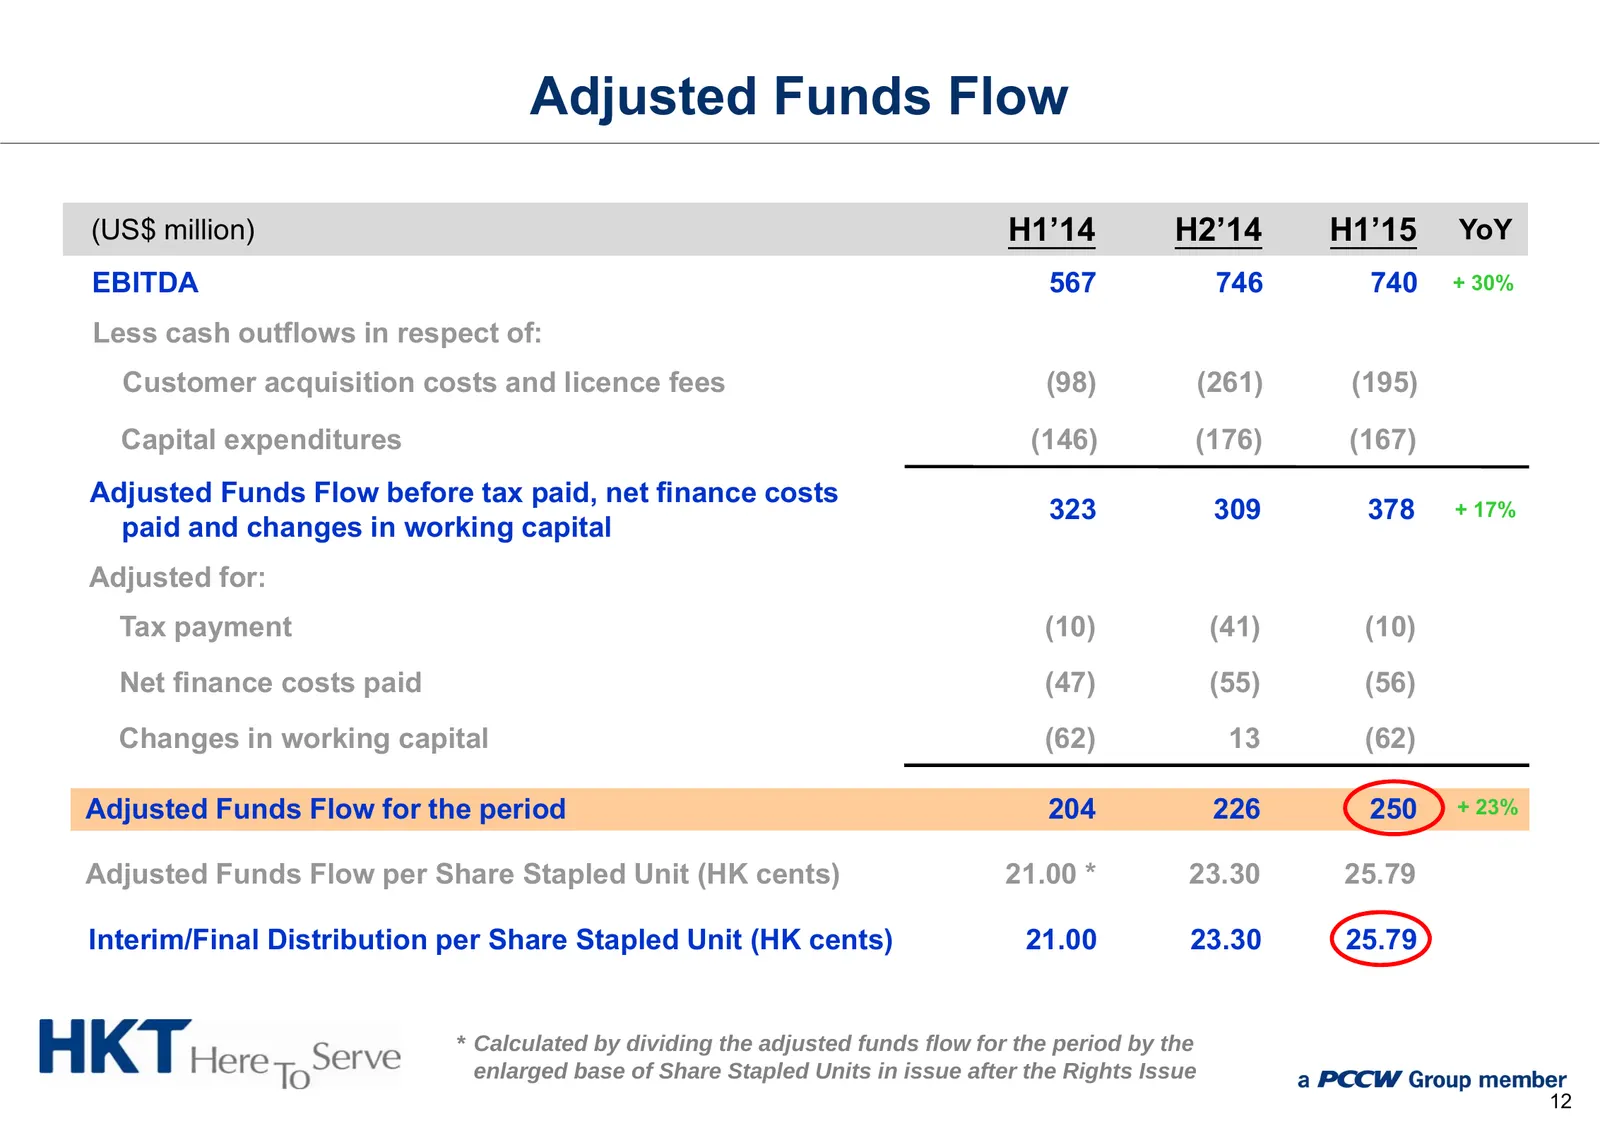
Slide 13: Adjusted Funds Flow
Adjusted Funds Flow (US$ million) H1’14 H2’14 H1’15 YoY EBITDA 567 746 740 + 30% Less cash outflows in respect of: Customer acquisition costs and licence fees (98) (261) (195) Capital expenditures (146) (176) (167) Adjusted Funds Flow before tax paid, net finance costs 323 309 378 + 17% paid and cha
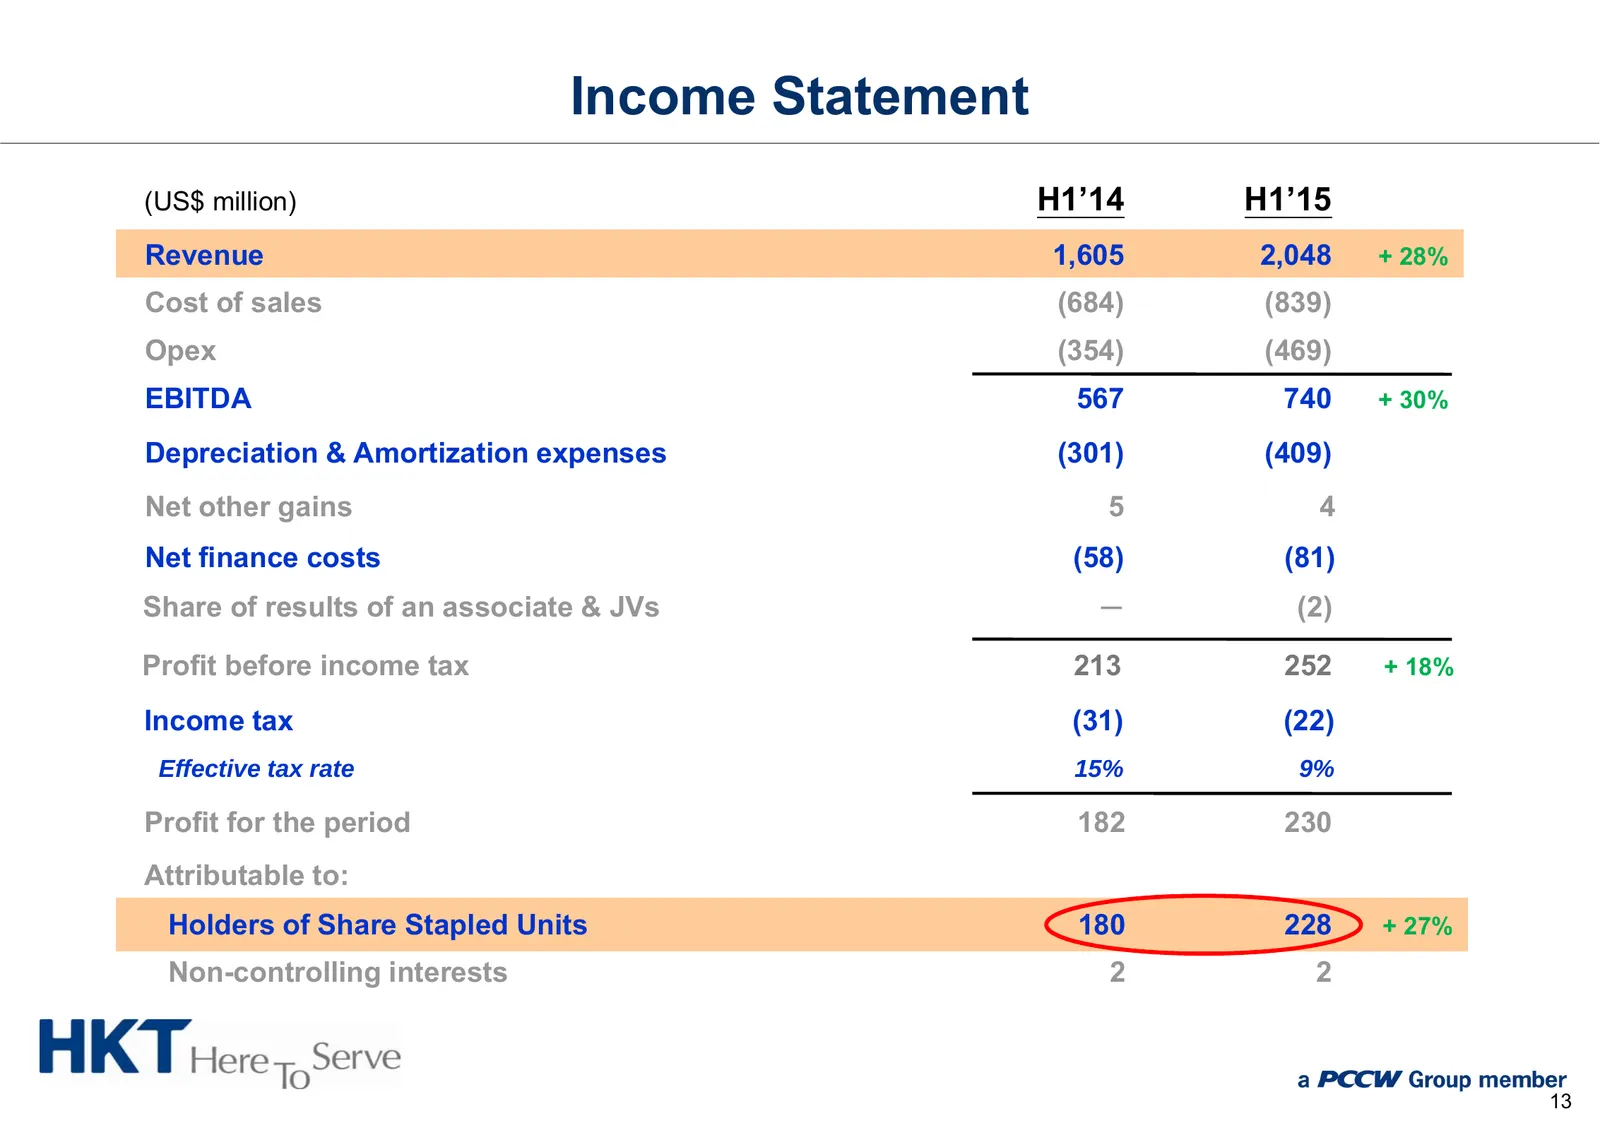
Slide 14: Income Statement
Income Statement (US$ million) H1’14 H1’15 Revenue 1,605 2,048 + 28% Cost of sales (684) (839) Opex (354) (469) EBITDA 567 740 + 30% Depreciation & Amortization expenses (301) (409) Net other gains 5 4 Net finance costs (58) (81) Share of results of an associate & JVs ─ (2) Profit before income tax
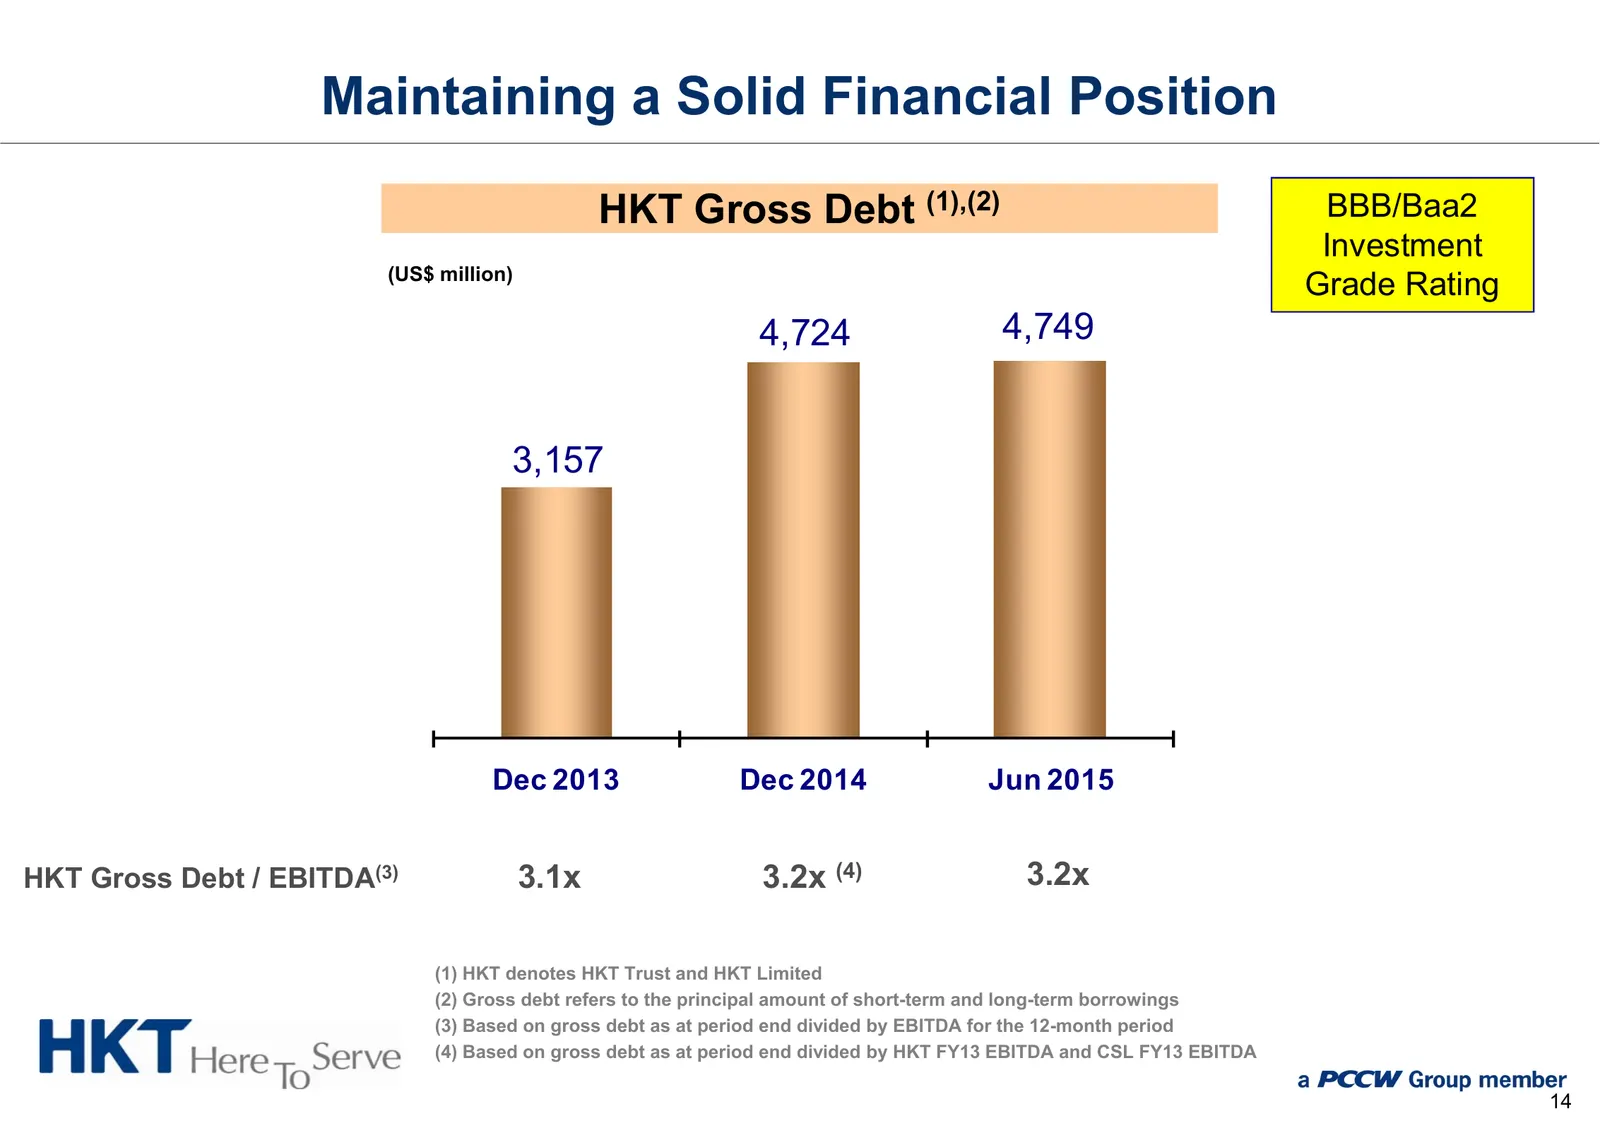
Slide 15: Maintaining a Solid Financial Position
Maintaining a Solid Financial Position HKT Gross Debt (1),(2) BBB/Baa2 Investment (US$ million) Grade Rating 4,724 4,749 3,157 Dec 2013 Dec 2014 Jun 2015 HKT Gross Debt / EBITDA(3) 3.1x 3.2x (4) 3.2x (1) HKT denotes HKT Trust and HKT Limited (2) Gross debt refers to the principal amount of short-ter
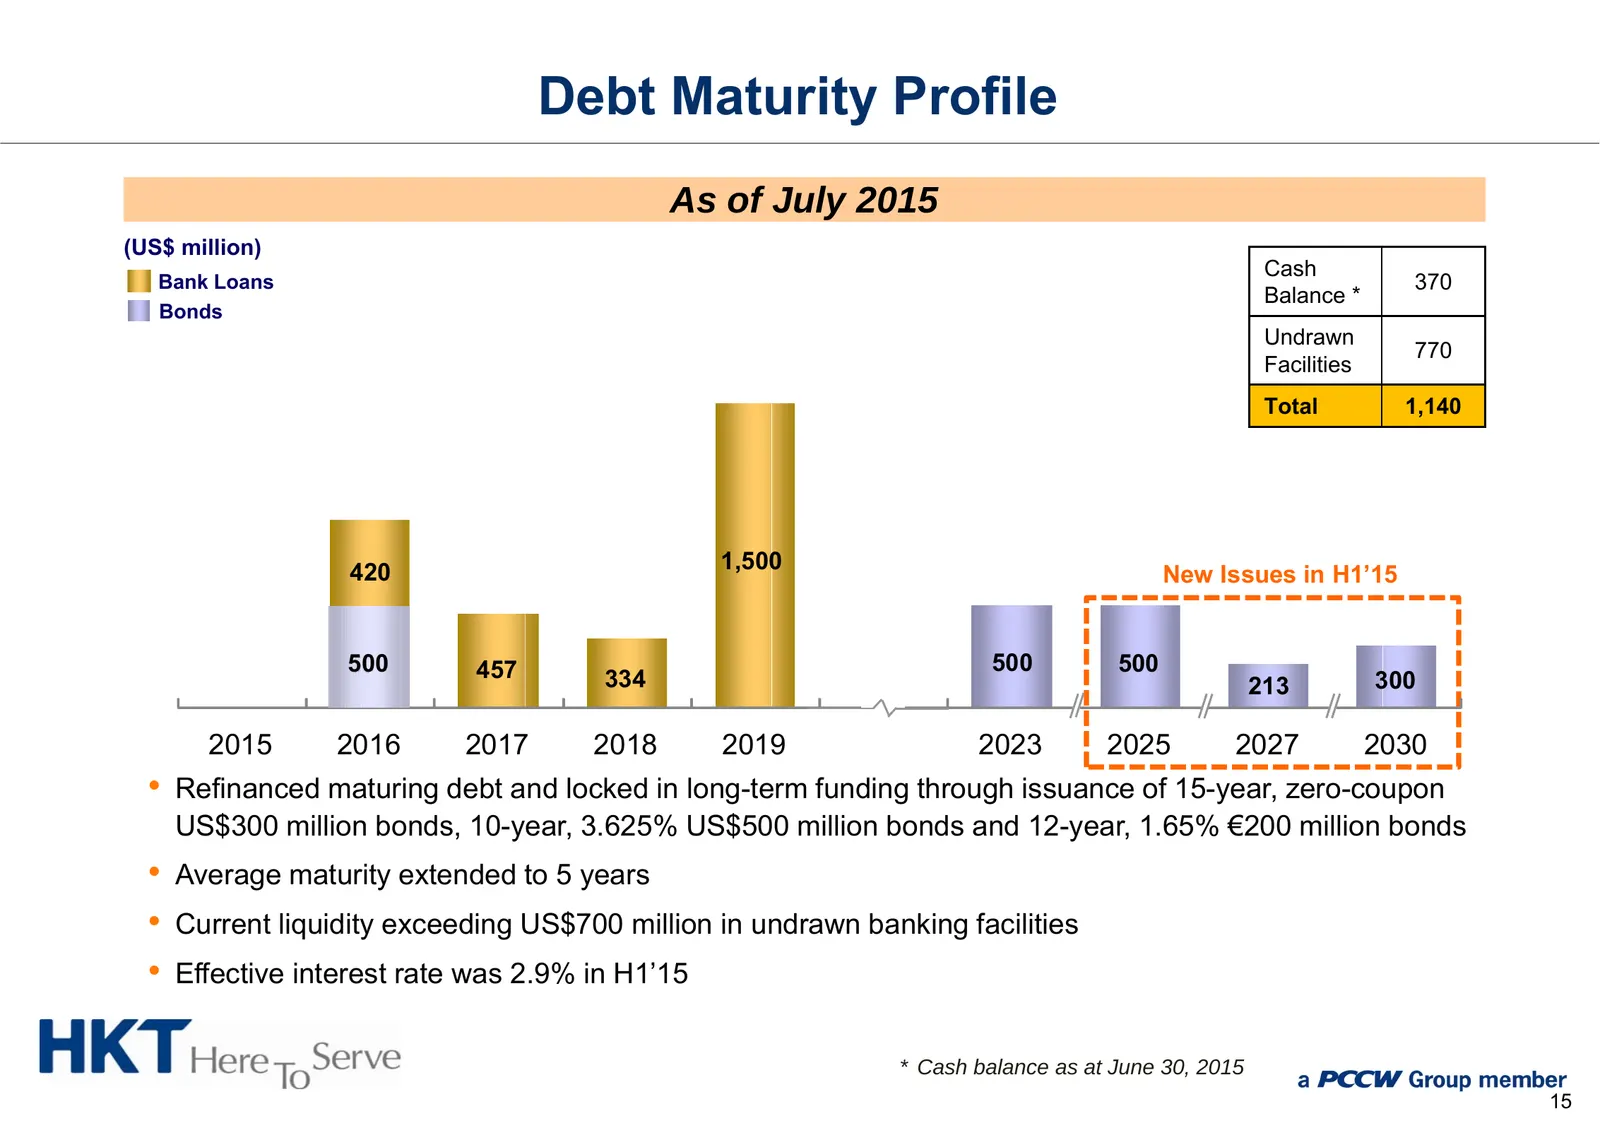
Slide 16: Debt Maturity Profile
Debt Maturity Profile As of July 2015 (US$ million) Cash Bank Loans 370 Balance * Bonds Undrawn 770 Facilities Total 1,140 420 1,500 New Issues in H1’15 500 457 500 500 334 213 300 2015 2016 2017 2018 2019 2023 2025 2027 2030 • Refinanced maturing debt and locked in long-term funding through issuanc
Slide 17: Business Review
Business Review Alex Arena Group Managing Director 16
Slide 18: Stable Fixed-line Business
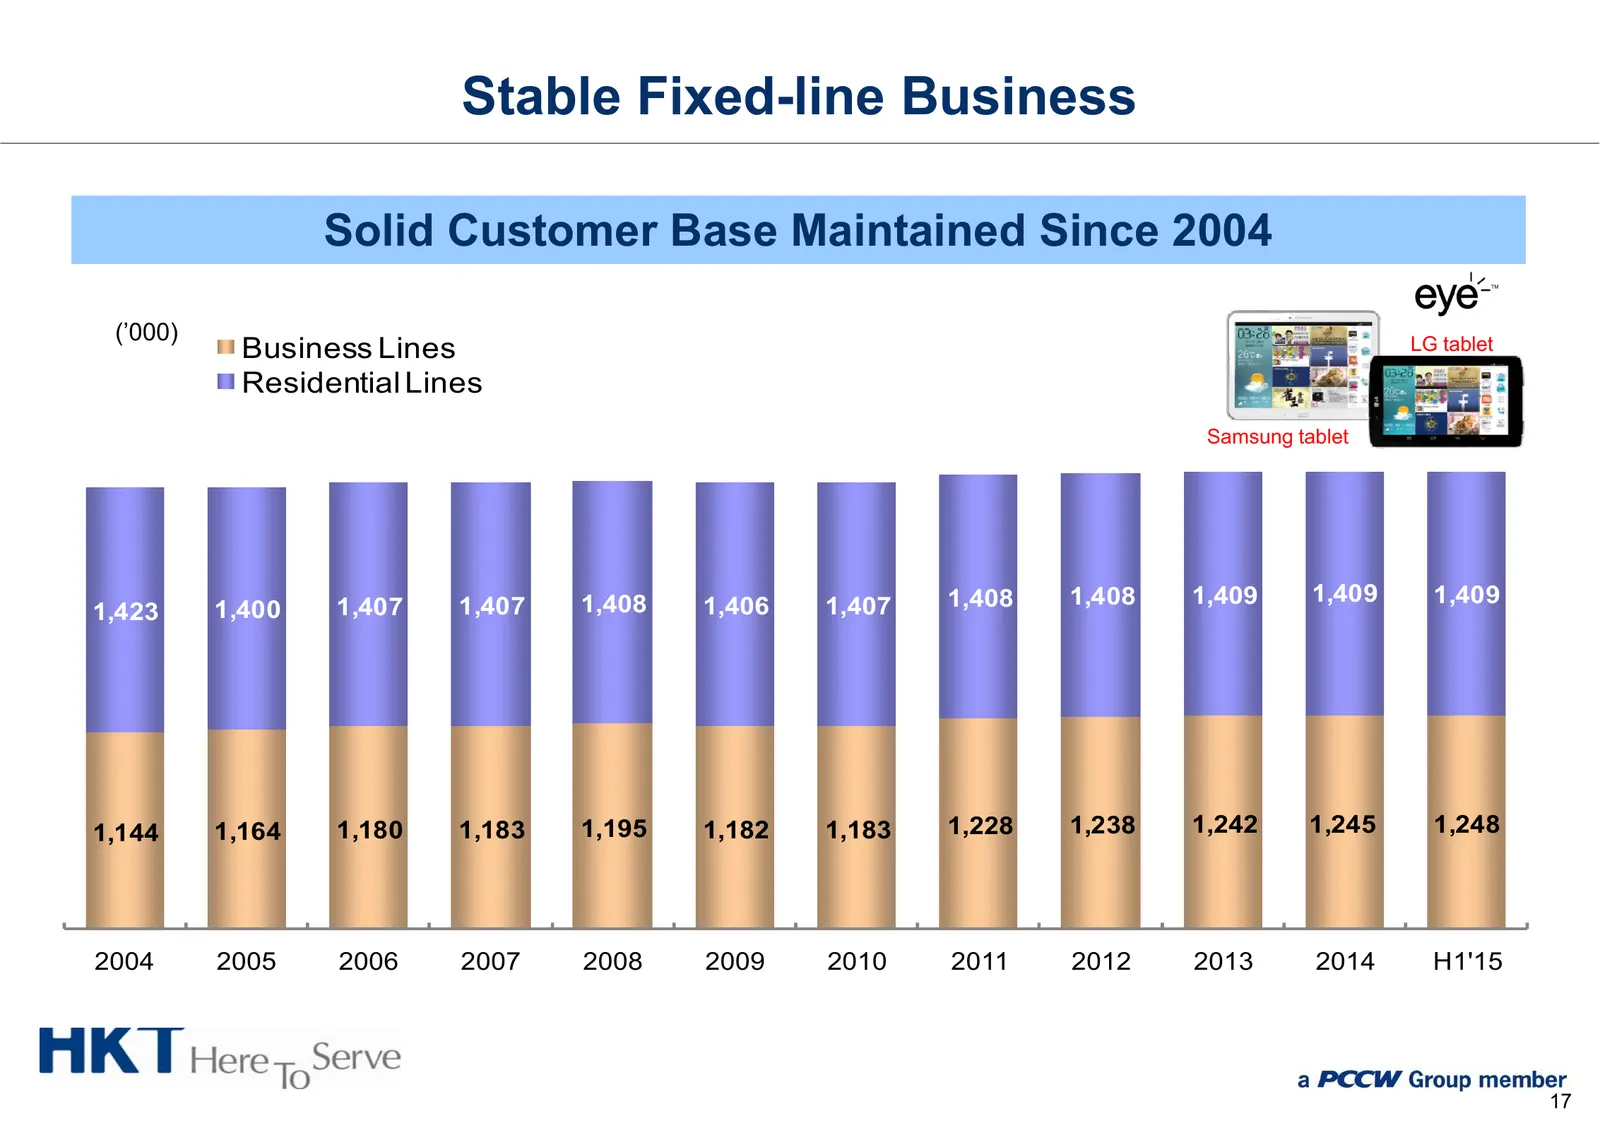
Stable Fixed-line Business Solid Customer Base Maintained Since 2004 (’000) Business Lines LG tablet Residential Lines Samsung tablet 1,408 1,408 1,408 1,409 1,409 1,409 1,423 1,400 1,407 1,407 1,406 1,407 1,144 1,164 1,180 1,183 1,195 1,182 1,183 1,228 1,238 1,242 1,245 1,248 2004 2005 2006 2007 20
Slide 19: Consolidated Position in Broadband
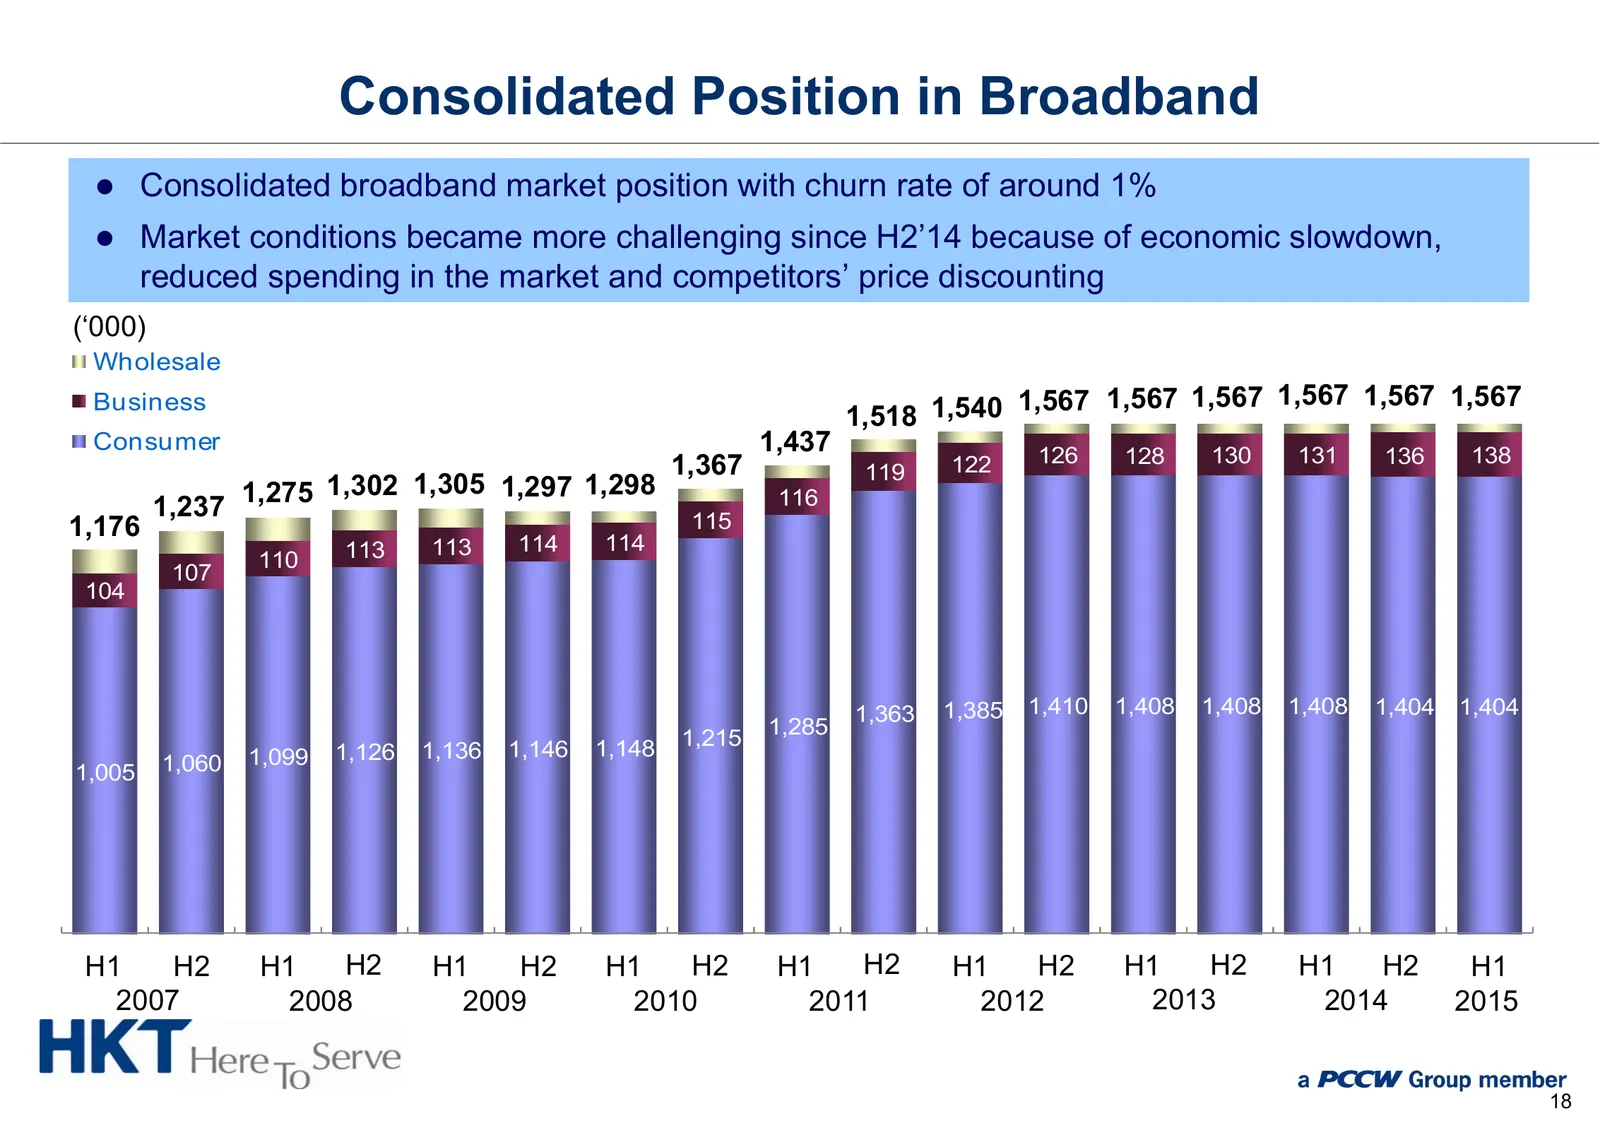
Consolidated Position in Broadband z Consolidated broadband market position with churn rate of around 1% z Market conditions became more challenging since H2’14 because of economic slowdown, reduced spending in the market and competitors’ price discounting (‘000) Wholesale Business 1,567 1,567 1,567
Slide 20: Continued Growth of Fiber Customers
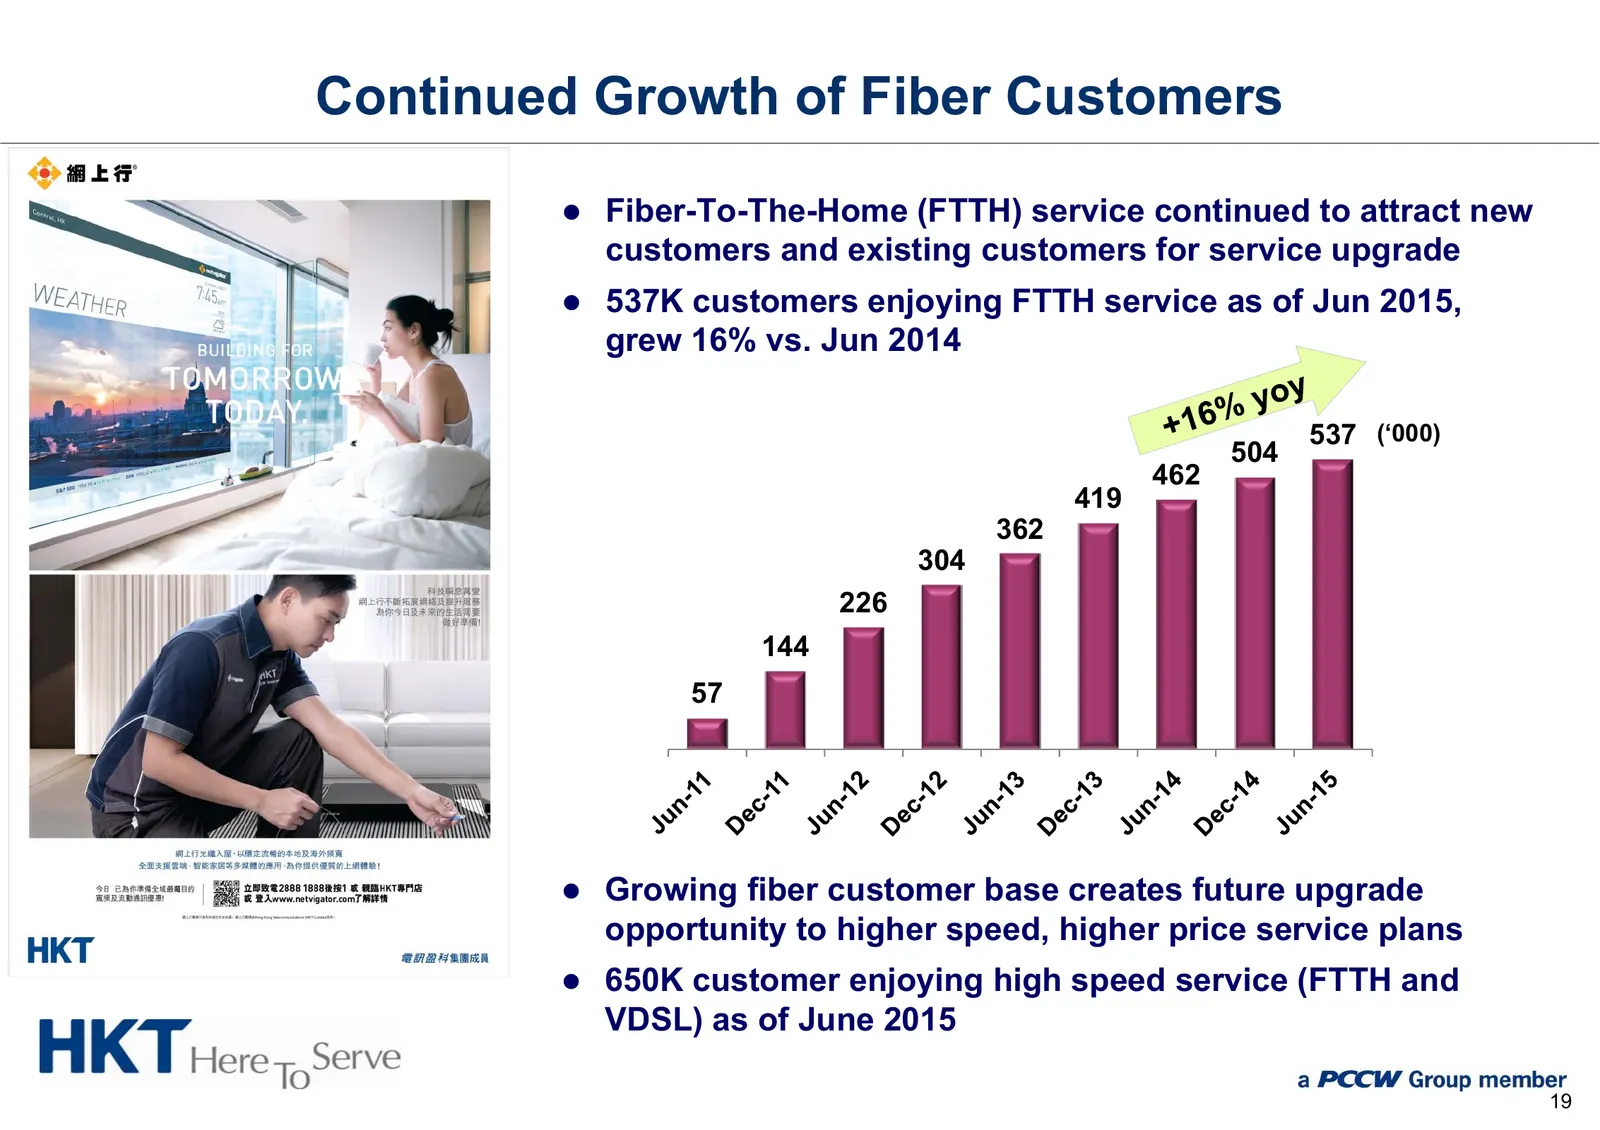
Continued Growth of Fiber Customers z Fiber-To-The-Home (FTTH) service continued to attract new customers and existing customers for service upgrade z 537K customers enjoying FTTH service as of Jun 2015, grew 16% vs. Jun 2014 537 (‘000) 504 462 419 362 304 226 144 57 z Growing fiber customer base cr
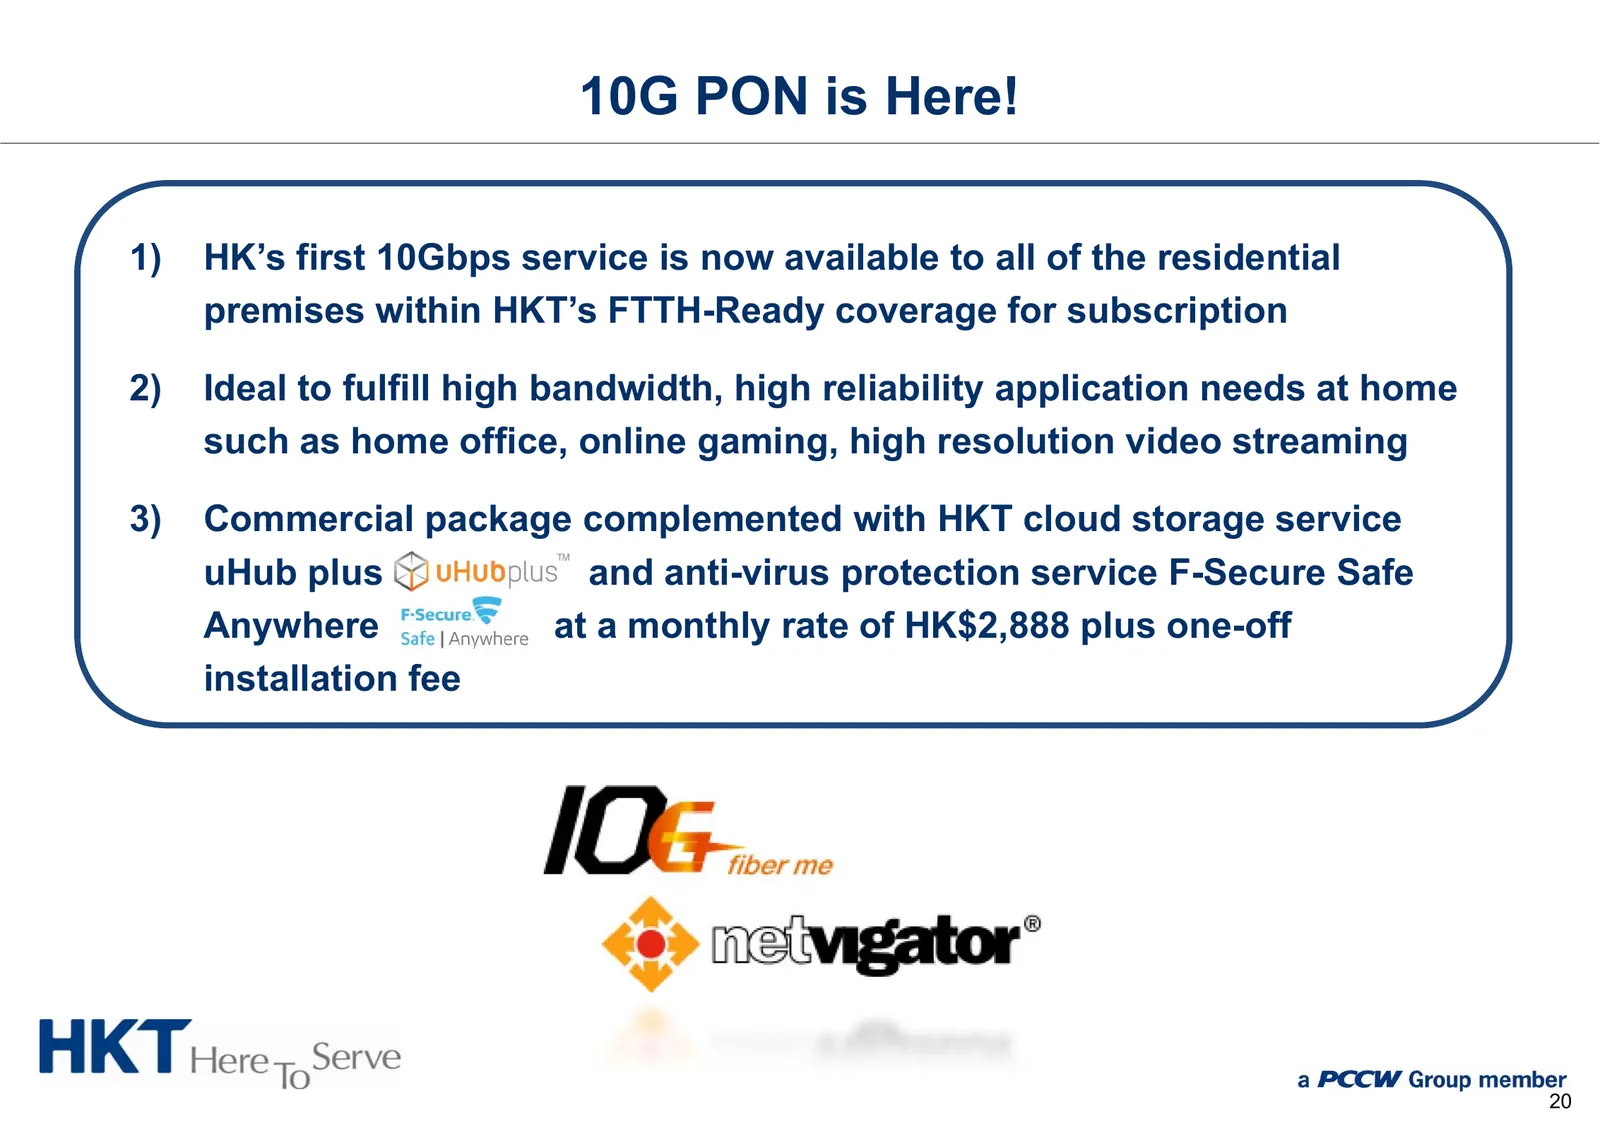
Slide 21: 10G PON is Here!
10G PON is Here! 1) HK’s first 10Gbps service is now available to all of the residential premises within HKT’s FTTH-Ready coverage for subscription 2) Ideal to fulfill high bandwidth, high reliability application needs at home such as home office, online gaming, high resolution video streaming 3) Co
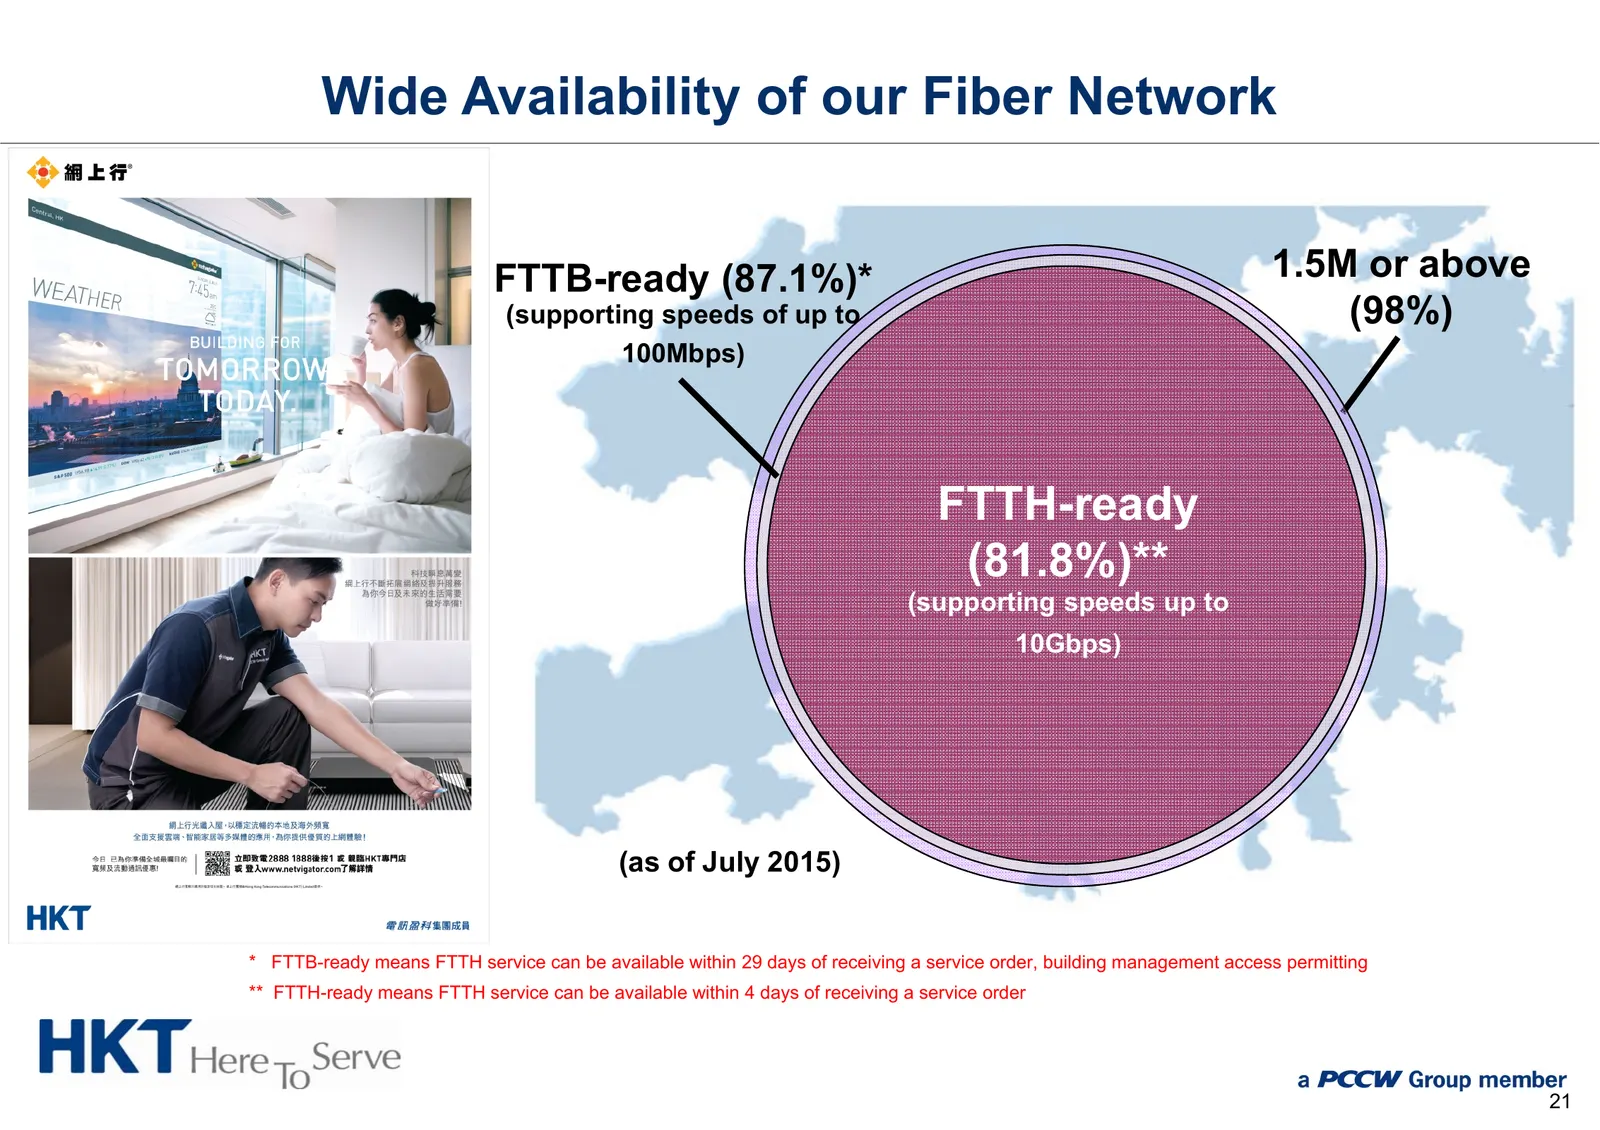
Slide 22: Wide Availability of our Fiber Network
Wide Availability of our Fiber Network FTTB-ready (87.1%)* 1.5M or above (supporting speeds of up to (98%) 100Mbps) FTTH-ready (81.8%)** (supporting speeds up to 10Gbps) (as of July 2015) * FTTB-ready means FTTH service can be available within 29 days of receiving a service order, building managemen
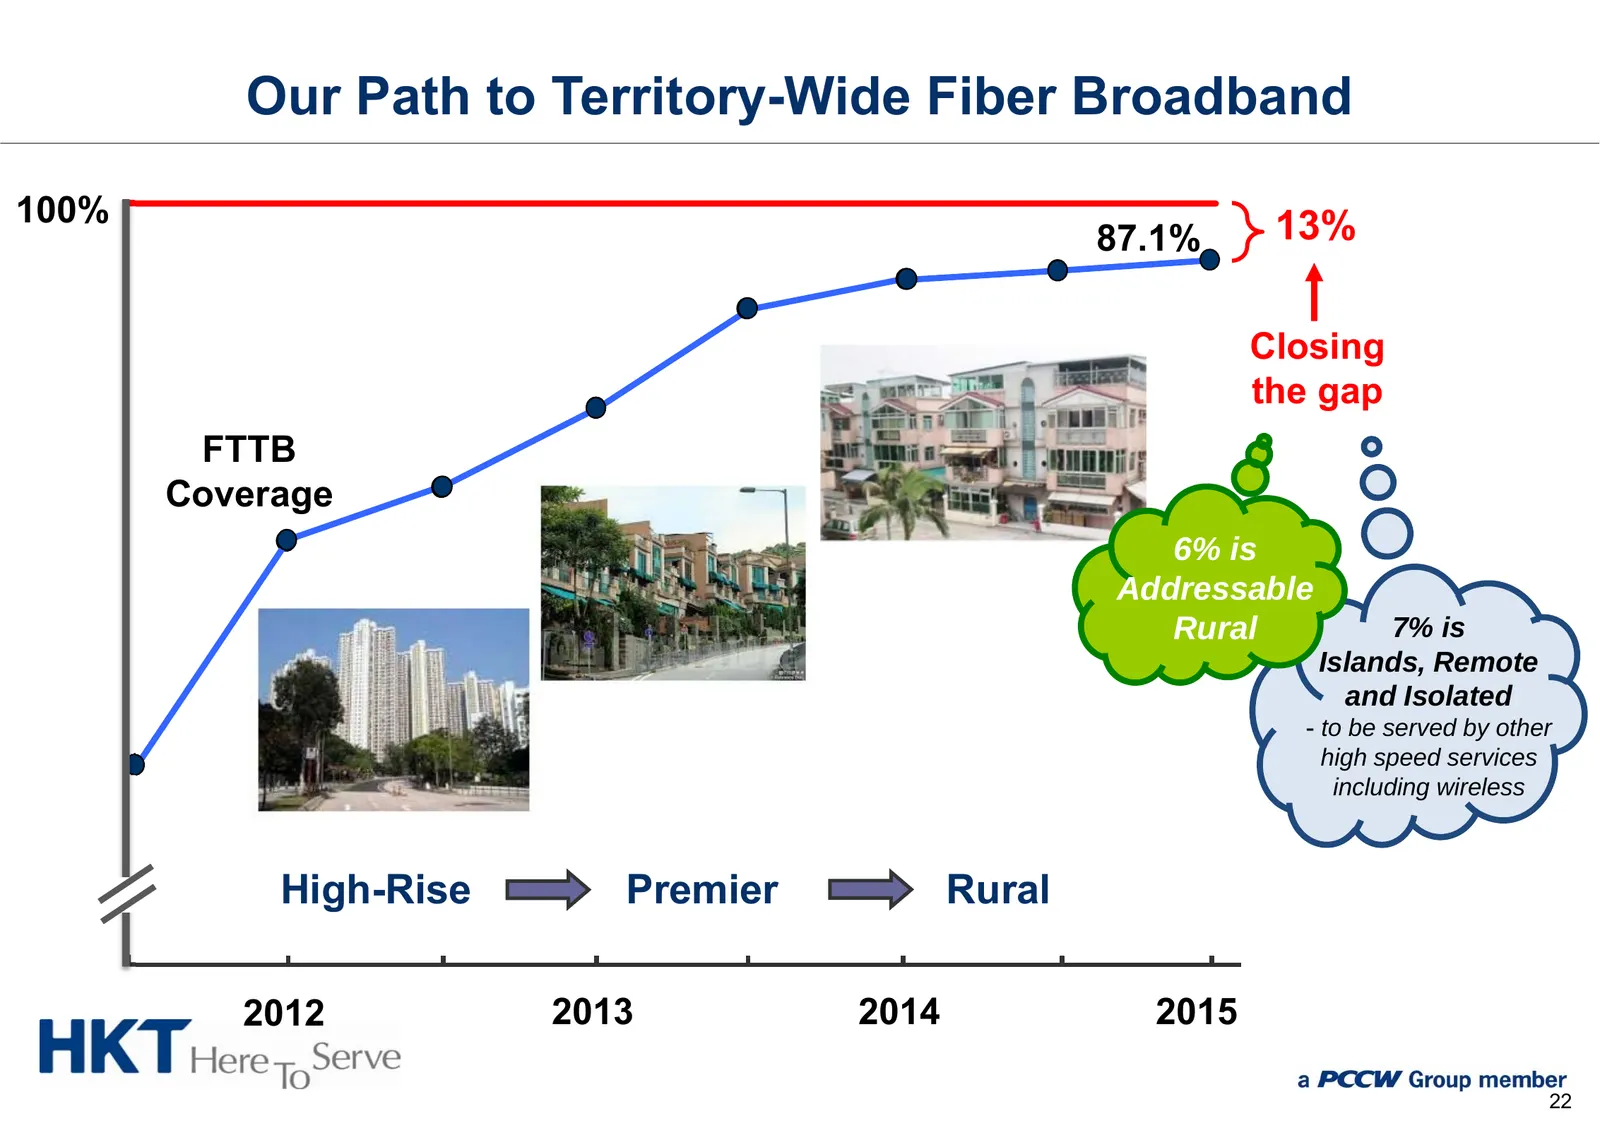
Slide 23: Our Path to Territory-Wide Fiber Broadband
Our Path to Territory-Wide Fiber Broadband 100% 13% 87.1% Closing the gap FTTB Coverage 6% is Addressable Rural 7% is Islands, Remote and Isolated - to be served by other high speed services including wireless High-Rise Premier Rural 2012 2013 2014 2015 22
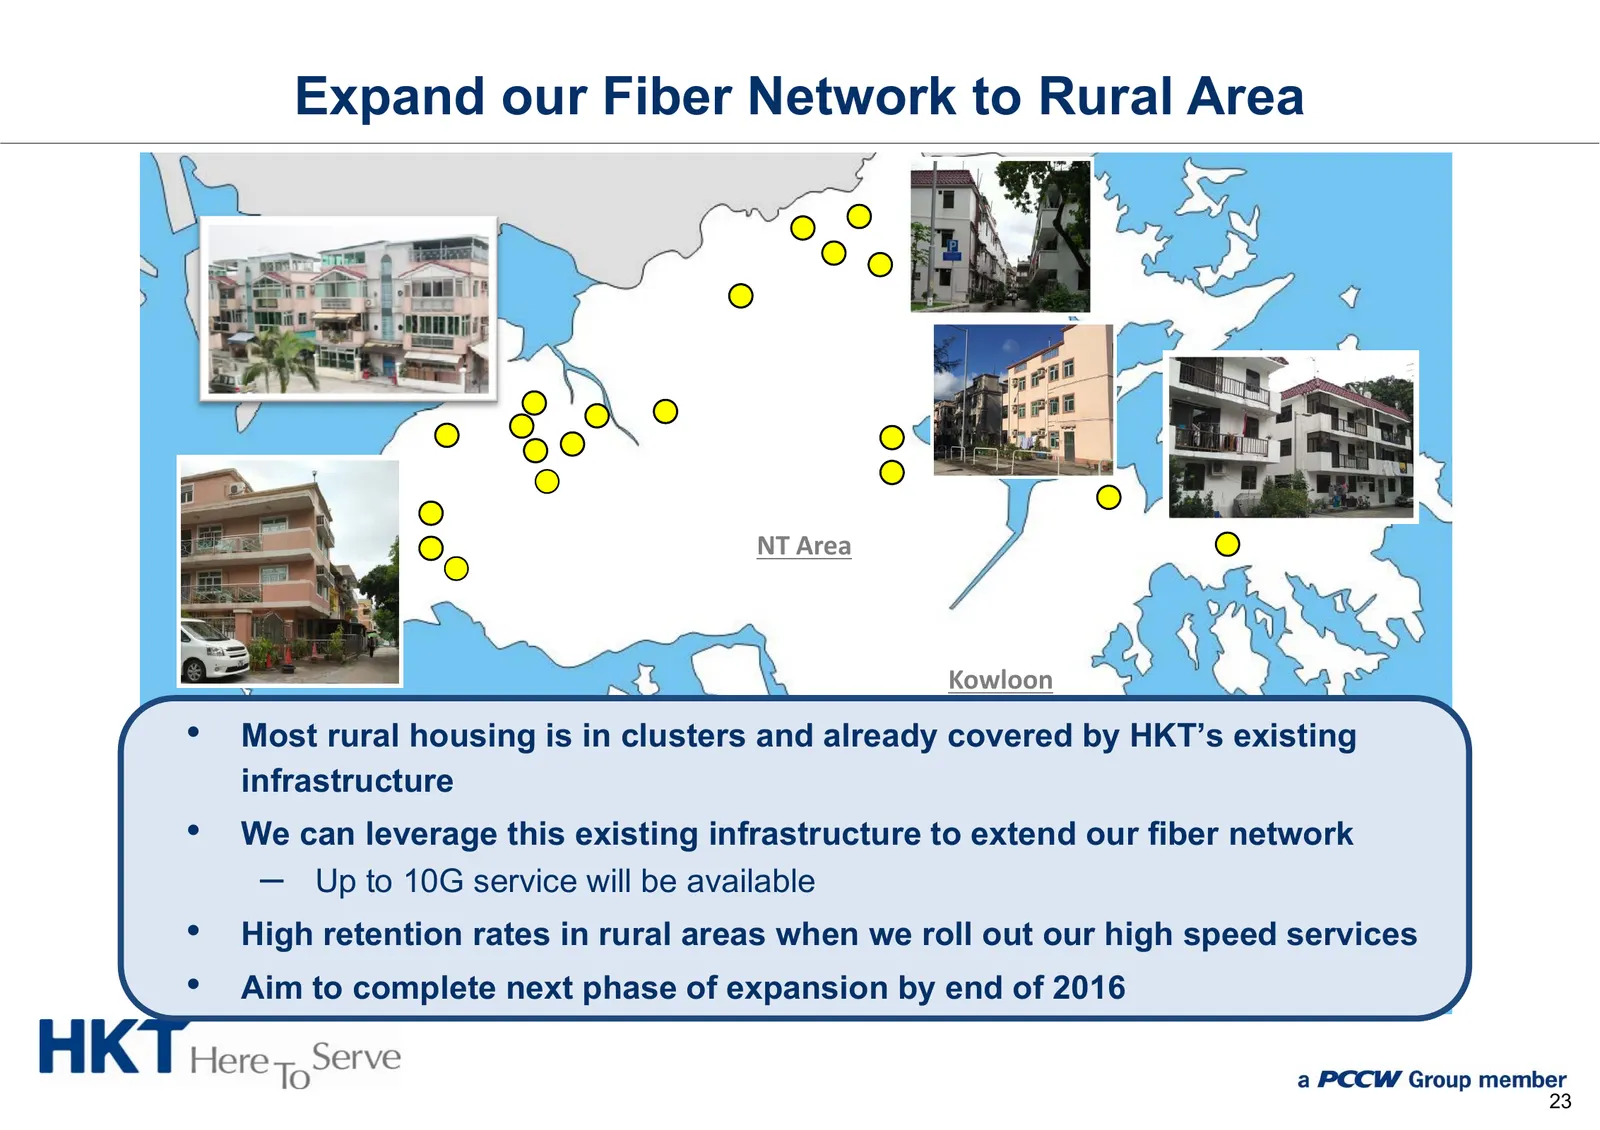
Slide 24: Expand our Fiber Network to Rural Area
Expand our Fiber Network to Rural Area NT Area Kowloon • Most rural housing is in clusters and already covered by HKT’s existing infrastructure • We can leverage this existing infrastructure to extend our fiber network – Up to 10G service will be available Hong Kong Lantau Island Island • High reten
Slide 25: Sustained Strong Performance in Mobile Business
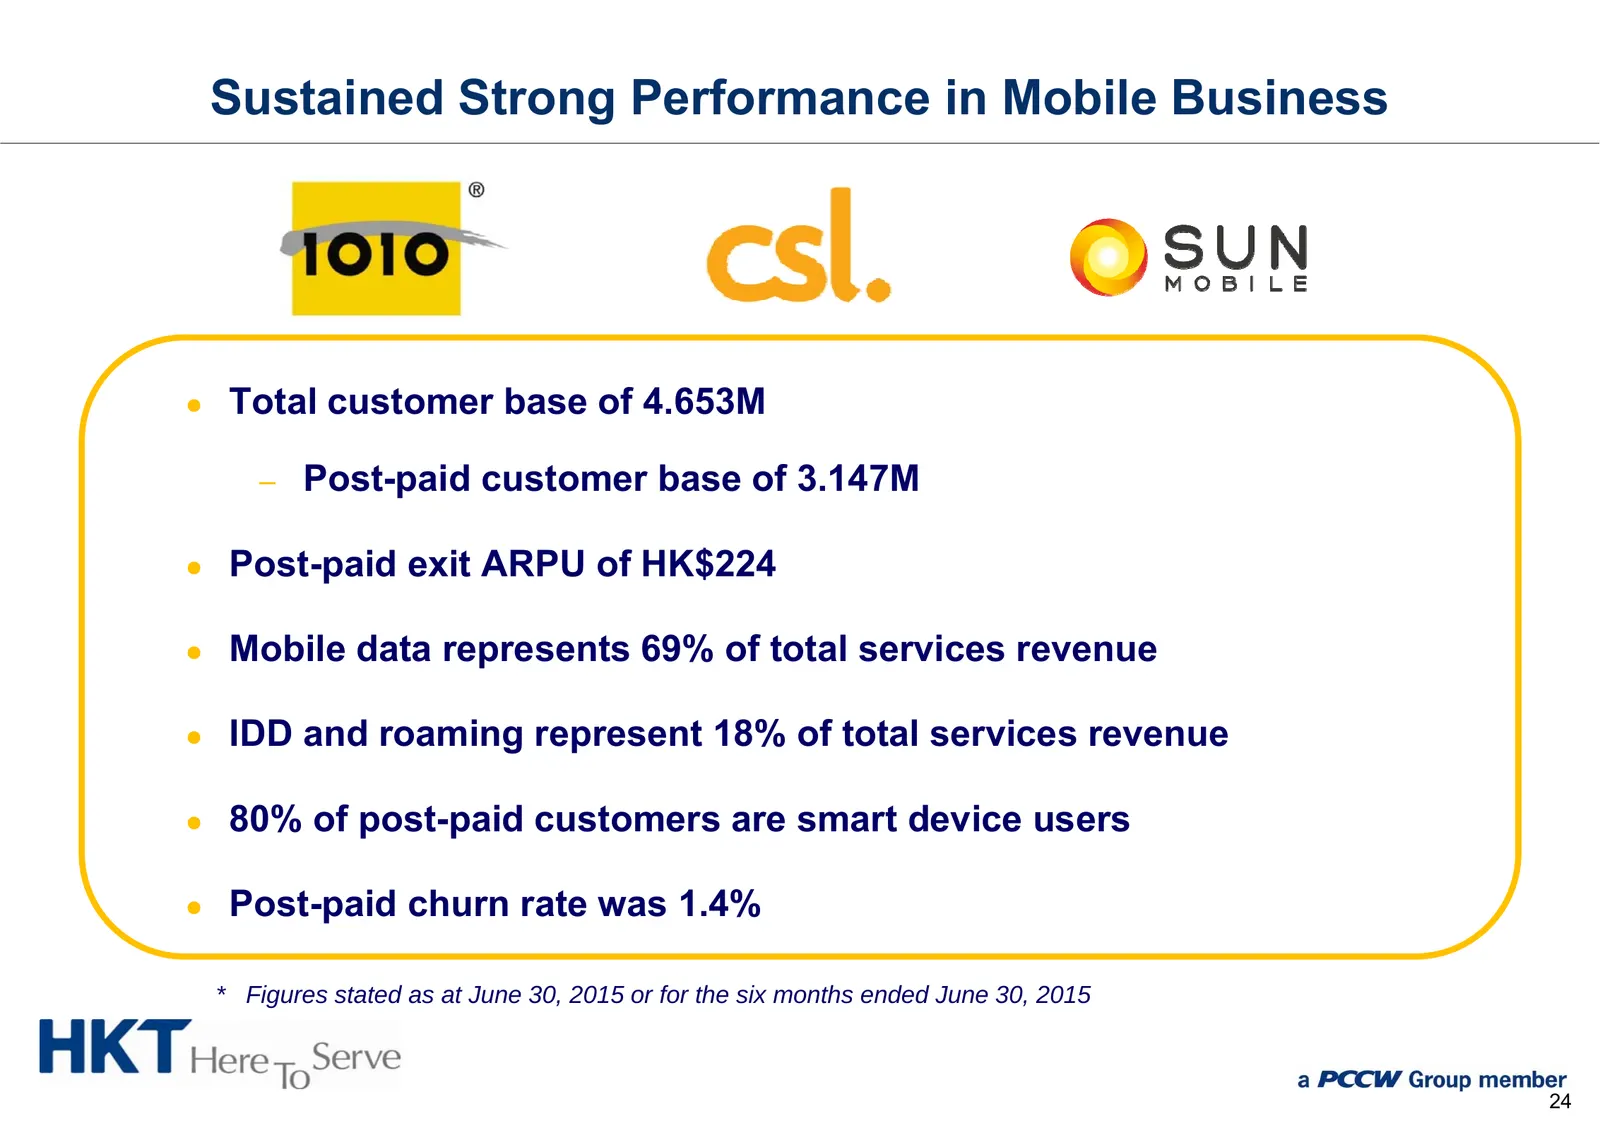
Sustained Strong Performance in Mobile Business ● Total customer base of 4.653M – Post-paid customer base of 3.147M ● Post-paid exit ARPU of HK$224 ● Mobile data represents 69% of total services revenue ● IDD and roaming represent 18% of total services revenue ● 80% of post-paid customers are smart
Slide 26: Network Integration Upgrade Plan
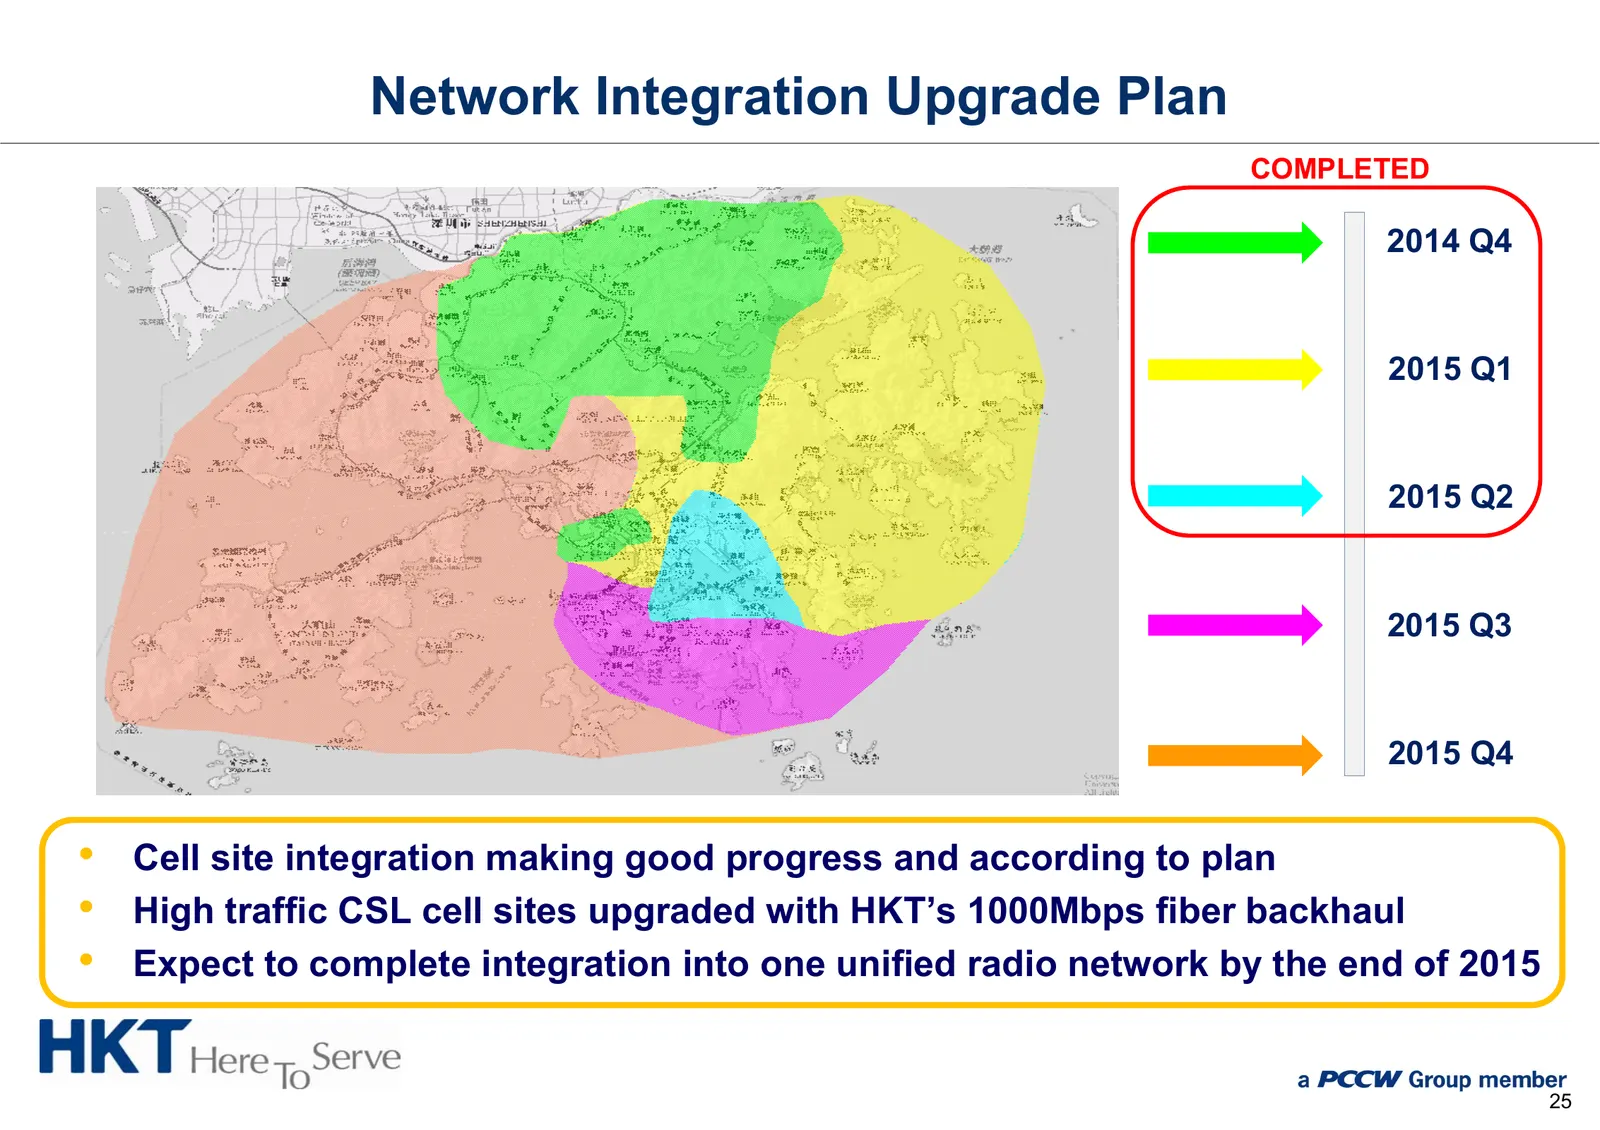
Network Integration Upgrade Plan COMPLETED 2014 Q4 2015 Q1 2015 Q2 2015 Q3 2015 Q4 • Cell site integration making good progress and according to plan • High traffic CSL cell sites upgraded with HKT’s 1000Mbps fiber backhaul • Expect to complete integration into one unified radio network by the end o
Slide 27: Significant Progress on Cell Site Integration
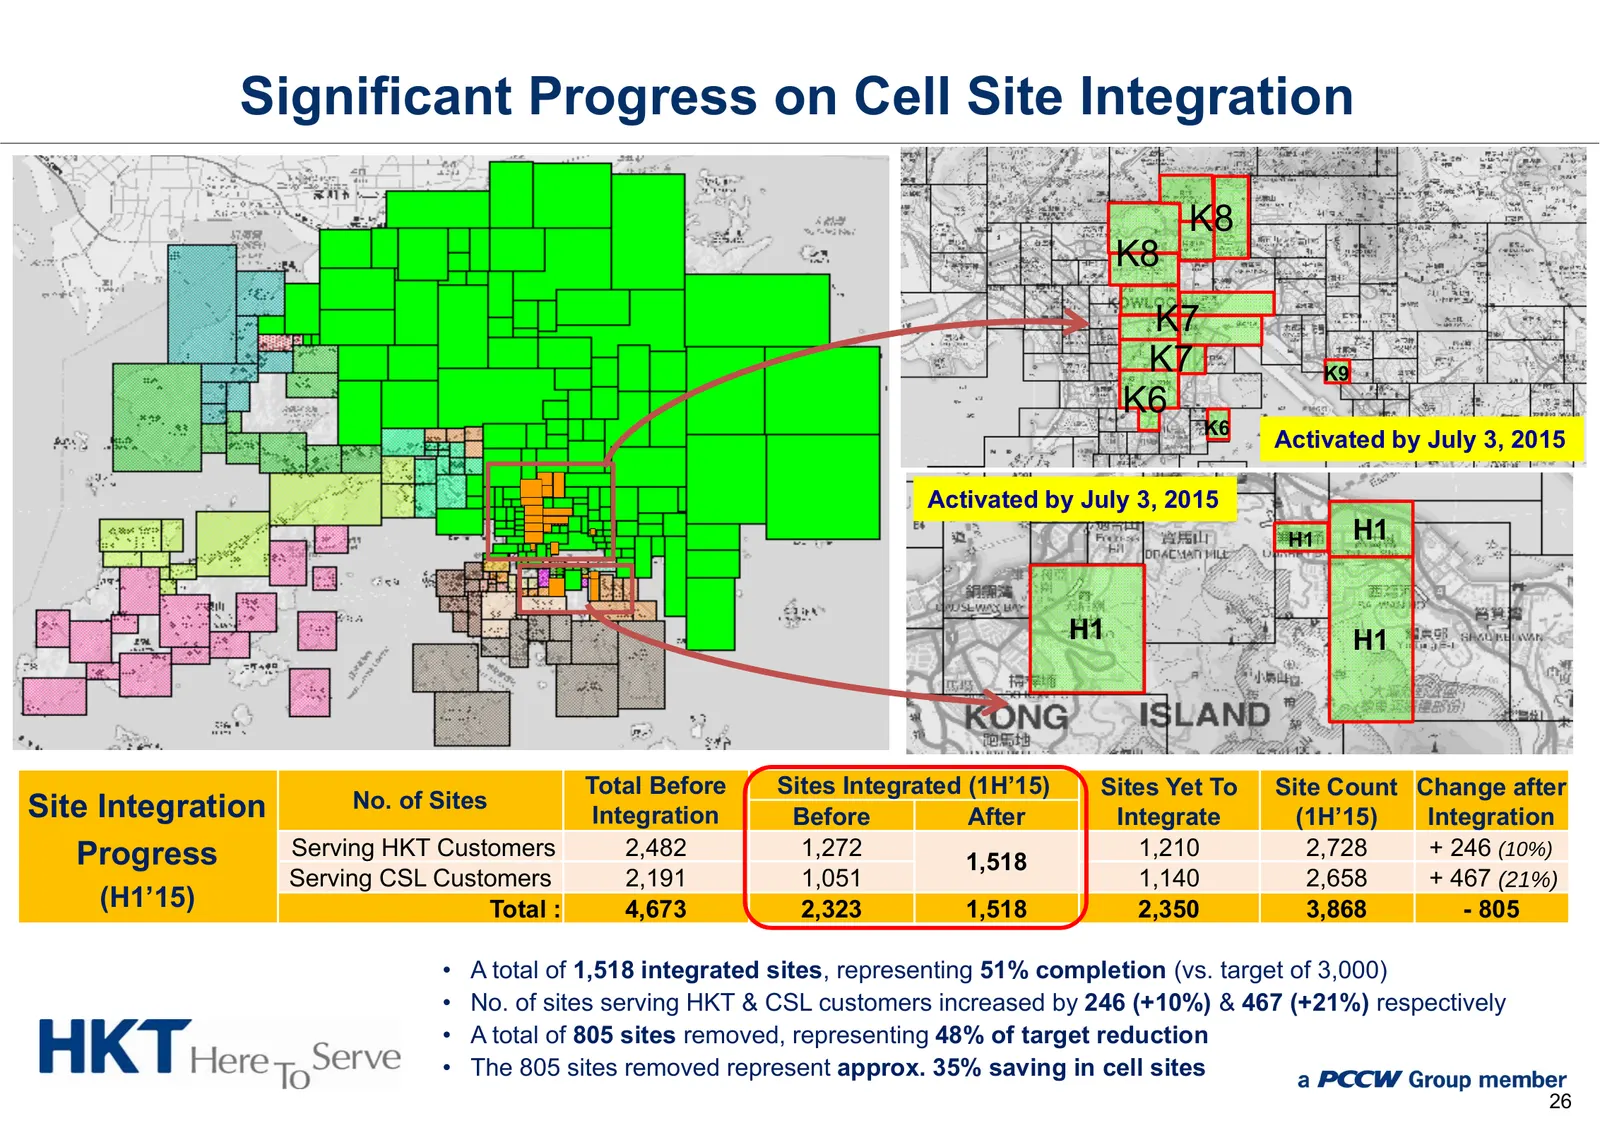
Significant Progress on Cell Site Integration K8 K8 K7 K7 K9 K6 K6 Activated by July 3, 2015 Activated by July 3, 2015 H1 H1 H1 H1 Total Before Sites Integrated (1H’15) Sites Yet To Site Count Change after Site Integration No. of Sites Integration Before After Integrate (1H’15) Integration Progress
Slide 28: Superior Mobile Network
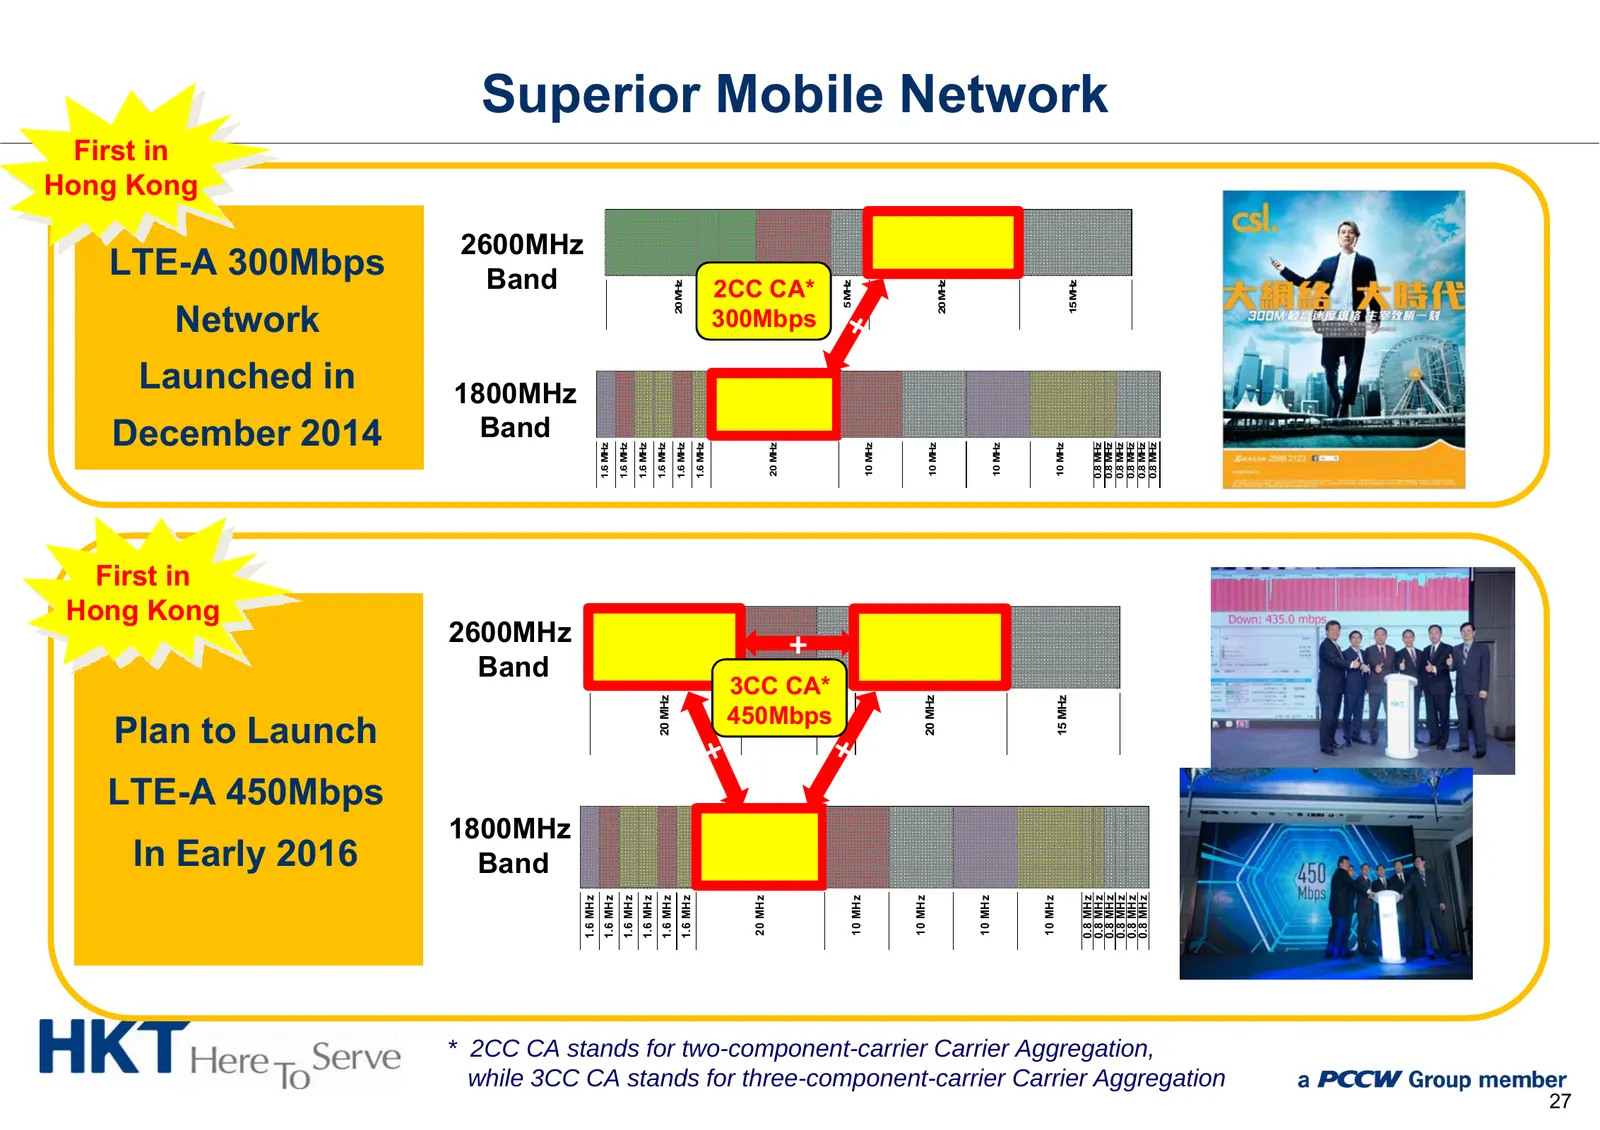
Superior Mobile Network First in Hong Kong 2600MHz LTE-A 300Mbps Band 2CC CA* 20 MHz 10 MHz 5 MHz 20 MHz 15 MHz Network 300Mbps Launched in 1800MHz December 2014 Band 1.6 MHz 1.6 MHz 1.6 MHz 1.6 MHz 1.6 MHz 1.6 MHz 20 MHz 10 MHz 10 MHz 10 MHz 10 MHz 0.8 MHz 0.8 MHz 0.8 MHz 0.8 MHz 0.8 MHz 0.8 MHz Fi
Slide 29: Continued Innovation and Enhanced Customer Service
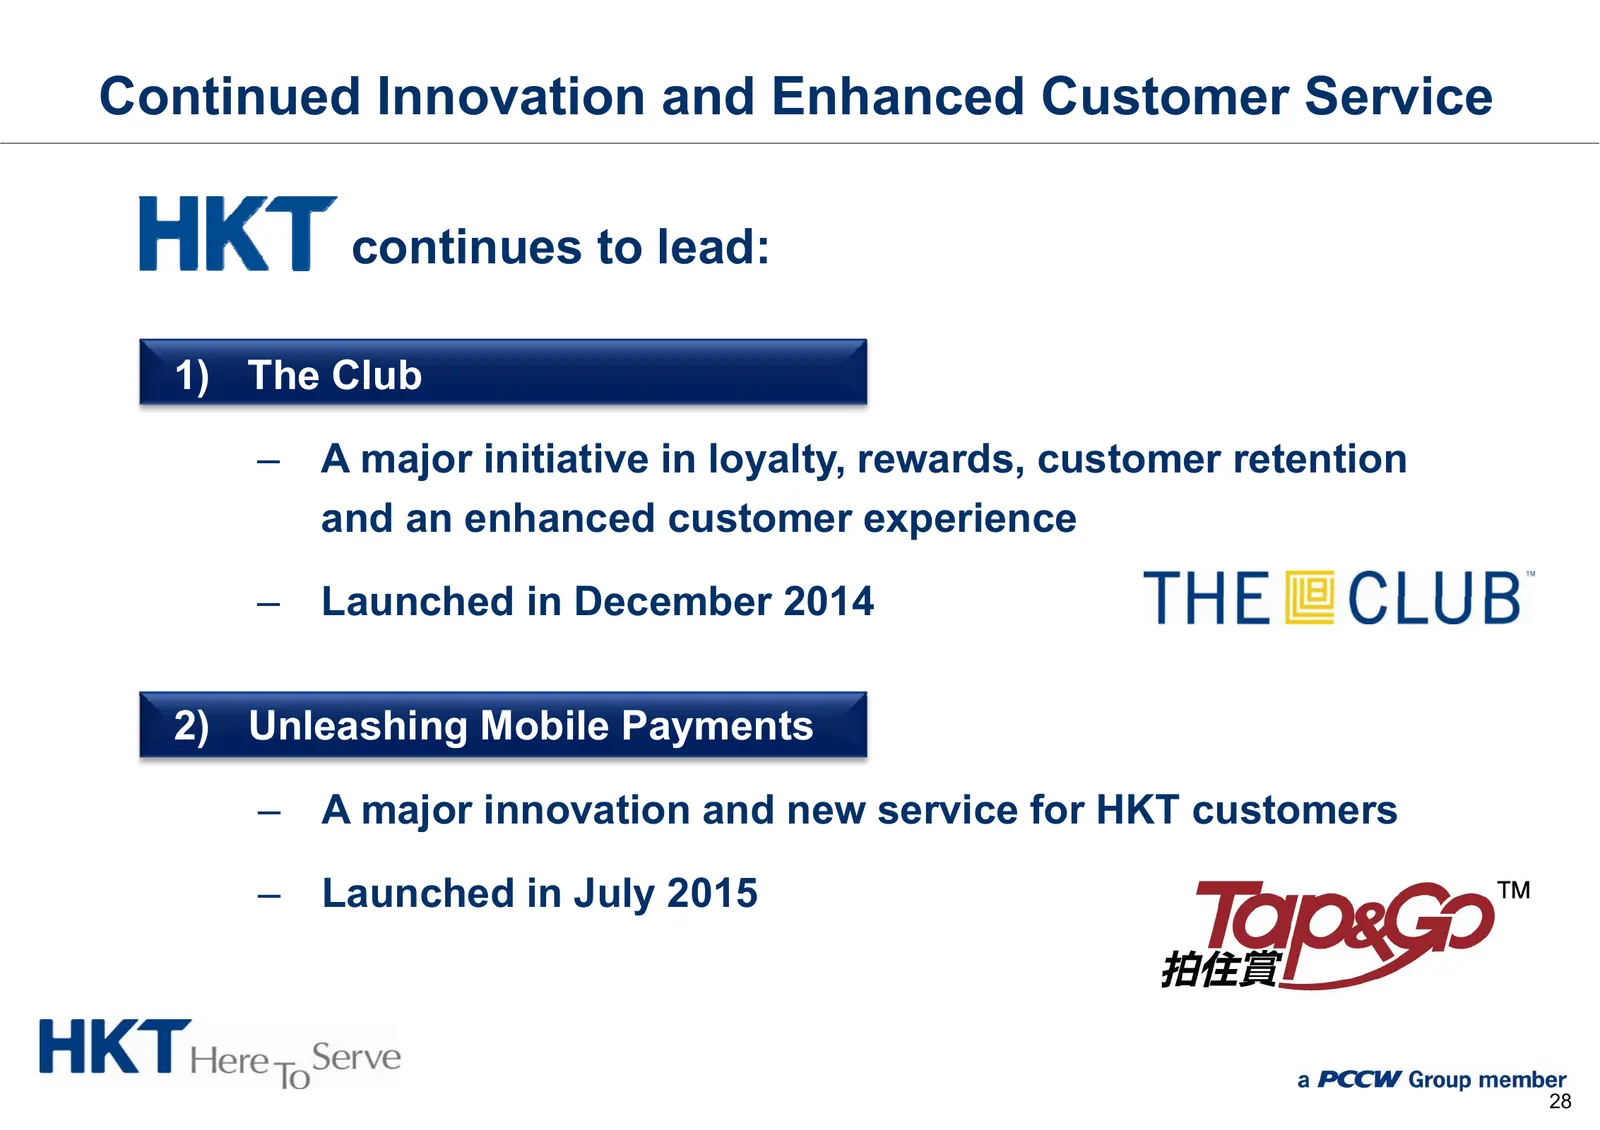
Continued Innovation and Enhanced Customer Service continues to lead: 1) The Club – A major initiative in loyalty, rewards, customer retention and an enhanced customer experience – Launched in December 2014 2) Unleashing Mobile Payments – A major innovation and new service for HKT customers – Launch
Slide 30: Loyalty and Rewards Program
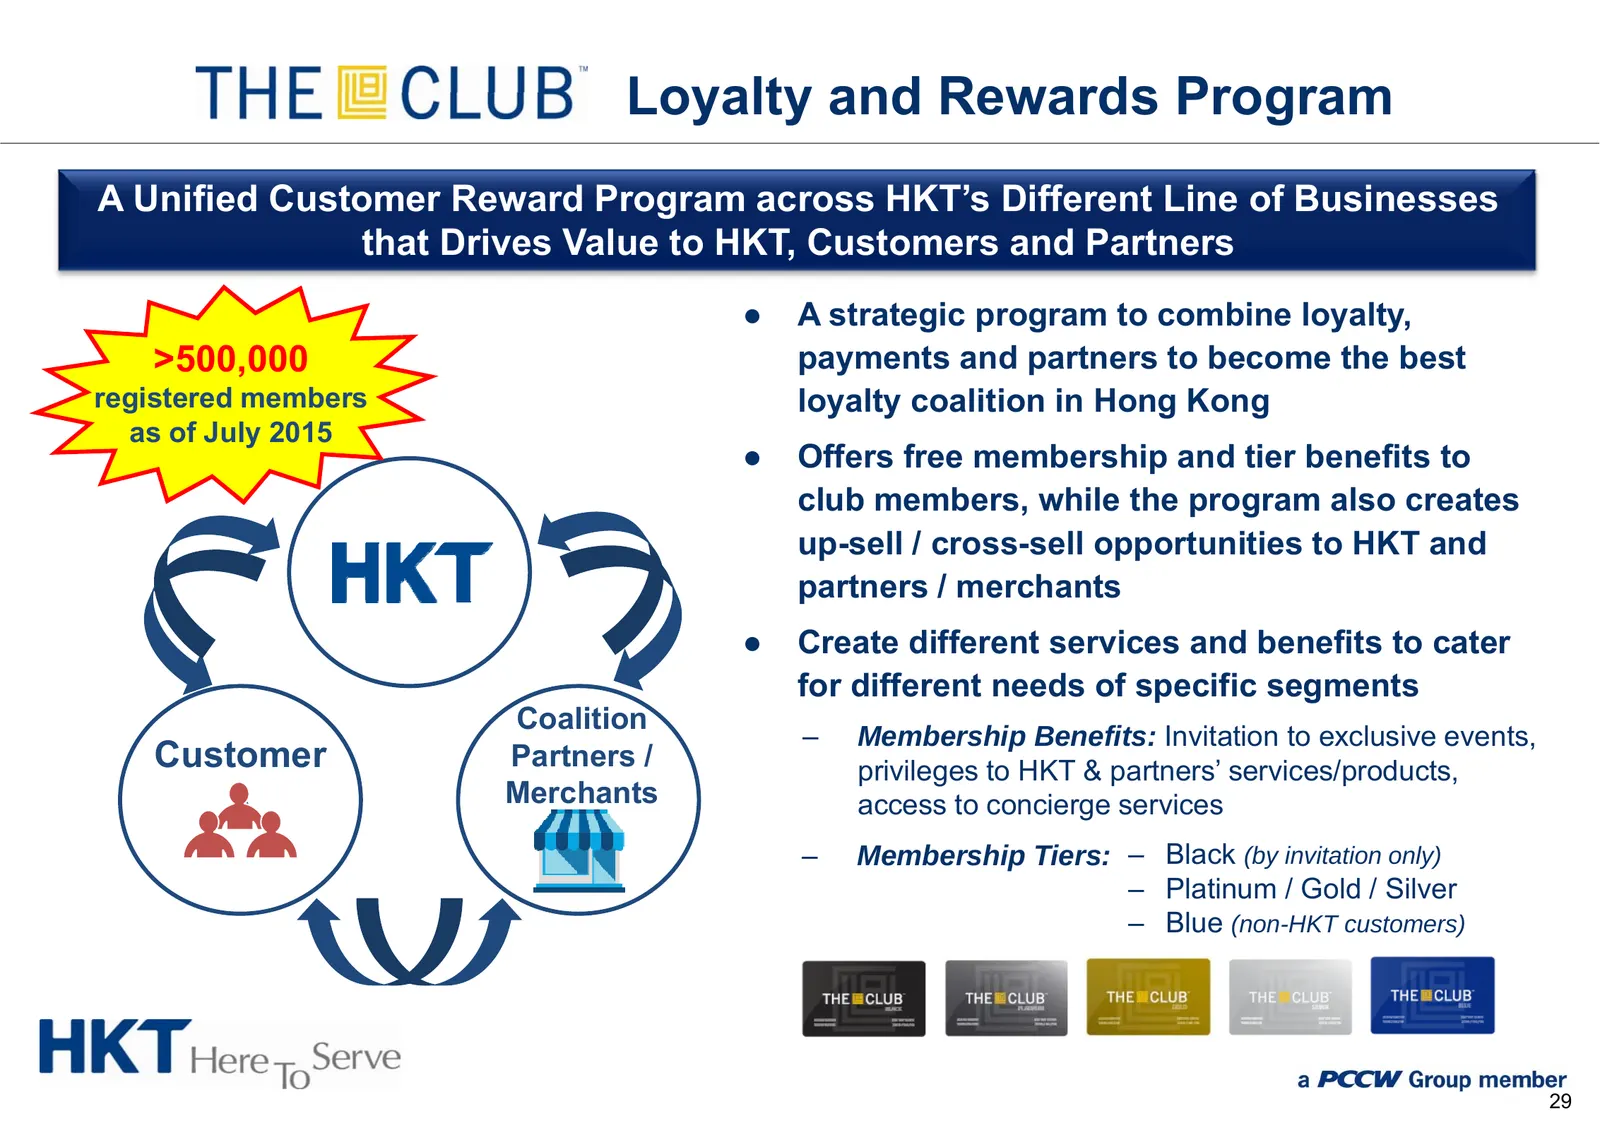
Loyalty and Rewards Program A Unified Customer Reward Program across HKT’s Different Line of Businesses that Drives Value to HKT, Customers and Partners ● A strategic program to combine loyalty, >500,000 payments and partners to become the best registered members loyalty coalition in Hong Kong as of
Slide 31: New Mobile Payment Service
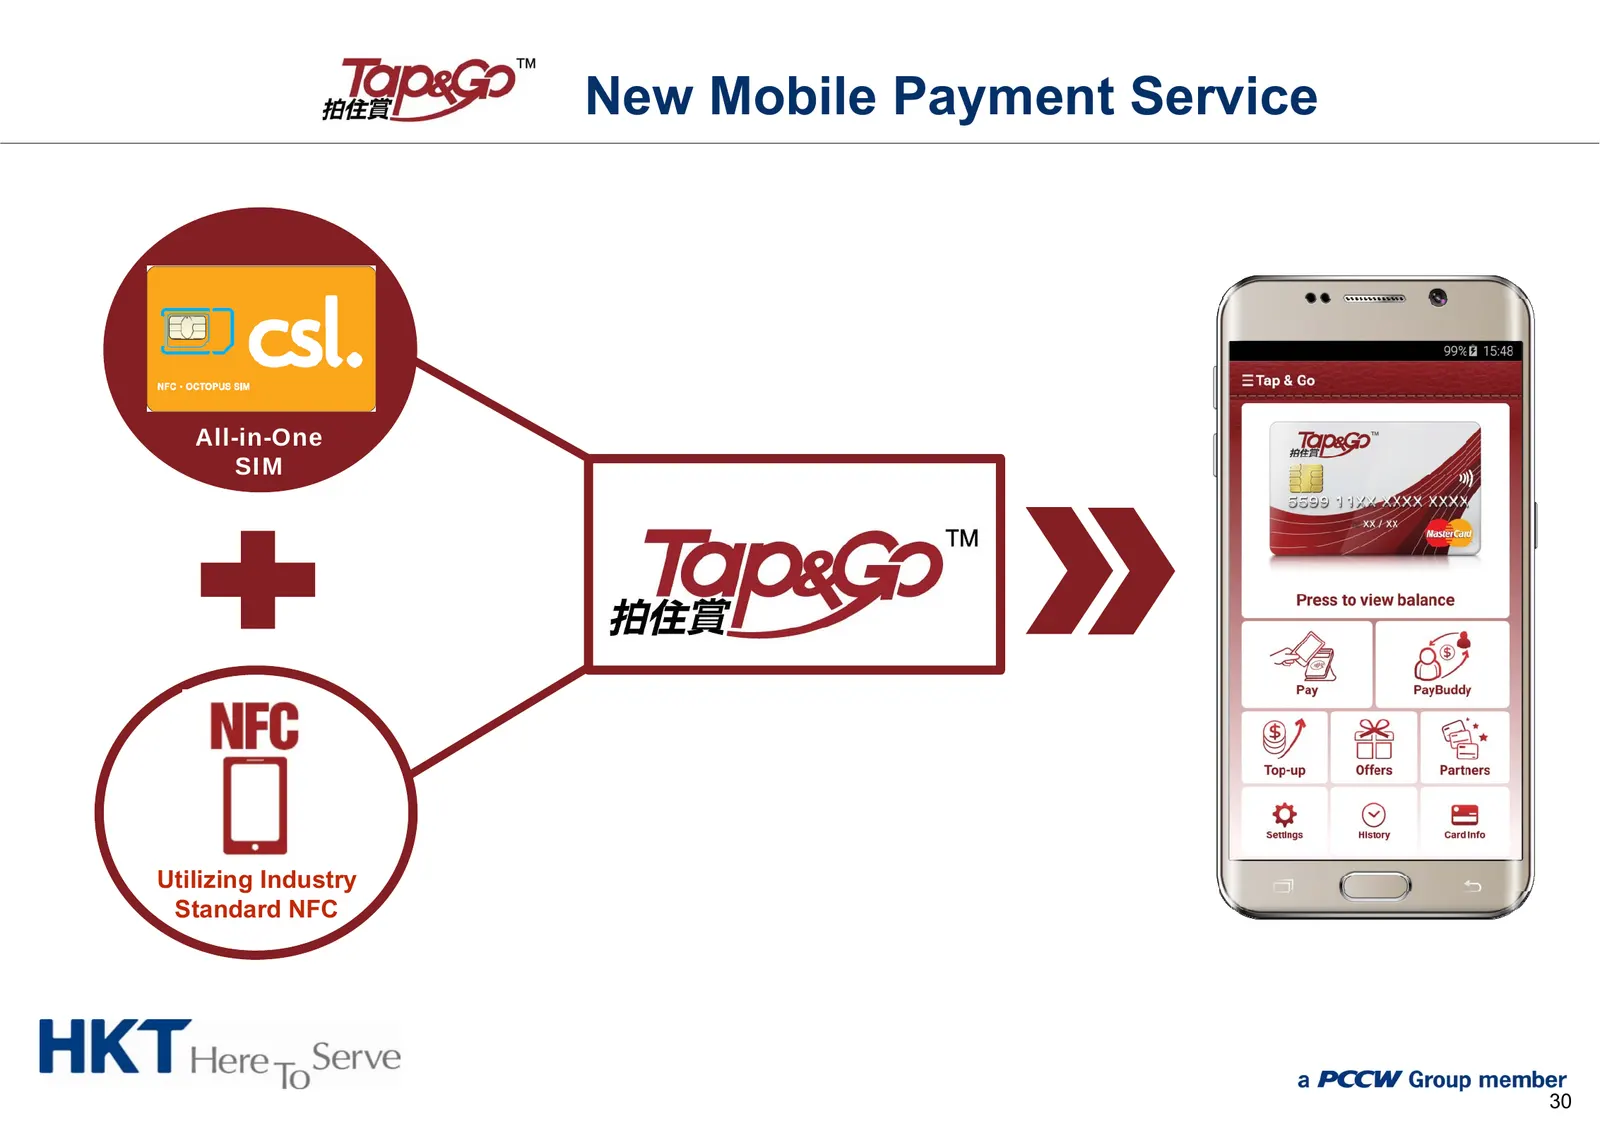
New Mobile Payment Service All-in-One SIM Utilizing Industry Standard NFC 30
Slide 32: New Mobile Payment Service
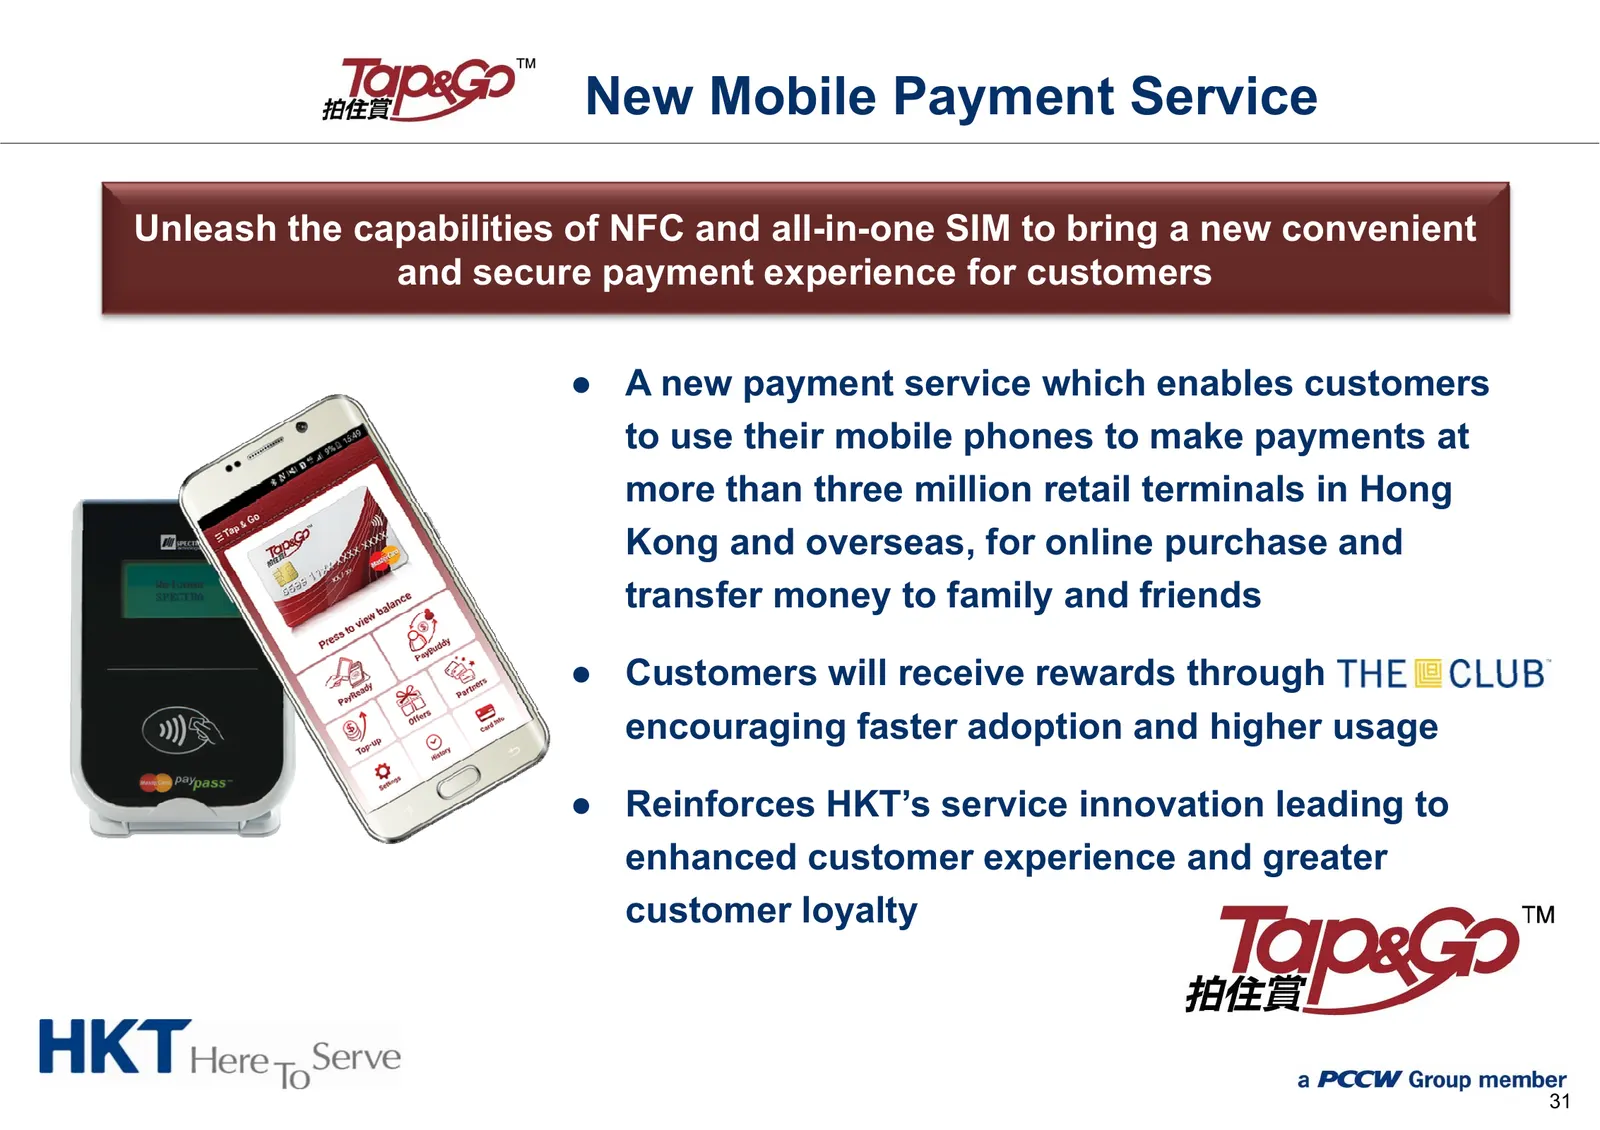
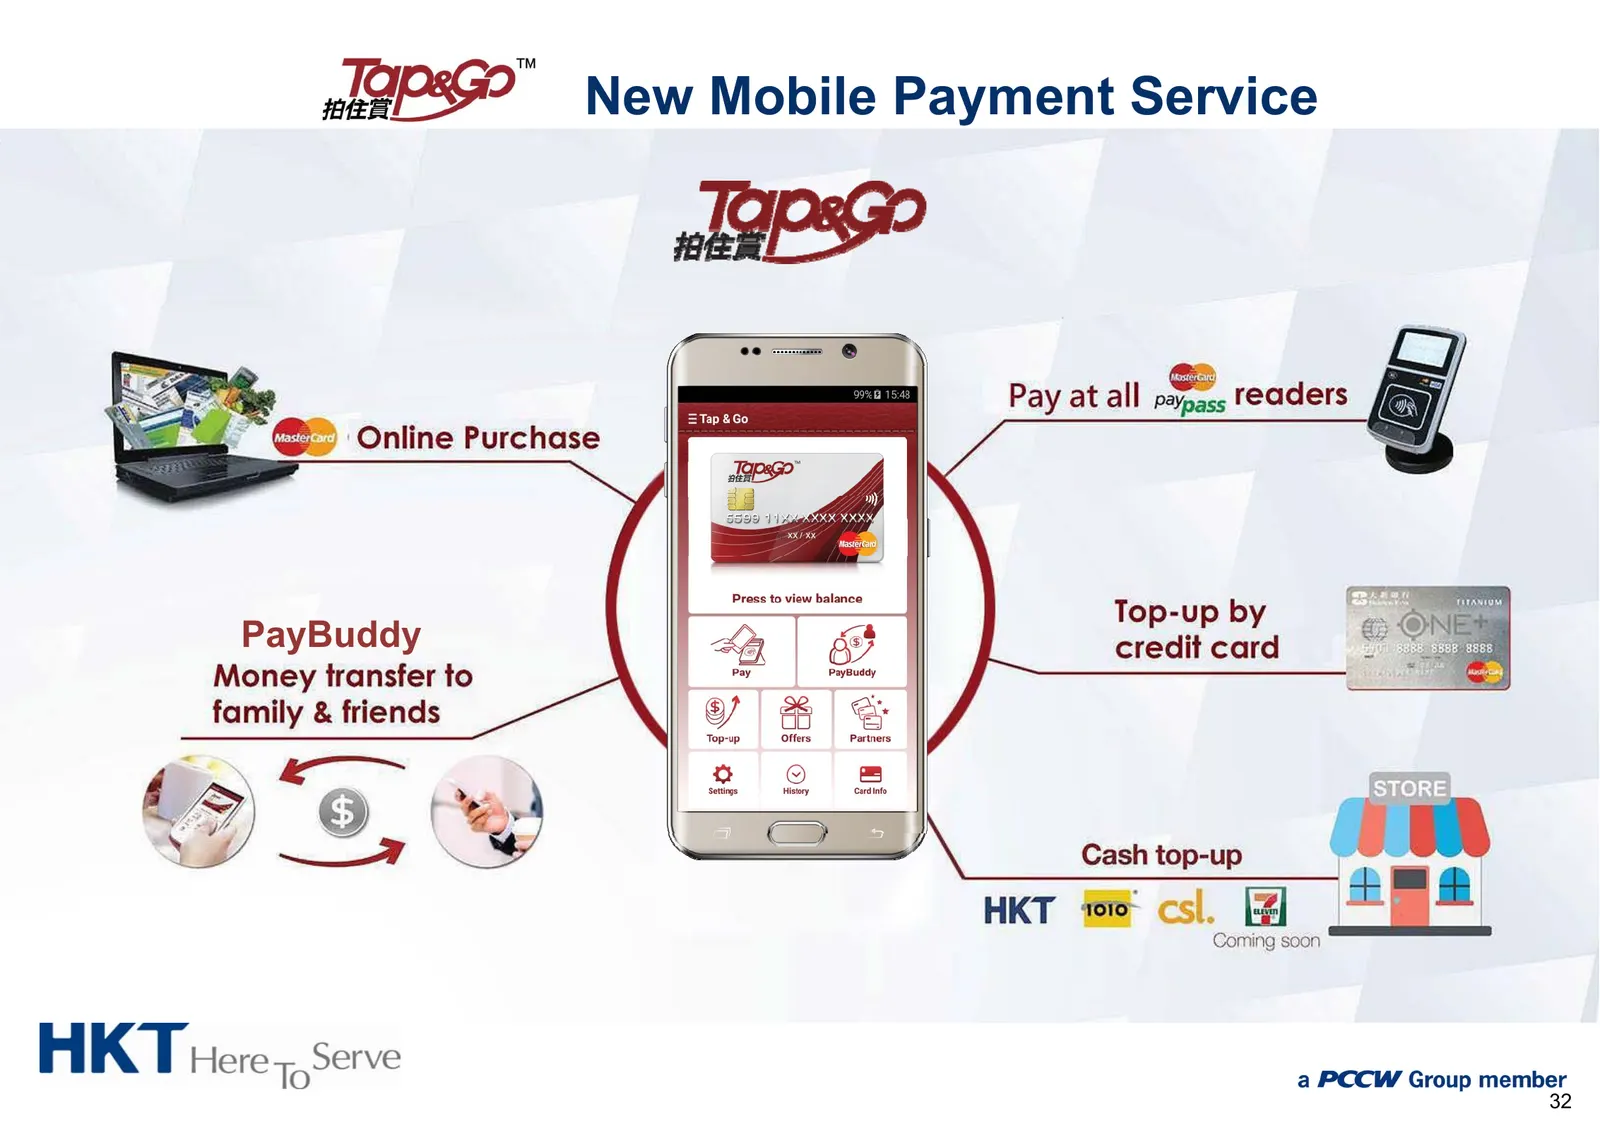
New Mobile Payment Service Unleash the capabilities of NFC and all-in-one SIM to bring a new convenient and secure payment experience for customers ● A new payment service which enables customers to use their mobile phones to make payments at more than three million retail terminals in Hong Kong and
Slide 33: New Mobile Payment Service
New Mobile Payment Service PayBuddy 32
Slide 34: Highlights
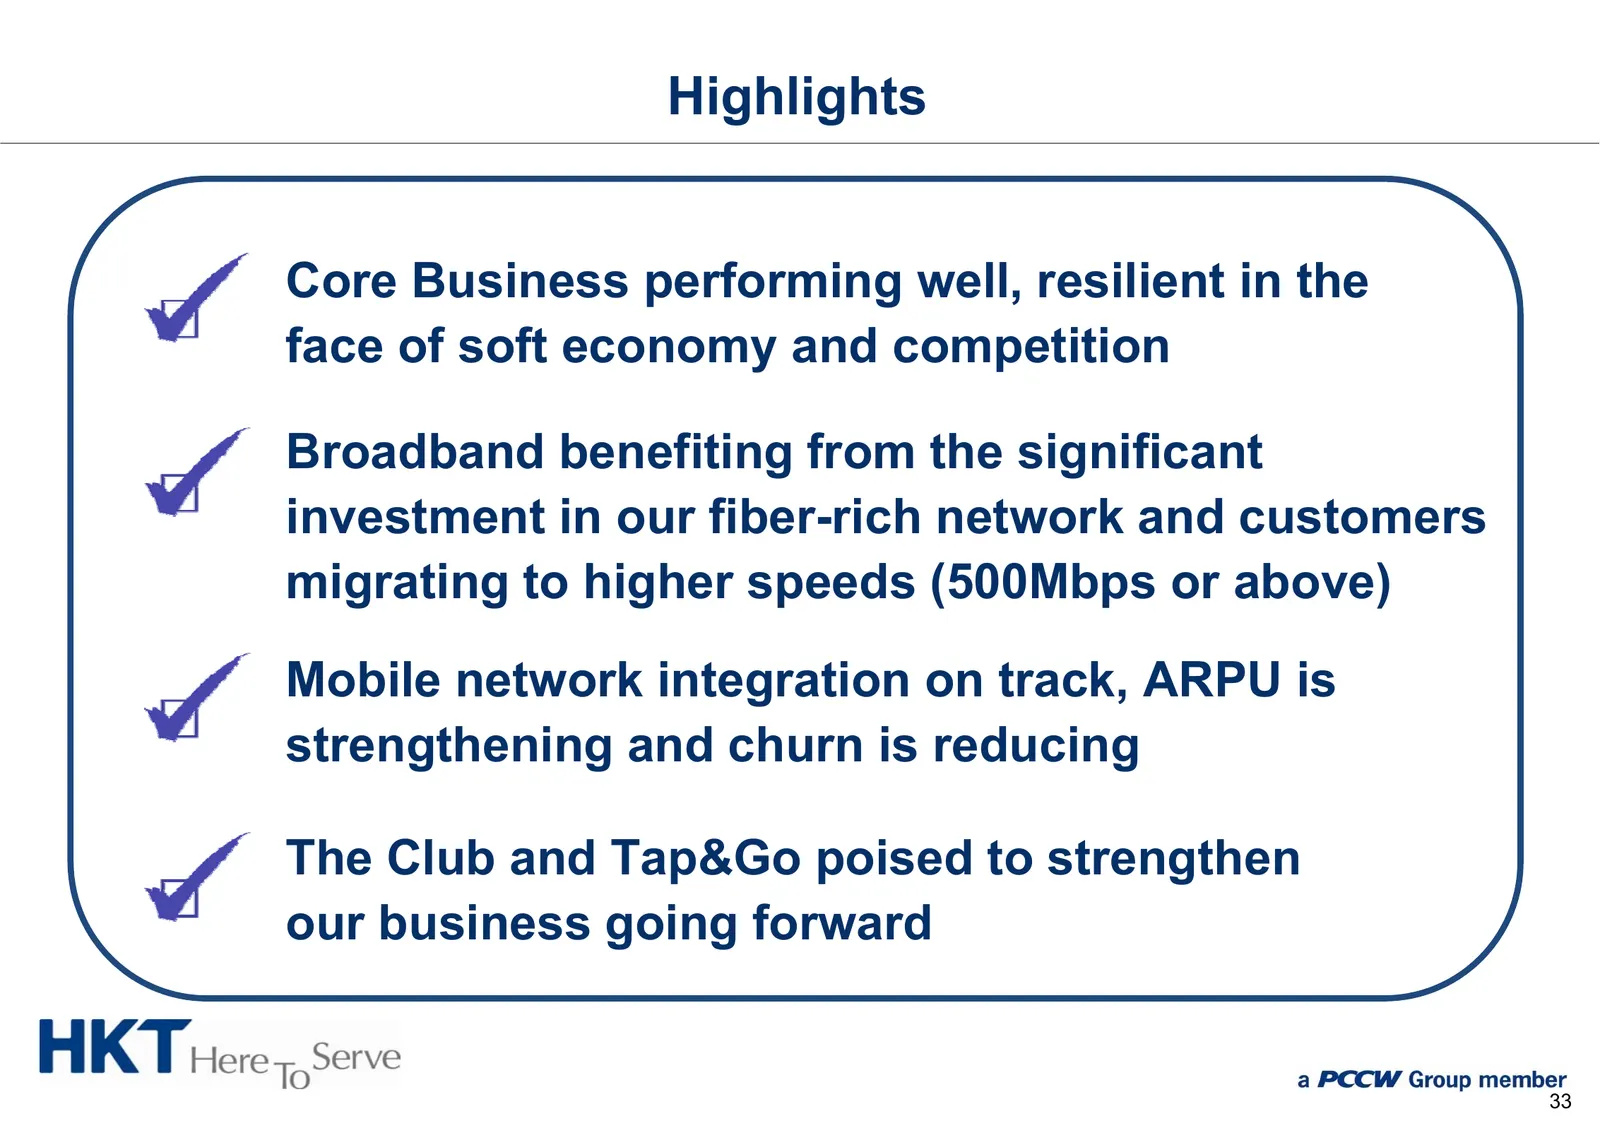
Highlights Core Business performing well, resilient in the face of soft economy and competition Broadband benefiting from the significant investment in our fiber-rich network and customers migrating to higher speeds (500Mbps or above) Mobile network integration on track, ARPU is strengthening and ch
Source: Internet Archive copy of hkt.com
More decks from HKT Trust and HKT Ltd
 HKT — H1 2025 Earnings Presentation35 slides · Jul 31, 2025
 FY2024 Earnings Presentation35 slides · Feb 20, 2025
 H1 2024 Earnings Presentation34 slides · Jul 25, 2024
 FY2023 Earnings Presentation36 slides · Feb 22, 2024
 H1 2023 Earnings Presentation32 slides · Aug 2, 2023
 HKT — FY2022 Earnings Presentation32 slides · Feb 23, 2023