Sembcorp Industries Ltd. · SGX:U96
Sembcorp Industries — FY2014 Earnings Presentation
22 slides from Sembcorp Industries's earnings presentation, Feb 17, 2015
Slide 1: FY2014 Results Announcement
FY2014 Results Announcement February 17, 2015 © Sembcorp Industries 2015 Scope of Presentation • CEO’s Report • Financial Review • Group Outlook © Sembcorp Industries 2015 2
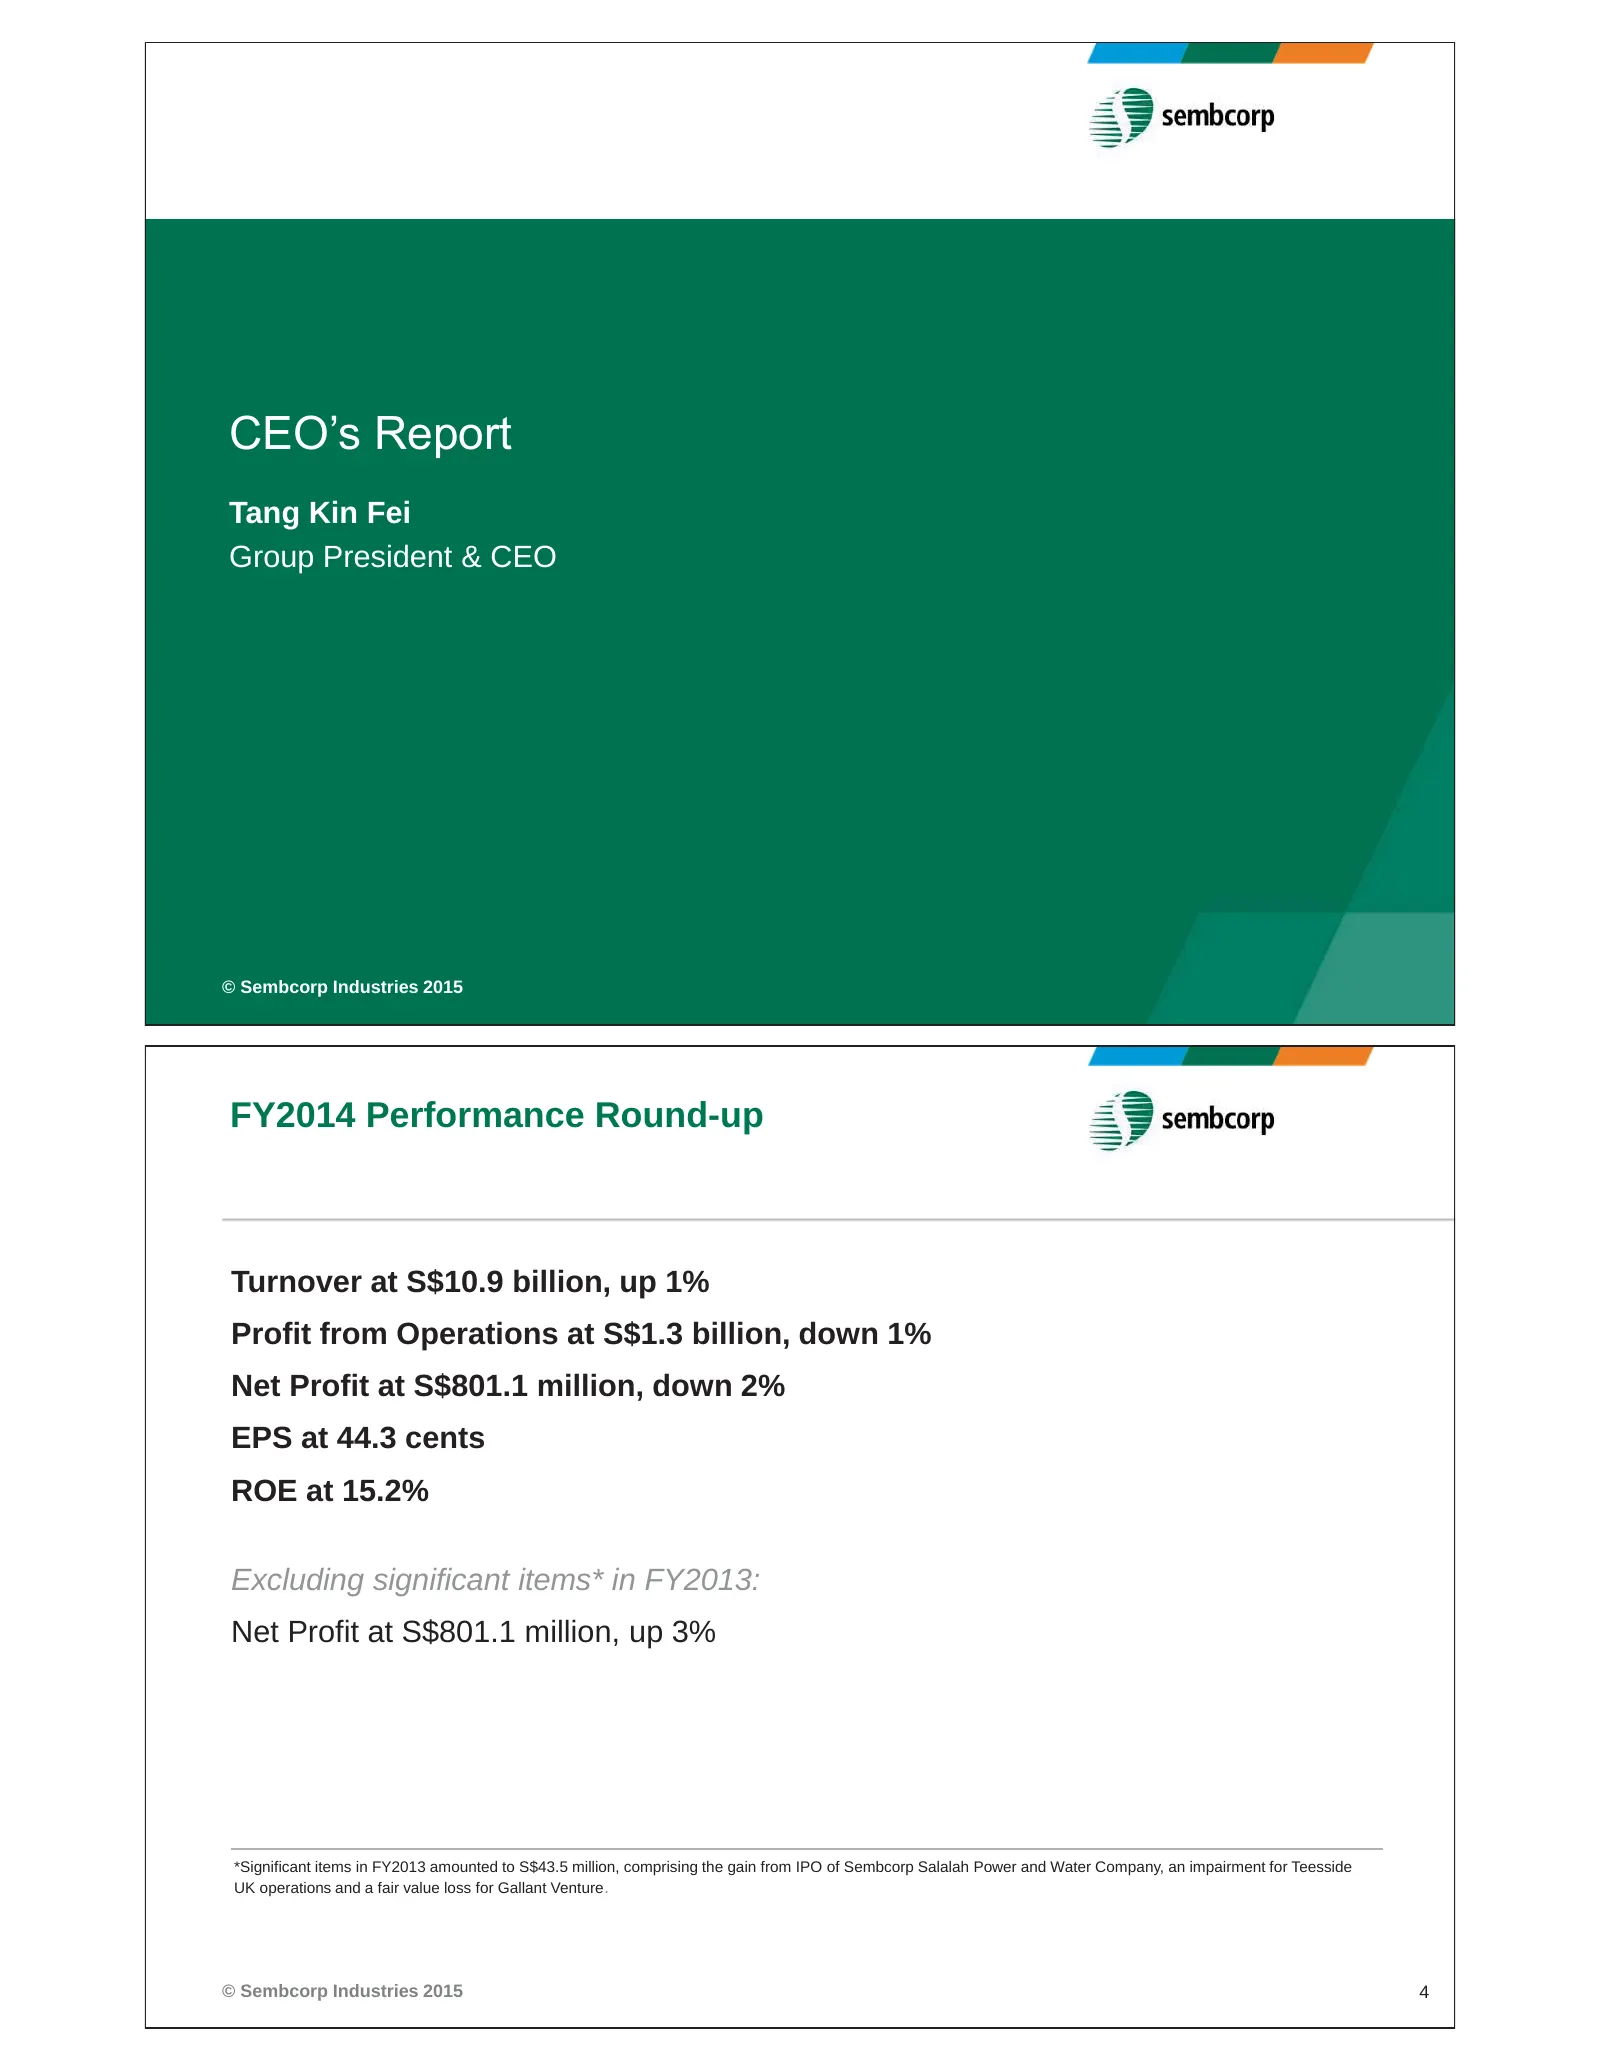
Slide 2: CEO's Report: FY2014 Performance Round-up
CEO’s Report Tang Kin Fei Group President & CEO © Sembcorp Industries 2015 FY2014 Performance Round-up Turnover at S$10.9 billion, up 1% Profit from Operations at S$1.3 billion, down 1% Net Profit at S$801.1 million, down 2% EPS at 44.3 cents ROE at 15.2% Excluding significant items* in FY2013: Net
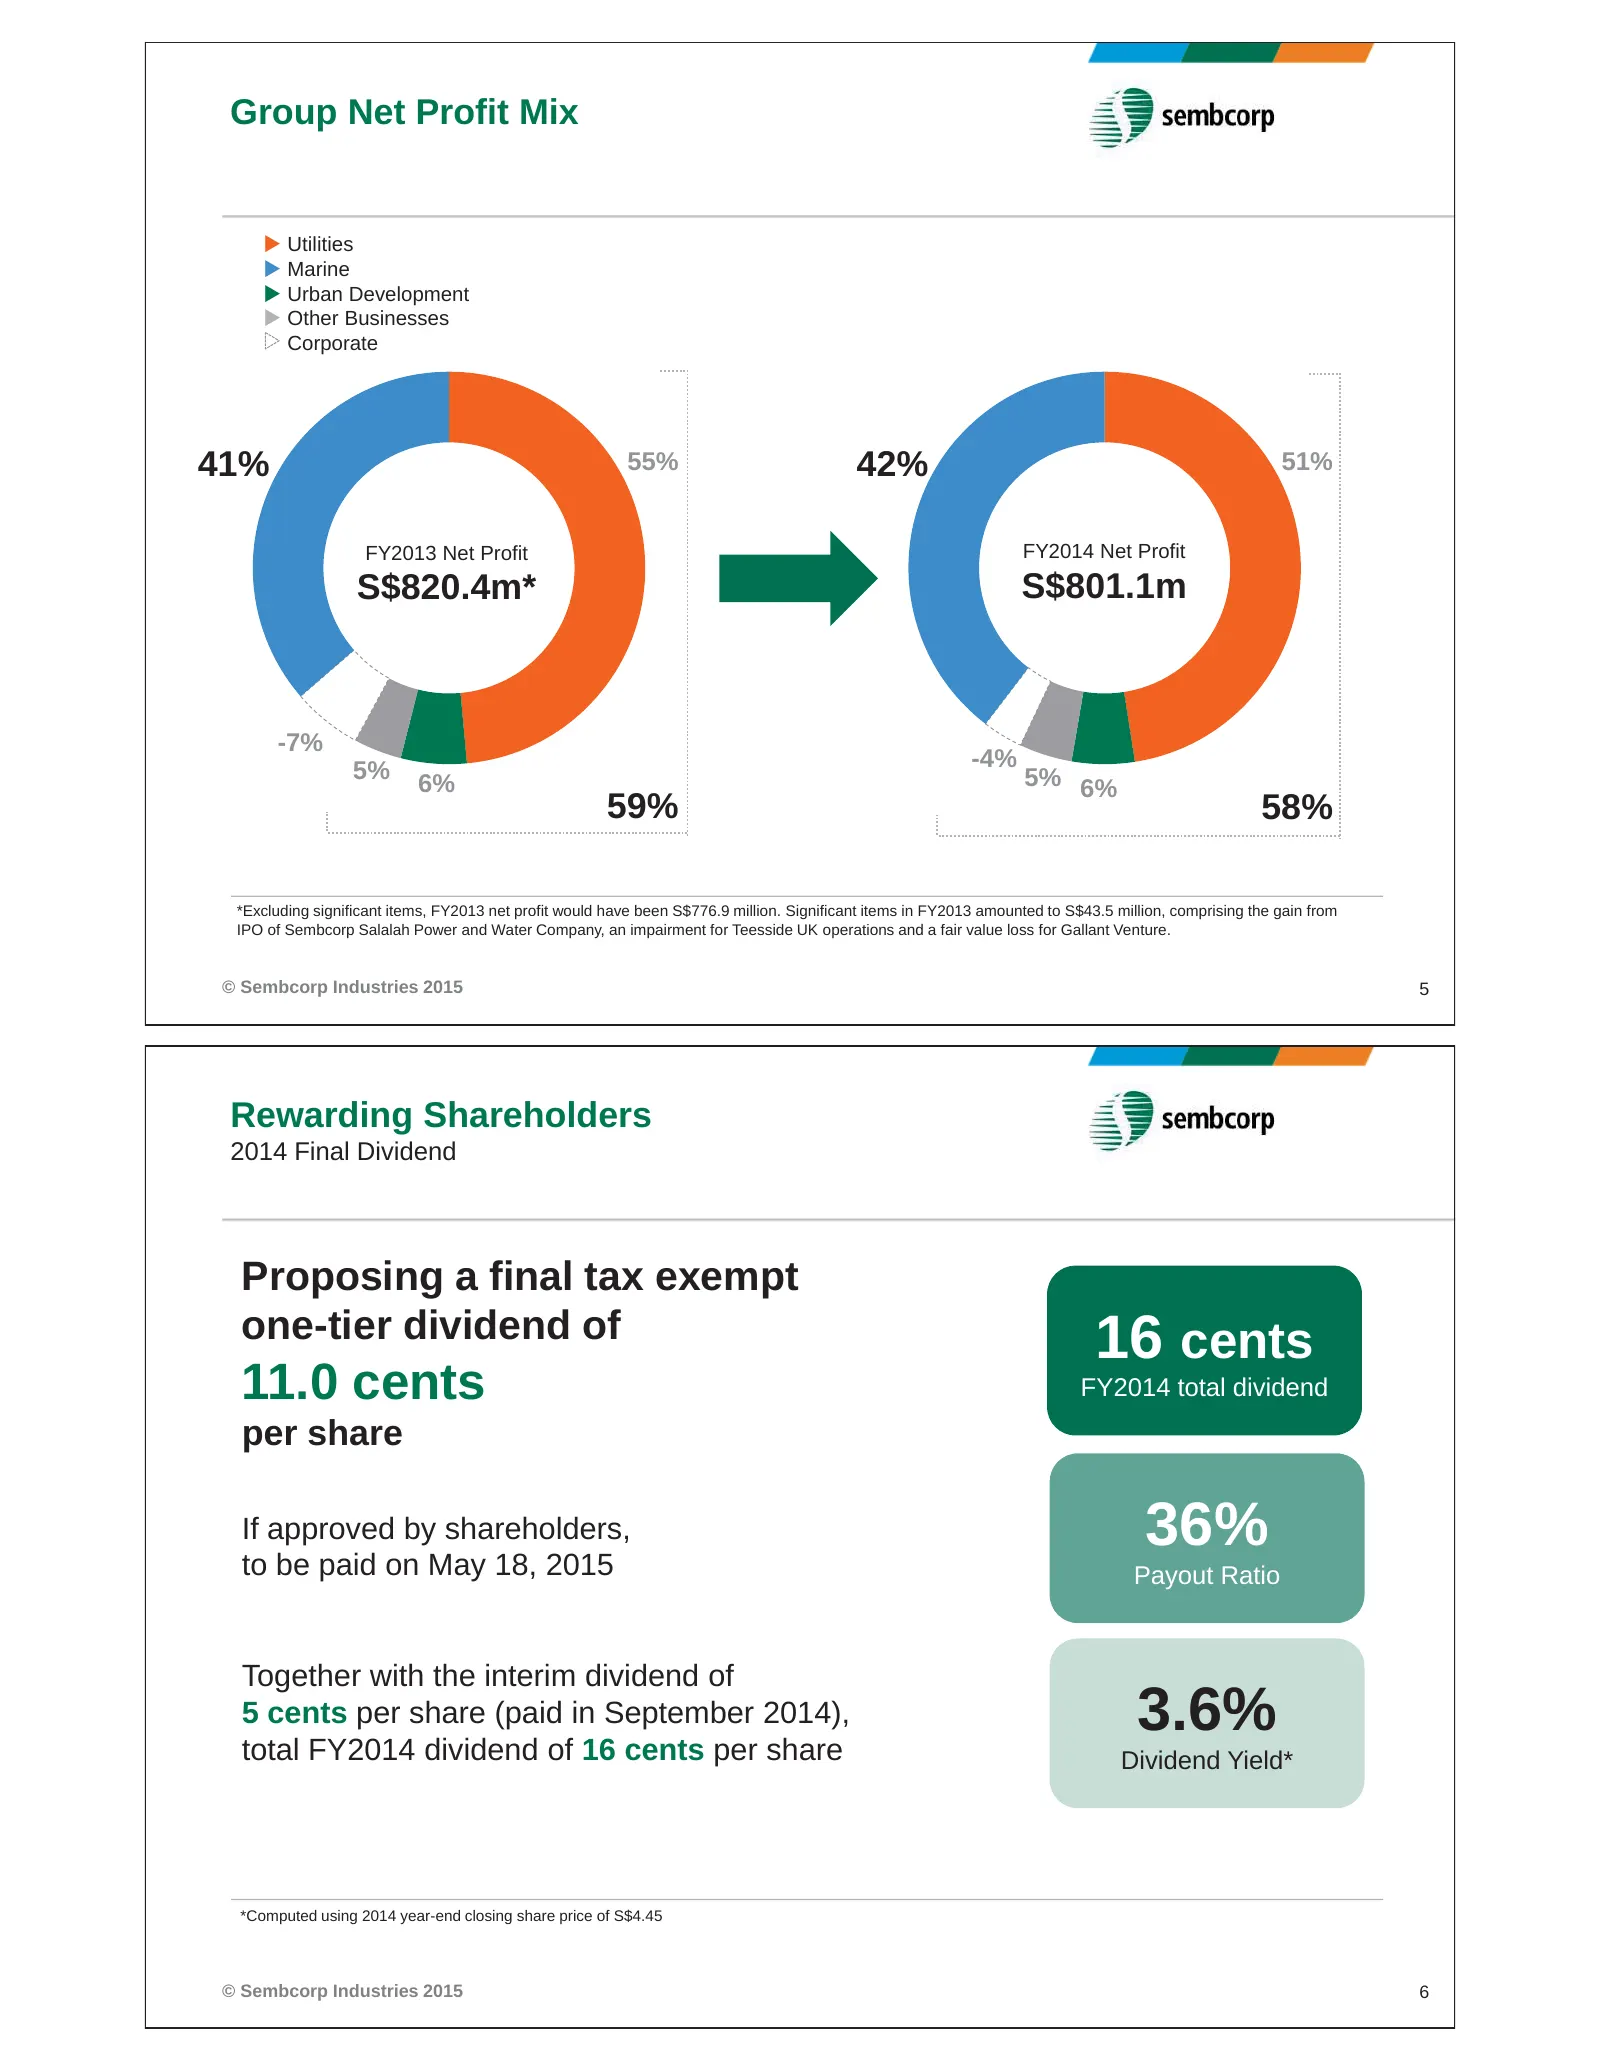
Slide 3: Group Net Profit Mix; Rewarding Shareholders
Group Net Profit Mix X Utilities X Marine X Urban Development X Other Businesses X Corporate 41% 55% 42% 51% FY2013 Net Profit FY2014 Net Profit S$820.4m* S$801.1m -7% 5% -4% 6% 5% 6% 59% 58% *Excluding significant items, FY2013 net profit would have been S$776.9 million. Significant items in FY2013
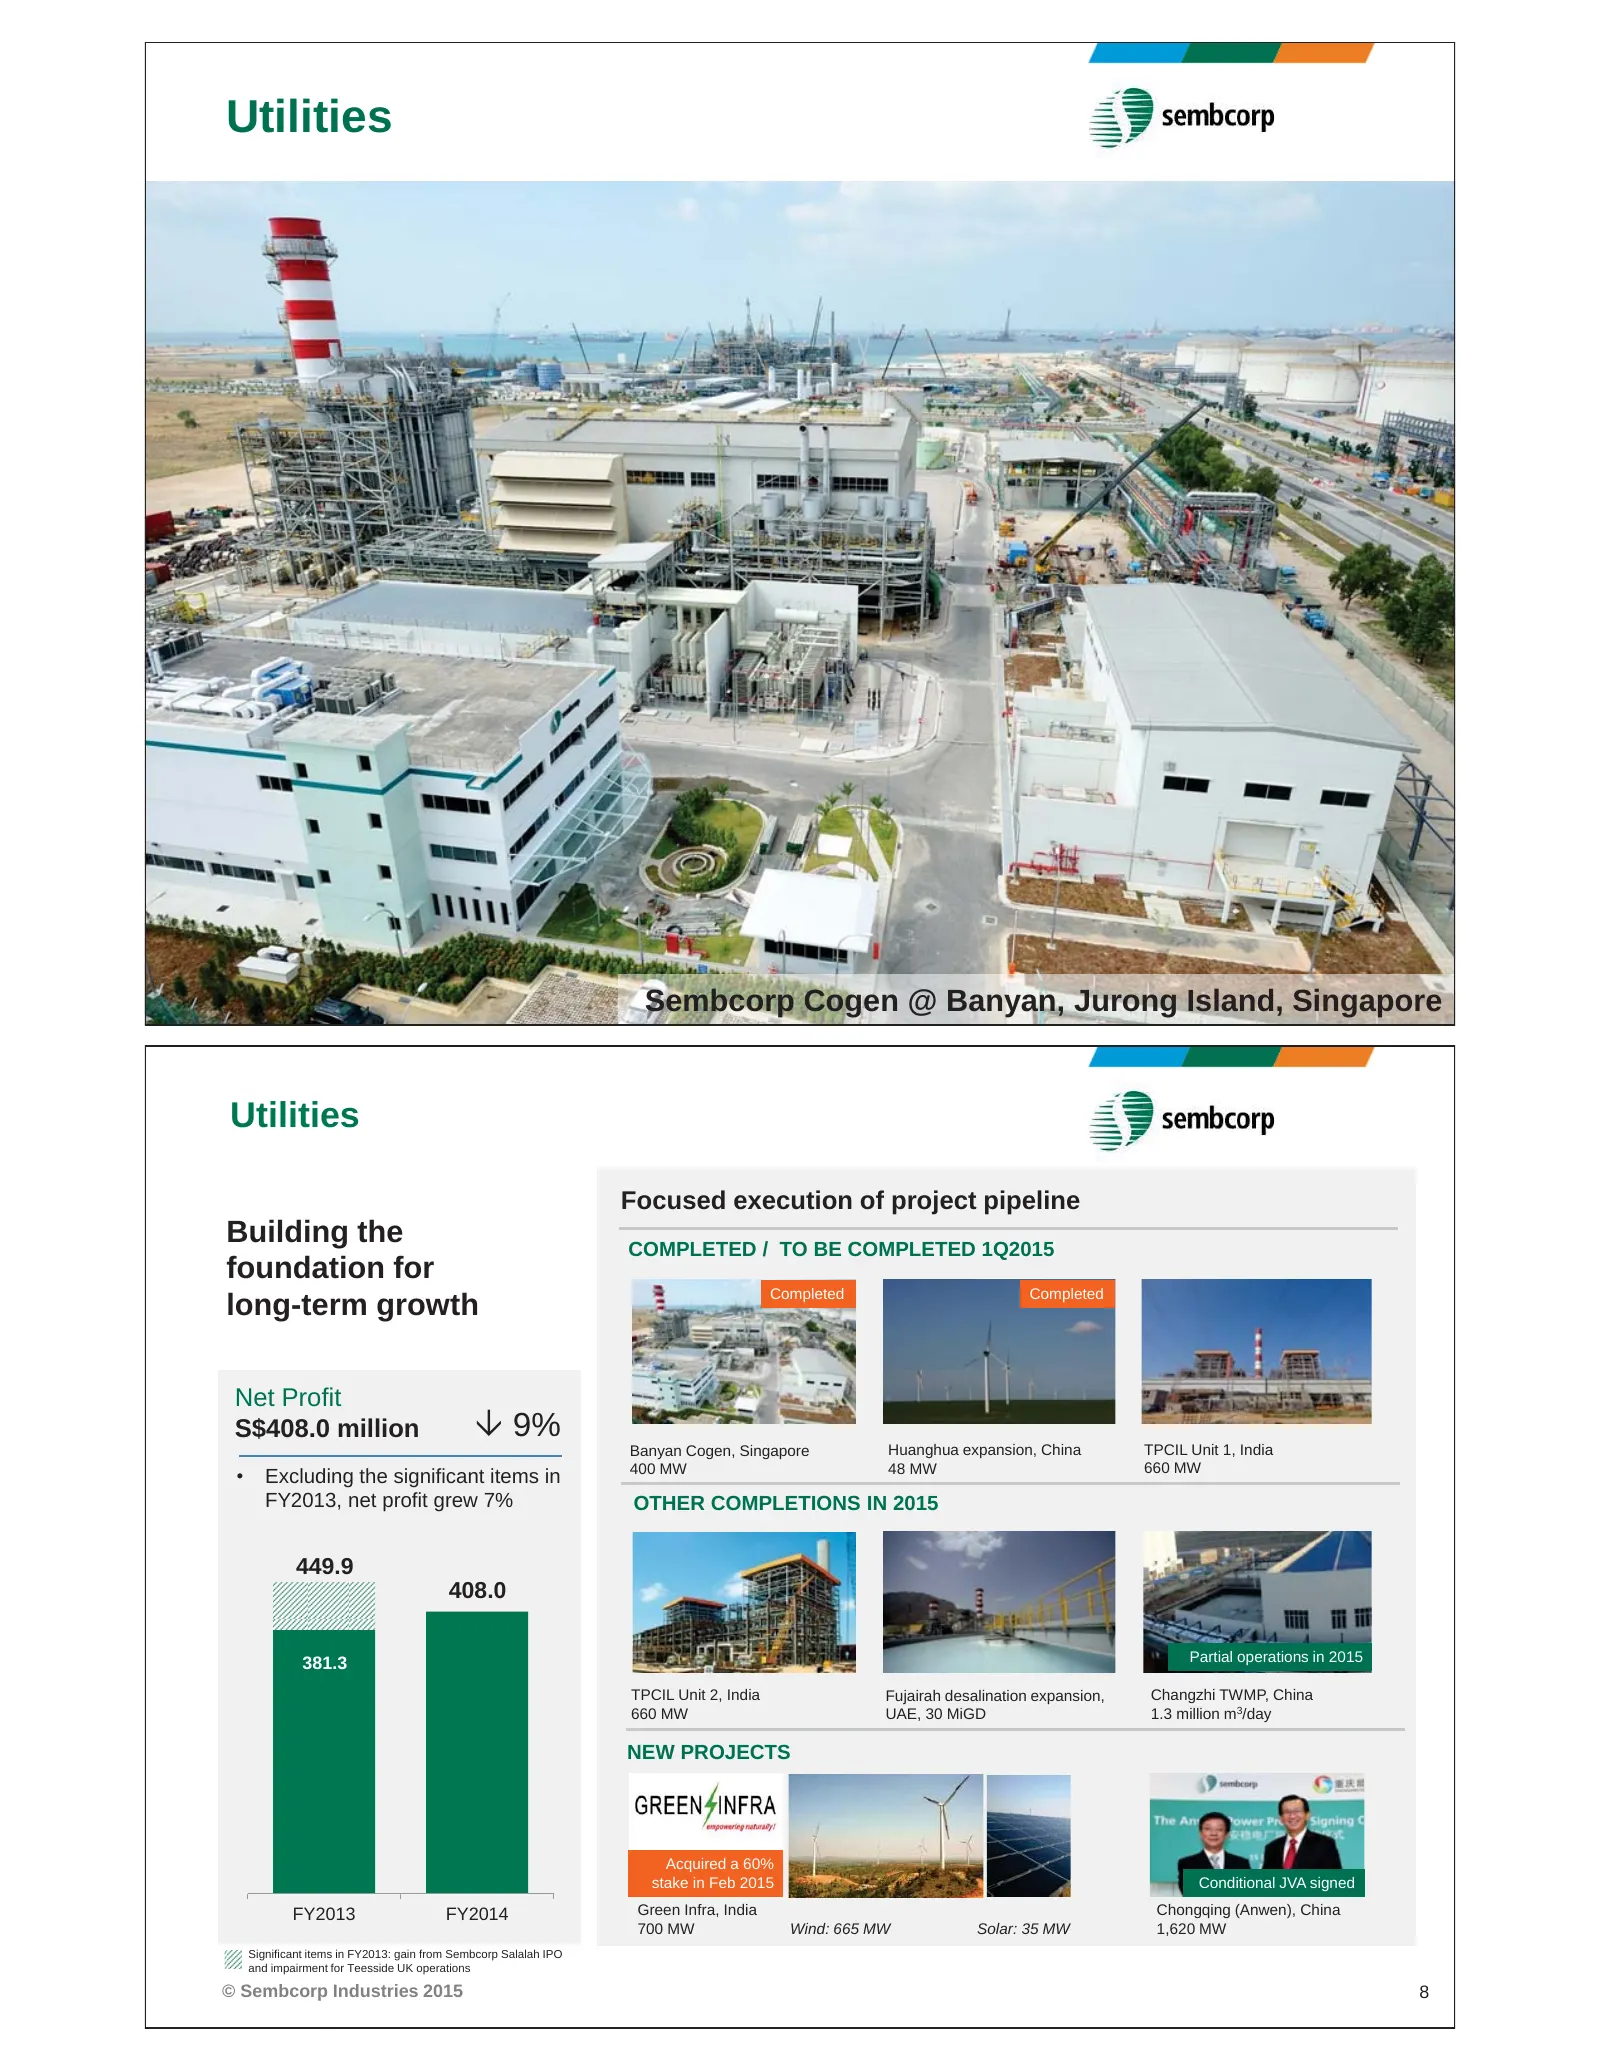
Slide 4: Utilities
Utilities © Sembcorp Industries 2015 7 Sembcorp Cogen @ Banyan, Jurong Island, Singapore Utilities Focused execution of project pipeline Building the COMPLETED / TO BE COMPLETED 1Q2015 foundation for Completed Completed long-term growth Net Profit S$408.0 million ¶ 9% Banyan Cogen, Singapore Huanghu
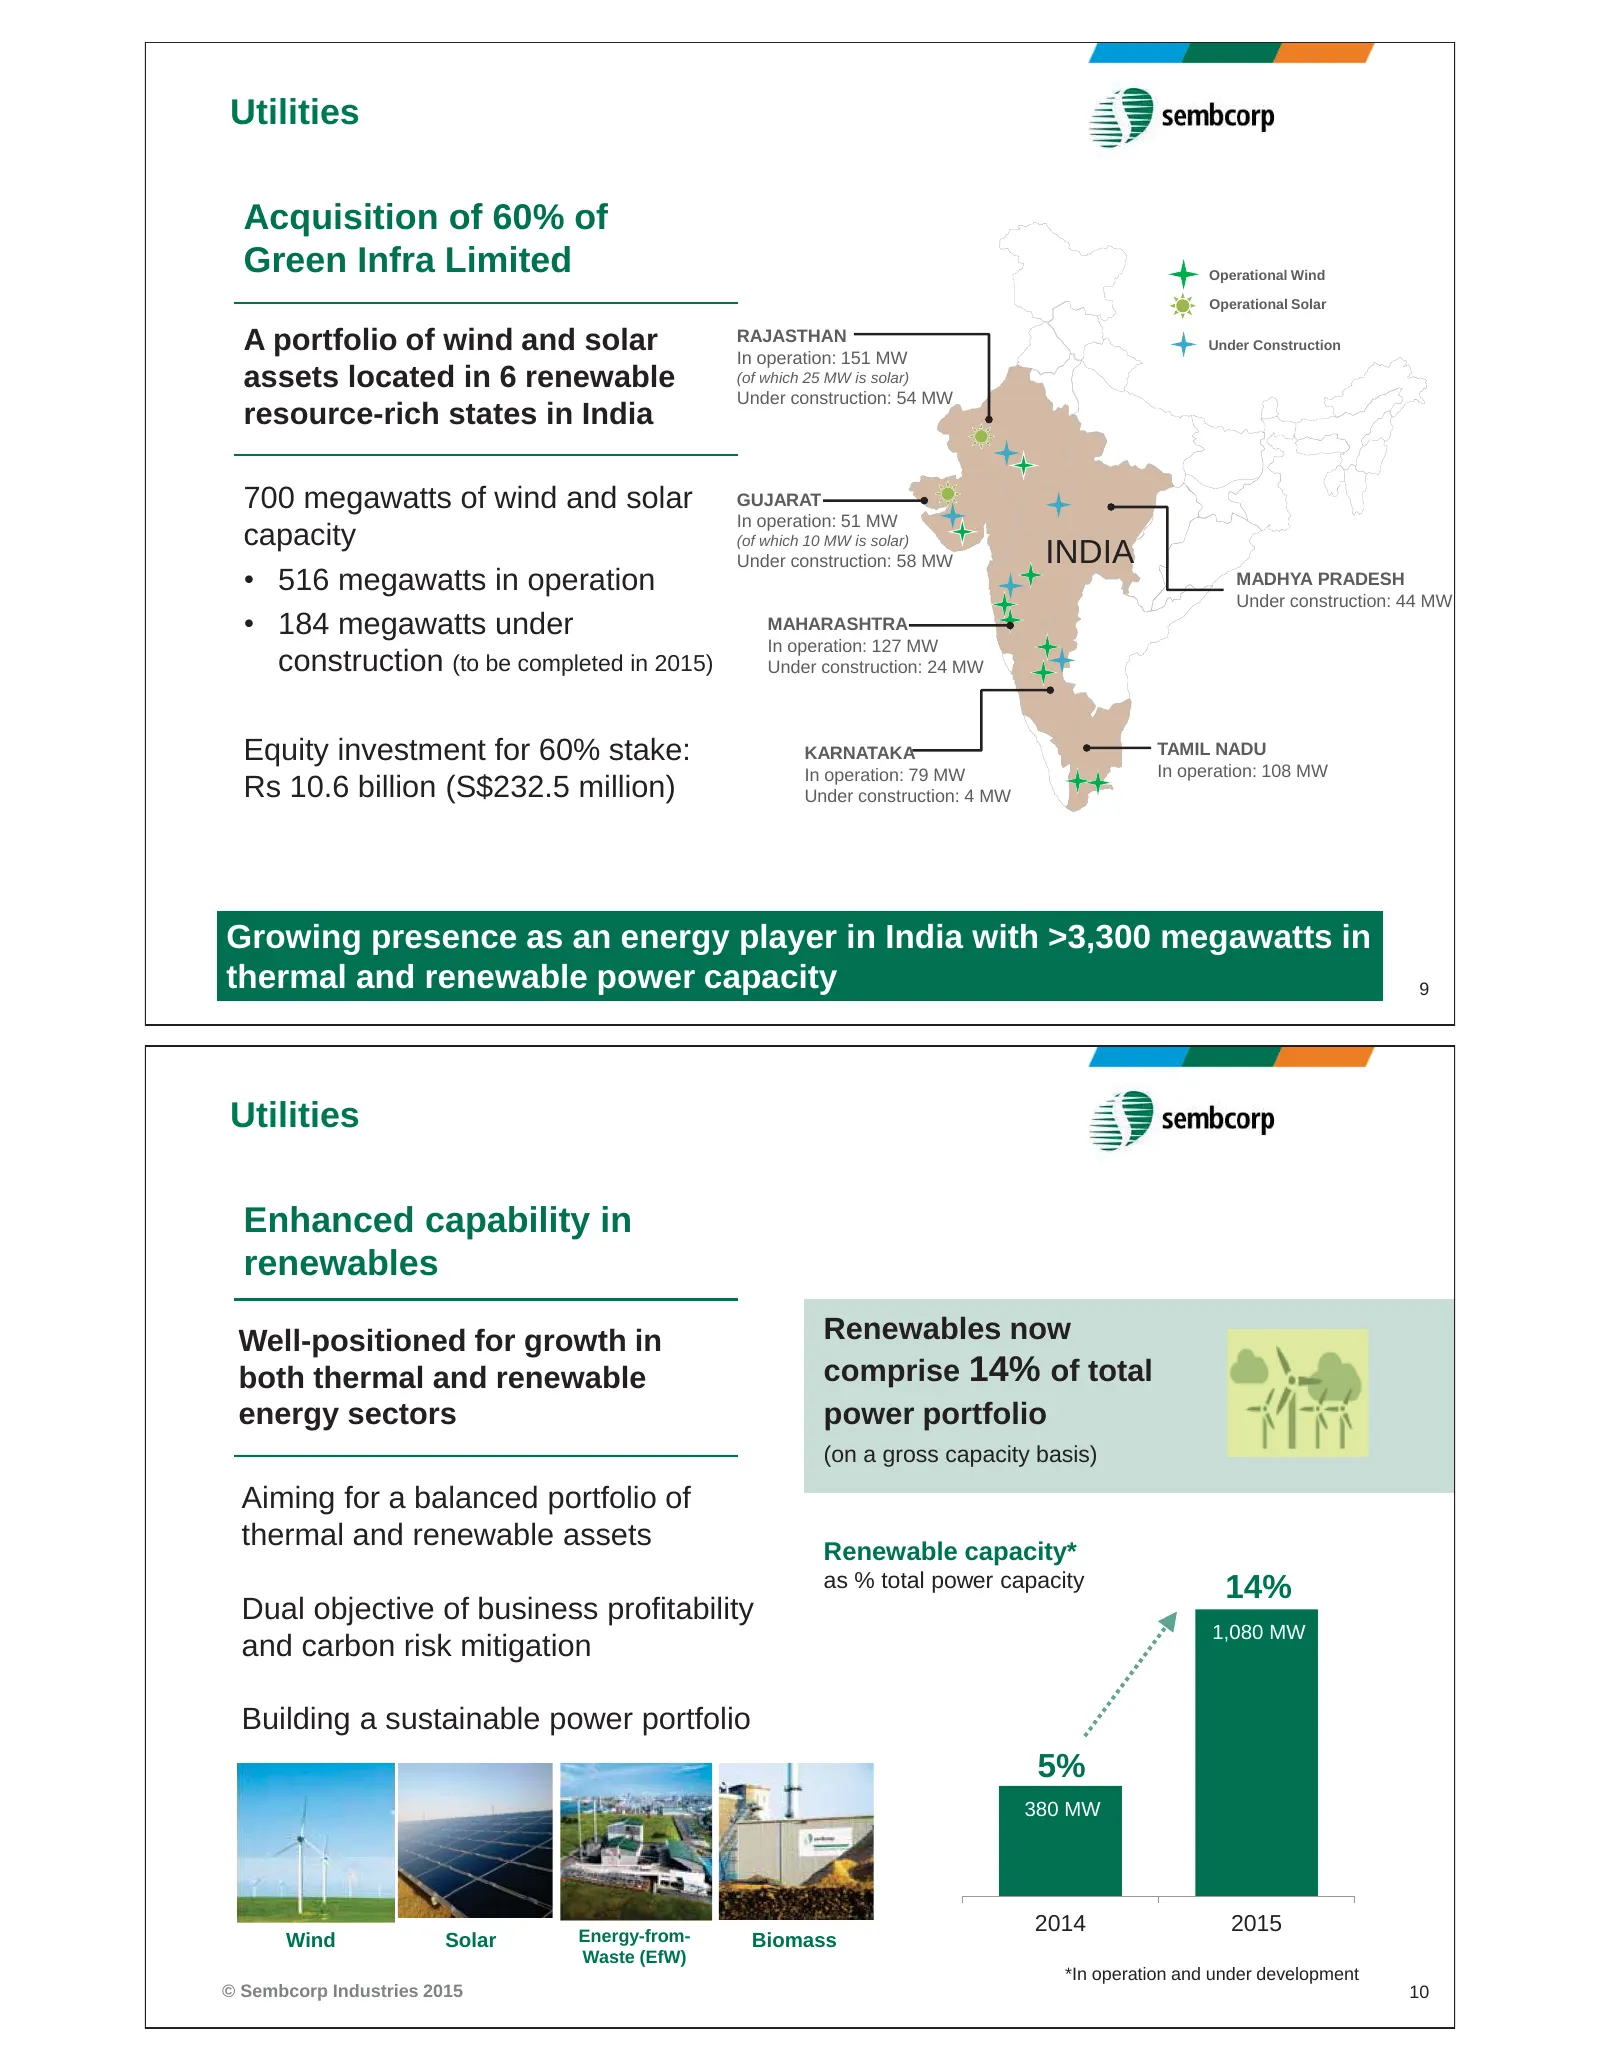
Slide 5: Acquisition of 60% of Green Infra Limited
Utilities Acquisition of 60% of Green Infra Limited Operational Wind Operational Solar A portfolio of wind and solar RAJASTHAN In operation: 151 MW Under Construction assets located in 6 renewable (of which 25 MW is solar) Under construction: 54 MW resource-rich states in India 700 megawatts of wind
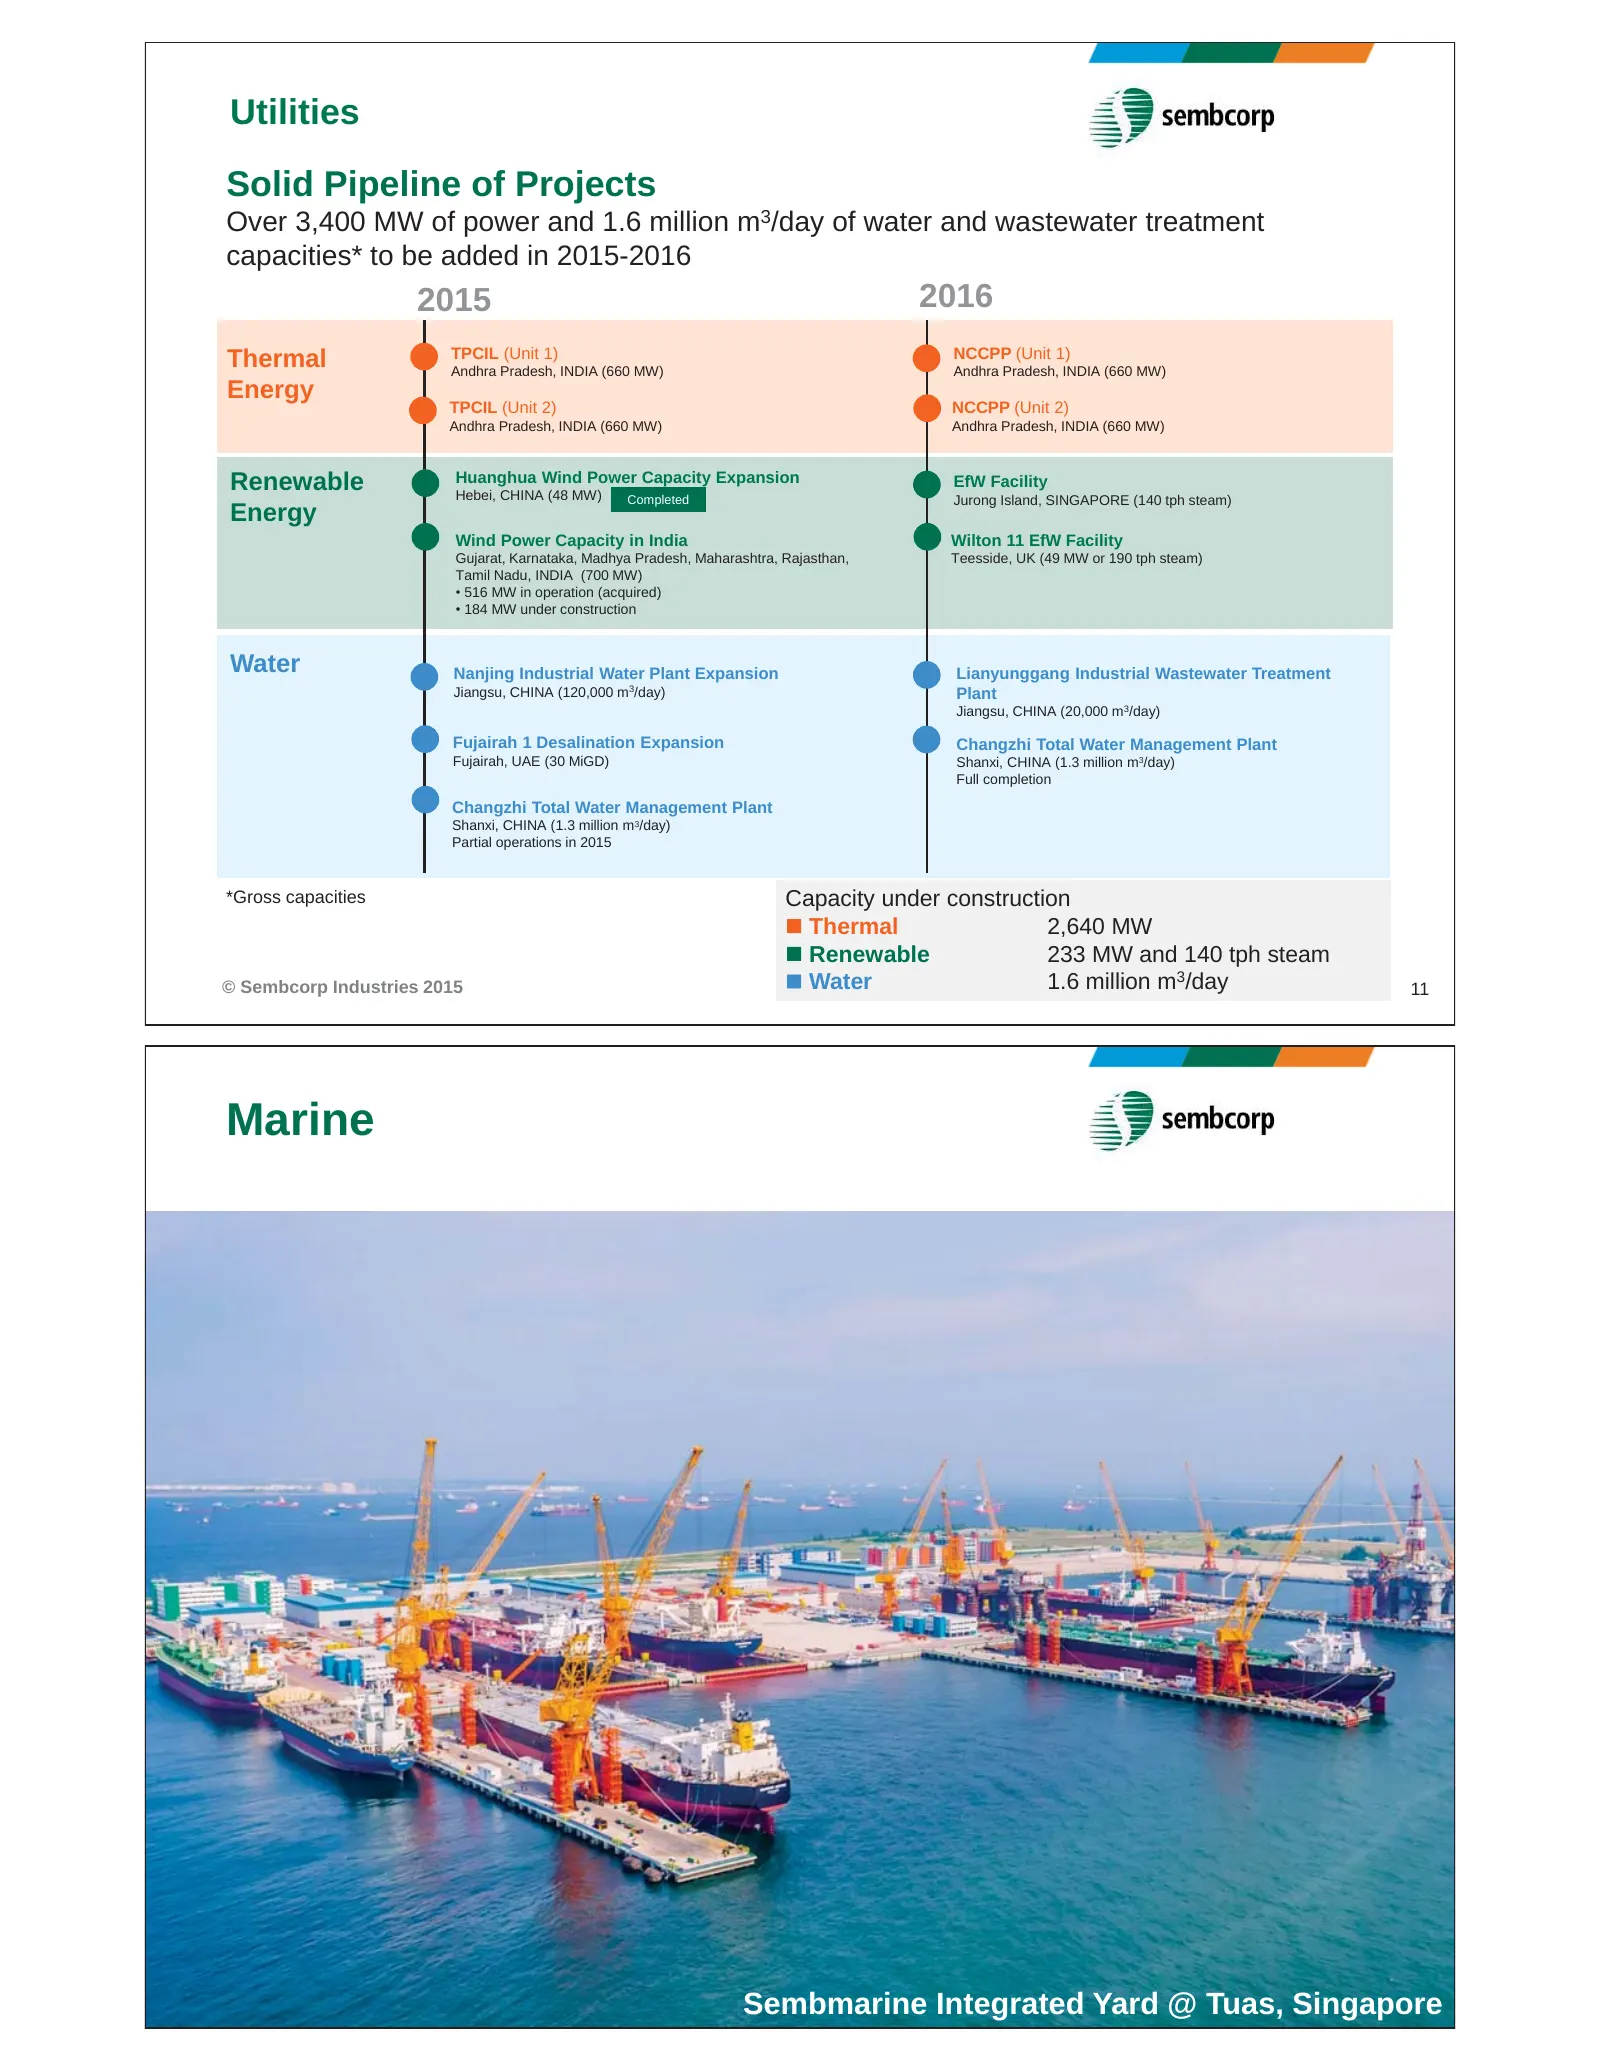
Slide 6: Solid Pipeline of Projects
Utilities Solid Pipeline of Projects Over 3,400 MW of power and 1.6 million m3/day of water and wastewater treatment capacities* to be added in 2015-2016 2015 2016 TPCIL (Unit 1) NCCPP (Unit 1) Thermal Andhra Pradesh, INDIA (660 MW) Andhra Pradesh, INDIA (660 MW) Energy TPCIL (Unit 2) NCCPP (Unit 2)
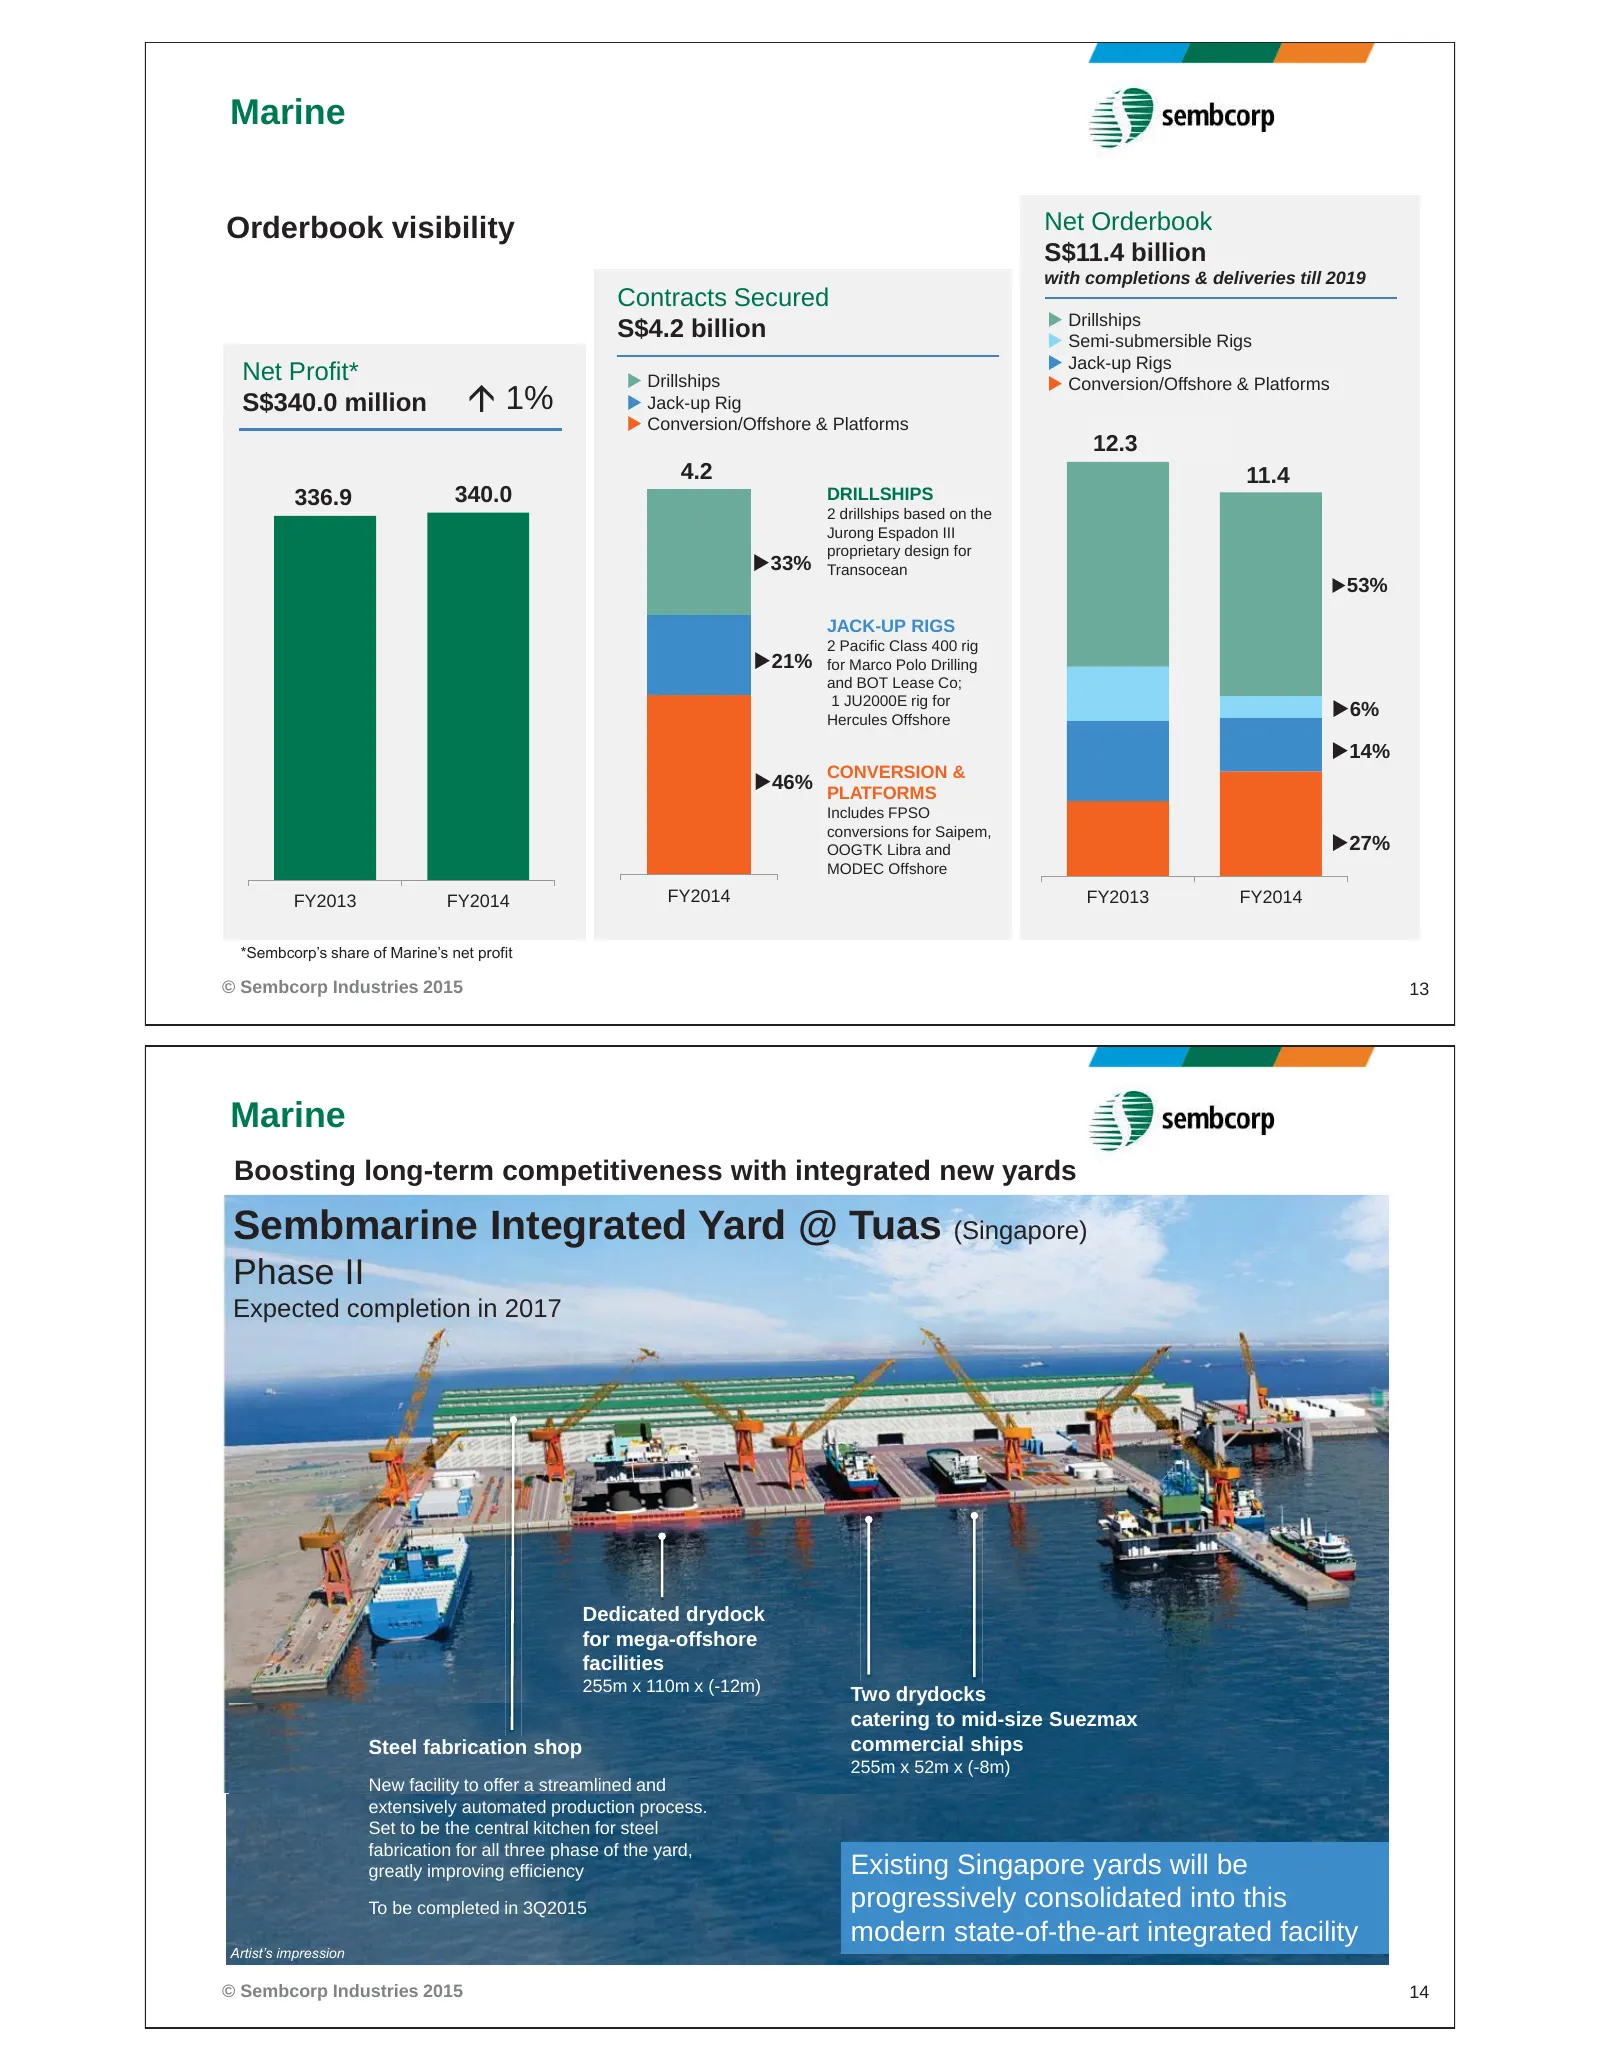
Slide 7: Marine
Marine Orderbook visibility Net Orderbook S$11.4 billion with completions & deliveries till 2019 Contracts Secured X Drillships S$4.2 billion X Semi-submersible Rigs X Jack-up Rigs Net Profit* X Drillships X Conversion/Offshore & Platforms S$340.0 million Ç 1% X Jack-up Rig X Conversion/Offshore & P
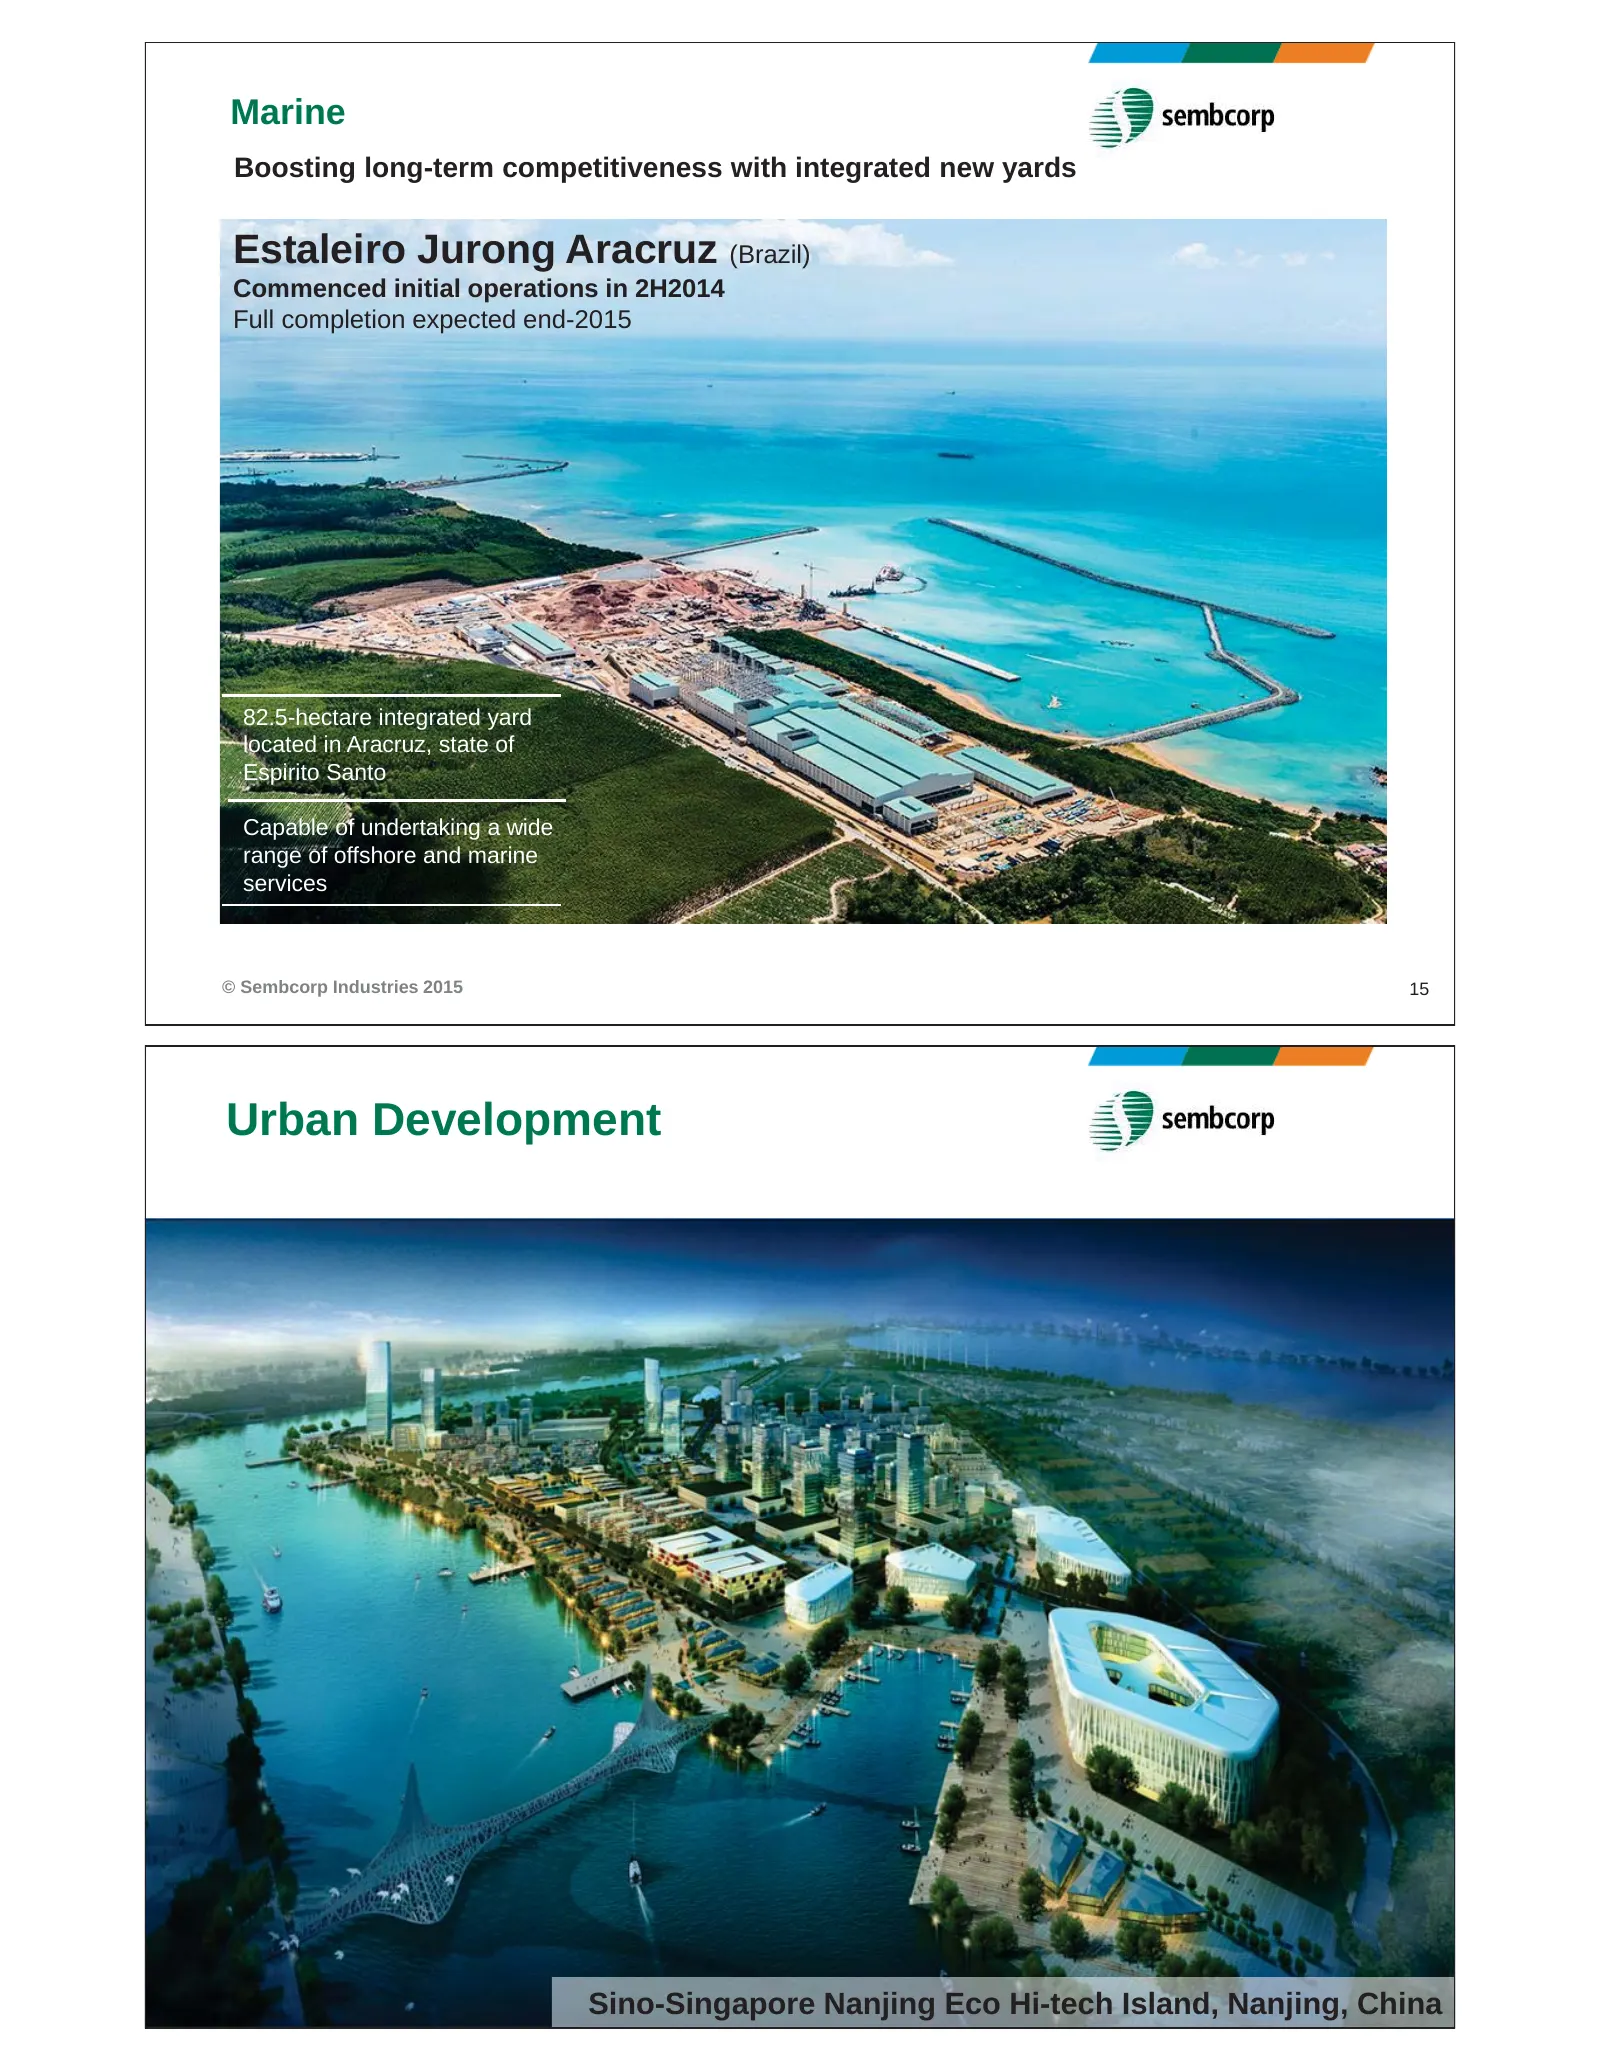
Slide 8: Boosting long-term competitiveness with integrated new yards
Marine Boosting long-term competitiveness with integrated new yards Estaleiro Jurong Aracruz (Brazil) Commenced initial operations in 2H2014 Full completion expected end-2015 82.5-hectare integrated yard located in Aracruz, state of Espirito Santo Capable of undertaking a wide range of offshore and
Slide 9: Urban Development: Land Sales
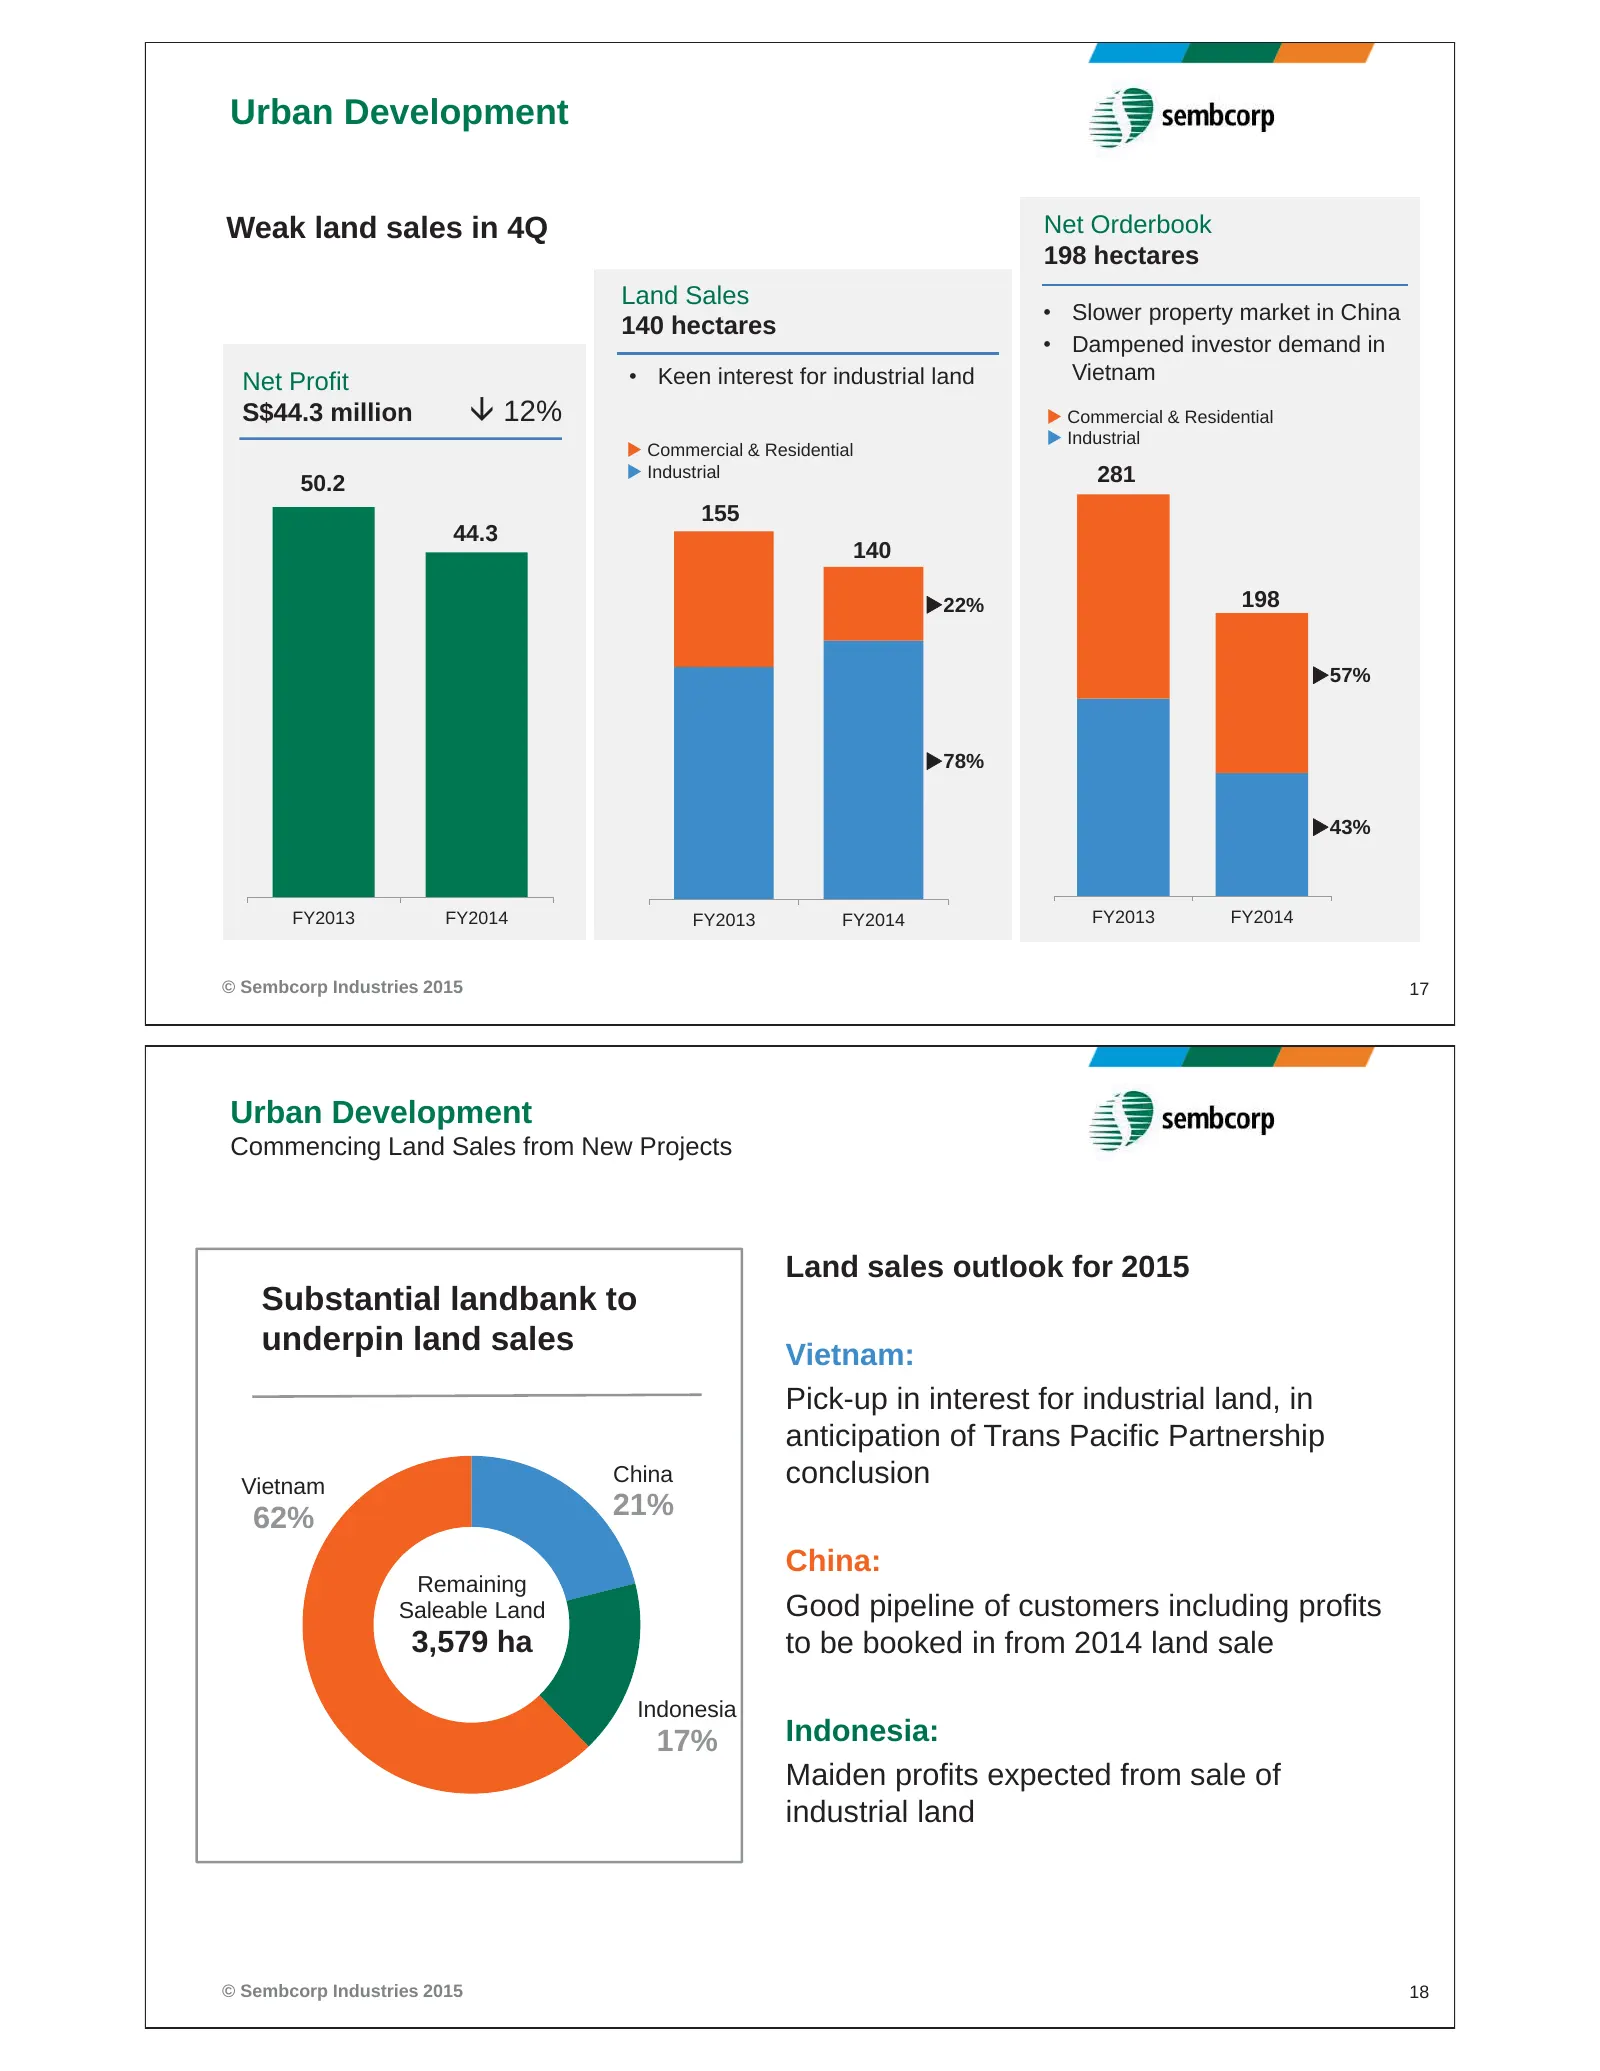
Urban Development Weak land sales in 4Q Net Orderbook 198 hectares Land Sales • Slower property market in China 140 hectares • Dampened investor demand in Net Profit • Keen interest for industrial land Vietnam S$44.3 million È 12% X Commercial & Residential X Industrial X Commercial & Residential X
Slide 10: Financial Review: Group Profit & Loss
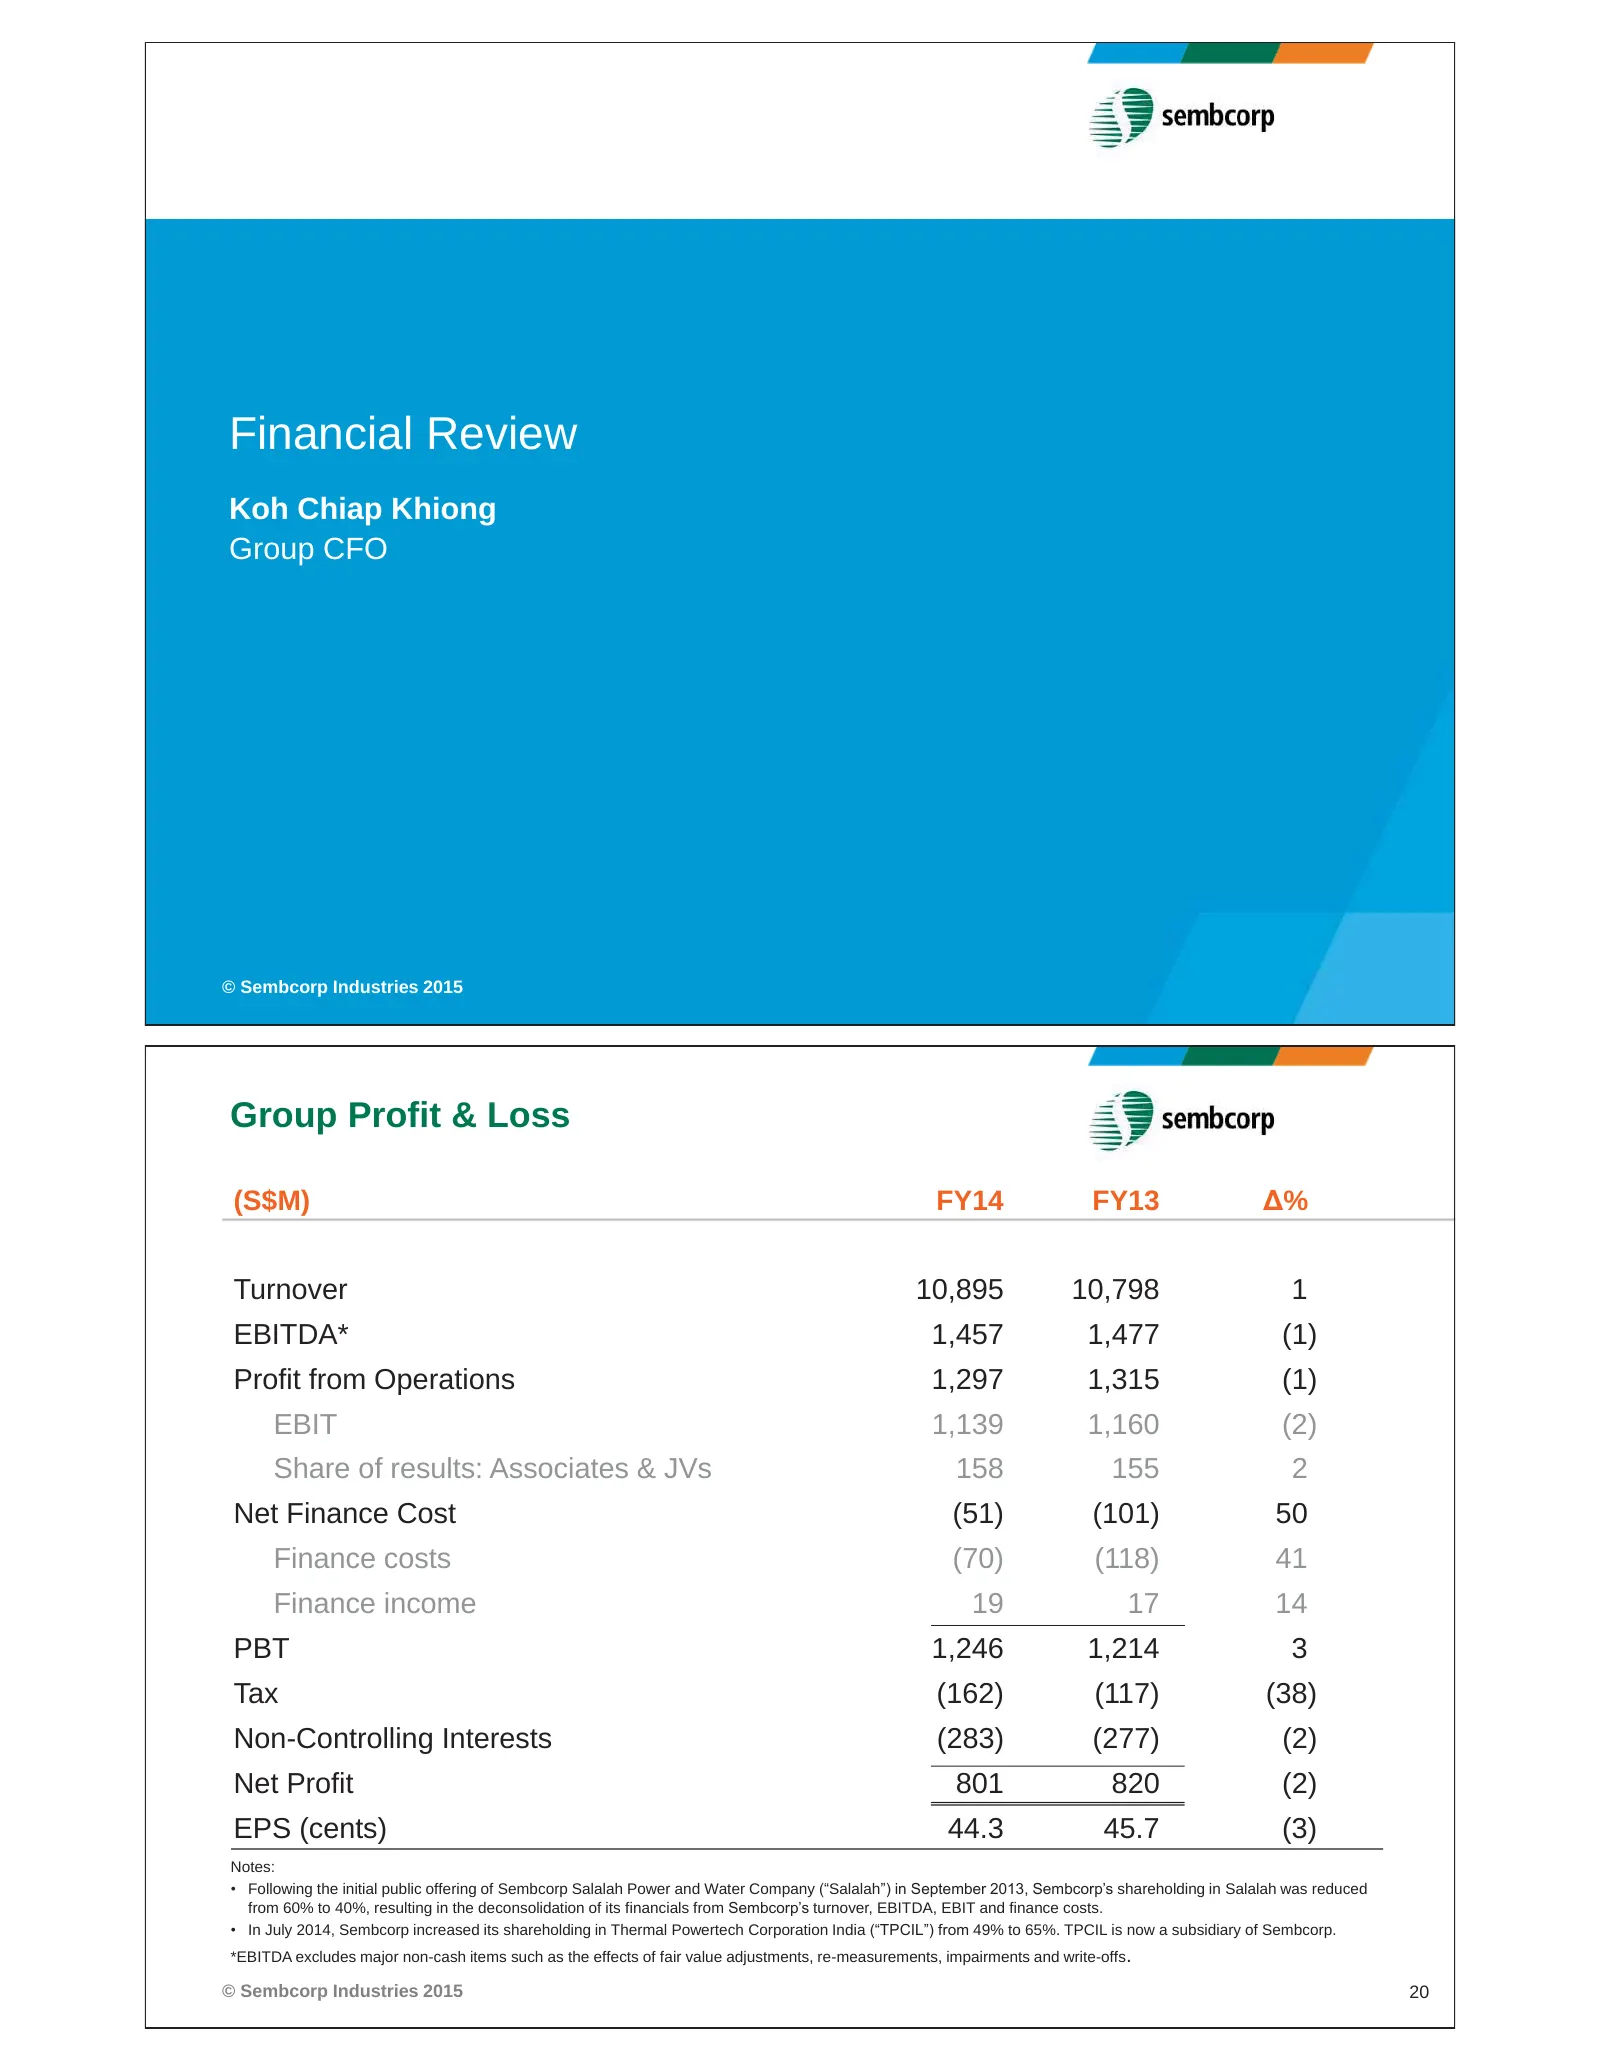
Financial Review Koh Chiap Khiong Group CFO © Sembcorp Industries 2015 Group Profit & Loss (S$M) FY14 FY13 Δ% Turnover 10,895 10,798 1 EBITDA* 1,457 1,477 (1) Profit from Operations 1,297 1,315 (1) EBIT 1,139 1,160 (2) Share of results: Associates & JVs 158 155 2 Net Finance Cost (51) (101) 50 Finan
Slide 11: Group Turnover; Group Profit from Operations
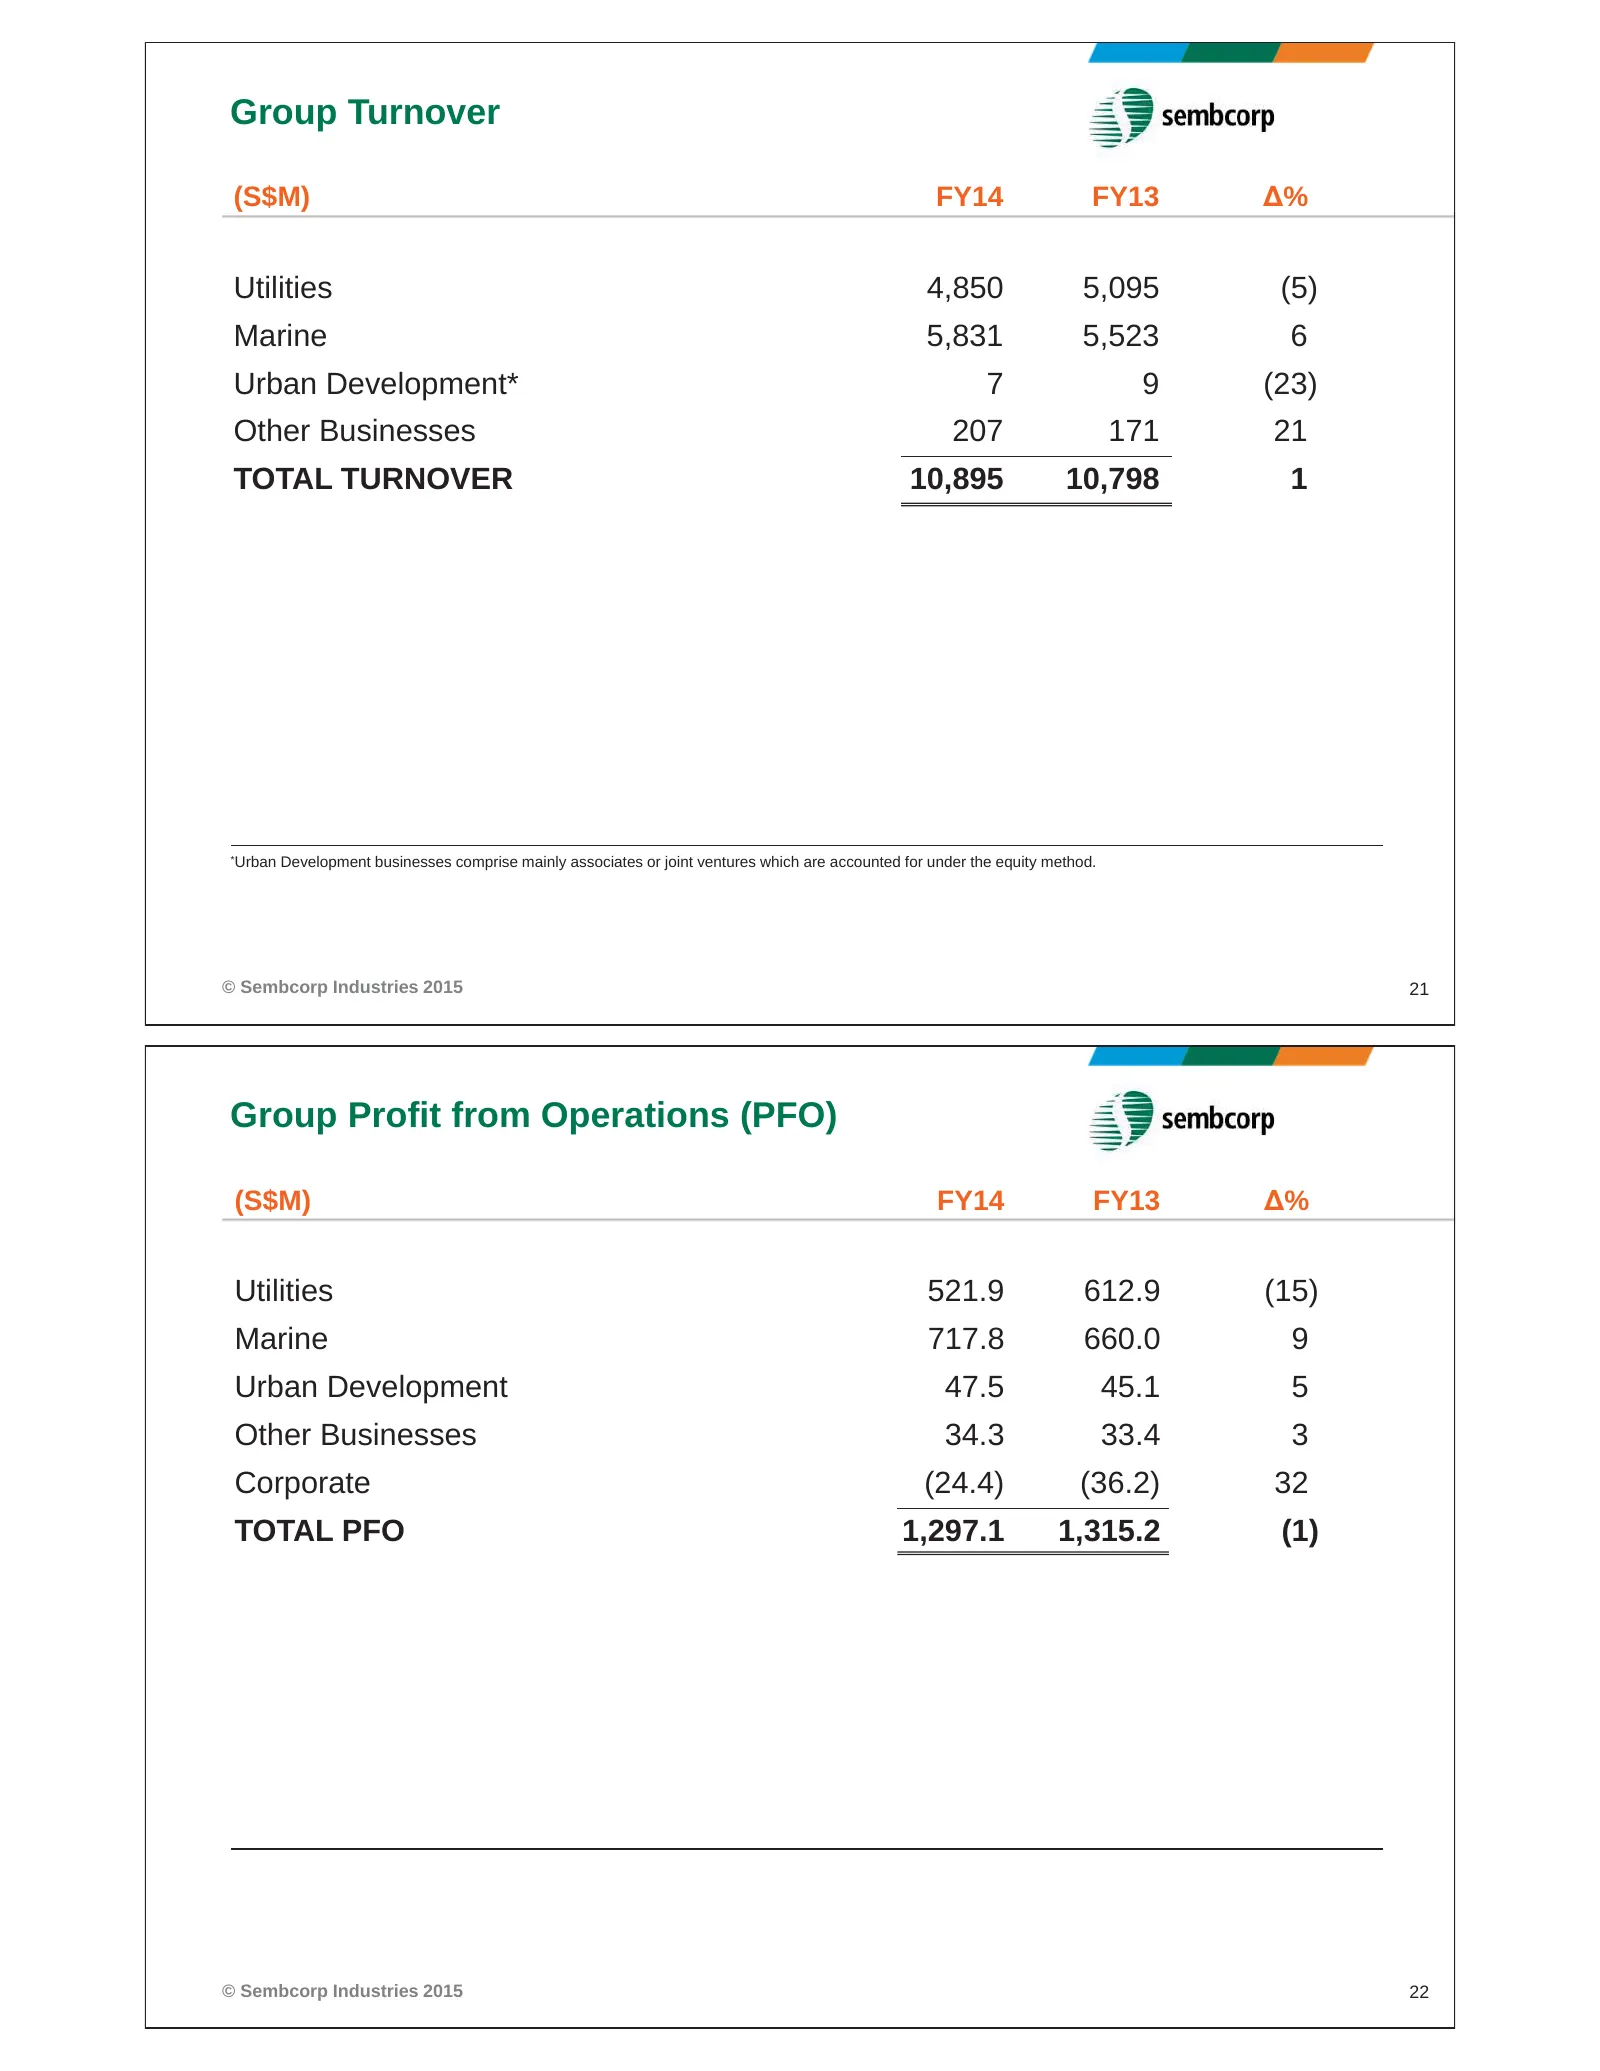
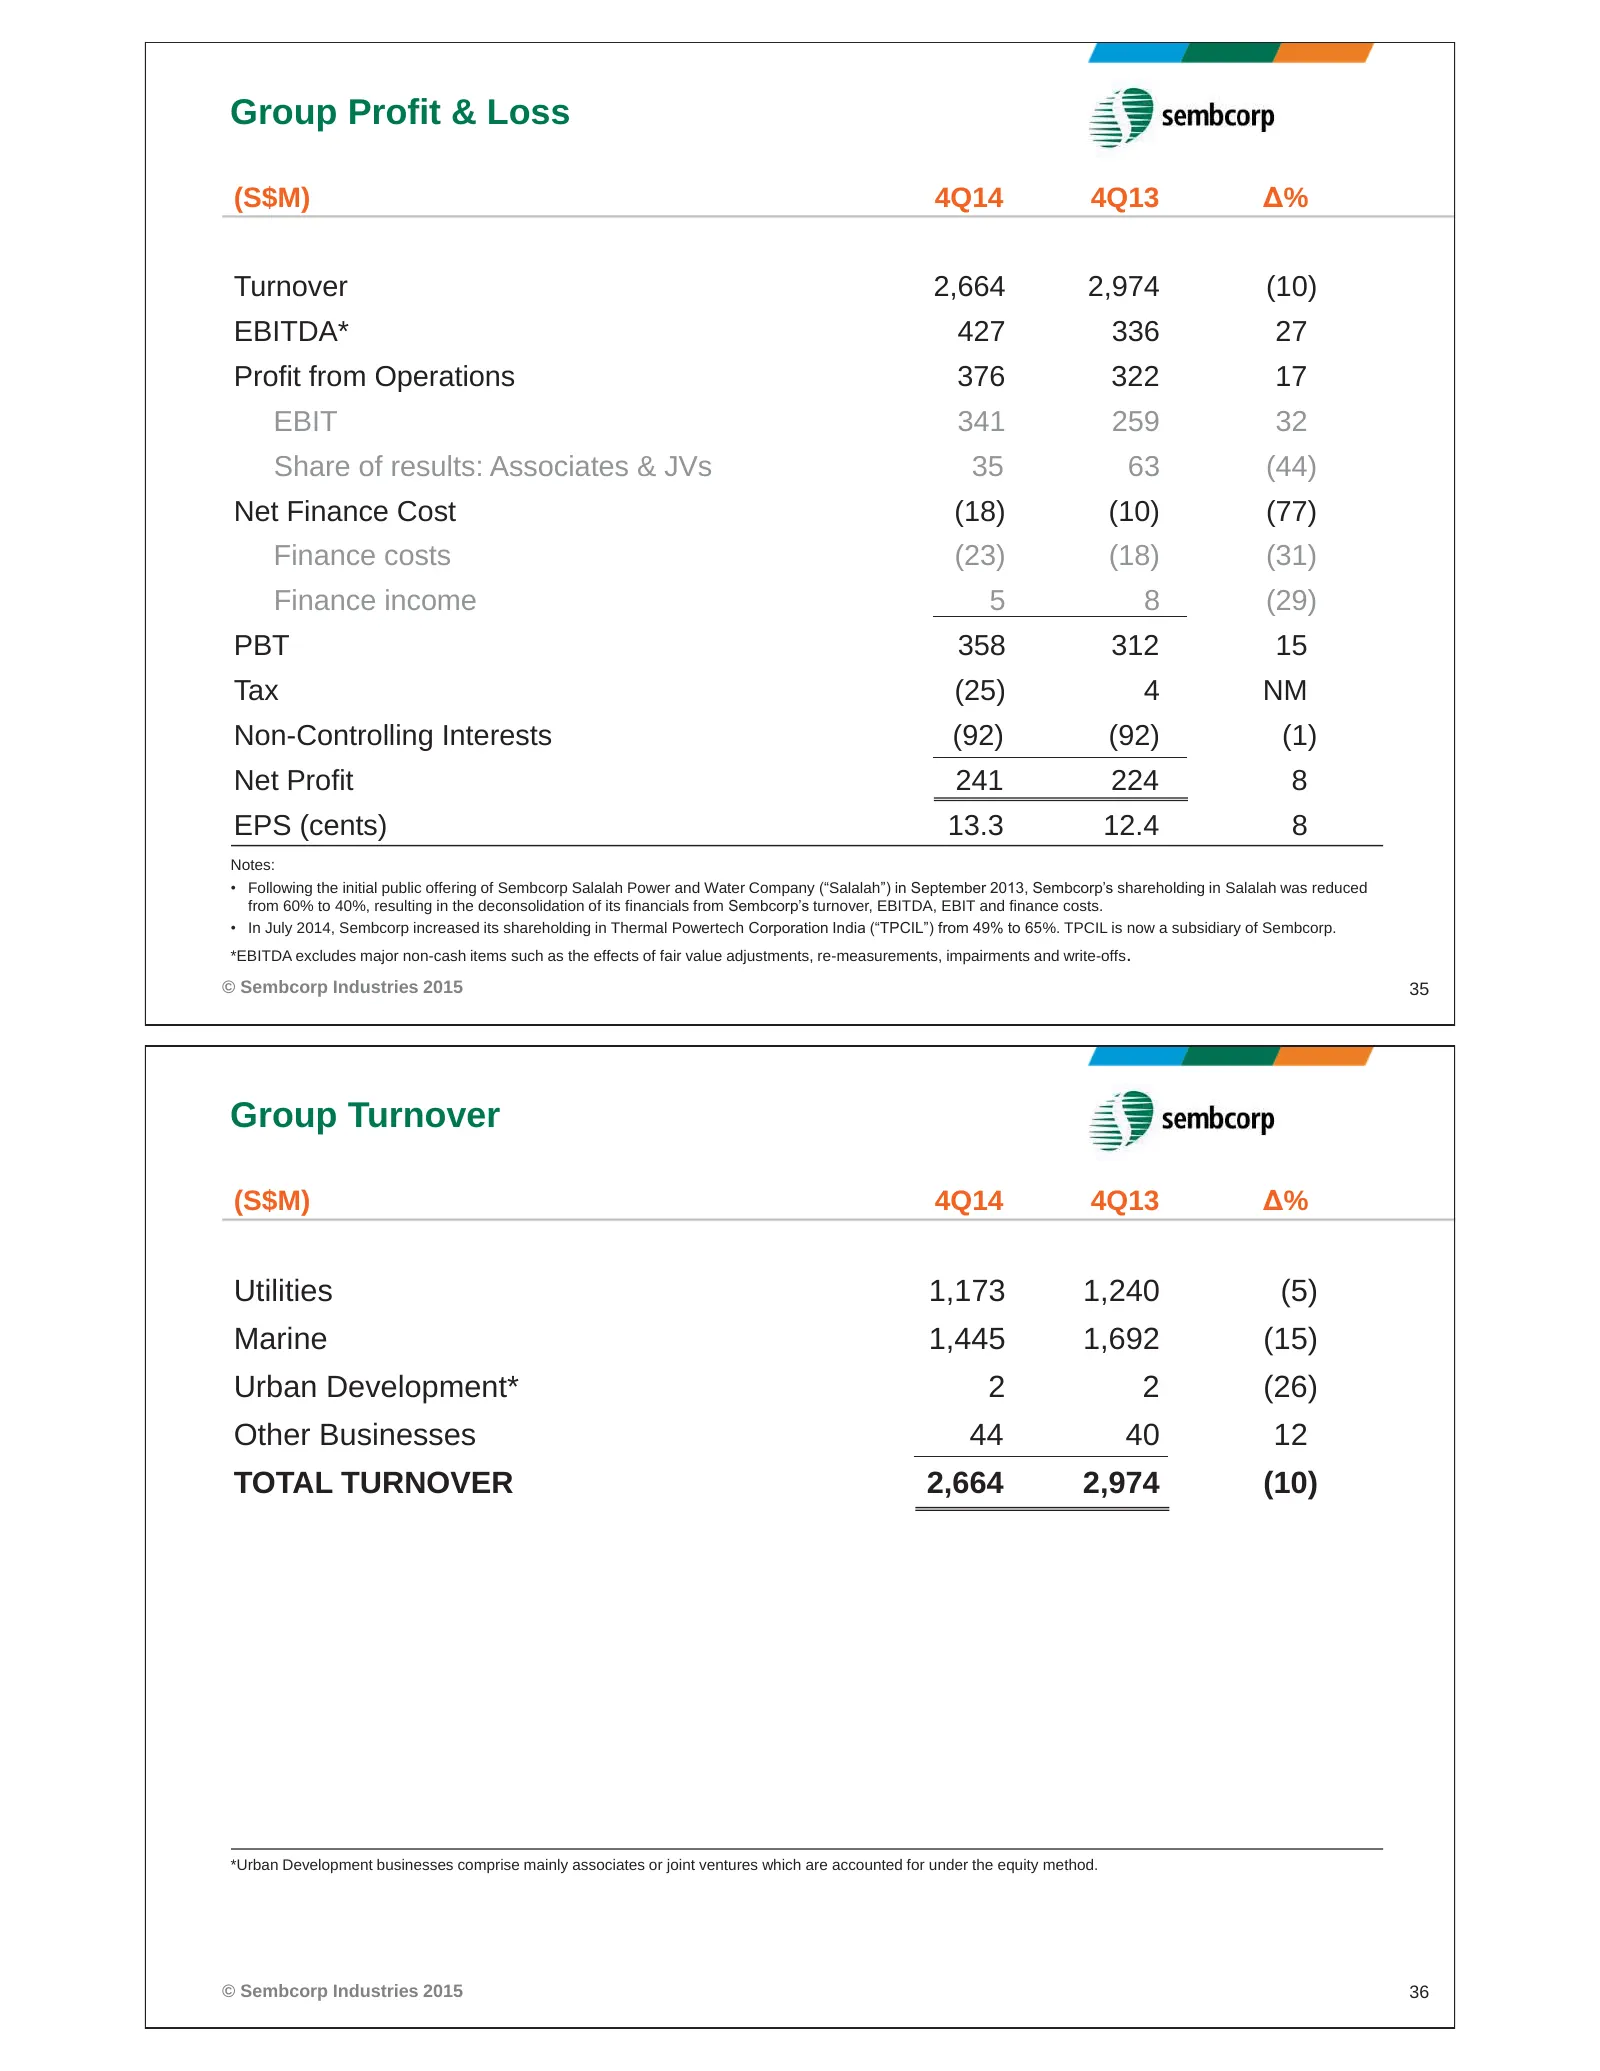
Group Turnover (S$M) FY14 FY13 Δ% Utilities 4,850 5,095 (5) Marine 5,831 5,523 6 Urban Development* 7 9 (23) Other Businesses 207 171 21 TOTAL TURNOVER 10,895 10,798 1 *Urban Development businesses comprise mainly associates or joint ventures which are accounted for under the equity method. © Sembco
Slide 12: Group Net Profit; Utilities Net Profit
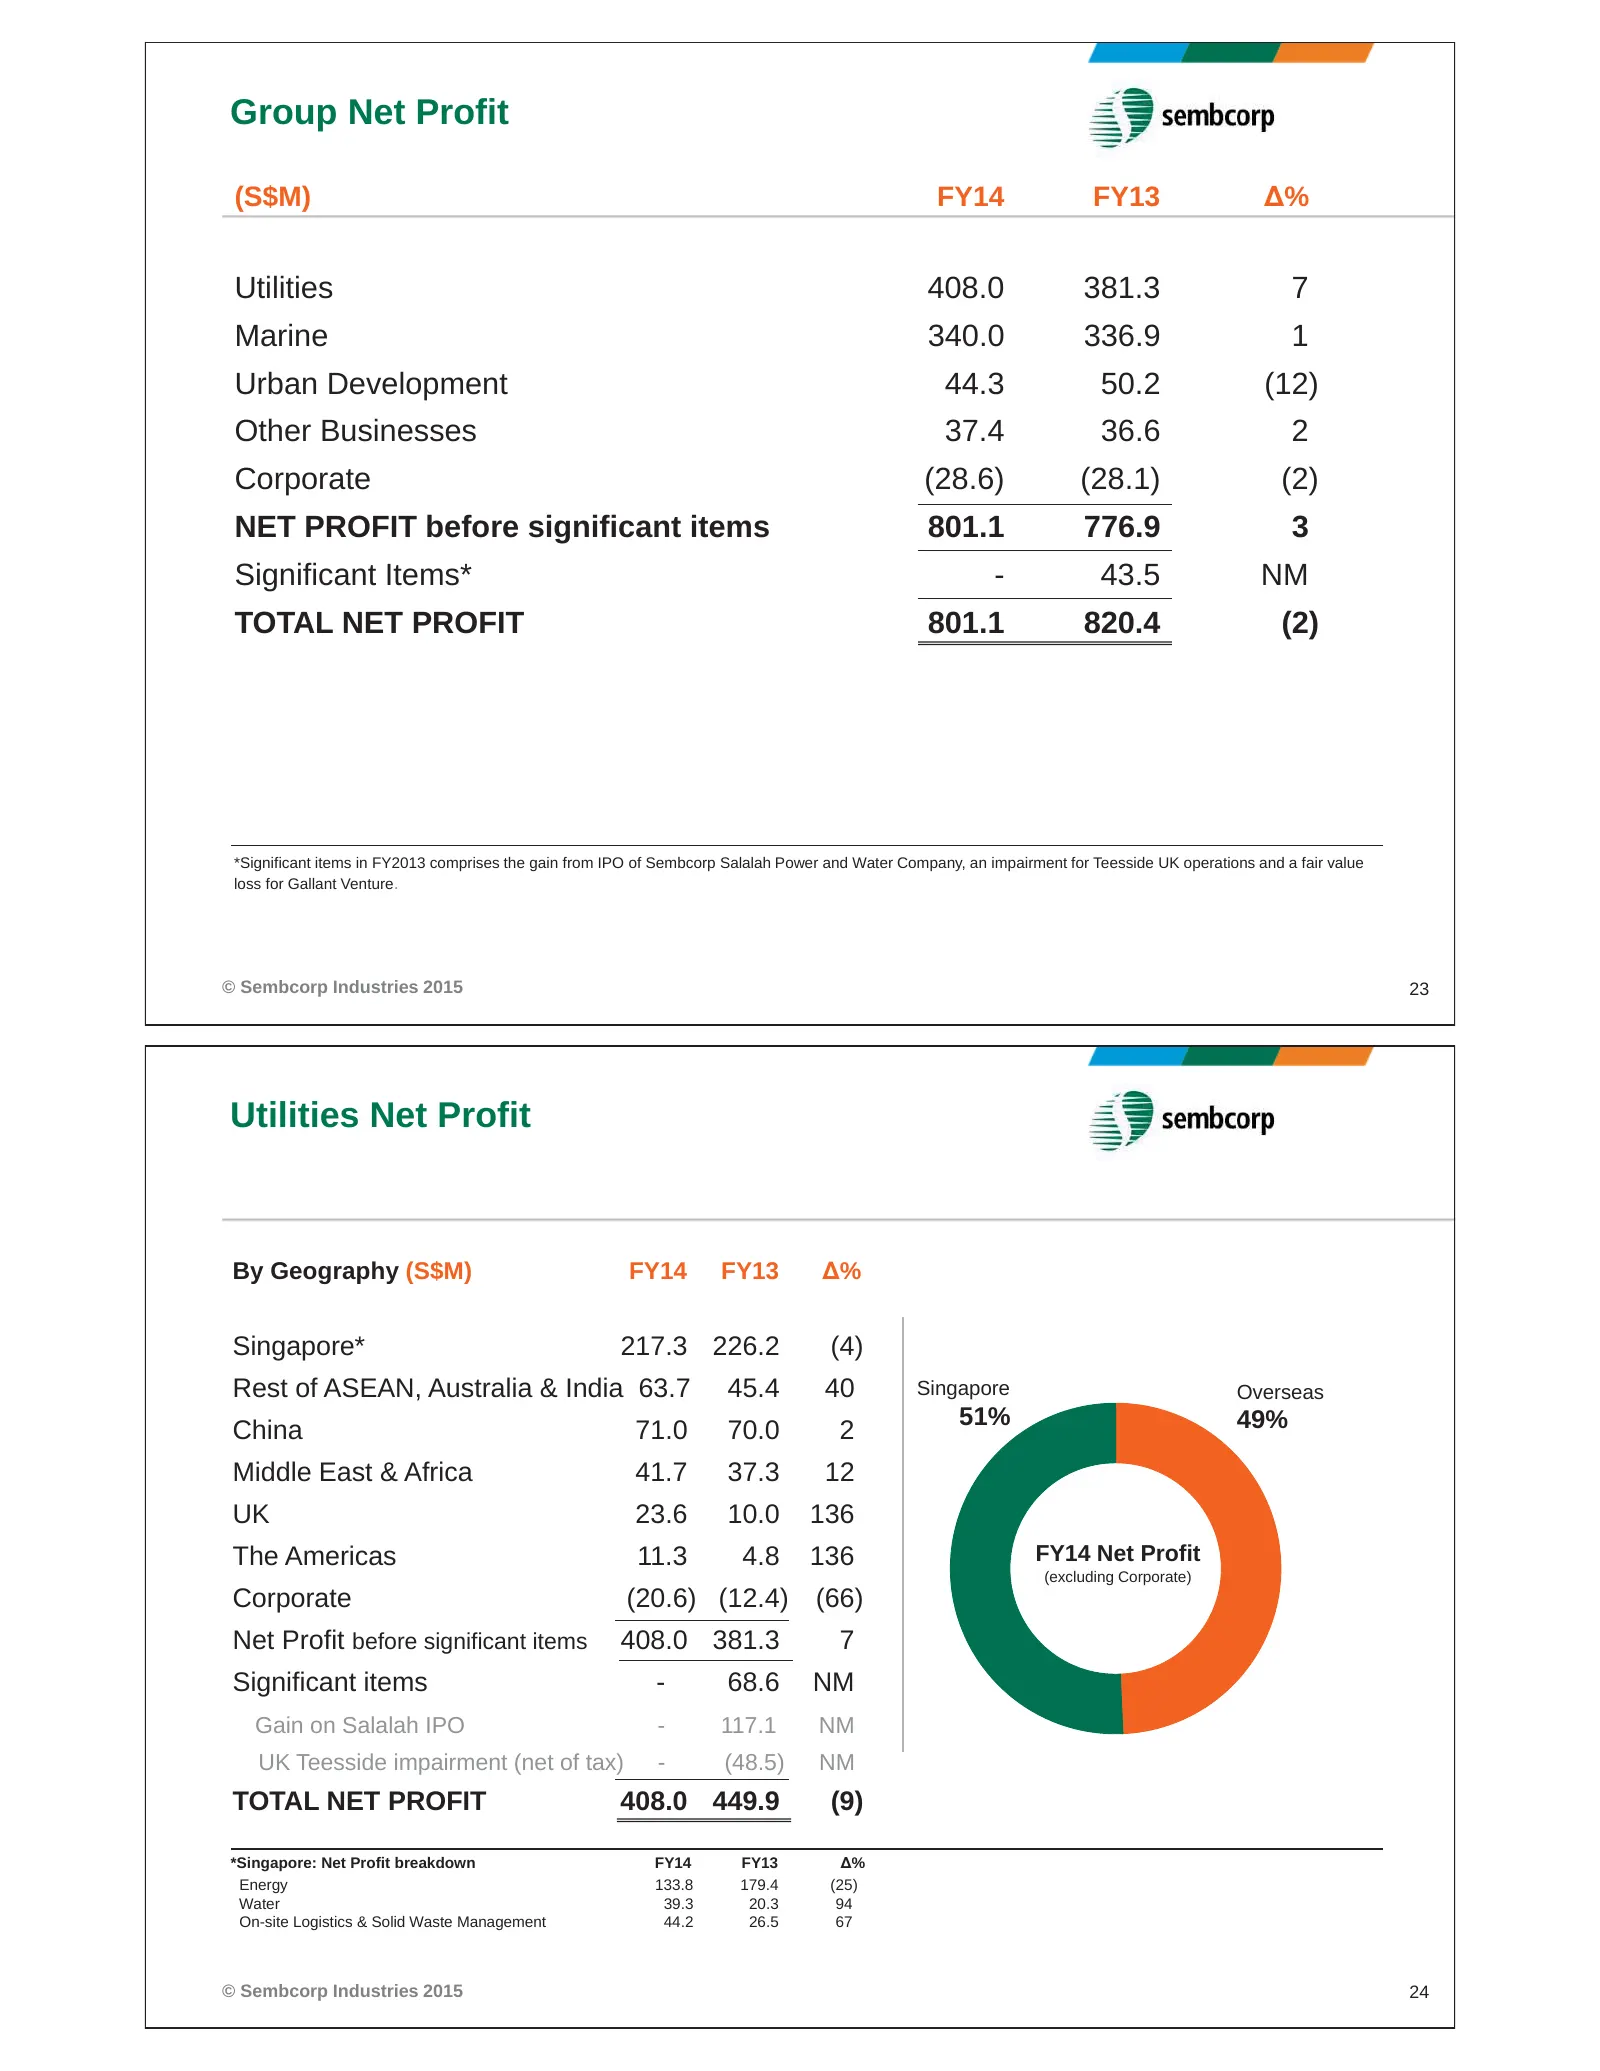
Group Net Profit (S$M) FY14 FY13 Δ% Utilities 408.0 381.3 7 Marine 340.0 336.9 1 Urban Development 44.3 50.2 (12) Other Businesses 37.4 36.6 2 Corporate (28.6) (28.1) (2) NET PROFIT before significant items 801.1 776.9 3 Significant Items* - 43.5 NM TOTAL NET PROFIT 801.1 820.4 (2) *Significant item
Slide 13: Utilities Net Profit; Group Capex and Equity Investment
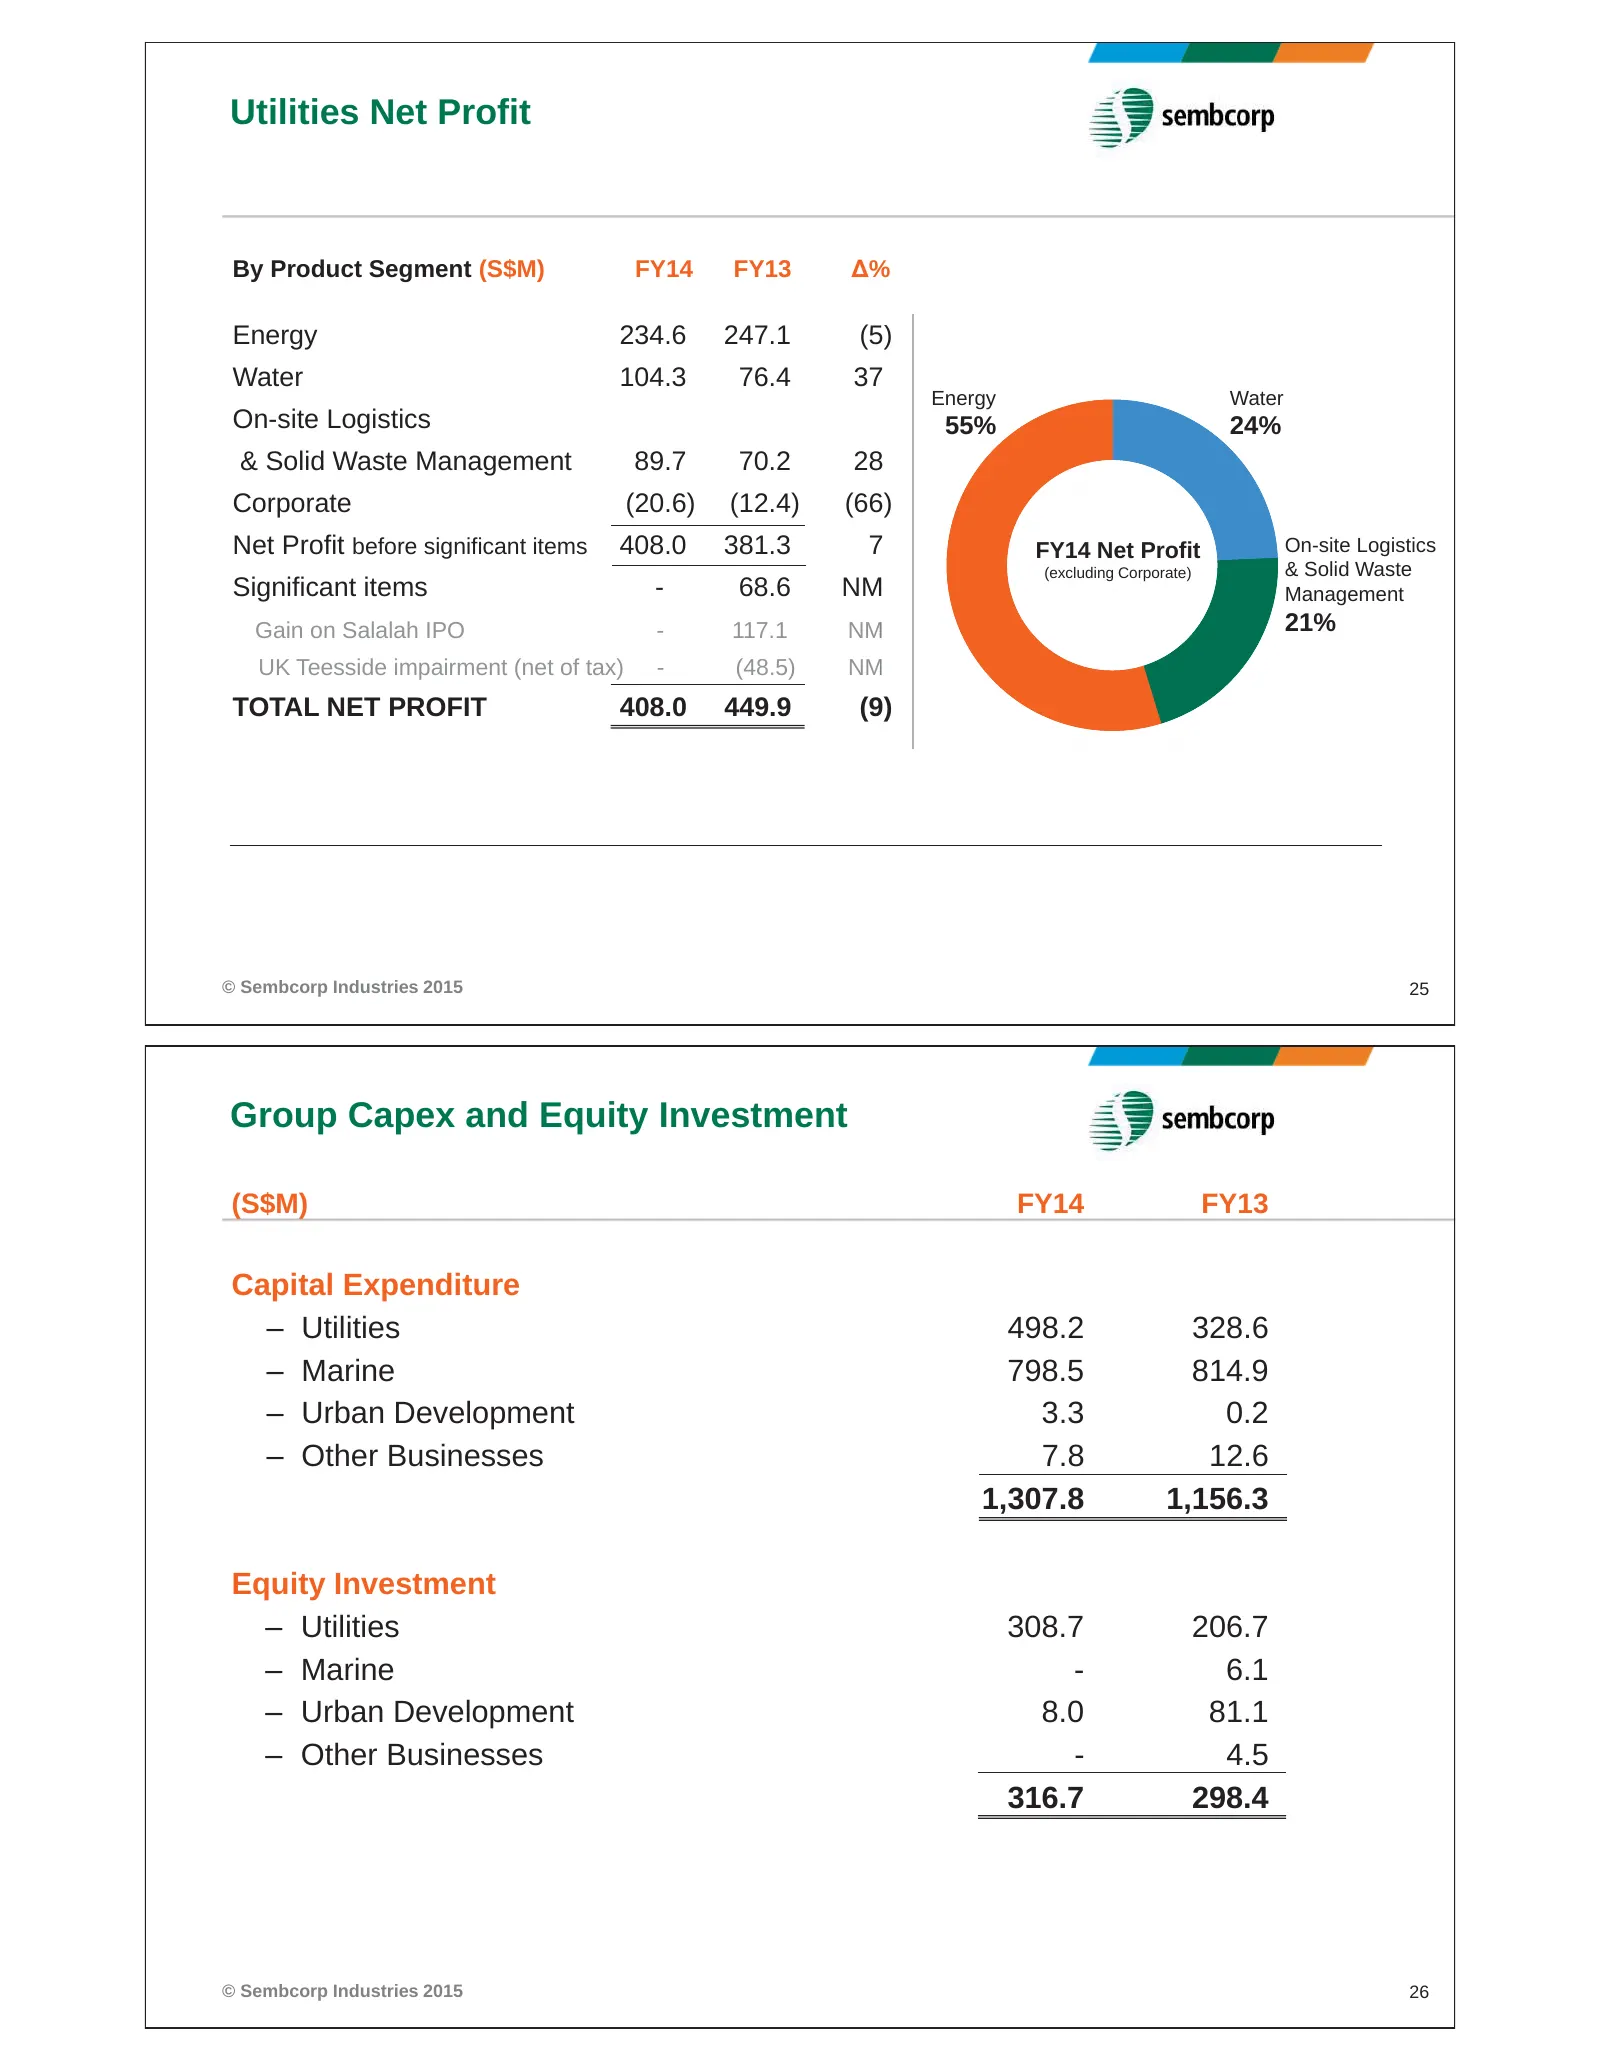
Utilities Net Profit By Product Segment (S$M) FY14 FY13 Δ% Energy 234.6 247.1 (5) 5) Water 104.3 76.4 7 37 Energy Water On-site Logistics 55% 24% & Solid Waste Management 89.7 70.2 28 8 Corporate (20.6) (12.4) (66) 6) Net Profit before significant items 408.0 381.3 7 FY14 Net Profit On-site Logistic
Slide 14: Group Free Cash Flow; Group Borrowings
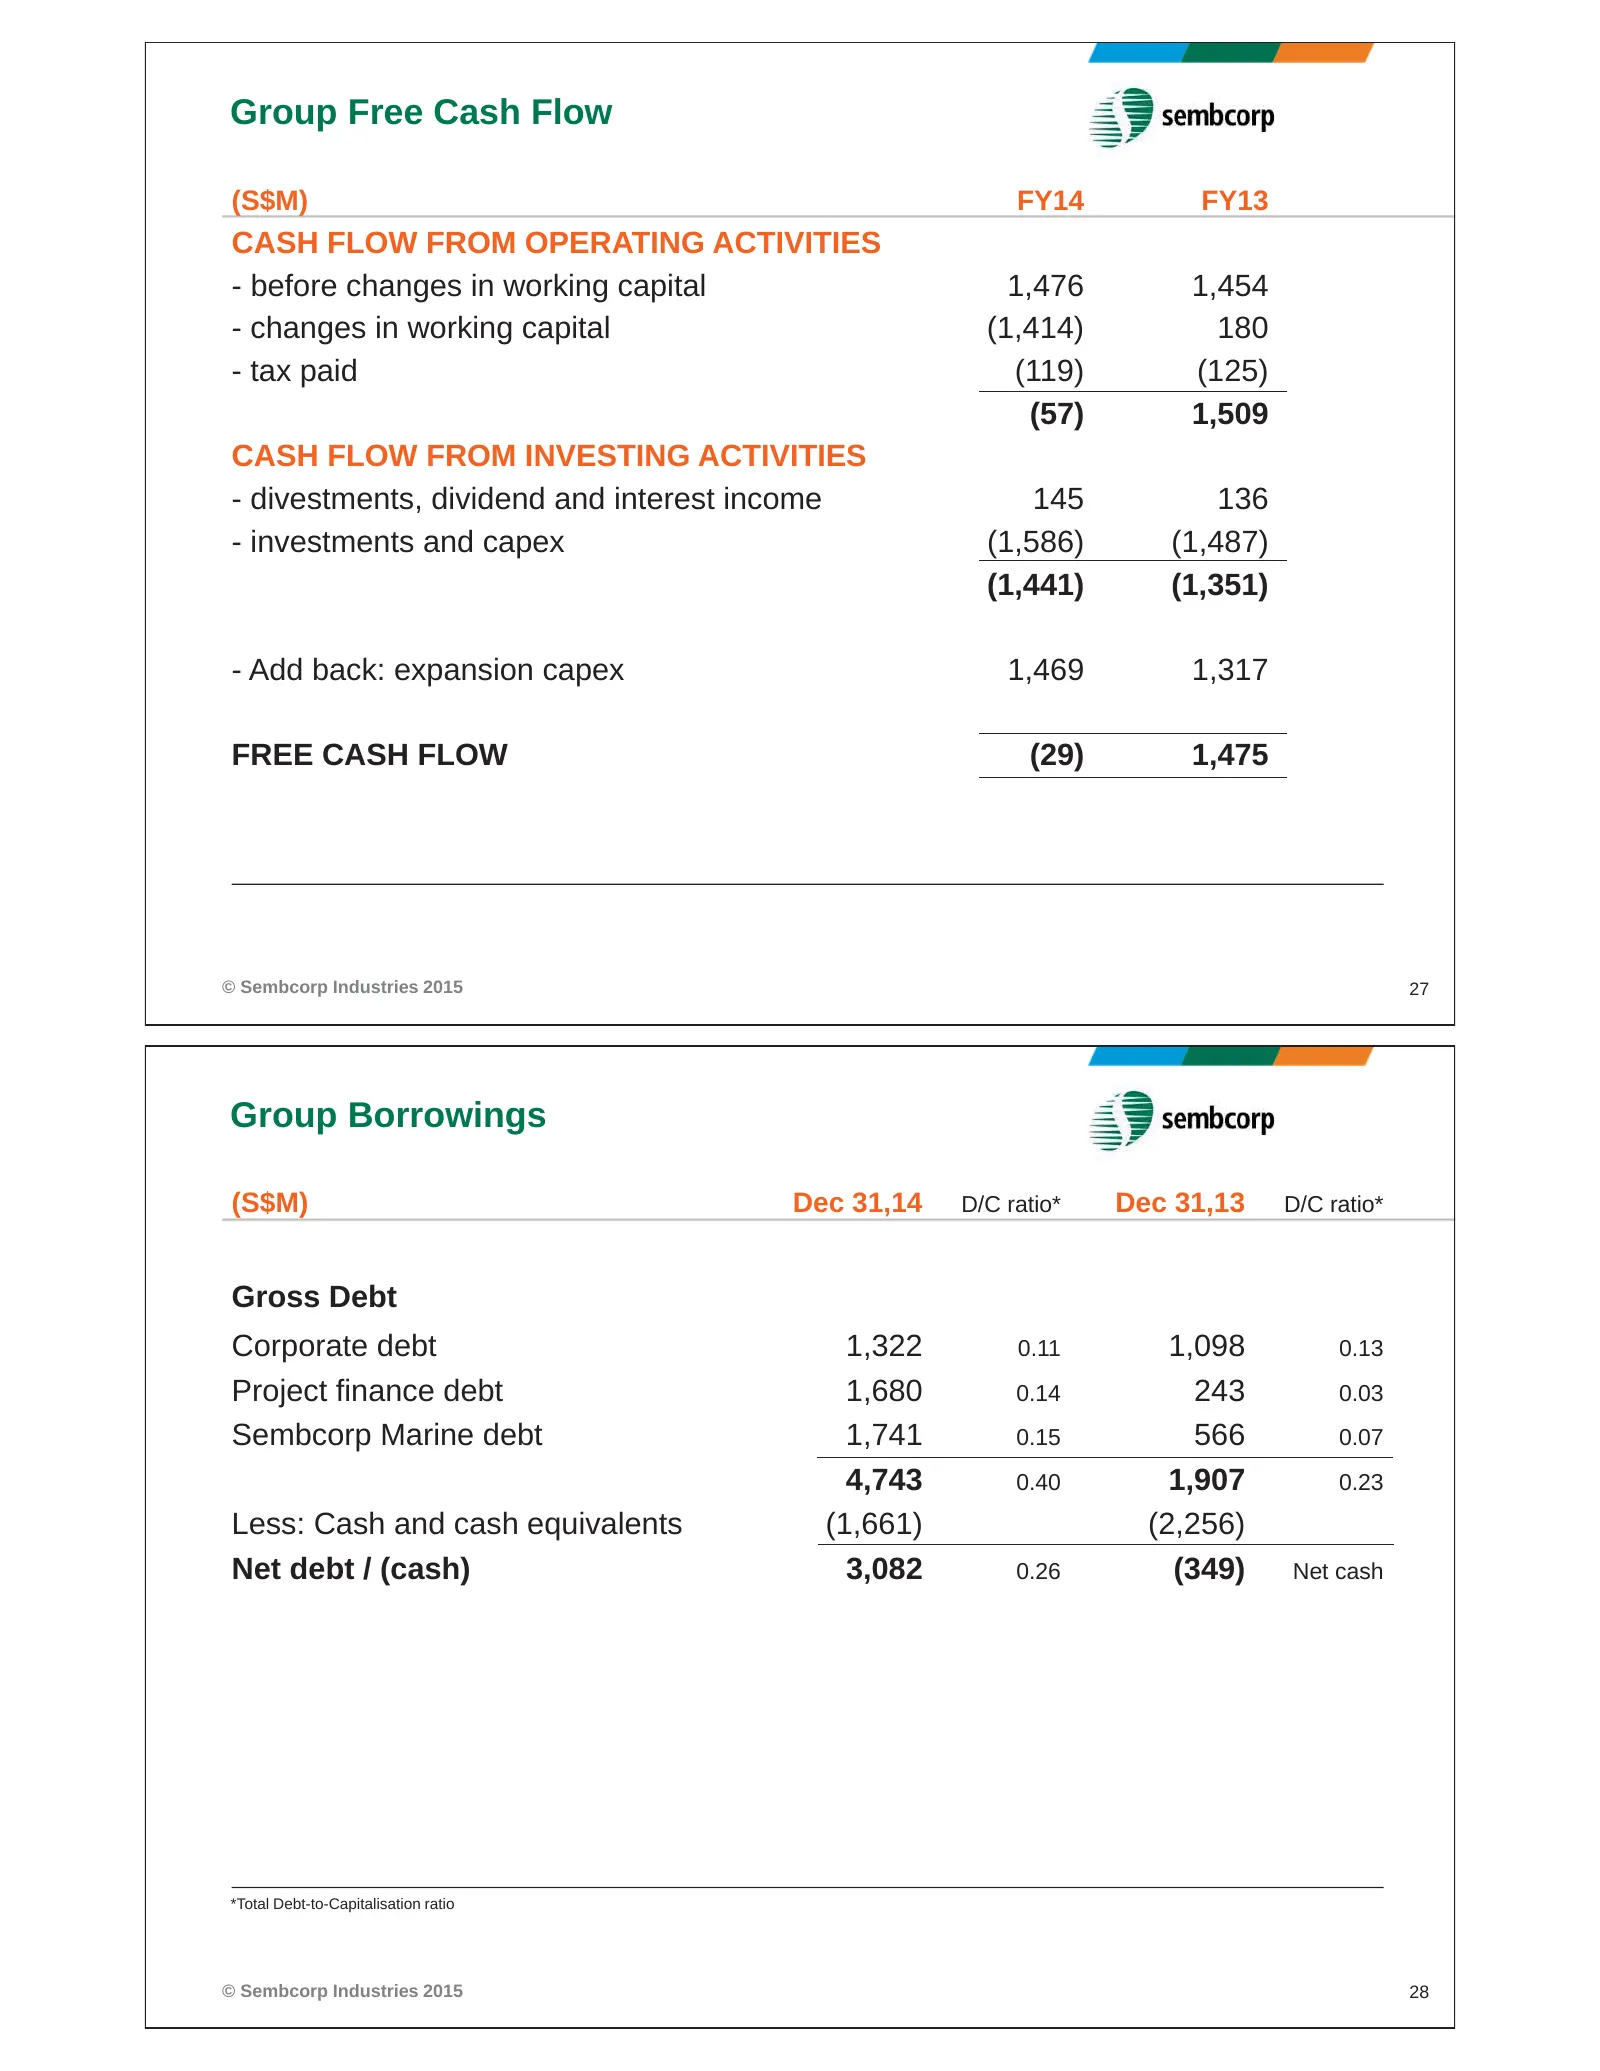
Group Free Cash Flow (S$M) FY14 FY13 CASH FLOW FROM OPERATING ACTIVITIES - before changes in working capital 1,476 1,454 - changes in working capital (1,414) 180 - tax paid (119) (125) (57) 1,509 CASH FLOW FROM INVESTING ACTIVITIES - divestments, dividend and interest income 145 136 - investments an
Slide 15: Financial Indicators; Group Outlook
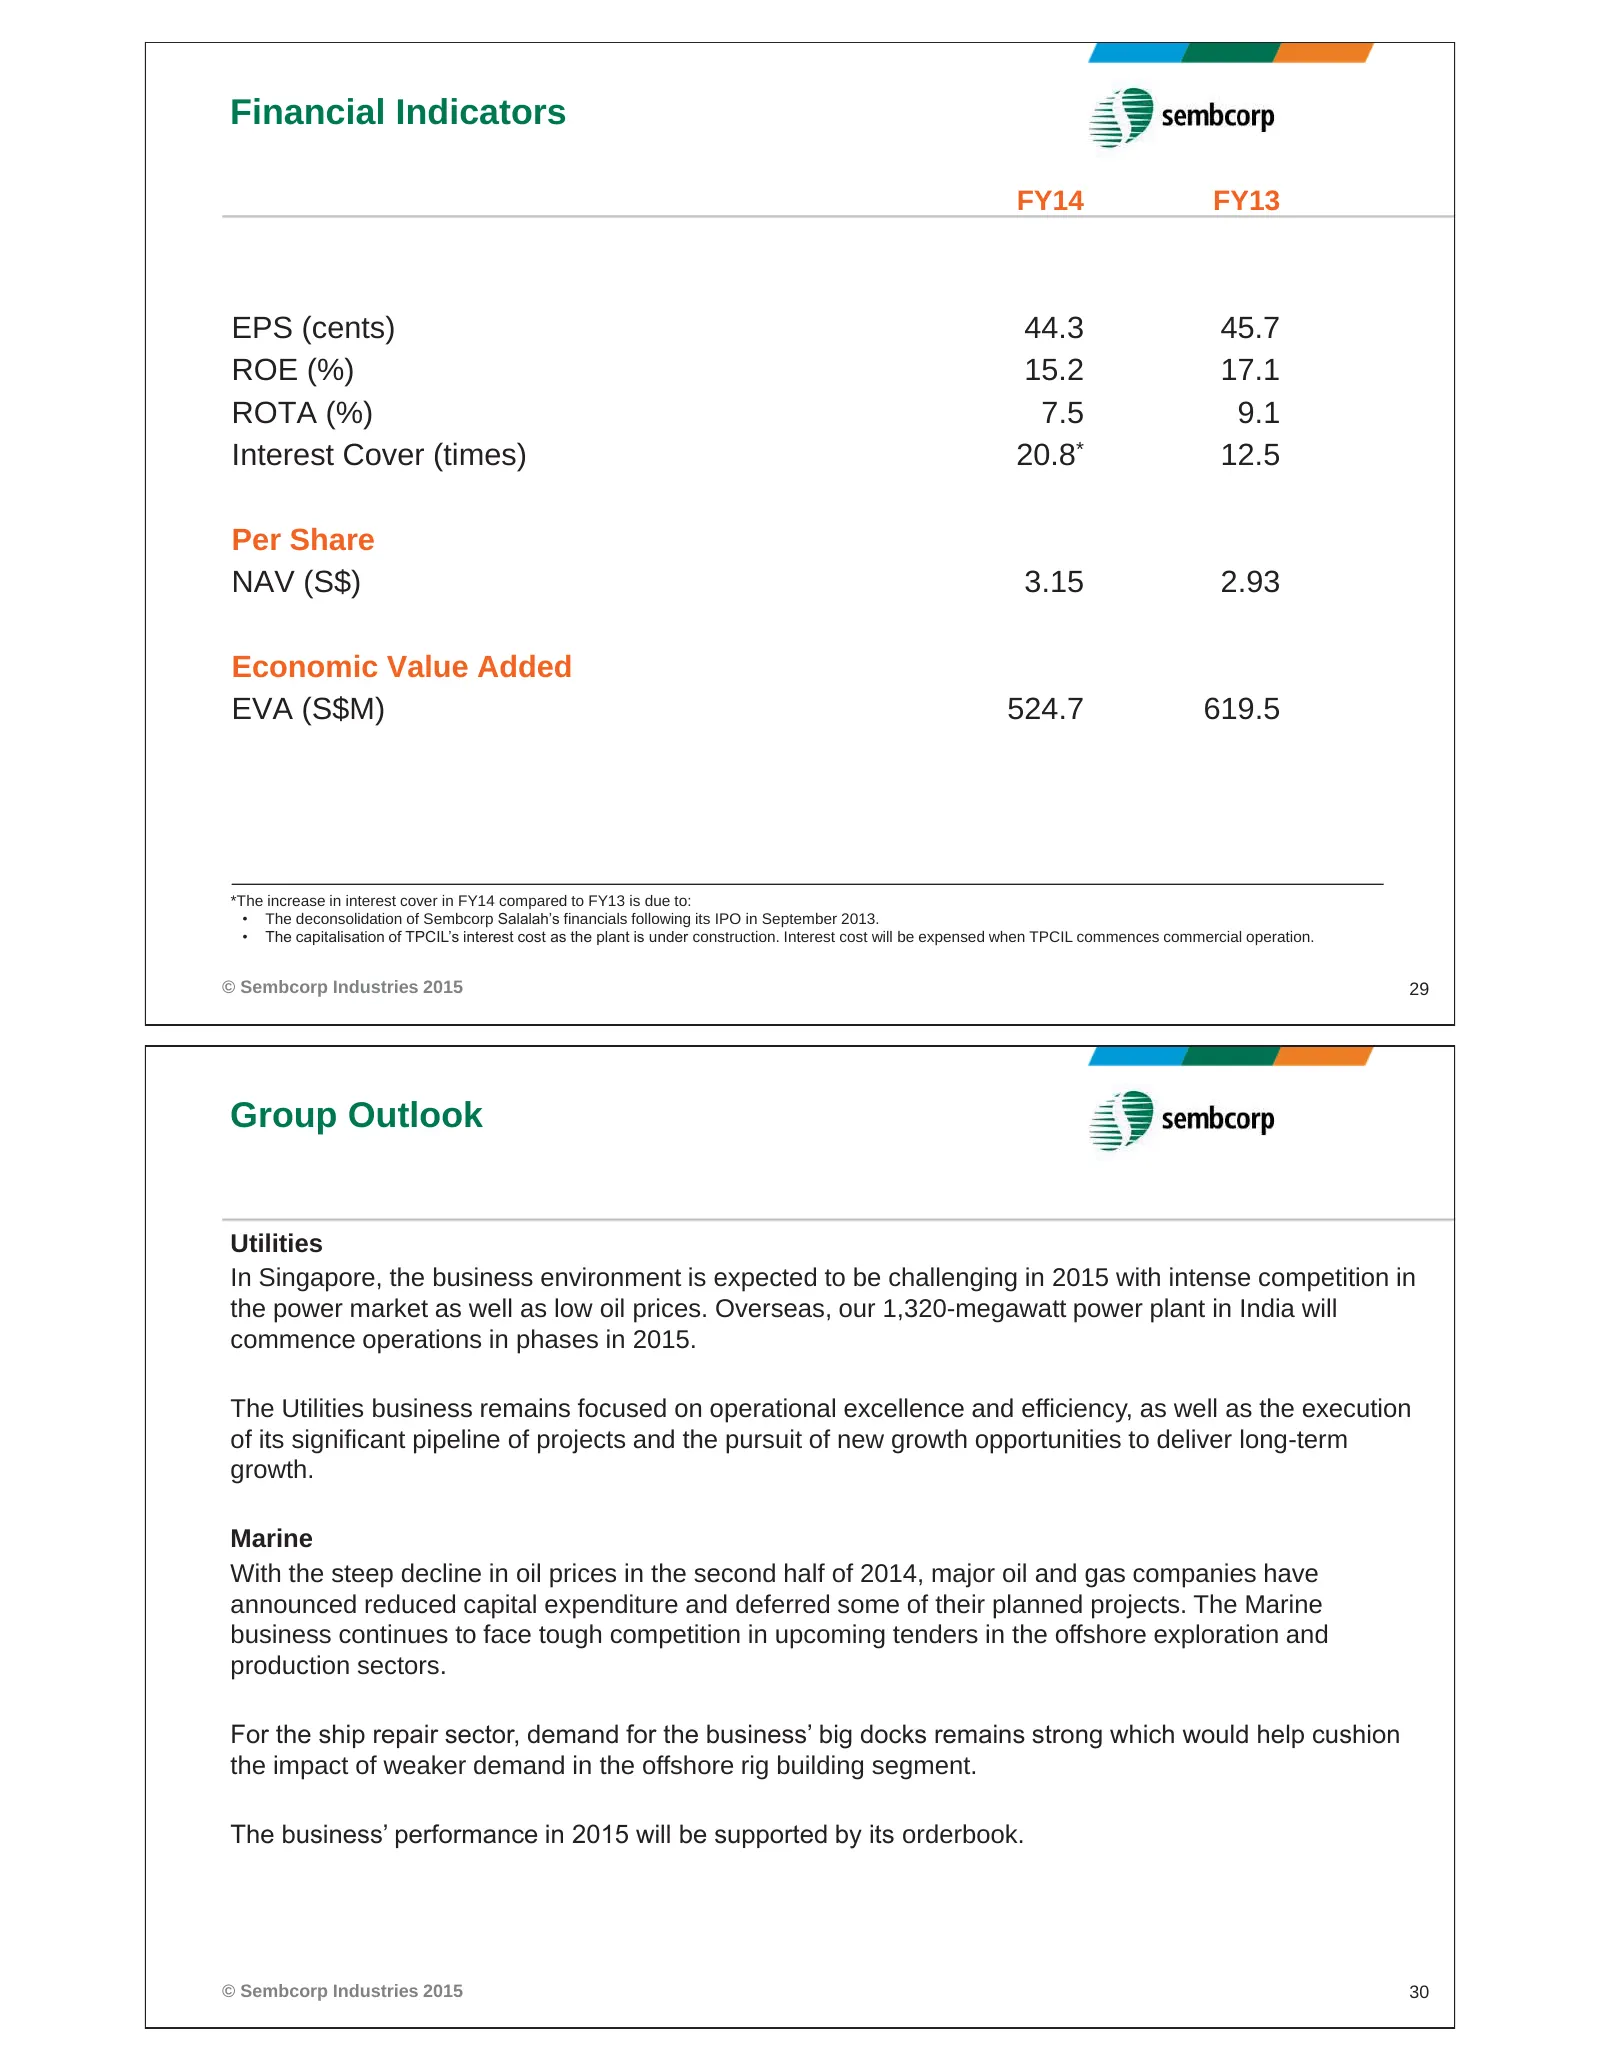
Financial Indicators FY14 FY13 EPS (cents) 44.3 45.7 ROE (%) 15.2 17.1 ROTA (%) 7.5 9.1 Interest Cover (times) 20.8* 12.5 Per Share NAV (S$) 3.15 2.93 Economic Value Added EVA (S$M) 524.7 619.5 *The increase in interest cover in FY14 compared to FY13 is due to: • The deconsolidation of Sembcorp Sala
Slide 16: Group Outlook: Urban Development and Group
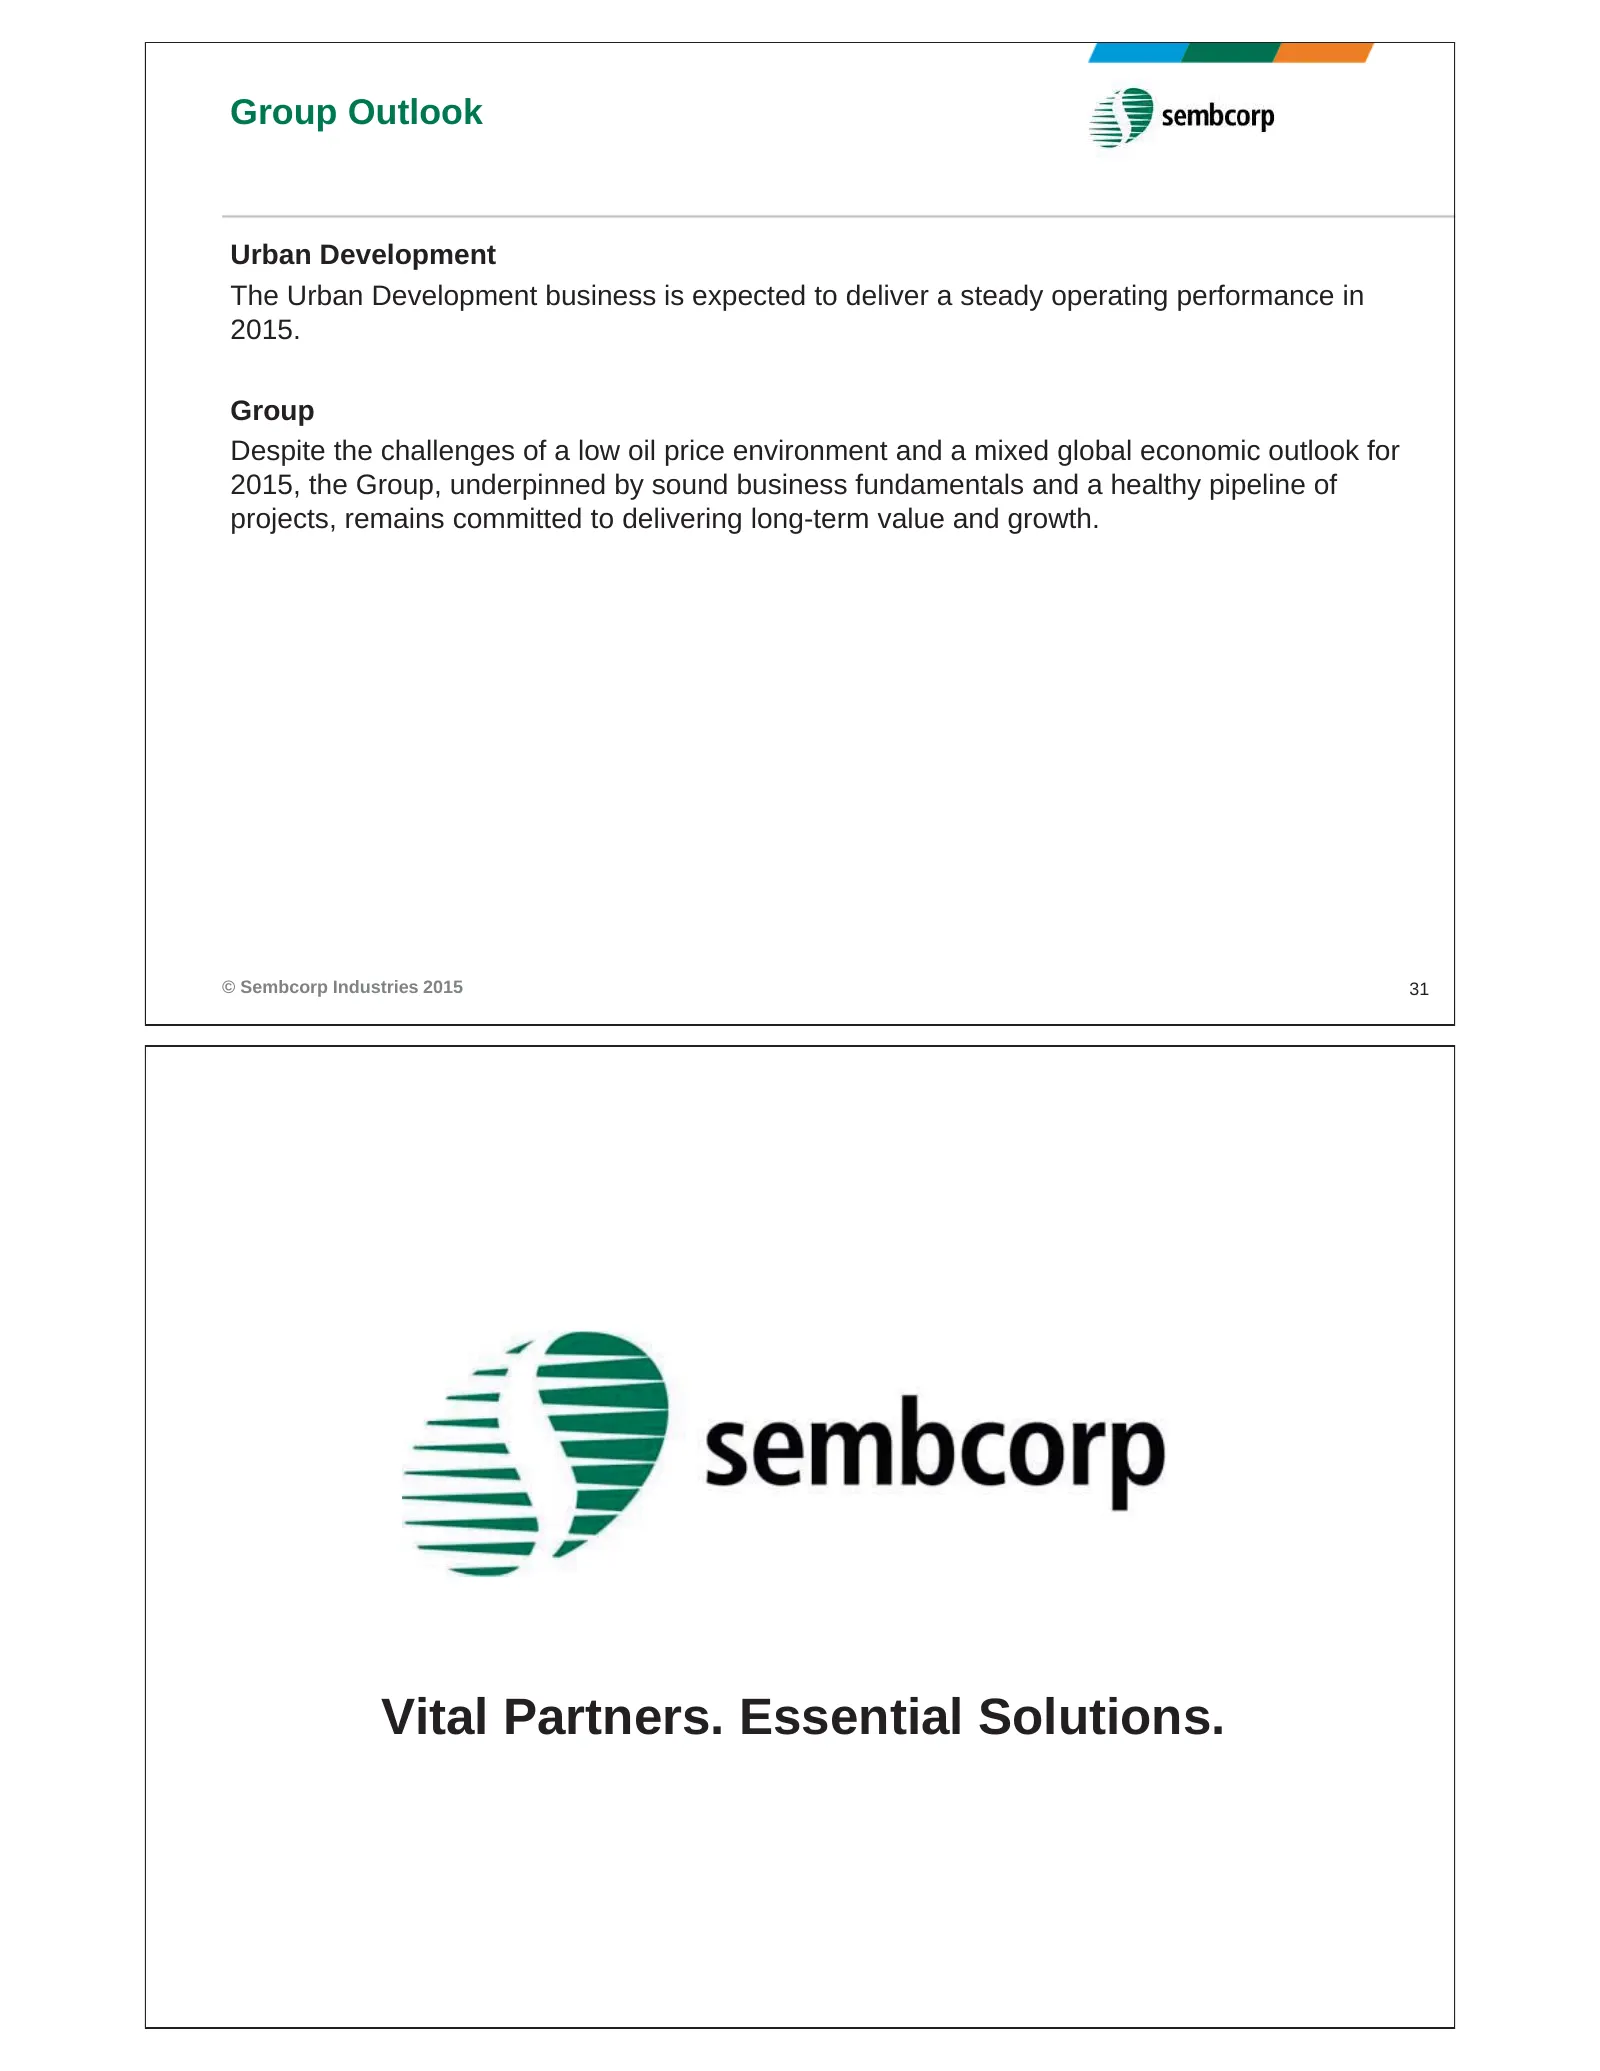
Group Outlook Urban Development The Urban Development business is expected to deliver a steady operating performance in 2015. Group Despite the challenges of a low oil price environment and a mixed global economic outlook for 2015, the Group, underpinned by sound business fundamentals and a healthy
Slide 17: Disclaimer
Disclaimer This presentation contains certain statements that are not statements of historical fact, i.e. forward- looking statements. These forward-looking statements are based on current expectations, projections and assumptions about future events. Although Sembcorp Industries believes that these
Slide 18: Group Profit & Loss (4Q14)
Group Profit & Loss (S$M) 4Q14 4Q13 Δ% Turnover 2,664 2,974 (10) EBITDA* 427 336 27 Profit from Operations 376 322 17 EBIT 341 259 32 Share of results: Associates & JVs 35 63 (44) Net Finance Cost (18) (10) (77) Finance costs (23) (18) (31) Finance income 5 8 (29) PBT 358 312 15 Tax (25) 4 NM Non-Co
Slide 19: Group Profit from Operations; Group Net Profit
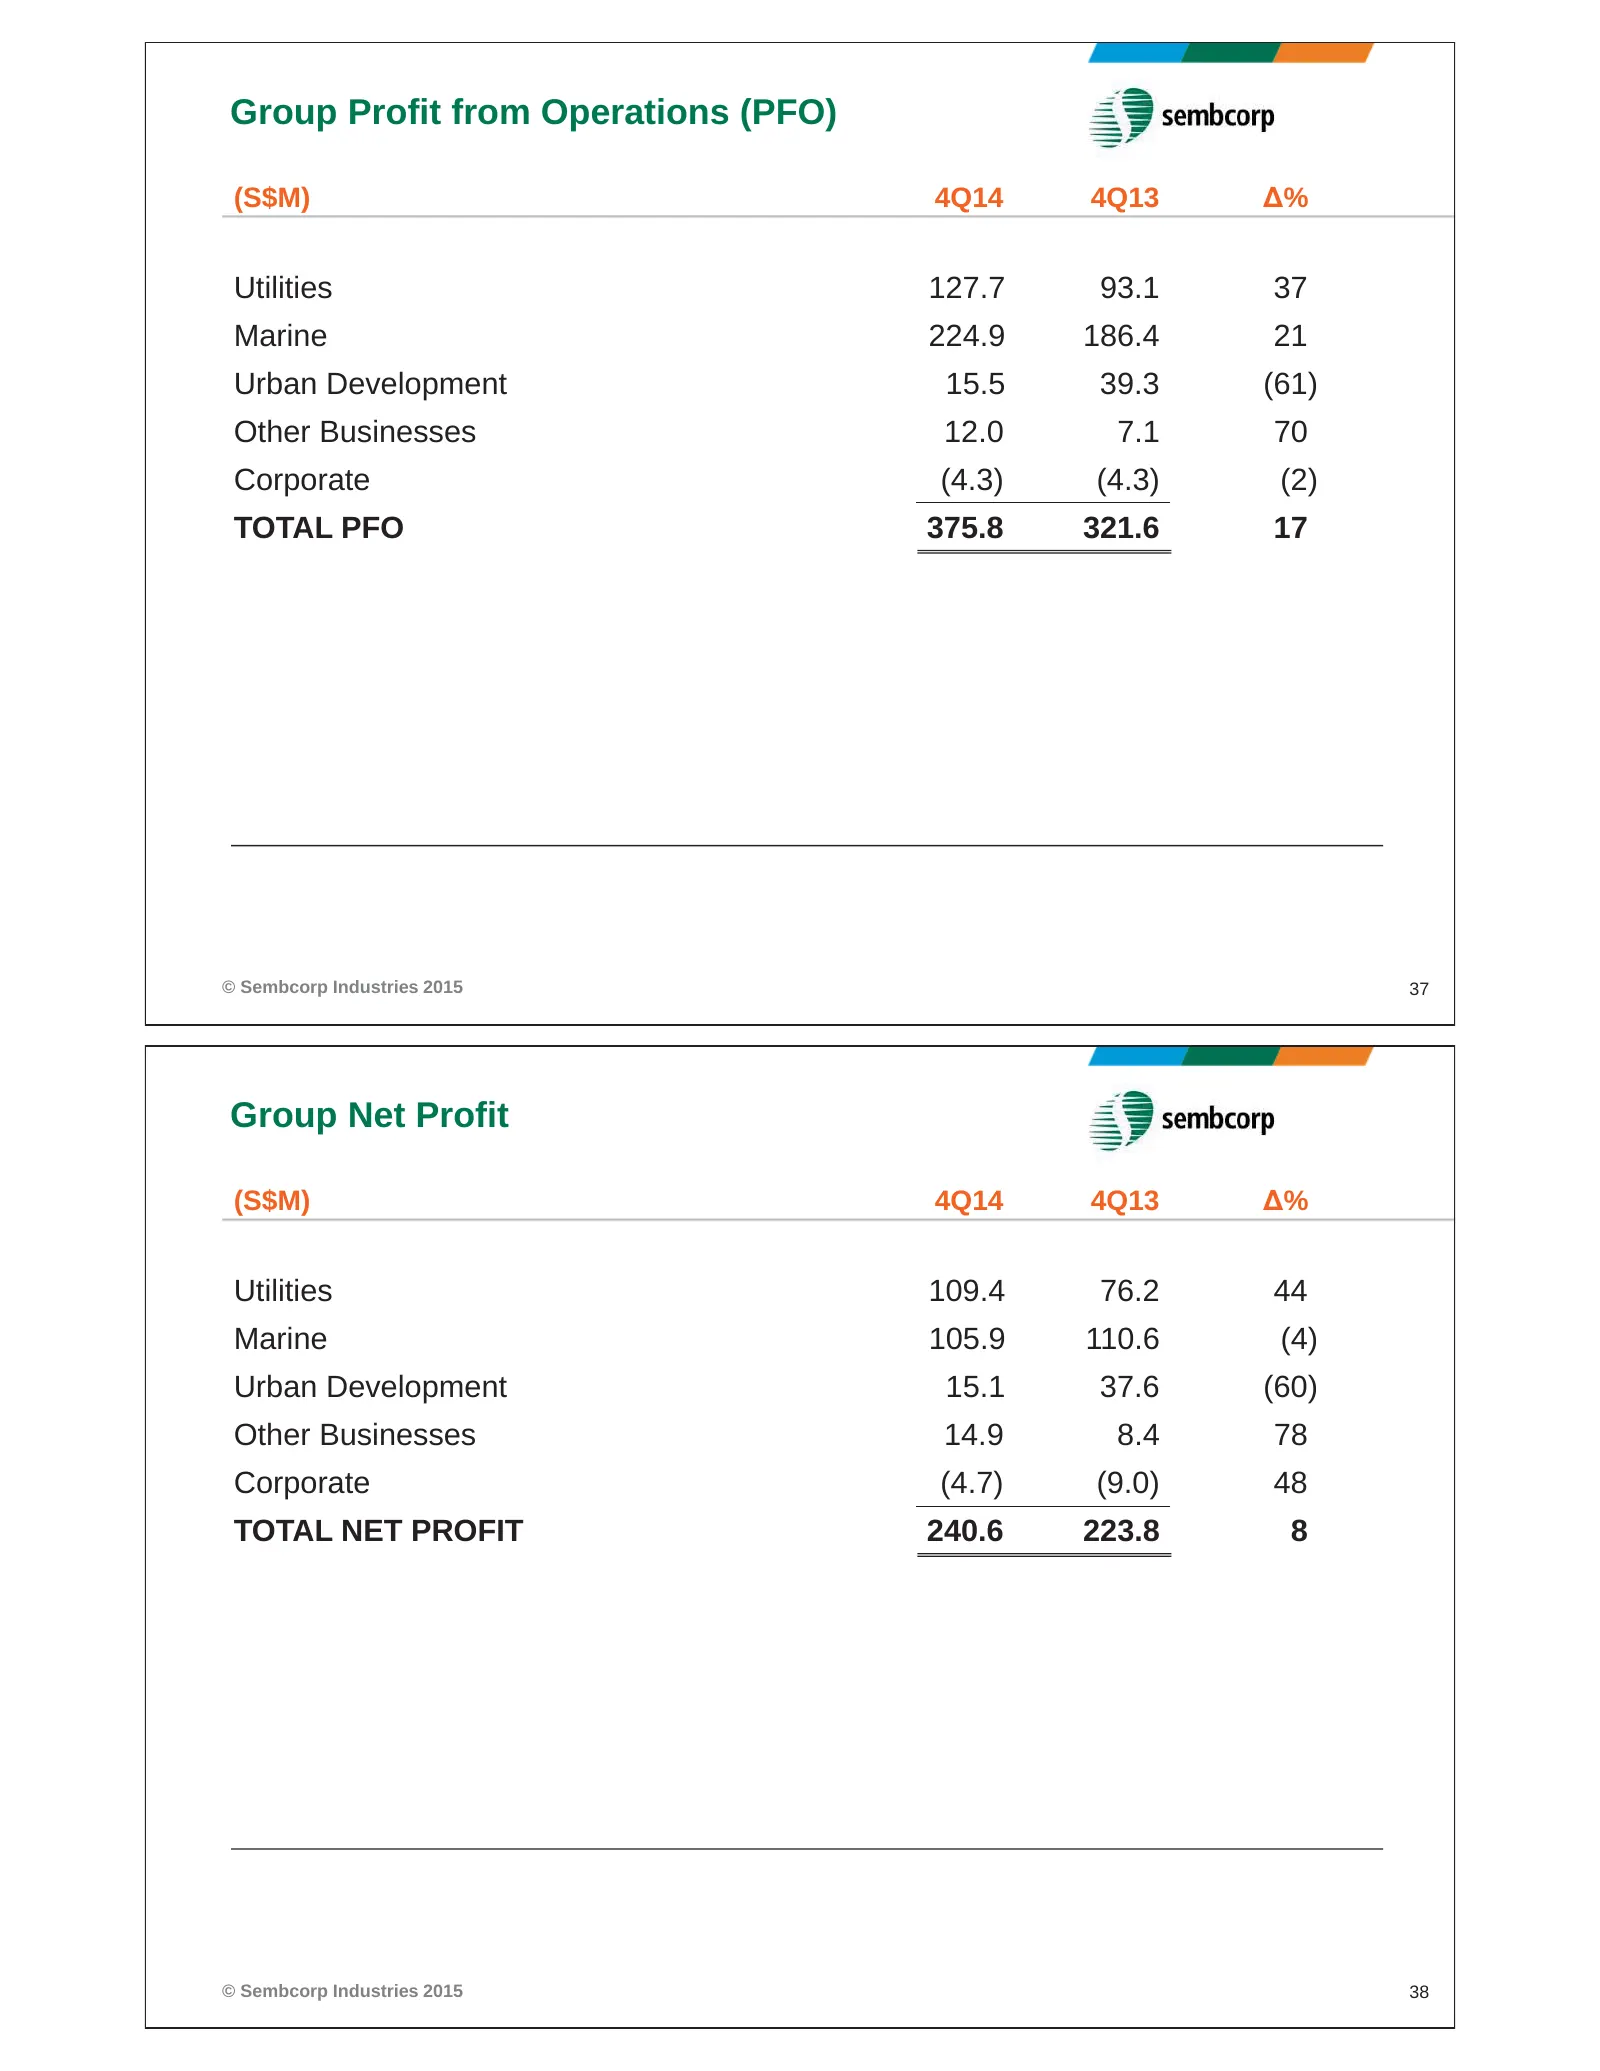
Group Profit from Operations (PFO) (S$M) 4Q14 4Q13 Δ% Utilities 127.7 93.1 37 Marine 224.9 186.4 21 Urban Development 15.5 39.3 (61) Other Businesses 12.0 7.1 70 Corporate (4.3) (4.3) (2) TOTAL PFO 375.8 321.6 17 © Sembcorp Industries 2015 37 Group Net Profit (S$M) 4Q14 4Q13 Δ% Utilities 109.4 76.2
Slide 20: Utilities Turnover; Utilities Profit From Operations
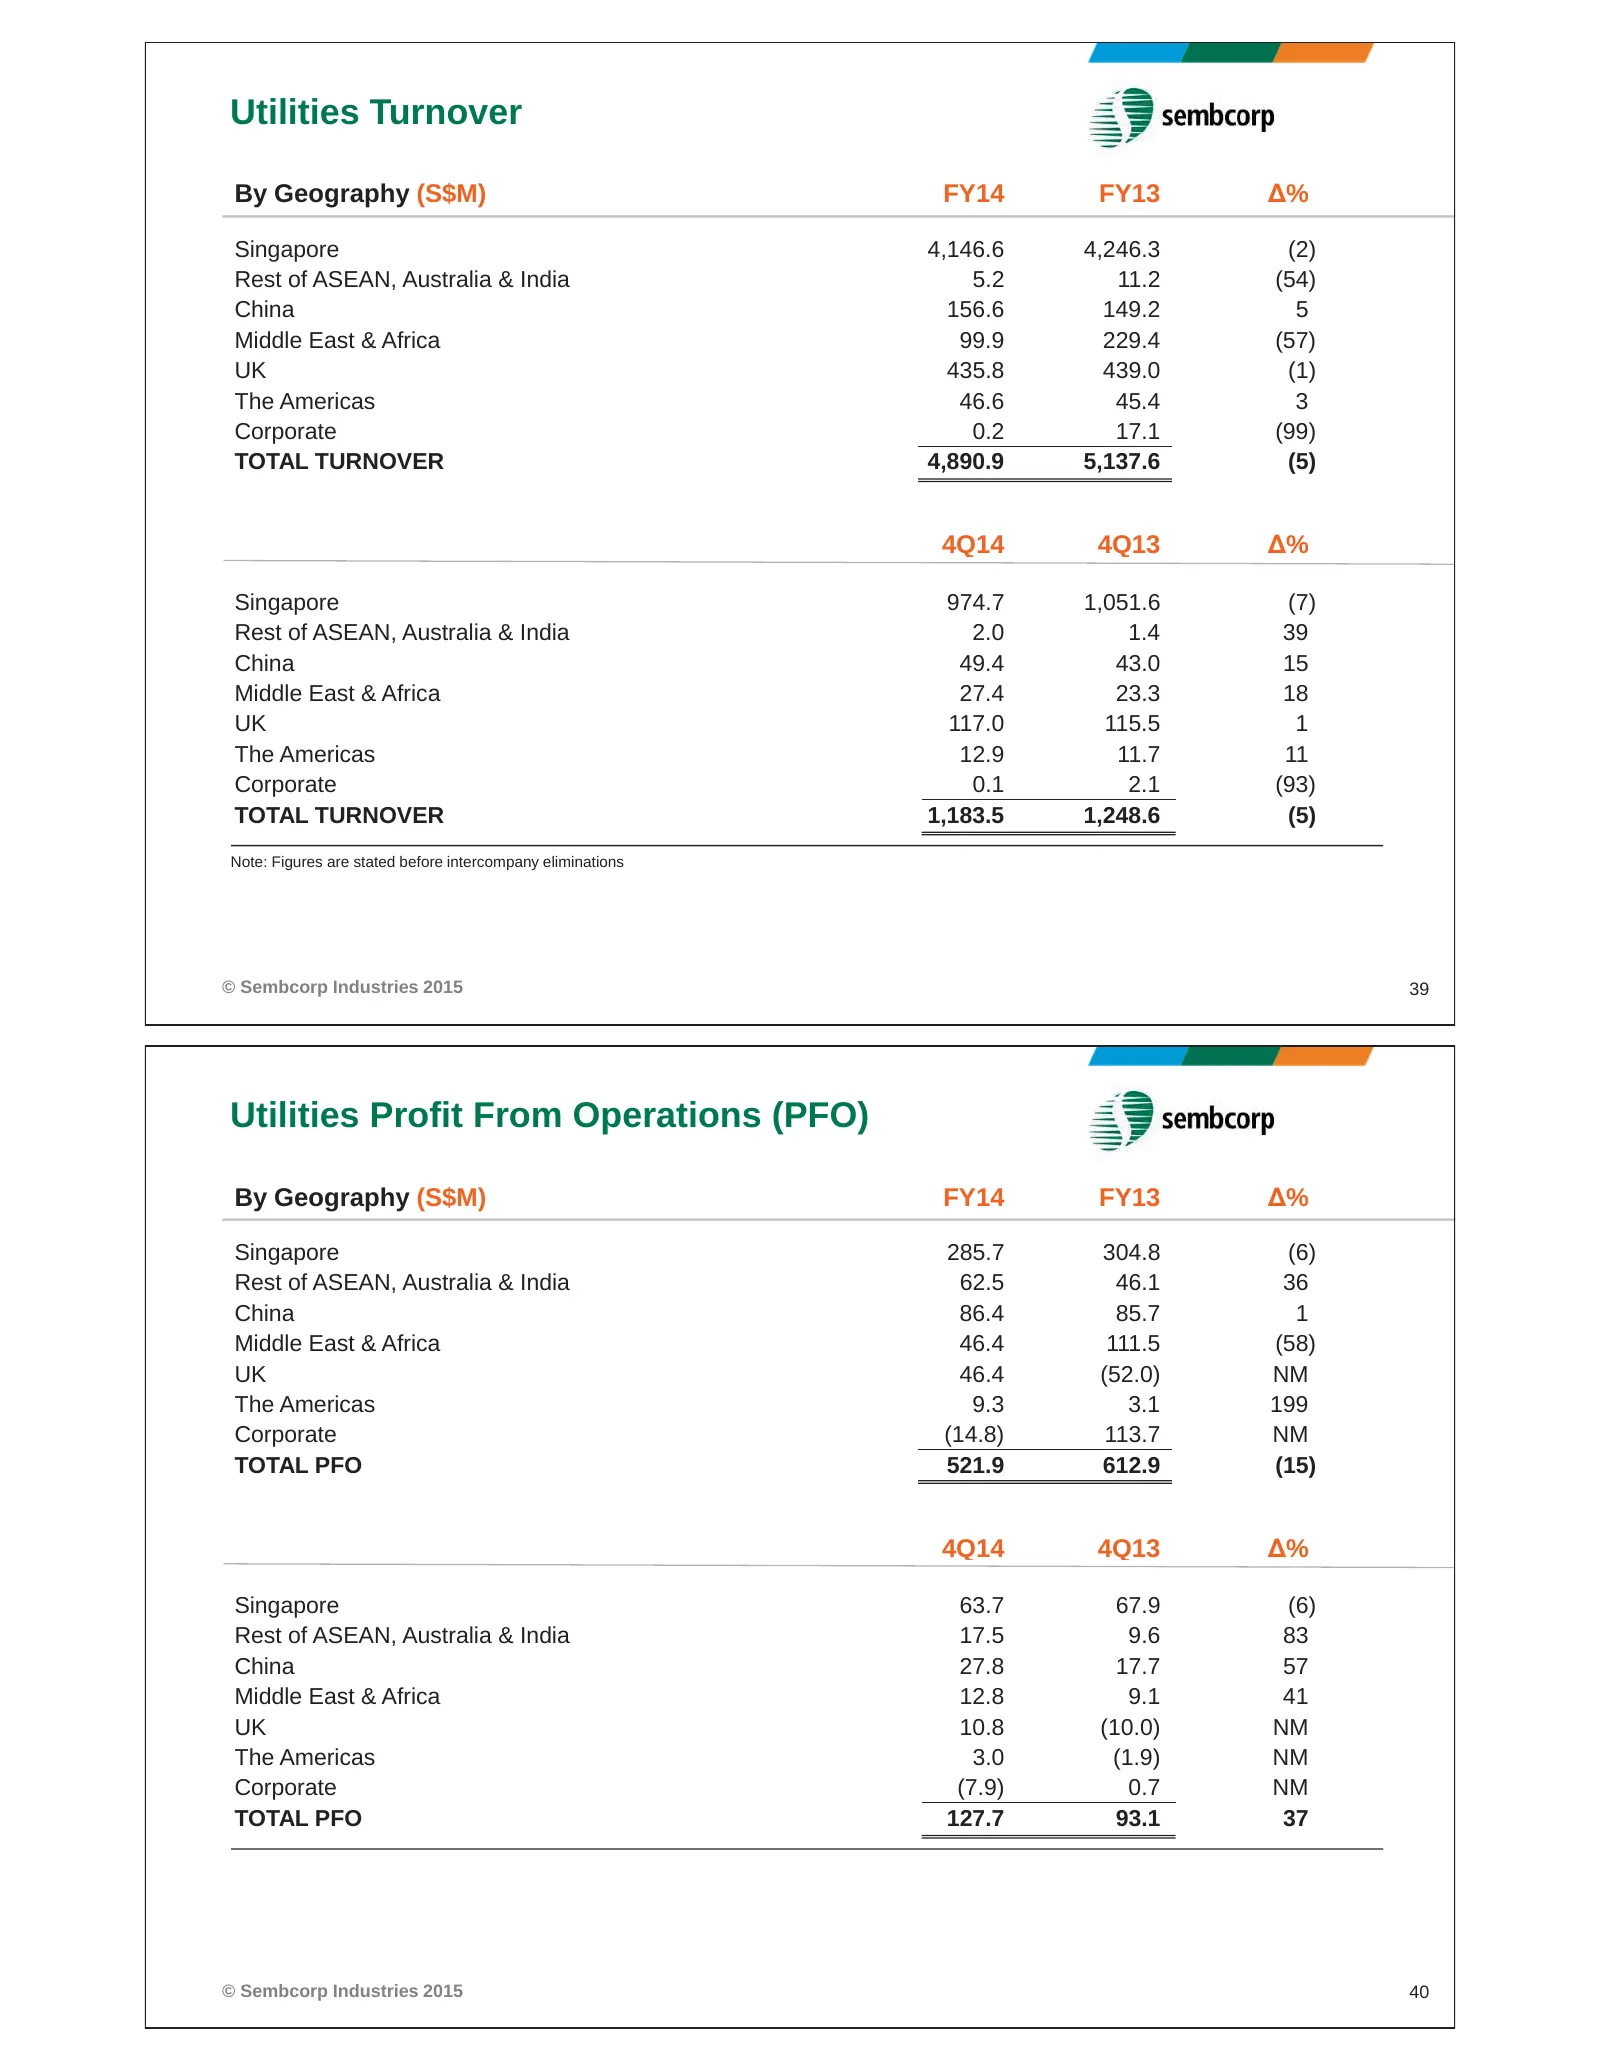
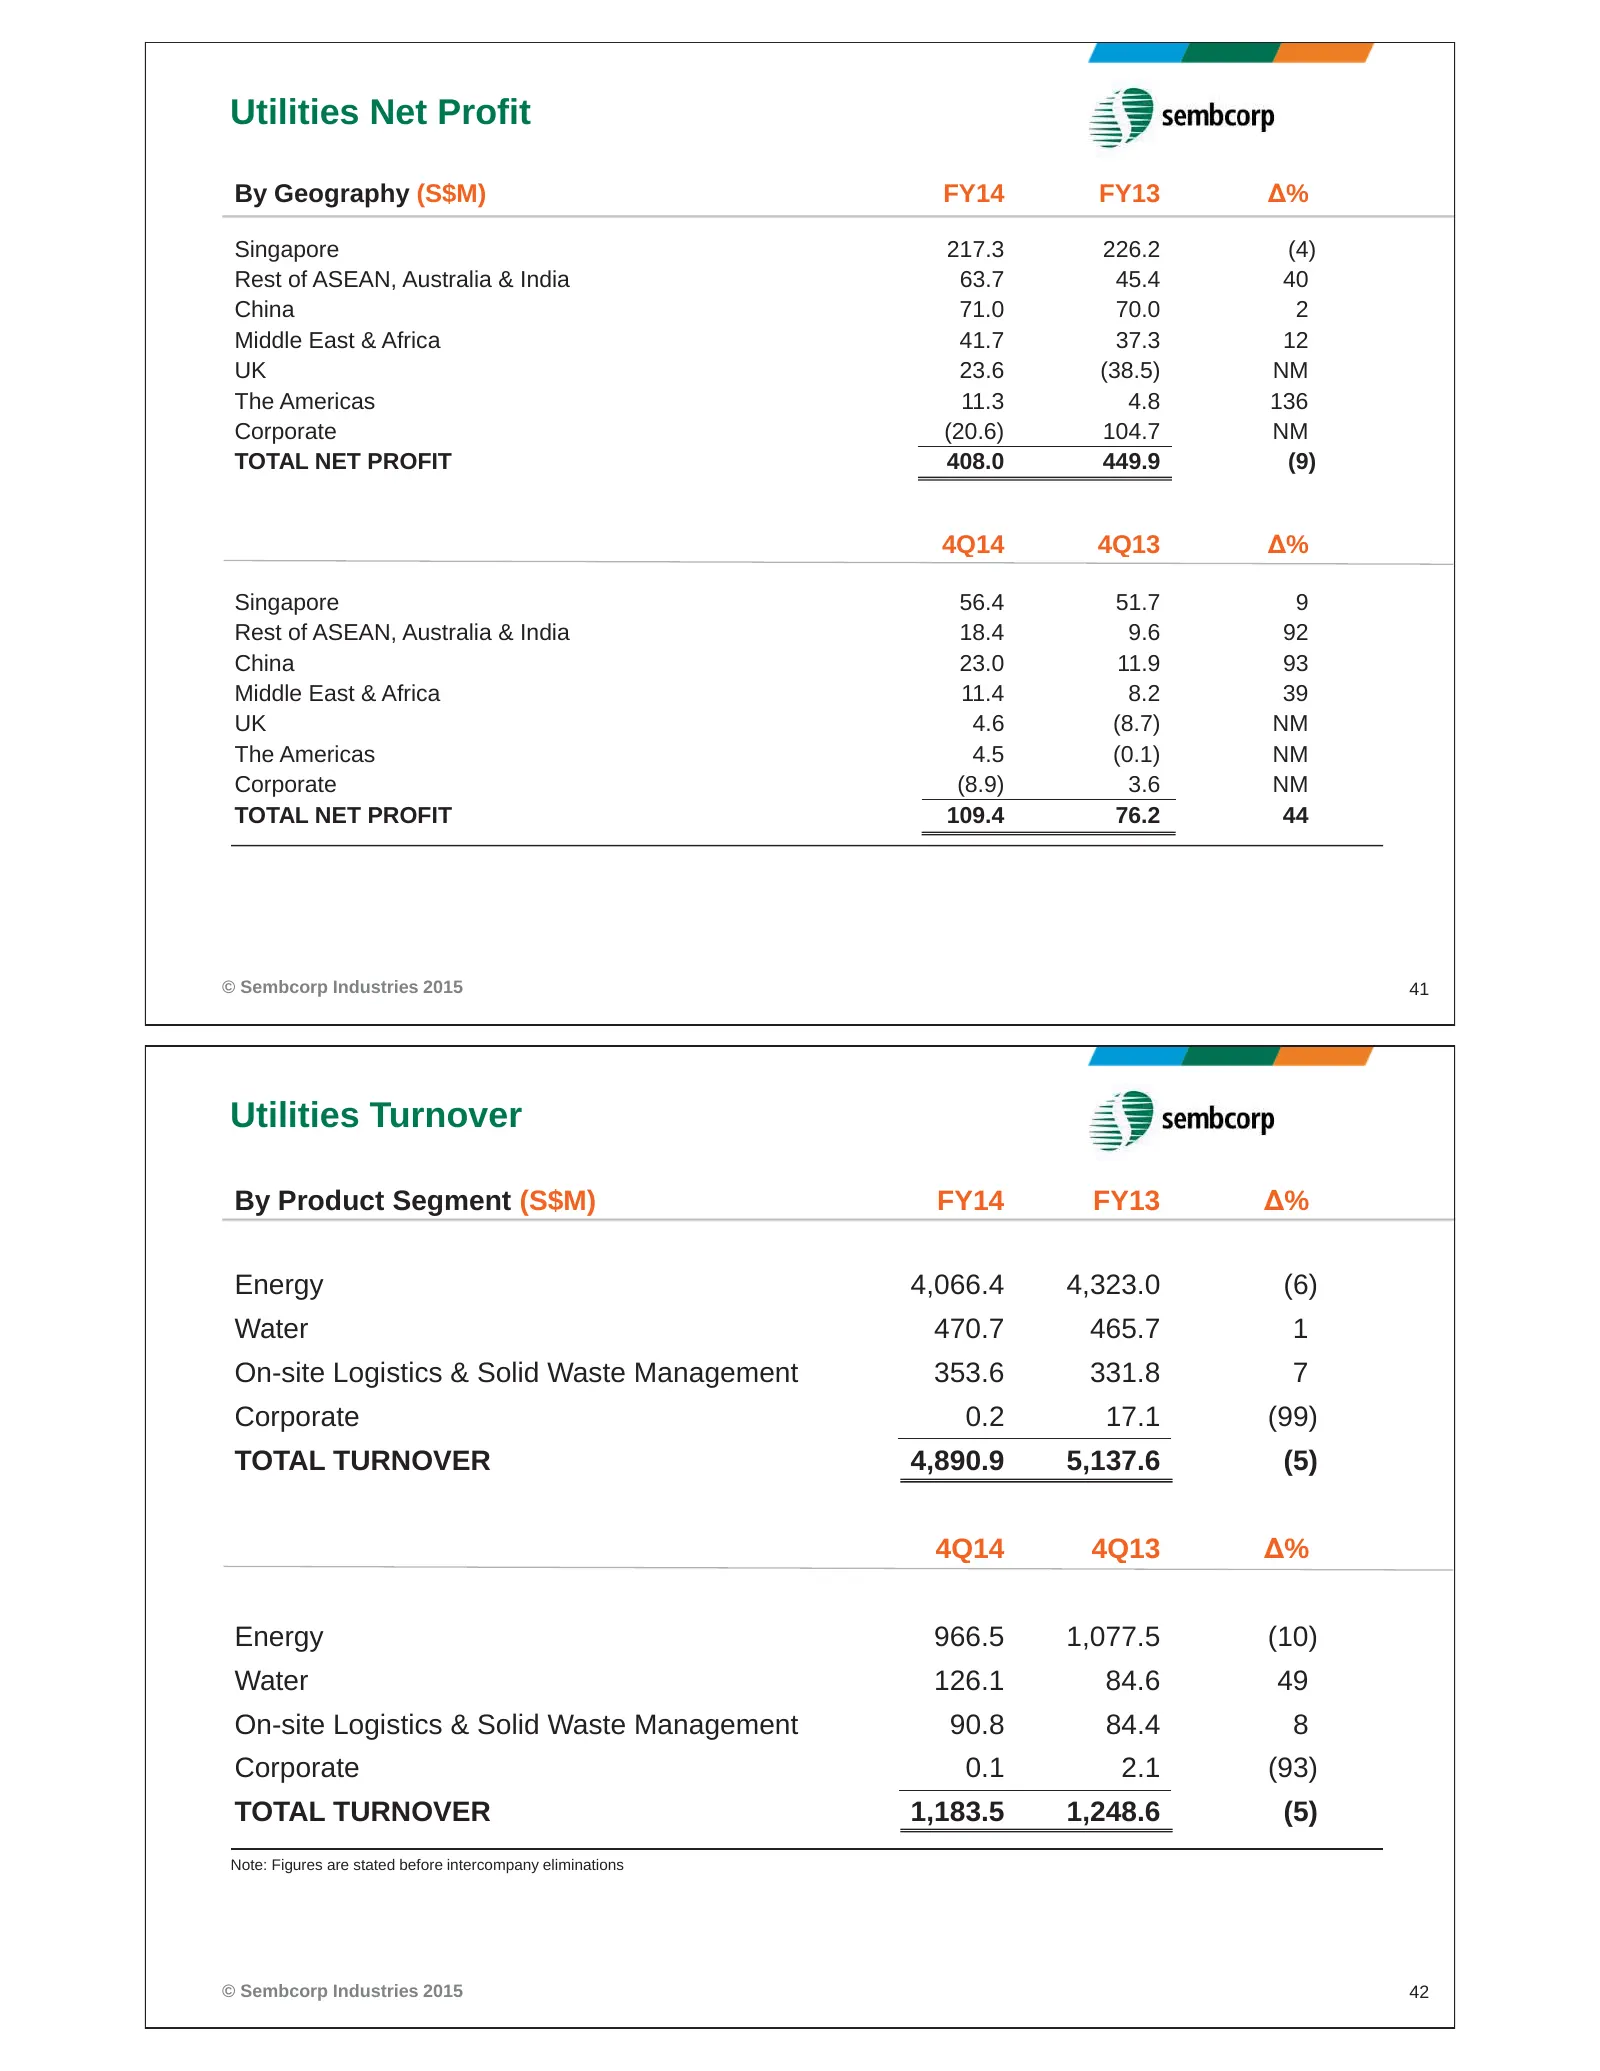
Utilities Turnover By Geography (S$M) FY14 FY13 Δ% Singapore 4,146.6 4,246.3 (2) Rest of ASEAN, Australia & India 5.2 11.2 (54) China 156.6 149.2 5 Middle East & Africa 99.9 229.4 (57) UK 435.8 439.0 (1) The Americas 46.6 45.4 3 Corporate 0.2 17.1 (99) TOTAL TURNOVER 4,890.9 5,137.6 (5) 4Q14 4Q13 Δ%
Slide 21: Utilities Net Profit; Utilities Turnover
Utilities Net Profit By Geography (S$M) FY14 FY13 Δ% Singapore 217.3 226.2 (4) Rest of ASEAN, Australia & India 63.7 45.4 40 China 71.0 70.0 2 Middle East & Africa 41.7 37.3 12 UK 23.6 (38.5) NM The Americas 11.3 4.8 136 Corporate (20.6) 104.7 NM TOTAL NET PROFIT 408.0 449.9 (9) 4Q14 4Q13 Δ% Singapo
Slide 22: Utilities Profit from Operations; Utilities Net Profit
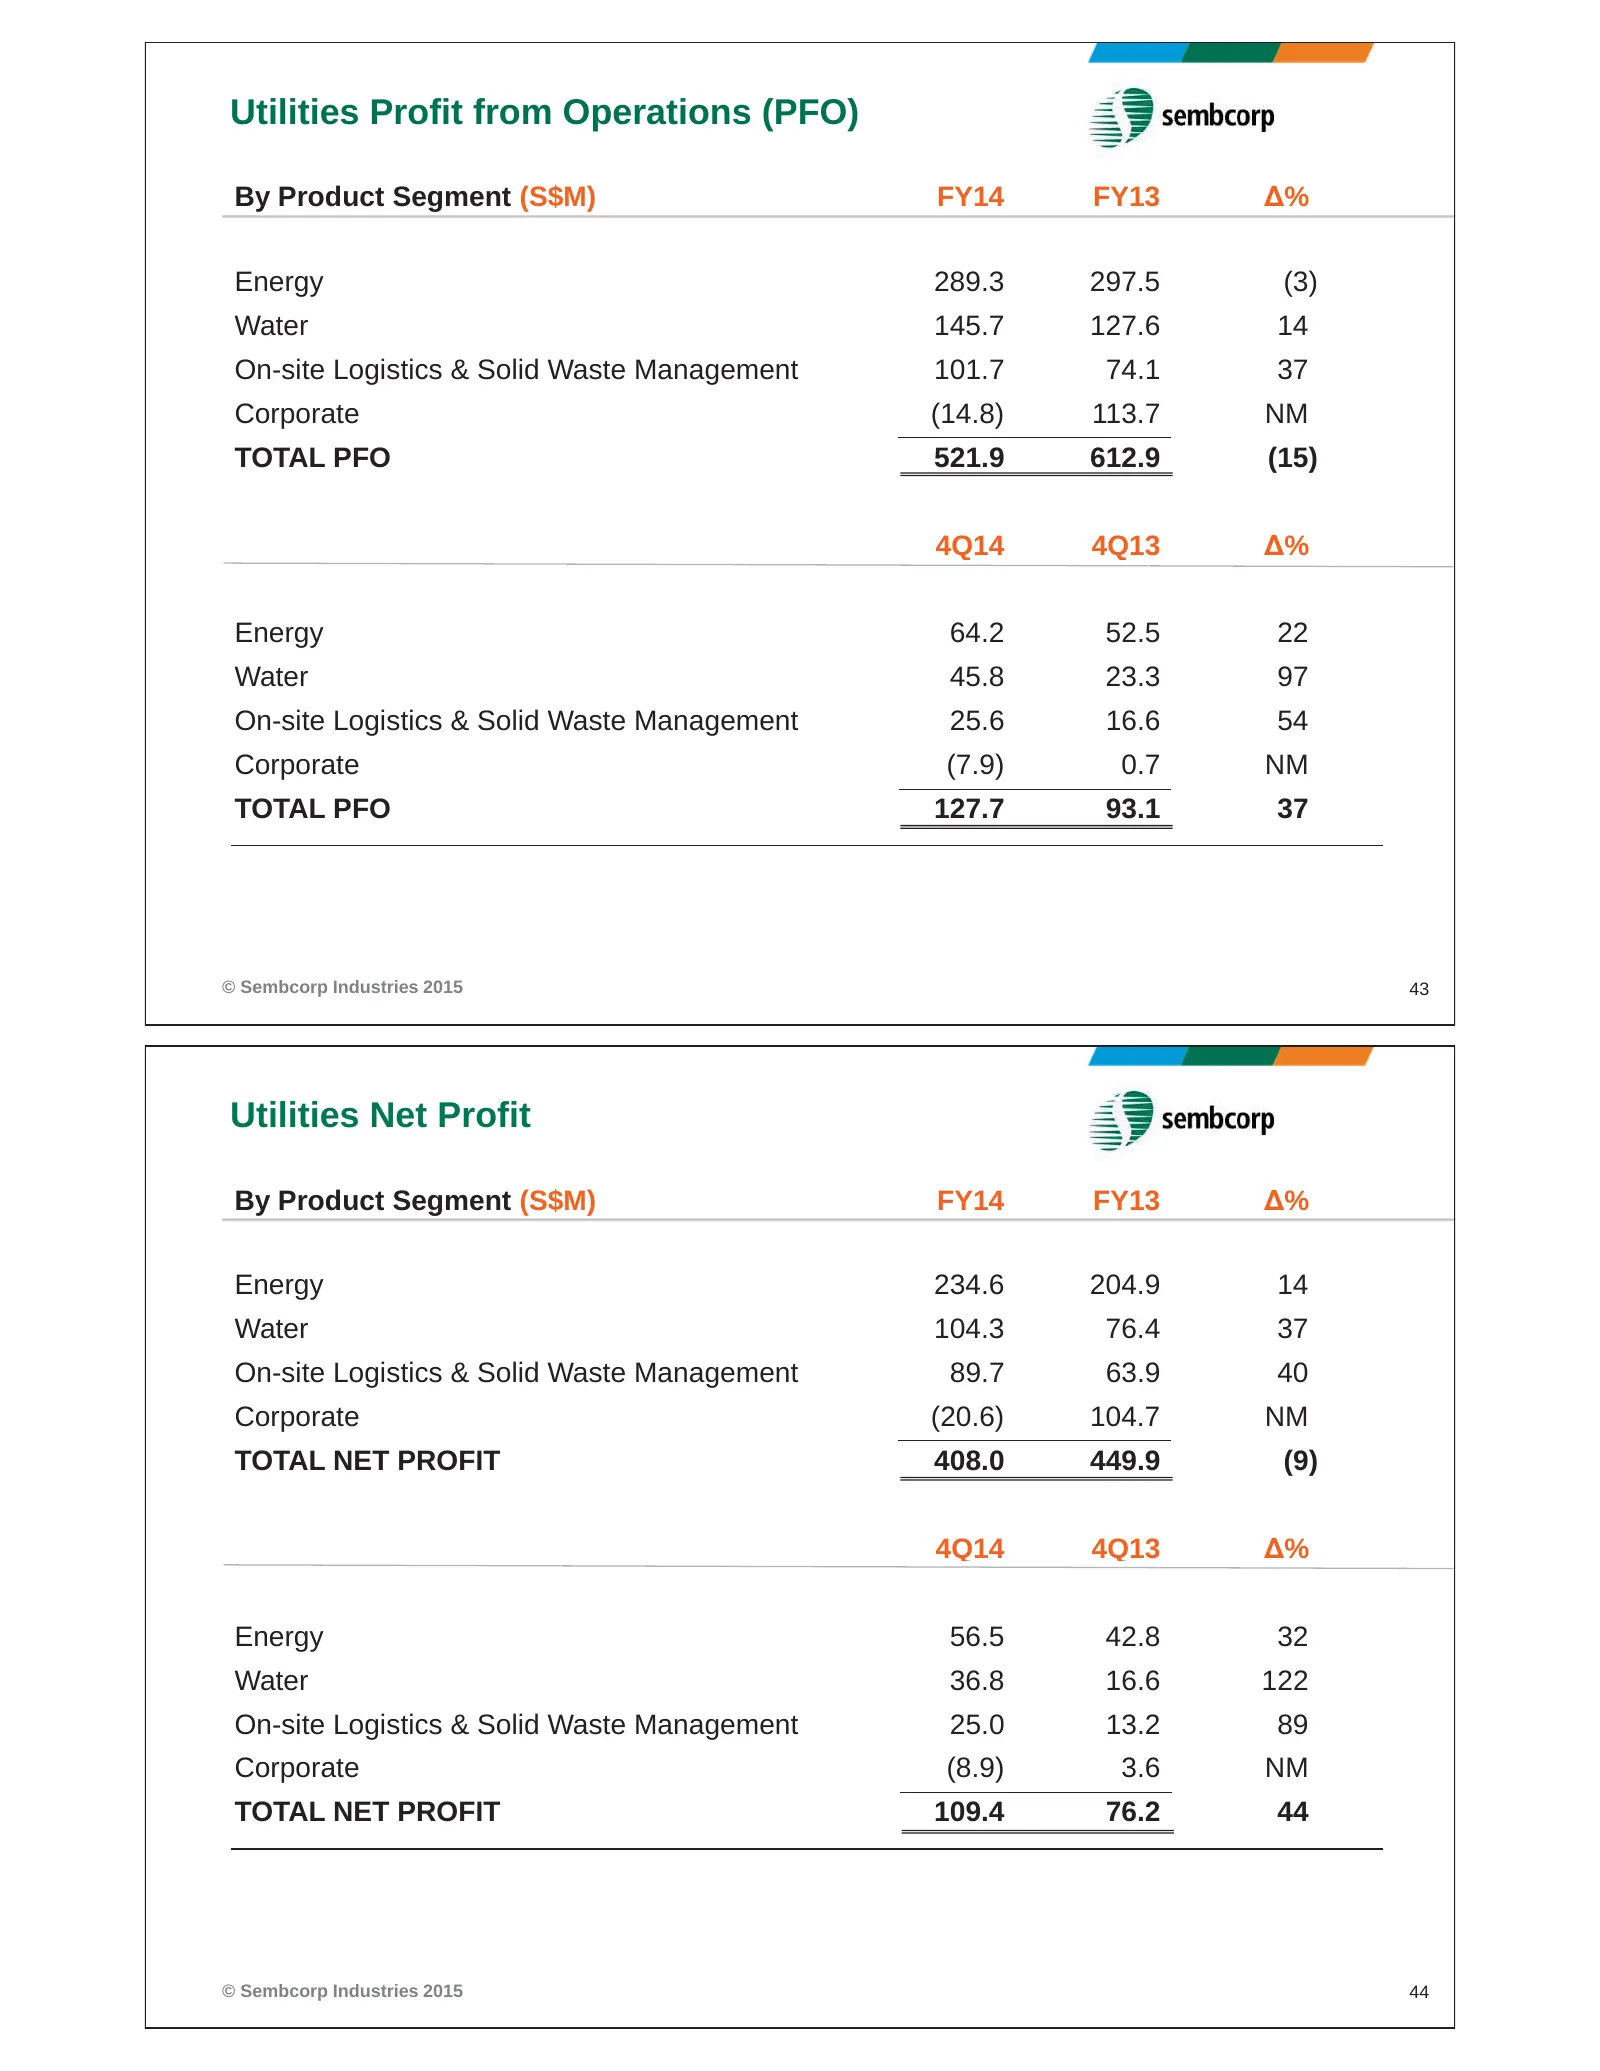
Utilities Profit from Operations (PFO) By Product Segment (S$M) FY14 FY13 Δ% Energy 289.3 297.5 (3) Water 145.7 127.6 14 On-site Logistics & Solid Waste Management 101.7 74.1 37 Corporate (14.8) 113.7 NM TOTAL PFO 521.9 612.9 (15) 4Q14 4Q13 Δ% Energy 64.2 52.5 22 Water 45.8 23.3 97 On-site Logistics
Source: Internet Archive copy of sembcorp.com
More decks from Sembcorp Industries Ltd.
 H1 2026 Earnings Presentation26 slides · Aug 13, 2026
 Investor Presentation (June 2026)52 slides · June 2026
 Shareholder Meeting (April 2026)11 slides · Apr 29, 2026
 FY2025 Earnings Presentation35 slides · Feb 25, 2026
 Merger or Acquisition (January 2026)13 slides · Jan 30, 2026
 Merger or Acquisition (December 2025)24 slides · Dec 11, 2025