ChampionX — Apergy — 2019 Credit Suisse Annual Energy Summit
29 slides from ChampionX's conference presentation, Feb 11, 2019
Slide 1: 2019 Credit Suisse Annual Energy Summit
2019 Credit Suisse Annual Energy Summit February 11-13, 2019 Copyright 2018 Apergy. All rights reserved.
Slide 2: Notices and Disclaimers
Notices and Disclaimers Forward-Looking Statements This investor presentation, and the related discussion, contains forward-looking statements within the meaning of Section 27A of the Securities Act of 1933, and Section 21E of the Securities Exchange Act of 1934, that are based on the beliefs and as
Slide 3: Apergy Overview
Apergy Overview . Leading onshore-focused equipment and digital technology provider to the upstream oil and gas industry . Most trusted brands recognized for quality, performance and customer-service . Highly engineered products, innovative technologies and digital solutions . Focused strategy and o
Slide 4: 2018 Financial Update
2018 Financial Update . We are updating our outlook for full year 2018: . Continue to expect full year 2018 revenue to increase approximately 20% from full year 2017 . Full year 2018 adjusted EBITDA expected to be between $294 and $297 million, from previous guidance of $289 to $294 million 1 . Stro
Slide 5: Apergy Leads Oilfield Products Segment in Customer Satisfaction
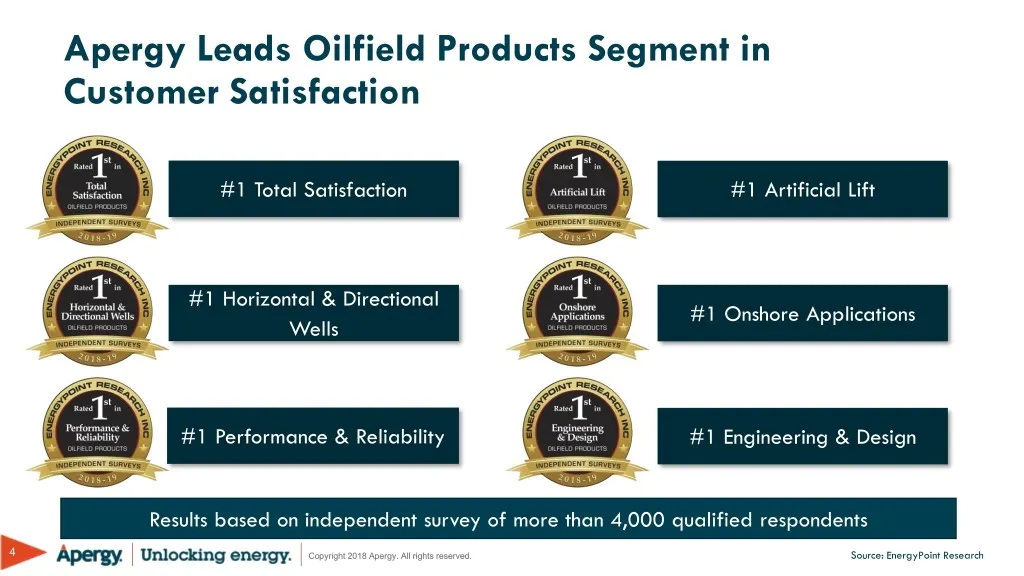
Apergy Leads Oilfield Products Segment in Customer Satisfaction #1 Total Satisfaction #1 Artificial Lift #1 Horizontal & Directional #1 Onshore Applications Wells #1 Performance & Reliability #1 Engineering & Design Results based on independent survey of more than 4,000 qualified respondents 4 Copyr
Slide 6: Successfully Reached Milestone as a New Public Company
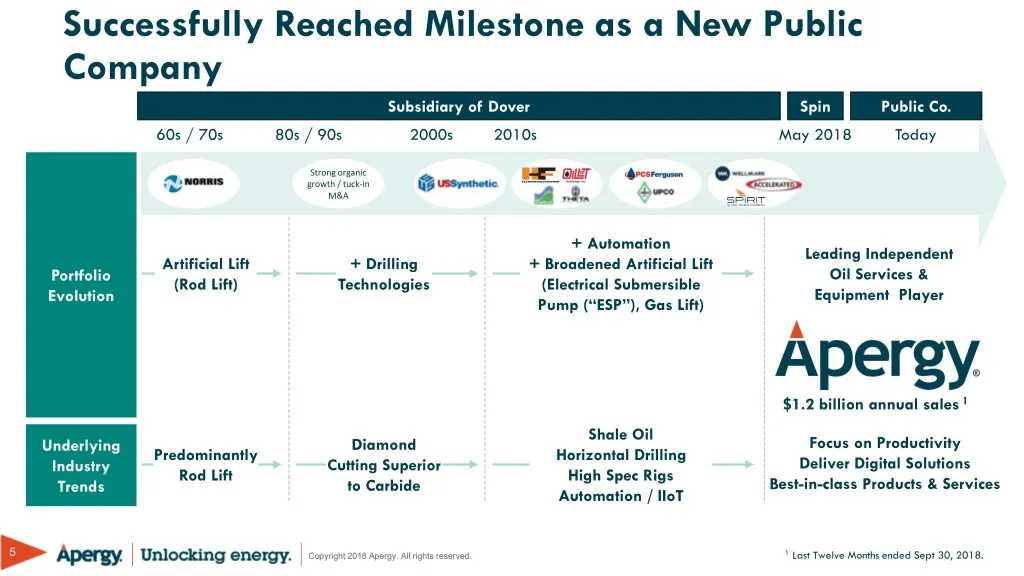
Successfully Reached Milestone as a New Public Company Subsidiary of Dover Spin Public Co. 60s / 70s 80s / 90s 2000s 2010s May 2018 Today Strong organic growth / tuck-in M&A + Automation Leading Independent Artificial Lift + Drilling + Broadened Artificial Lift Portfolio Oil Services & (Rod Lift) Te
Slide 7: Accomplishments Since Our Spin
Accomplishments Since Our Spin Consistent, strong financial performance – We expect 2018 adjusted EBITDA of $294 to $297 million versus initial guidance of $280 million Introduced our strategic vision and operating philosophy which is engrained in the Apergy culture – Culture builds on our manuf
Slide 8: Apergy is Present Across Production & Automation and Drilling Technologies
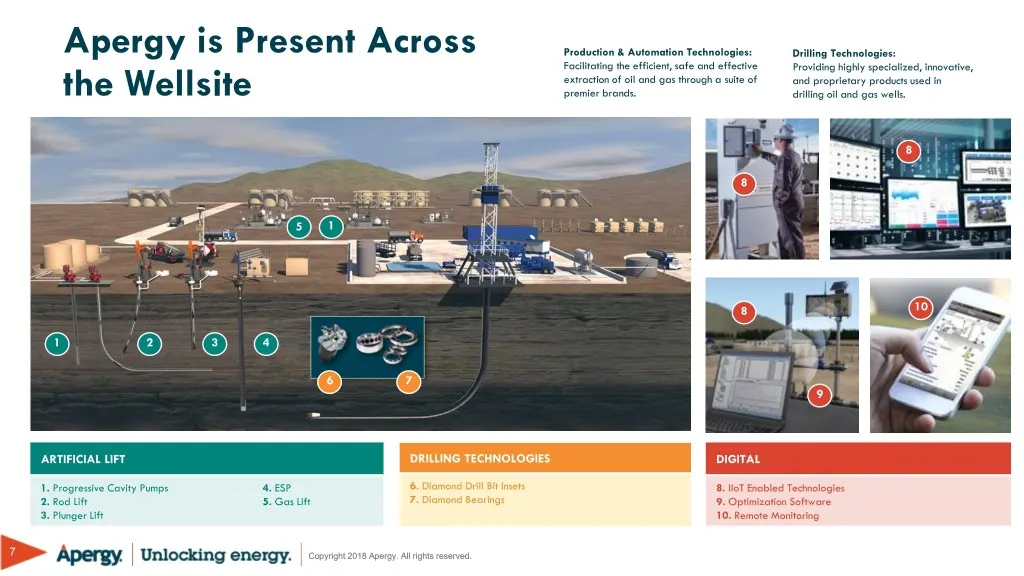
Apergy is Present Across Production & Automation Technologies: Drilling Technologies: Facilitating the efficient, safe and effective Providing highly specialized, innovative, extraction of oil and gas through a suite of and proprietary products used in the Wellsite premier brands. drilling oil and g
Slide 9: Portfolio Profile
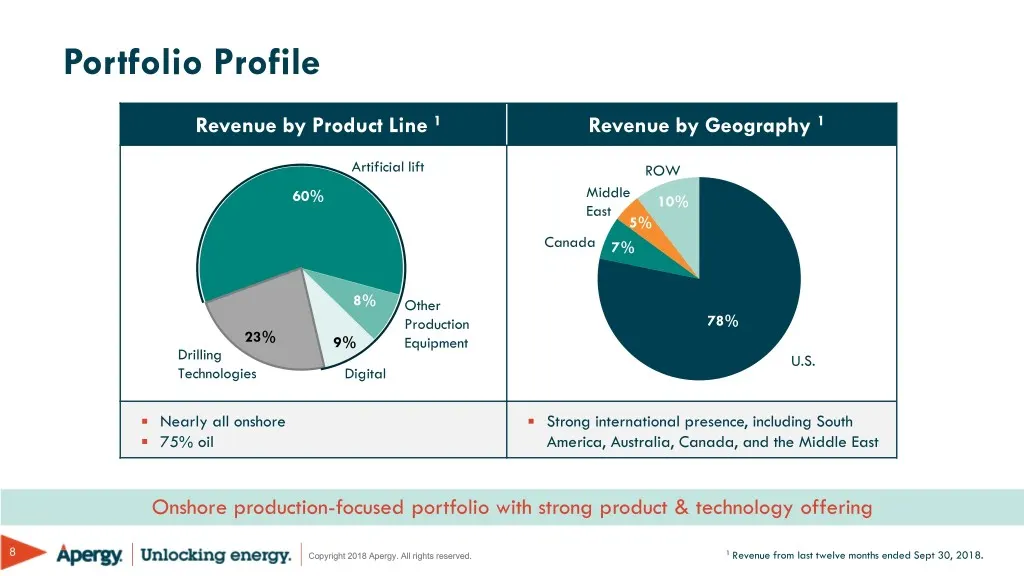
Portfolio Profile Revenue by Product Line 1 Revenue by Geography 1 Artificial lift ROW Middle 60% 10% East 5% Canada 7% 8% Other Production 78% 23% 9% Equipment Drilling U.S. Technologies Digital US . Nearly all onshore . Strong international presence, including South . 75% oil America, Australia, C
Slide 10: Drilling Technologies
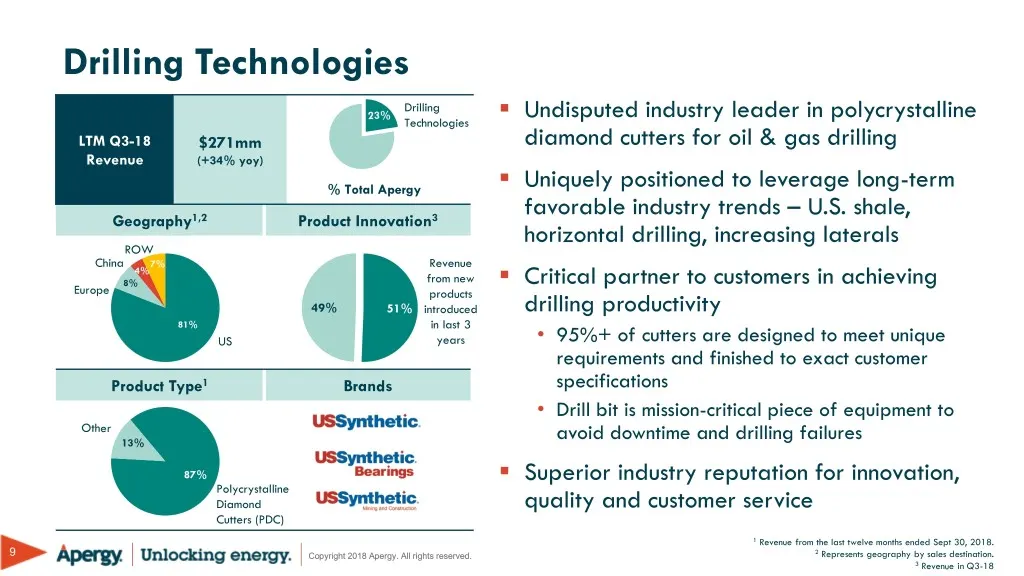
Drilling Technologies Drilling . 23% Undisputed industry leader in polycrystalline Technologies LTM Q3-18 $271mm diamond cutters for oil & gas drilling Revenue (+34% yoy) . % Total Apergy Uniquely positioned to leverage long-term favorable industry trends – U.S. shale, Geography1,2 Product Innovatio
Slide 11: Production & Automation Technologies
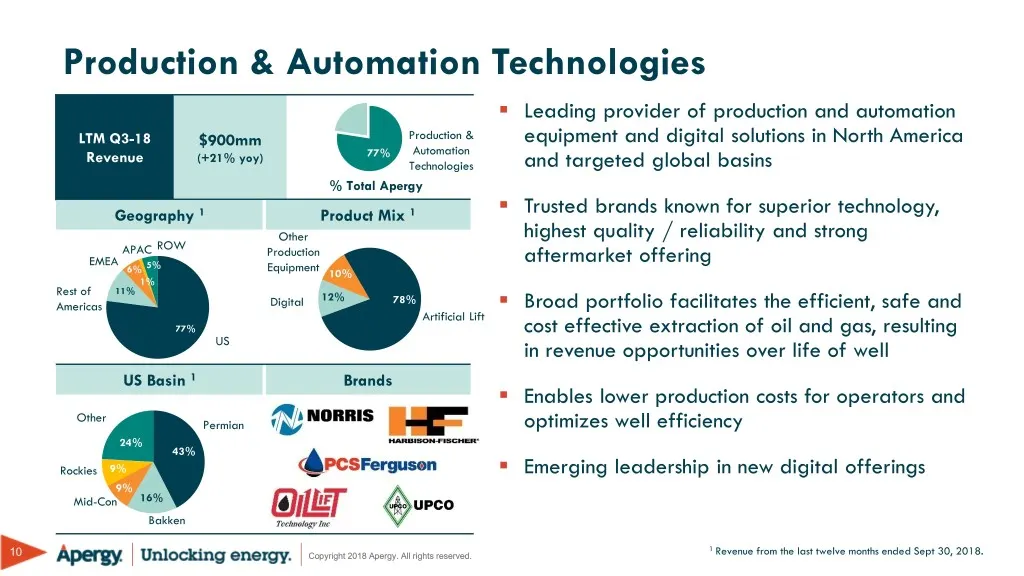
Production & Automation Technologies . Leading provider of production and automation LTM Q3-18 $900mm Production & equipment and digital solutions in North America Automation Revenue (+21% yoy) 77% Technologies and targeted global basins % Total Apergy . Geography 1 Product Mix 1 Trusted brands know
Slide 12: Positioned to Benefit from Growth Trends in Artificial Lift
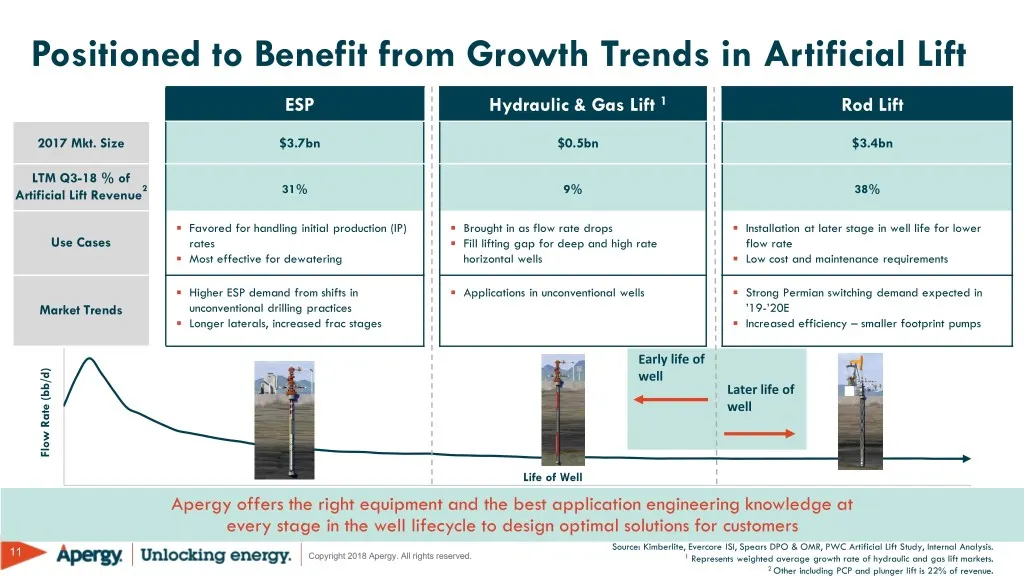
Positioned to Benefit from Growth Trends in Artificial Lift ESP Hydraulic & Gas Lift 1 Rod Lift 2017 Mkt. Size $3.7bn $0.5bn $3.4bn LTM Q3-18 % of Artificial Lift Revenue2 31% 9% 38% . Favored for handling initial production (IP) . Brought in as flow rate drops . Installation at later stage in well
Slide 13: Leader in Digital Technologies: Monitor, Analyze, Optimize
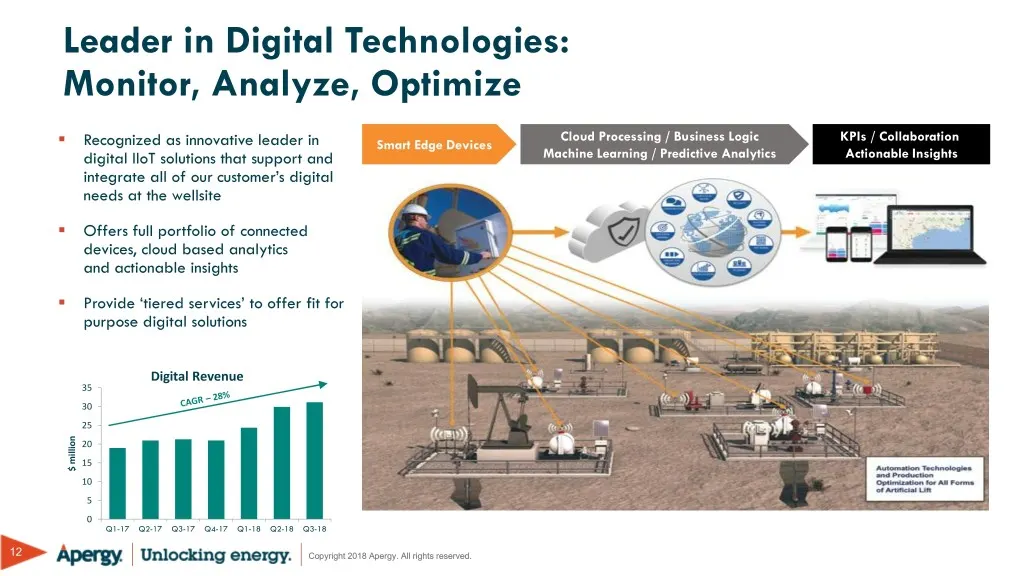
Leader in Digital Technologies: Monitor, Analyze, Optimize . Cloud Processing / Business Logic KPIs / Collaboration Recognized as innovative leader in Smart Edge Devices digital IIoT solutions that support and Machine Learning / Predictive Analytics Actionable Insights integrate all of our customer’
Slide 14: How Apergy Wins
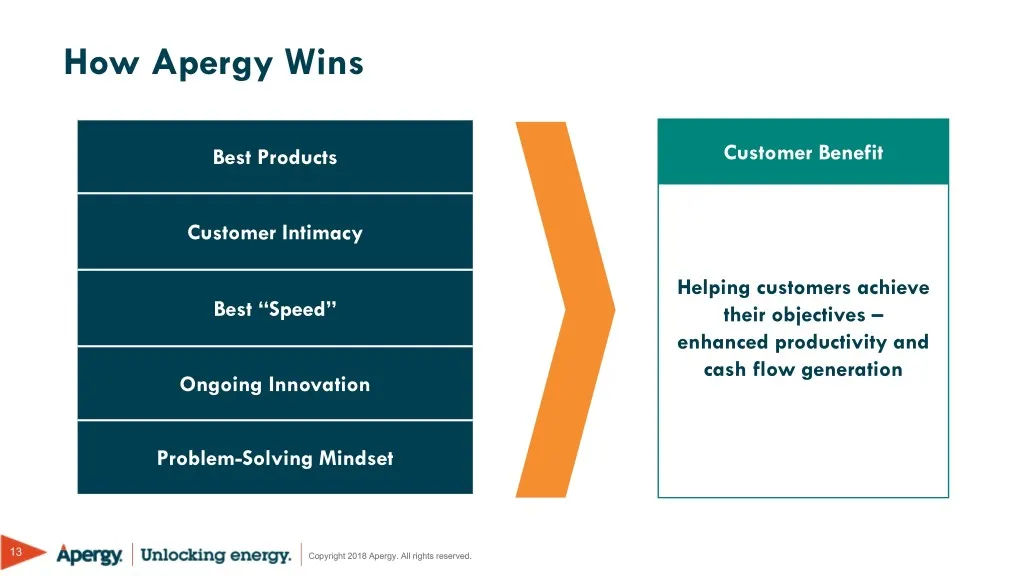
How Apergy Wins Best Products Customer Benefit Customer Intimacy Helping customers achieve Best “Speed” their objectives – enhanced productivity and cash flow generation Ongoing Innovation Problem-Solving Mindset 13 Copyright 2018 Apergy. All rights reserved.
Slide 15: Growth Accelerators That Drive Above Market Growth
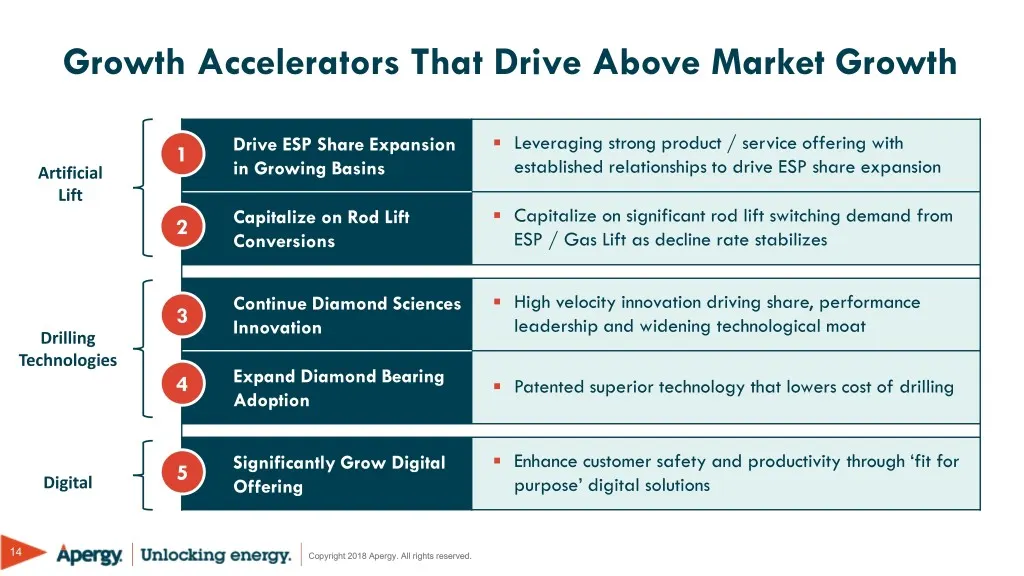
Growth Accelerators That Drive Above Market Growth . Leveraging strong product / service offering with 1 Drive ESP Share Expansion Artificial in Growing Basins established relationships to drive ESP share expansion Lift . Capitalize on significant rod lift switching demand from 2 Capitalize on Rod L
Slide 16: ESP Momentum in the Permian Basin
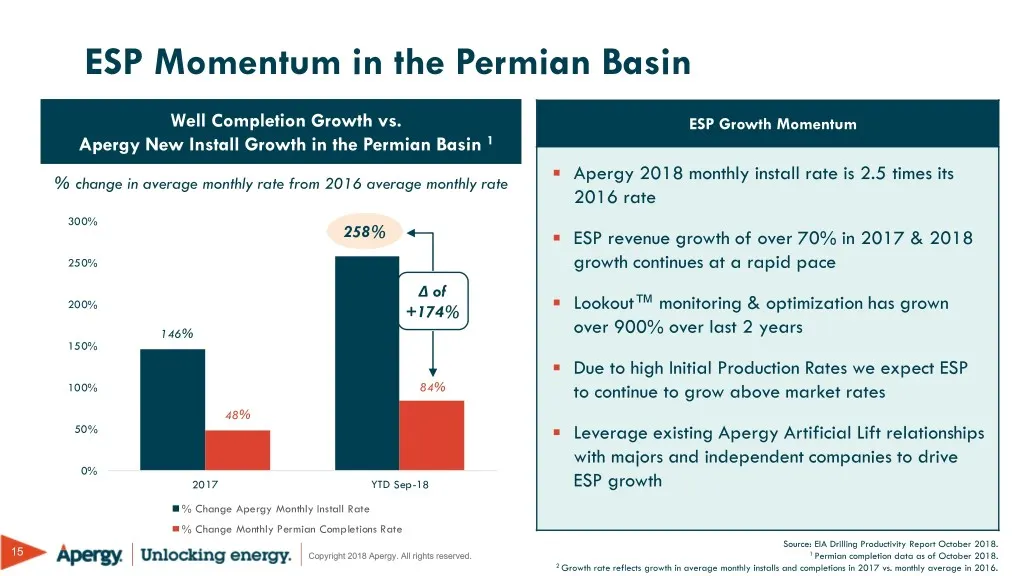
ESP Momentum in the Permian Basin Well Completion Growth vs. ESP Growth Momentum Apergy New Install Growth in the Permian Basin 1 . Apergy 2018 monthly install rate is 2.5 times its % change in average monthly rate from 2016 average monthly rate 2016 rate 300% 258% . ESP revenue growth of over 70% i
Slide 17: Leading Innovation in Diamond Sciences
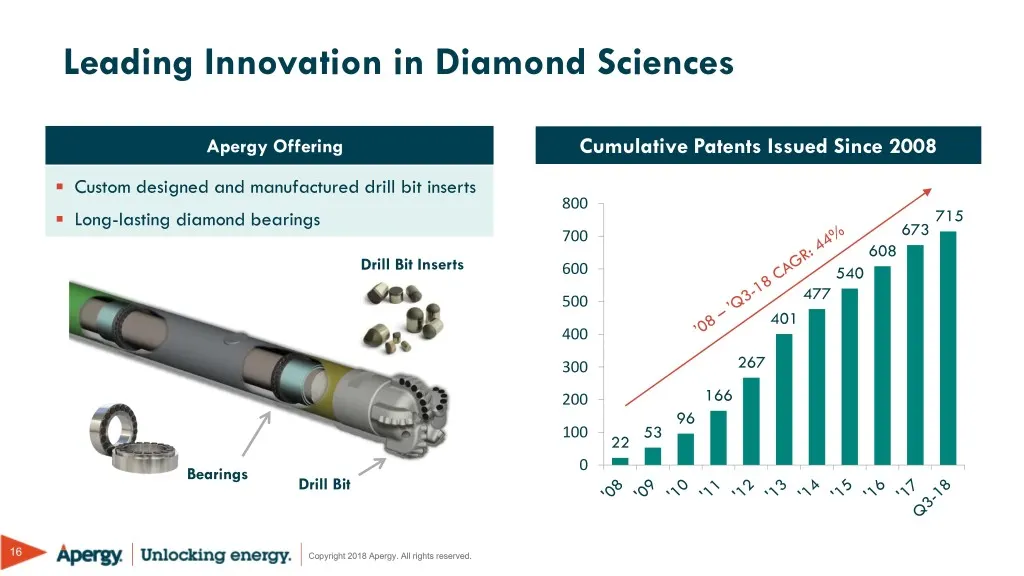
Leading Innovation in Diamond Sciences Apergy Offering Cumulative Patents Issued Since 2008 . Custom designed and manufactured drill bit inserts 800 . Long-lasting diamond bearings 715 700 673 608 Drill Bit Inserts 600 540 477 500 401 400 300 267 200 166 96 100 53 22 Bearings 0 Drill Bit 16 Copyrigh
Slide 18: Growth Momentum in Diamond Bearings
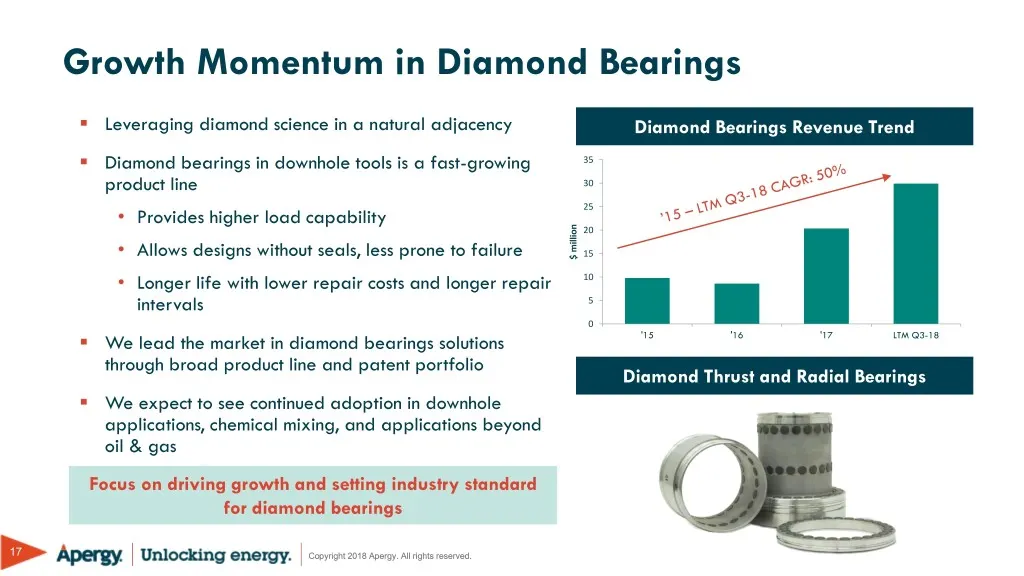
Growth Momentum in Diamond Bearings . Leveraging diamond science in a natural adjacency Diamond Bearings Revenue Trend . Diamond bearings in downhole tools is a fast-growing 35 product line 30 25 • Provides higher load capability 20 Allows designs without seals, less prone to failure 15 • $ million
Slide 19: Broad Portfolio of Digital Products & Solutions
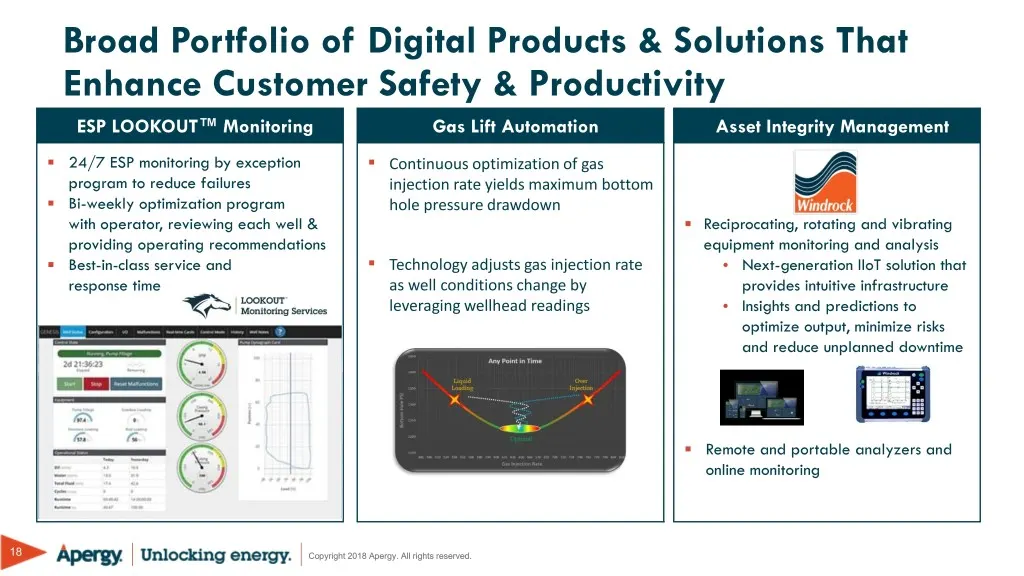
Broad Portfolio of Digital Products & Solutions That Enhance Customer Safety & Productivity ESP LOOKOUT™ Monitoring Gas Lift Automation Asset Integrity Management . . 24/7 ESP monitoring by exception Continuous optimization of gas program to reduce failures injection rate yields maximum bottom . Bi-

Slide 20: Financial Overview
Financial Overview Copyright 2018 Apergy. All rights reserved.
Slide 21: Strong Performance Through the Cycle
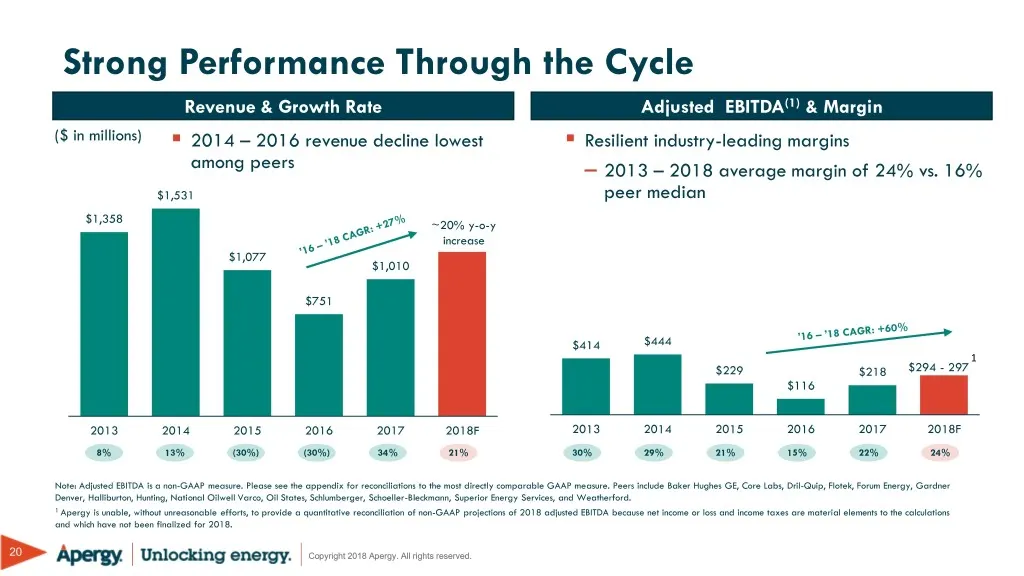
Strong Performance Through the Cycle Revenue & Growth Rate Adjusted EBITDA(1) & Margin ($ in millions) . 2014 – 2016 revenue decline lowest . Resilient industry-leading margins among peers – 2013 – 2018 average margin of 24% vs. 16% $1,531 peer median $1,358 ~20% y-o-y increase $1,077 $1,010 $751 $4
Slide 22: Efficient Capital Structure and Capital Allocation
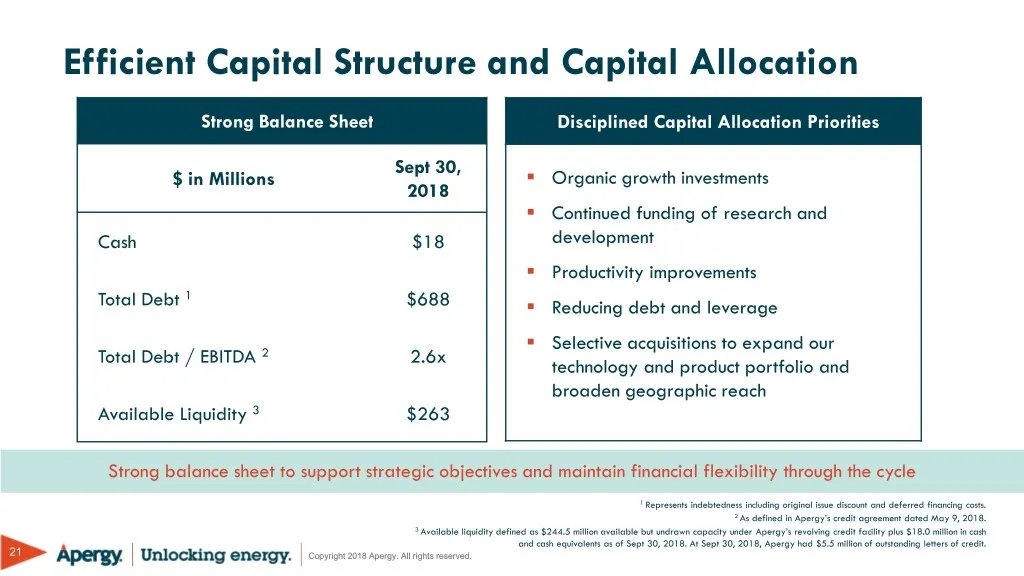
Efficient Capital Structure and Capital Allocation Strong Balance Sheet Disciplined Capital Allocation Priorities Sept 30, $ in Millions . Organic growth investments 2018 . Continued funding of research and Cash $18 development . Productivity improvements 1 Total Debt $688 . Reducing debt and levera
Slide 23: Strong Investment Thesis
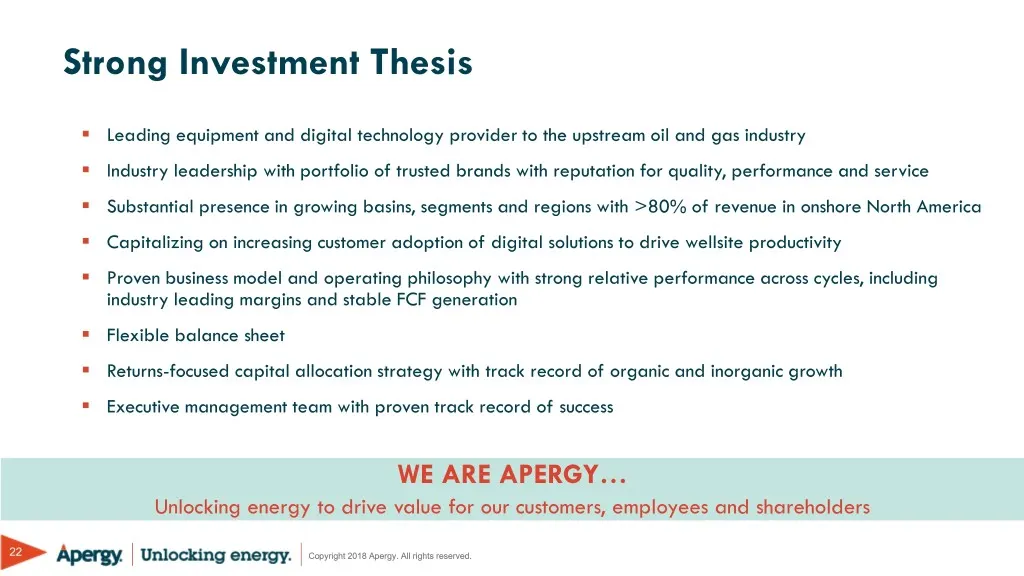
Strong Investment Thesis . Leading equipment and digital technology provider to the upstream oil and gas industry . Industry leadership with portfolio of trusted brands with reputation for quality, performance and service . Substantial presence in growing basins, segments and regions with >80% of re

Slide 24: Appendix
Appendix Copyright 2018 Apergy. All rights reserved.
Slide 25: Summary Segment Financial Metrics
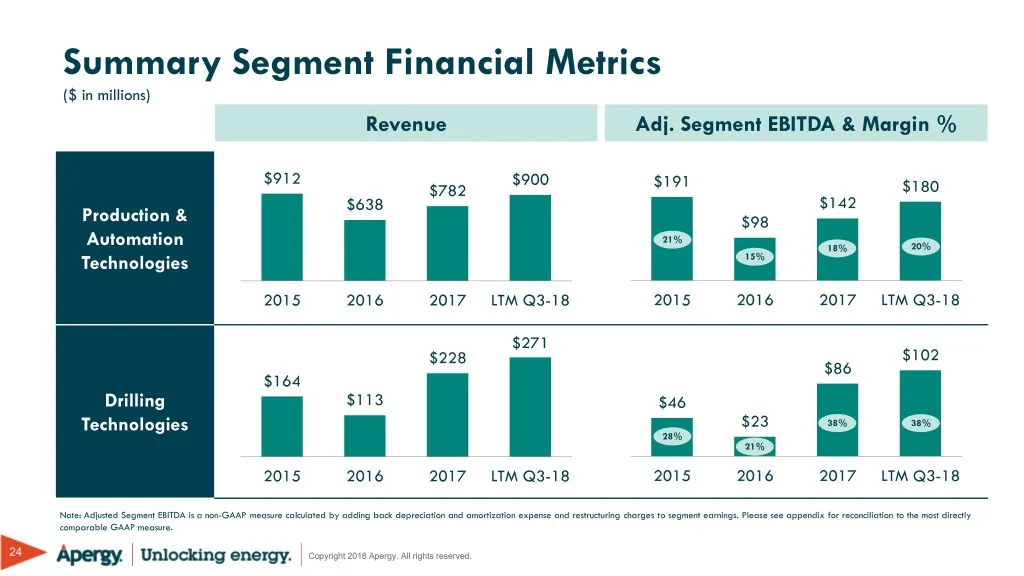
Summary Segment Financial Metrics ($ in millions) Revenue Adj. Segment EBITDA & Margin % $912 $900 $191 $782 $180 $638 $142 Production & $98 21% Automation 18% 20% Technologies 15% 2015 2016 2017 LTM Q3-18 2015 2016 2017 LTM Q3-18 $271 $228 $102 $86 $164 Drilling $113 $46 Technologies $23 38% 38% 28
Slide 26: Reconciliation from Net Income to Adjusted EBITDA
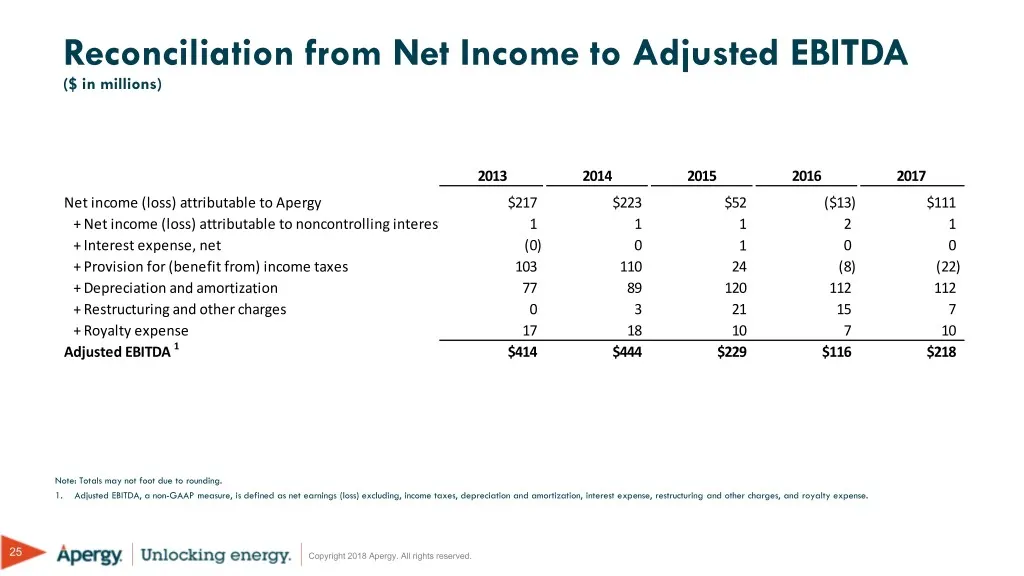
Reconciliation from Net Income to Adjusted EBITDA ($ in millions) 2013 2014 2015 2016 2017 Net income (loss) attributable to Apergy $217 $223 $52 ($13) $111 + Net income (loss) attributable to noncontrolling interest 1 1 1 2 1 + Interest expense, net (0) 0 1 0 0 + Provision for (benefit from) income
Slide 27: Reconciliation from Net Income to Adjusted EBITDA (Quarterly)
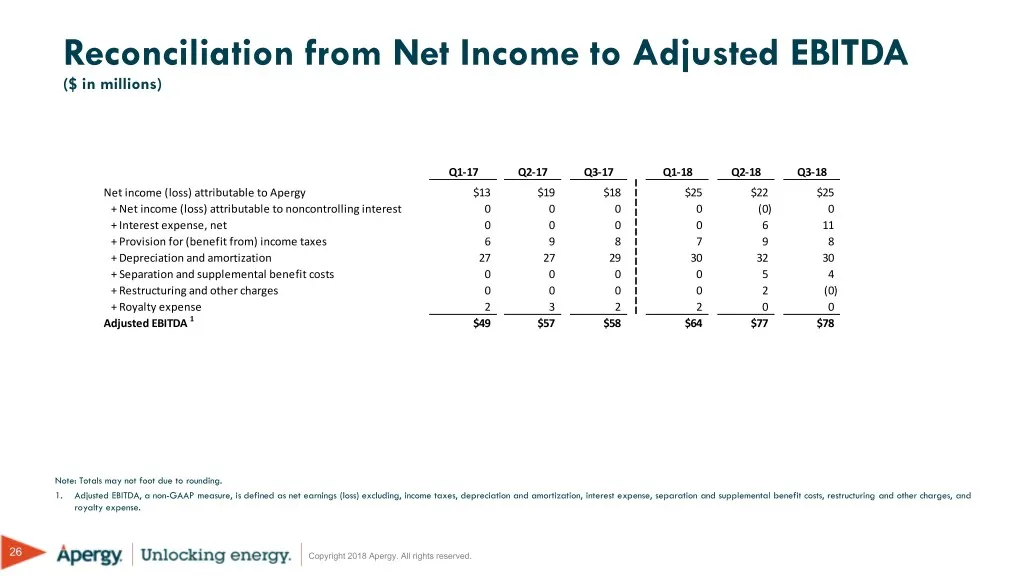
Reconciliation from Net Income to Adjusted EBITDA ($ in millions) Q1-17 Q2-17 Q3-17 Q1-18 Q2-18 Q3-18 Net income (loss) attributable to Apergy $13 $19 $18 $25 $22 $25 + Net income (loss) attributable to noncontrolling interest 0 0 0 0 (0) 0 + Interest expense, net 0 0 0 0 6 11 + Provision for (benef
Slide 28: Reconciliation from Segment Earnings to Adj. Segment EBITDA
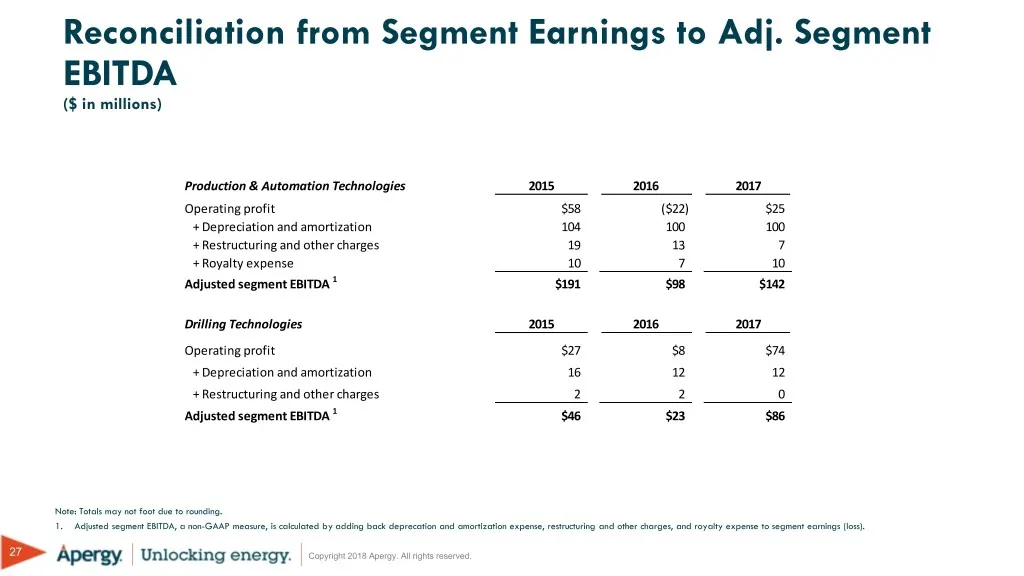
Reconciliation from Segment Earnings to Adj. Segment EBITDA ($ in millions) Production & Automation Technologies 2015 2016 2017 Operating profit $58 ($22) $25 + Depreciation and amortization 104 100 100 + Restructuring and other charges 19 13 7 + Royalty expense 10 7 10 Adjusted segment EBITDA 1 $19
Slide 29: Reconciliation from Segment Earnings to Adj. Segment EBITDA (Quarterly)
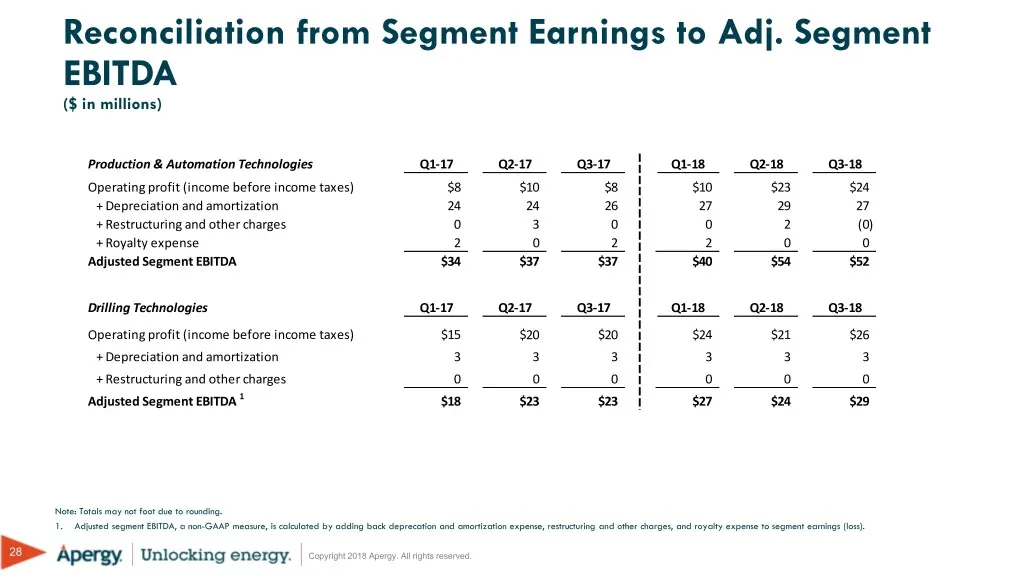
Reconciliation from Segment Earnings to Adj. Segment EBITDA ($ in millions) Production & Automation Technologies Q1-17 Q2-17 Q3-17 Q1-18 Q2-18 Q3-18 Operating profit (income before income taxes) $8 $10 $8 $10 $23 $24 + Depreciation and amortization 24 24 26 27 29 27 + Restructuring and other charges
Source: SEC EDGAR · 8-K filed Feb 11, 2019
More decks from ChampionX Corporation
 Merger or Acquisition (June 2024)7 slides · Jun 17, 2024
 Merger or Acquisition (April 2024)9 slides · Apr 4, 2024
 Merger or Acquisition (April 2024)14 slides · Apr 4, 2024
 Merger or Acquisition (April 2024)9 slides · Apr 2, 2024
 Investor Day (March 2023)111 slides · Mar 7, 2023
 Simmons Energy 21st Annual Energy Conference (March 2021)26 slides · Mar 22, 2021