Republic Bancorp, Inc. · NASDAQ:RBCAA
Republic Bancorp — Community Bank Investor Conference 2010
25 slides from Republic Bancorp's conference presentation, Jul 26, 2010
Slide 1: Community Bank Investor Conference
Tuesday, July 27, 2010 Community Bank Investor Conference REPUBLIC BANCORPTM
Slide 2: Safe Harbor
Safe Harbor During the course of this presentation, we will be providing you with a discussion of some of the factors we currently anticipate may influence the future results of Republic Bancorp, Inc.(“Republic” or the “Company”),as well as certain financial projections. We want to emphasize that th
Slide 3: Steve Trager, President and Chief Executive Officer
Steve Trager President and Chief Executive Officer
Slide 4: Company Profile
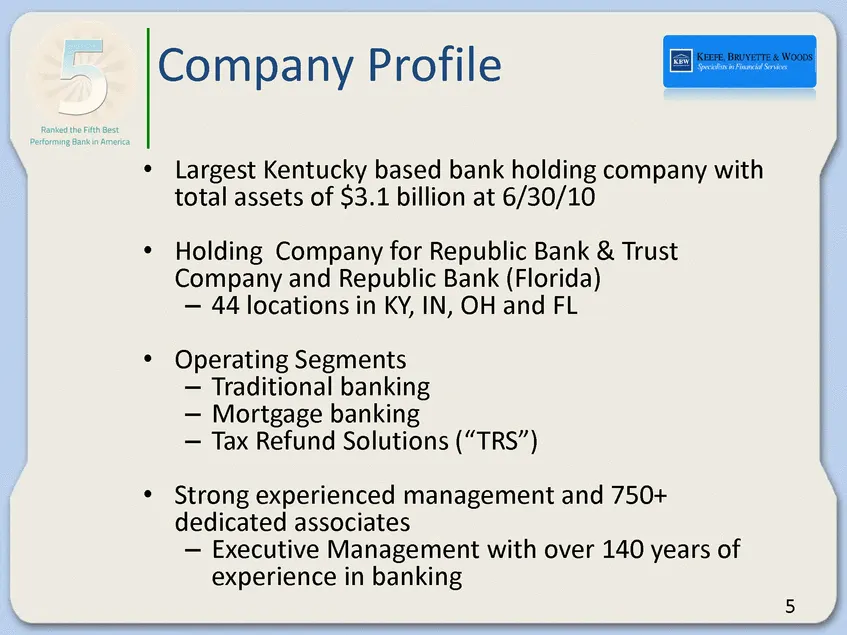
Company Profile • Largest Kentucky based bank holding company with total assets of $3.1 billion at 6/30/10 • Holding Company for Republic Bank & Trust Company and Republic Bank (Florida) – 44 locations in KY, IN, OH and FL • Operating Segments –Traditional banking – Mortgage banking – Tax Refund Sol
Slide 5: Banking Market Overview
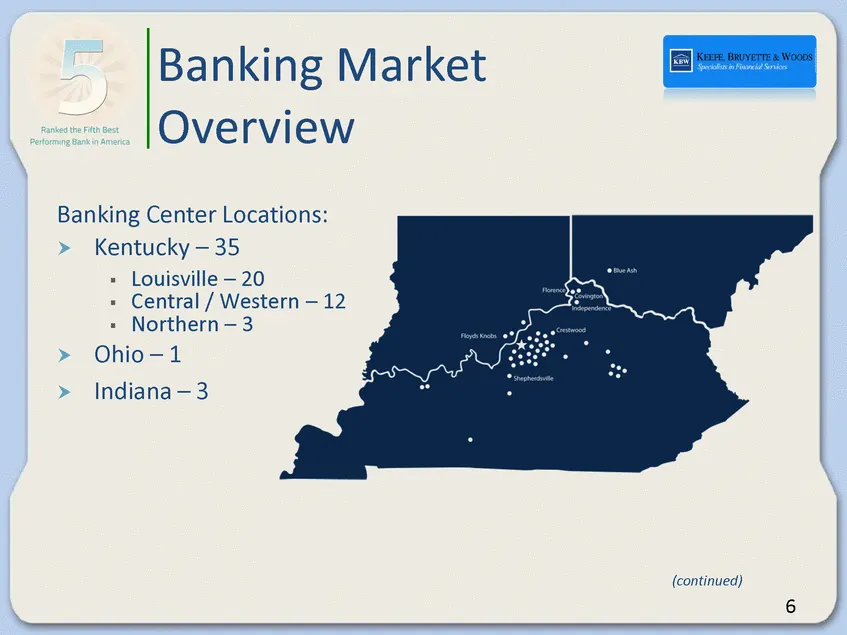
Banking Market Overview Banking Center Locations: .Kentucky – 35 Louisville – 20 Central / Western – 12 Northern – 3 Ohio – 1 Indiana – 3 (continued)
Slide 6: Banking Market Overview: Florida
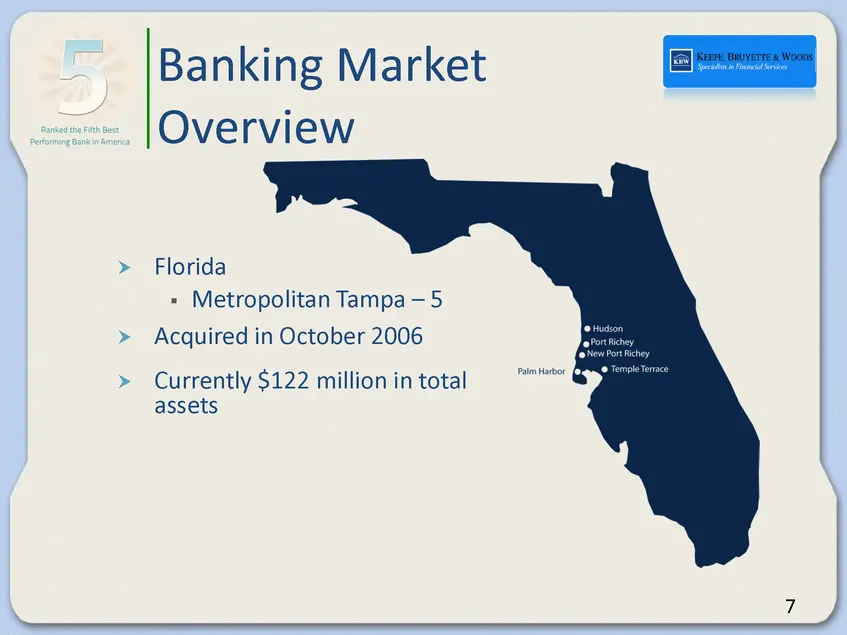
Banking Market Overview Florida Metropolitan Tampa – 5 Acquired in October 2006 Currently $122 million in total assets
Slide 7: Highlights Six Months ended June 30, 2010
Highlights Six Months ended June 30, 2010
Slide 8: Highlights YTD – June 30, 2010
Highlights YTD – June 30, 2010 • Total net income of $53.0 million, a 63% increase over first six months of 2009 • Return On Average Assets (“ROA”) of 2.80% • Return On Average Equity (“ROE”) of 30.15% • Core Banking low cost deposit balances increased $105 million • Traditional Bank Net Interest Ma
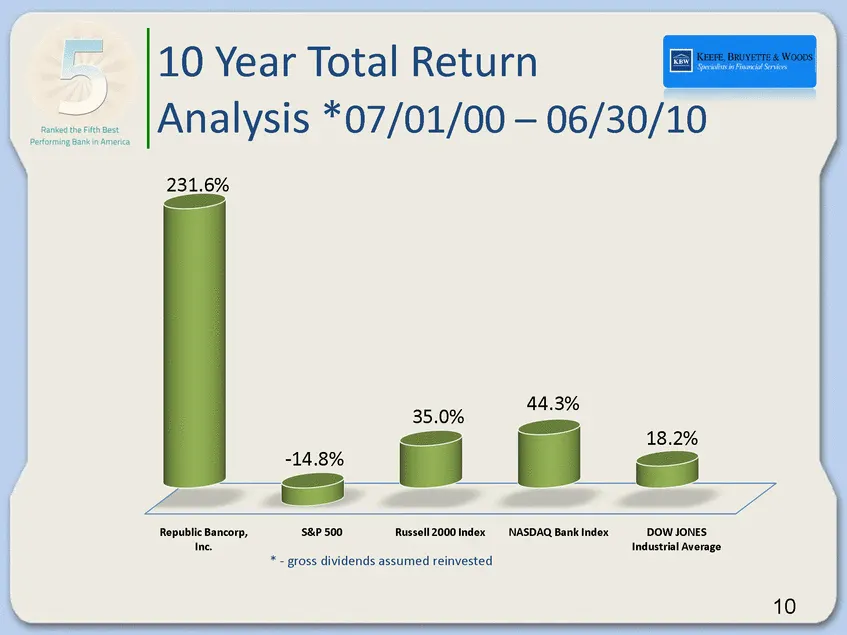
Slide 9: 10 Year Total Return Analysis
10 Year Total Return Analysis *07/01/00 – 06/30/10 * - gross dividends assumed reinvested Republic Bancorp, Inc. S&P 500 Russell 2000 Index NASDAQ Bank Index DOW JONES Industrial Average 231.6% -14.8% 35.0% 44.3% 18.2%
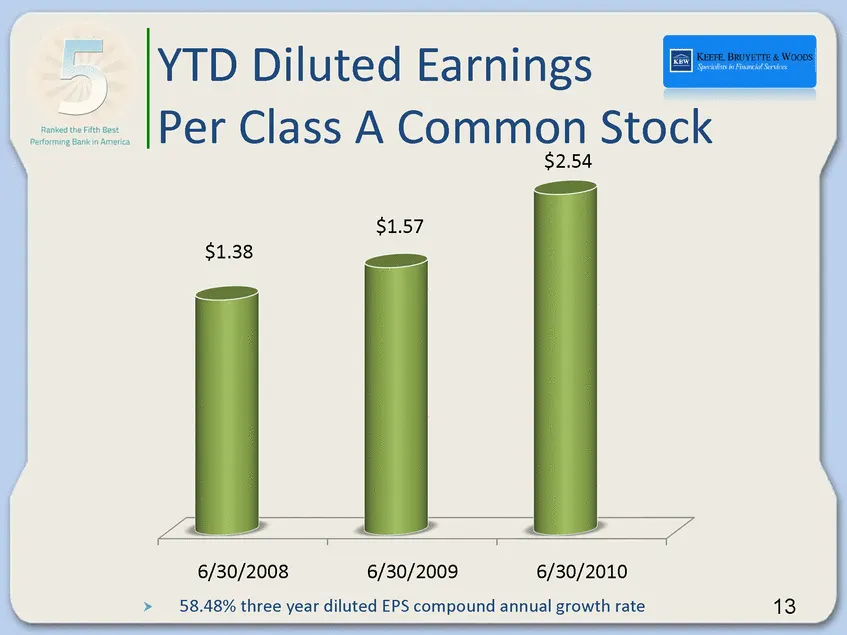
Slide 10: YTD Diluted Earnings Per Class A Common Stock
6/30/2008 6/30/2009 6/30/2010 $1.38 $1.57 $2.54 YTD Diluted Earnings Per Class A Common Stock 58.48% three year diluted EPS compound annual growth rate

Slide 11: Balance Sheet
| Balance Sheet
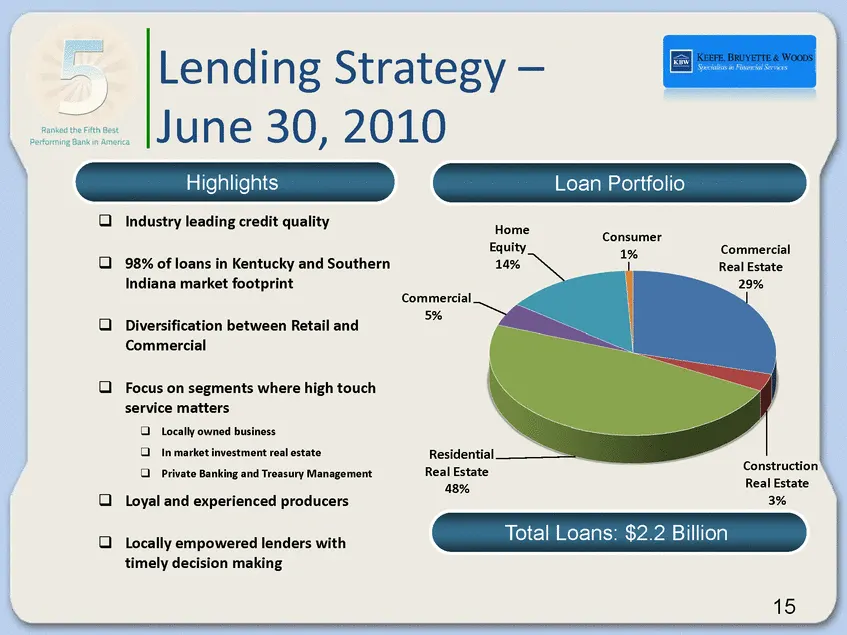
Slide 12: Lending Strategy – June 30, 2010 Highlights
Commercial Real Estate 29% Construction Real Estate 3% Residential Real Estate 48% Commercial 5% Home Equity 14% Consumer 1% Lending Strategy – June 30, 2010 Highlights Loan Portfolio Total Loans: $2.2 Billion Industry leading credit quality 98% of loans in Kentucky and Southern Indiana market footp
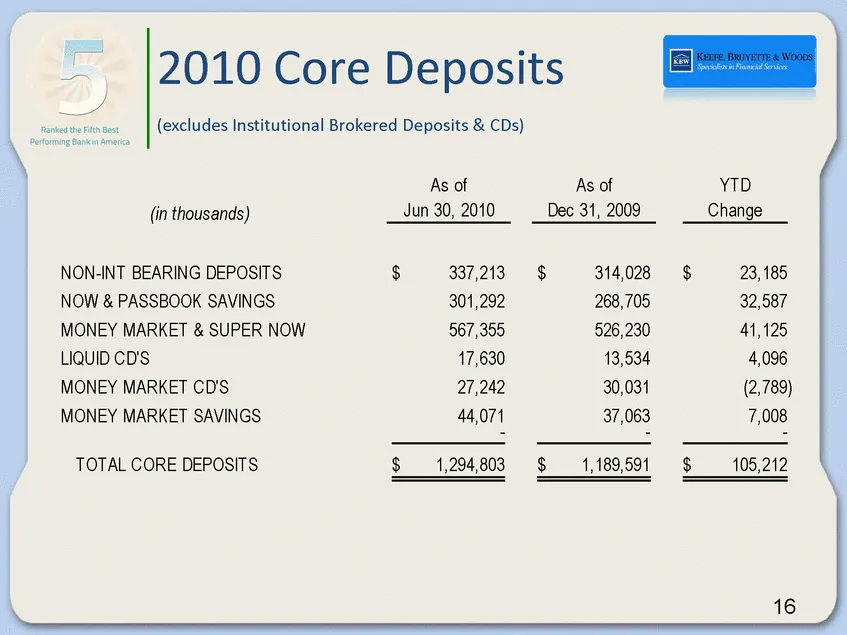
Slide 13: Core Deposits
As of As of YTD (in thousands) Jun 30, 2010 Dec 31, 2009 Change NON-INT BEARING DEPOSITS 337,213 $ 314,028 $ 23,185 $ NOW & PASSBOOK SAVINGS 301,292 268,705 32,587 MONEY MARKET & SUPER NOW 567,355 526,230 41,125 LIQUID CD'S 17,630 13,534 4,096 MONEY MARKET CD'S 27,242 30,031 (2,789) MONEY MARKET SAV
Slide 14: Deposit Mix – June 30, 2010
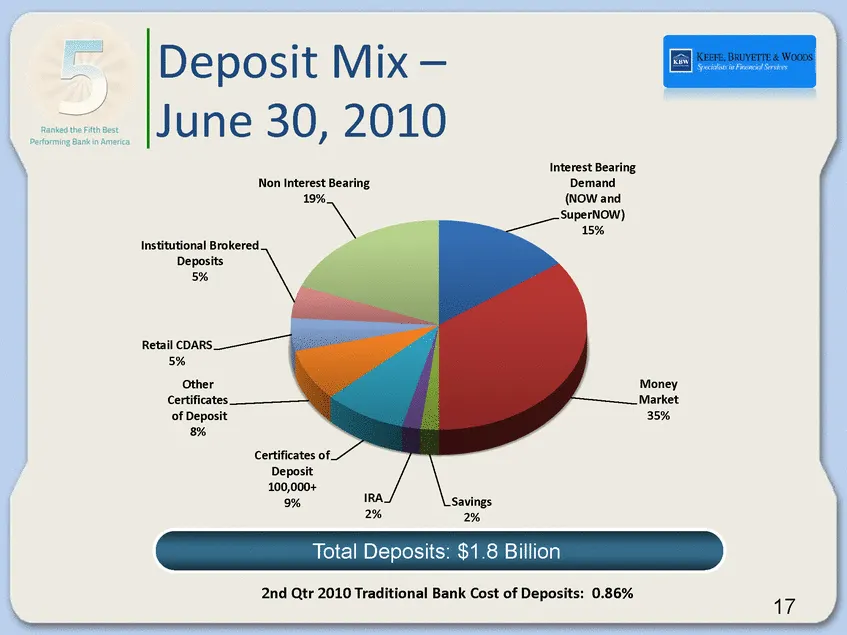
Interest Bearing Demand (NOW and Super NOW) 15% Money Market 35% Savings 2% IRA 2% Certificates of Deposit 100,000+ 9% Other Certificates of Deposit 8% Retail CDARS 5% Institutional Brokered Deposits 5% Non Interest Bearing 19% 2nd Qtr 2010 Traditional Bank Cost of Deposits: 0.86% Deposit Mix – June
Slide 15: Industry Strong Credit Quality
Industry Strong Credit Quality
Slide 16: Net Loan Charge Offs to Average Loans
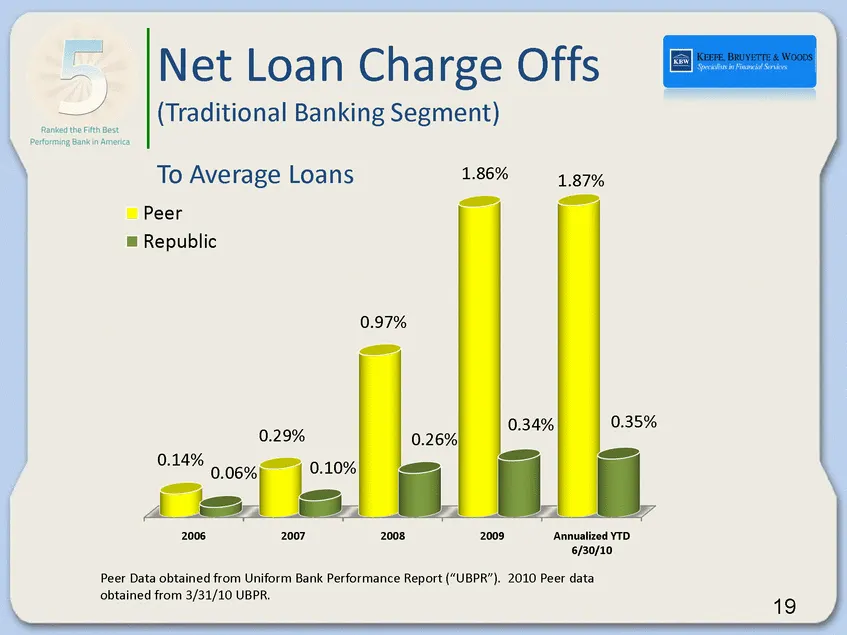
Net Loan Charge Offs (Traditional Banking Segment) To Average Loans 2006 2007 2008 2009 Annualized YTD 6/30/10 0.14% 0.29% 0.97% 1.86% 1.87% 0.06% 0.10% 0.26% 0.34% 0.35% Peer Republic Peer Data obtained from Uniform Bank Performance Report (“UBPR”). 2010 Peer data obtained from 3/31/10 UBPR.
Slide 17: Non Performing Loans To Total Loans
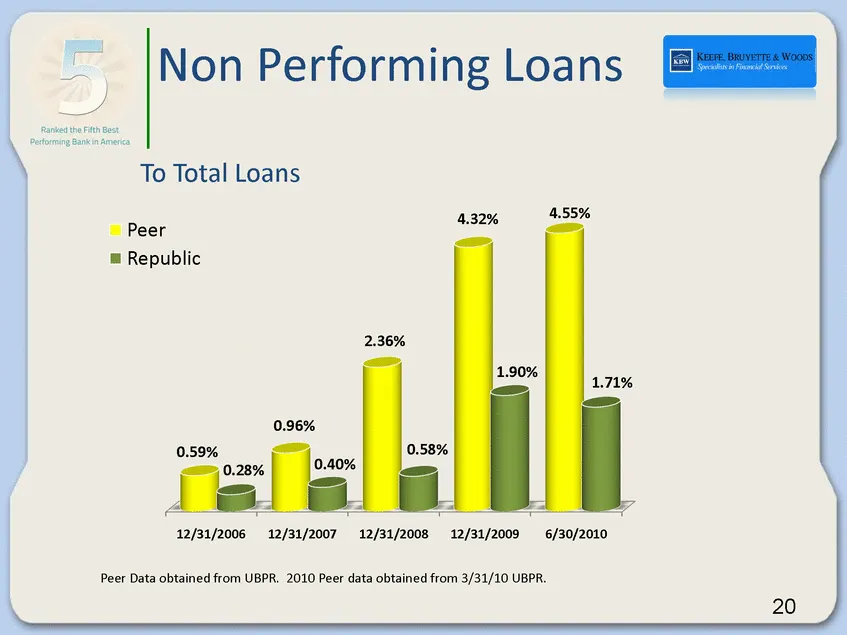
Non Performing Loans To Total Loans 12/31/2006 12/31/2007 12/31/2008 12/31/2009 6/30/2010 0.59% 0.96% 2.36% 4.32% 4.55% 0.28% 0.40% 0.58% 1.90% 1.71% Peer Republic Peer Data obtained from UBPR. 2010 Peer data obtained from 3/31/10 UBPR.
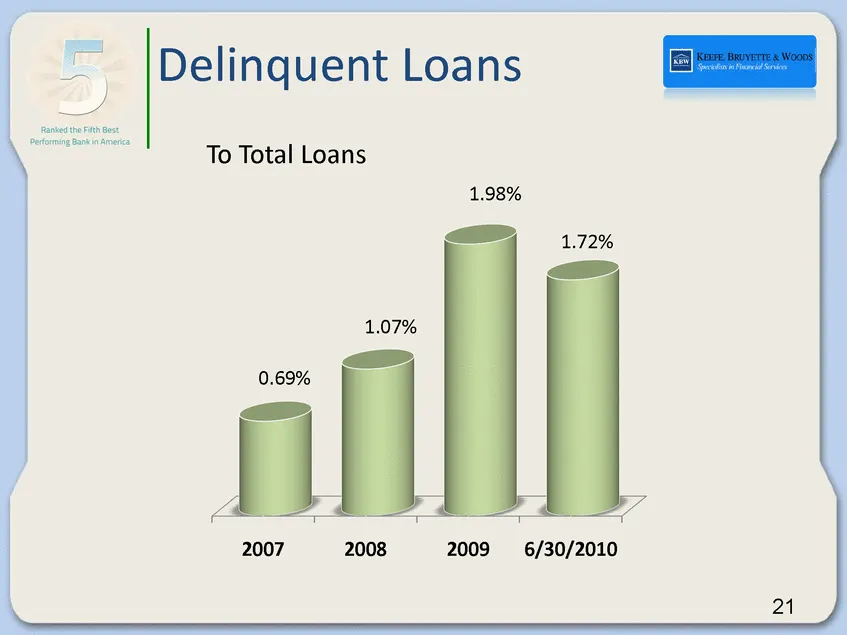
Slide 18: Delinquent Loans To Total Loans
Delinquent Loans To Total Loans 2007 2008 2009 6/30/2010 0.69% 1.07% 1.98% 1.72%
Slide 19: Results of Operations
Results of Operations J
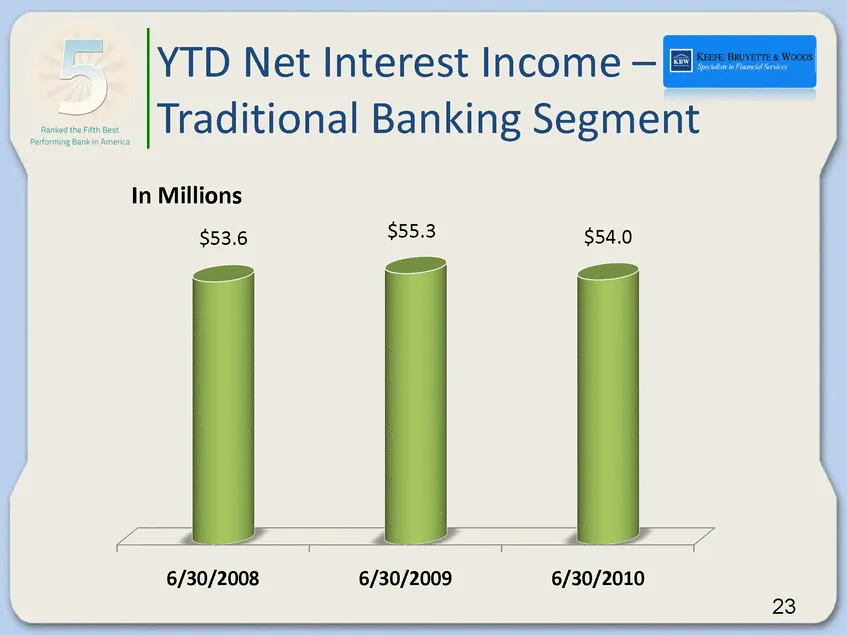
Slide 20: YTD Net Interest Income – Traditional Banking Segment
YTD Net Interest Income – Traditional Banking Segment 6/30/2008 6/30/2009 6/30/2010 $53.6 $55.3 $54.0 In Millions
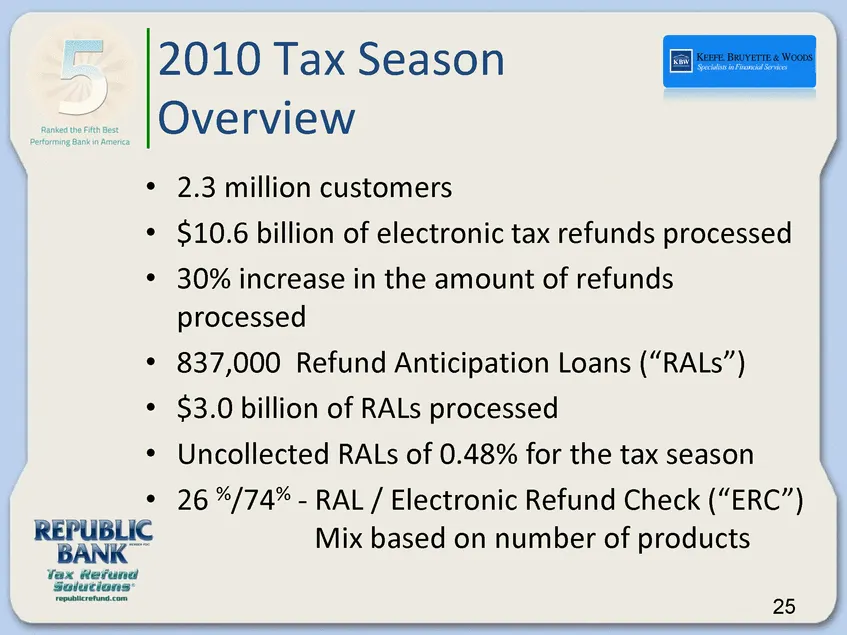
Slide 21: 2010 Tax Season Overview
• 2.3 million customers • $10.6 billion of electronic tax refunds processed • 30% increase in the amount of refunds processed • 837,000 Refund Anticipation Loans (“RALs”) • $3.0 billion of RALs processed • Uncollected RALs of 0.48% for the tax season • 26 %/74%-RAL / Electronic Refund Check (“ERC”)
Slide 22: Growth Initiatives – Strategies/Strategic
Growth Initiatives – Strategies/Strategic • Acquire a failed financial institution • Secondary market lending • Attract customers leaving troubled institutions looking for safety and soundness • Add strategically located banking centers and make selective acquisitions • Outperform peer financial per
Slide 23: 2010 Challenges & Opportunities
2010 Challenges & Opportunities Challenges • New Regulation E requirements • Ongoing regulatory dialogue regarding the TRS business • Improving net interest margin by capitalizing on low cost deposit opportunities within Treasury Management • Non-interest expense control • Continue to increase the s

Slide 24: We were here for you yesterday
We were here for you yesterday. We are here for you today. We will be here for you tomorrow. ®

Slide 25: Thank You
THANK YOU | |]
Source: SEC EDGAR · 8-K filed Jul 26, 2010
More decks from Republic Bancorp, Inc.
 Shareholder Meeting (April 2026)45 slides · Apr 23, 2026
 Raymond James 2025 U.S. Bank Conference27 slides · September 2025
 Shareholder Meeting (April 2025)38 slides · Apr 24, 2025
 Shareholder Meeting (April 2024)40 slides · Apr 25, 2024
 Shareholder Meeting (April 2023)33 slides · Apr 20, 2023
 Shareholder Meeting (April 2022)31 slides · Apr 21, 2022