Talx — Baird Business Solutions Conference February 2005
35 slides from Talx's conference presentation, Feb 22, 2005

Slide 1: TALX Corporation: A Leader in Payroll/HR Outsourcing
Baird Business Solutions Conference February 2005 TALX Corporation A Leader in Payroll/HR Outsourcing
Slide 2: Safe Harbor Statement
Safe Harbor Statement Statements expressing the beliefs and expectations of management regarding future performance are forward-looking statements including, without limitation, anticipated revenue and earnings in the fourth quarter and full year of fiscal 2005, favorable operating trends and any ot
Slide 3: A Leader in Payroll/HR Outsourcing
A Leader in Payroll/HR Outsourcing TALX is a leading Business Process Outsourcer (BPO) bringing clients significant savings by replacing manual, paper-based Payroll/HR methods with electronic-based outsourced services. Business Model Standard services and processes Contractual and transaction-driven
Slide 4: Clients of TALX Services (Partial Client Listing)
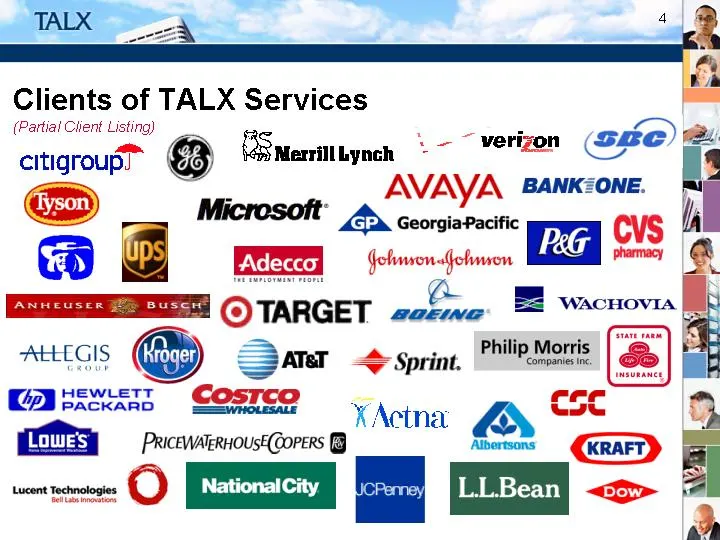
Clients of TALX Services (Partial Client Listing) (Partial Client Listing) (Partial Client Listing) (Partial Client Listing) (Partial Client Listing) (Partial Client Listing) (Partial Client Listing)
Slide 5: Client Advisory Board Member Organizations
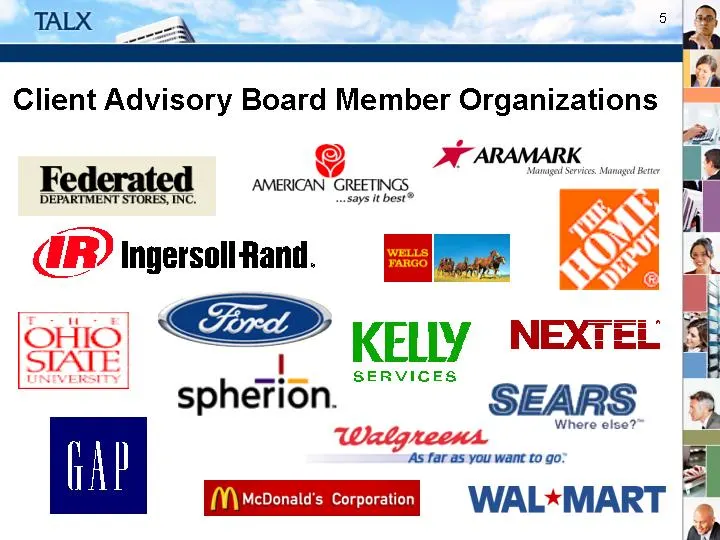
Client Advisory Board Member Organizations Client Advisory Board Member Organizations Client Advisory Board Member Organizations Client Advisory Board Member Organizations
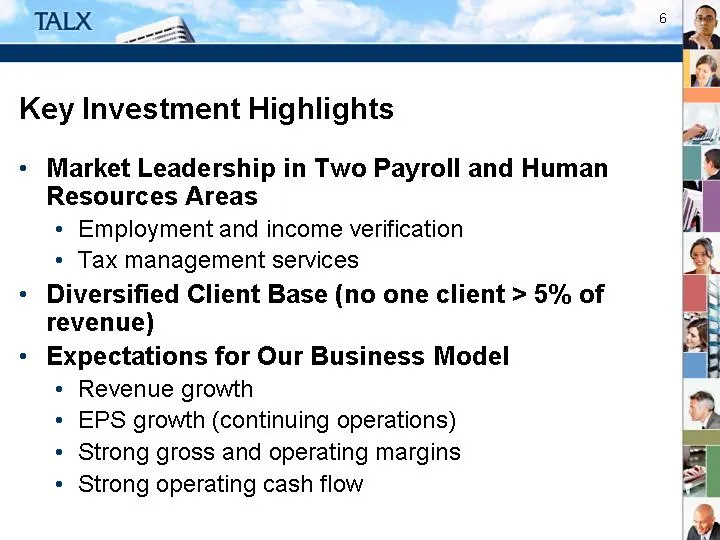
Slide 6: Key Investment Highlights
Key Investment Highlights Market Leadership in Two Payroll and Human Resources Areas Employment and income verification Tax management services Diversified Client Base (no one client > 5% of revenue) Expectations for Our Business Model Revenue growth EPS growth (continuing operations) Strong gross a
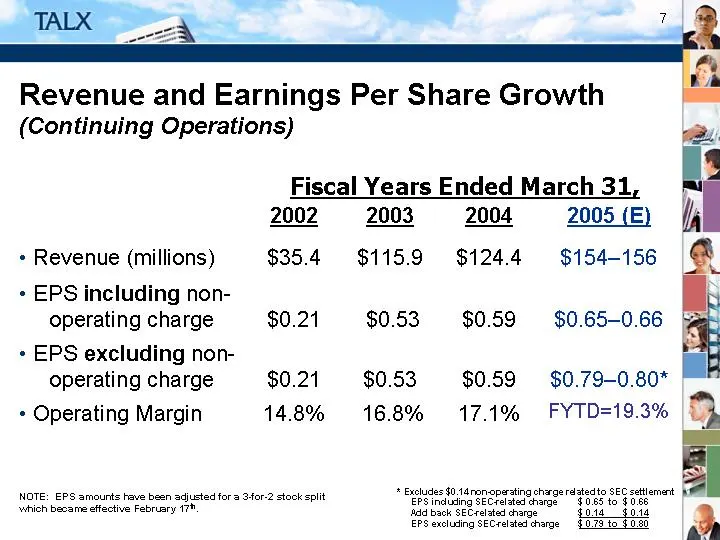
Slide 7: Revenue and Earnings Per Share Growth (Continuing Operations)
Revenue and Earnings Per Share Growth (Continuing Operations) 2002 2003 2004 2005 (E) Revenue (millions) $35.4 $115.9 $124.4 $154-156 EPS including non- operating charge $0.21 $0.53 $0.59 $0.65-0.66 EPS excluding non- operating charge $0.21 $0.53 $0.59 $0.79-0.80* Operating Margin 14.8% 16.8% 17.1%
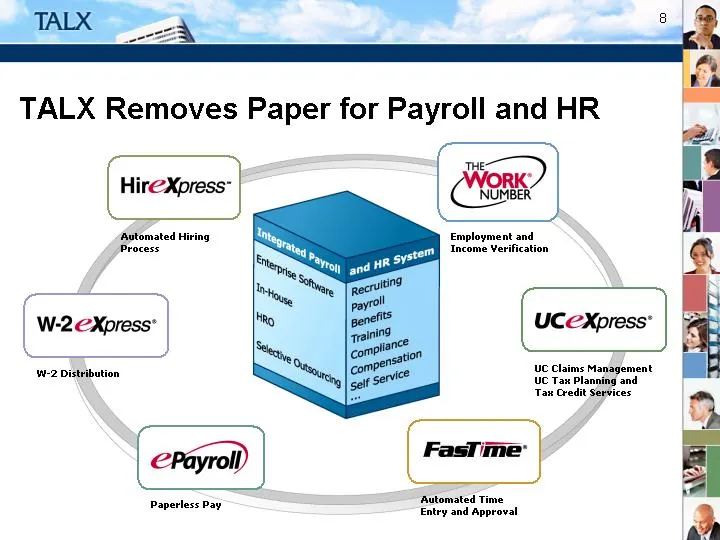
Slide 8: TALX Removes Paper for Payroll and HR
TALX Removes Paper for Payroll and HR TALX Removes Paper for Payroll and HR Employment Verification Requests Unemployment Claims and Tax Credit Applications Time Sheets and PTO Reports Job Applications W-2s Pay Checks and Pay Advises Pay Checks and Pay Advises Employment and Income Verification UC C
Slide 9: Services and Market Share
“el Services and Market Share ia
Slide 10: In-house Versus Outsourced Payroll
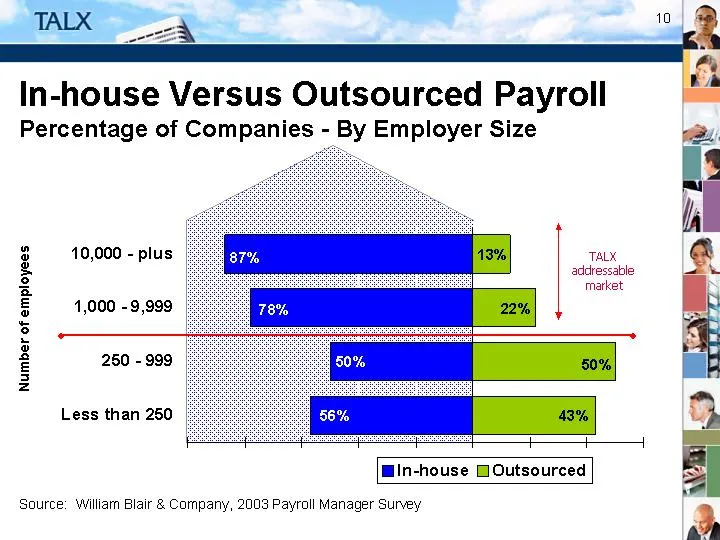
In-house Versus Outsourced Payroll Percentage of Companies - By Employer Size # of employees In-house Outsourced Less than 250 -0.57 0.43 250 - 999 -0.5 0.5 1,000 - 9,999 -0.78 0.22 10,000 - plus -0.87 0.13 Source: William Blair & Company, 2003 Payroll Manager Survey Number of employees TALX address
Slide 11: Market Share Leadership
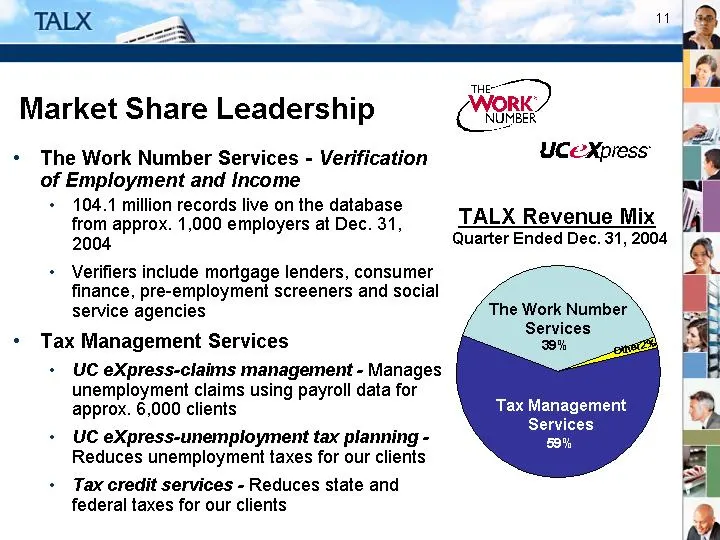
Market Share Leadership The Work Number Services - Verification of Employment and Income 104.1 million records live on the database from approx. 1,000 employers at Dec. 31, 2004 Verifiers include mortgage lenders, consumer finance, pre-employment screeners and social service agencies Tax Management
Slide 12: Penetration of TALX Services into U.S. Employment Market
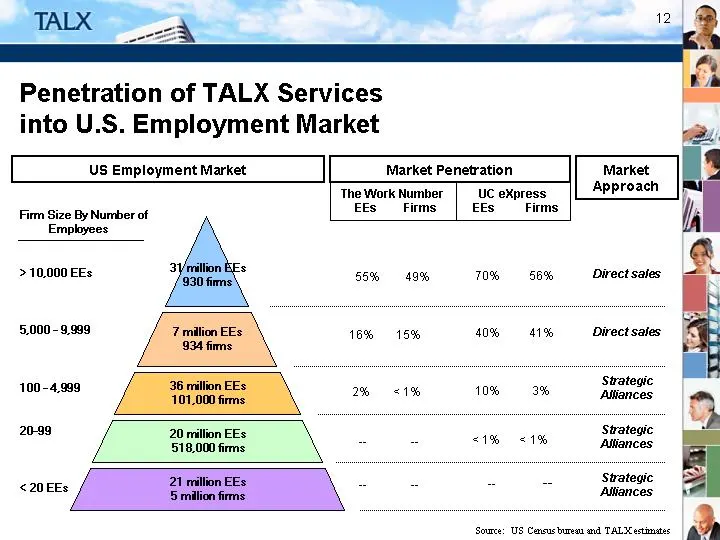
Penetration of TALX Services into U.S. Employment Market 55% 49% 16% 15% 2% < 1% -- -- -- -- Market Penetration US Employment Market Source: US Census bureau and TALX estimates 31 million EEs 930 firms 7 million EEs 934 firms 36 million EEs 101,000 firms 20 million EEs 518,000 firms 21 million EEs 5
Slide 13: The Work Number Suite of Services
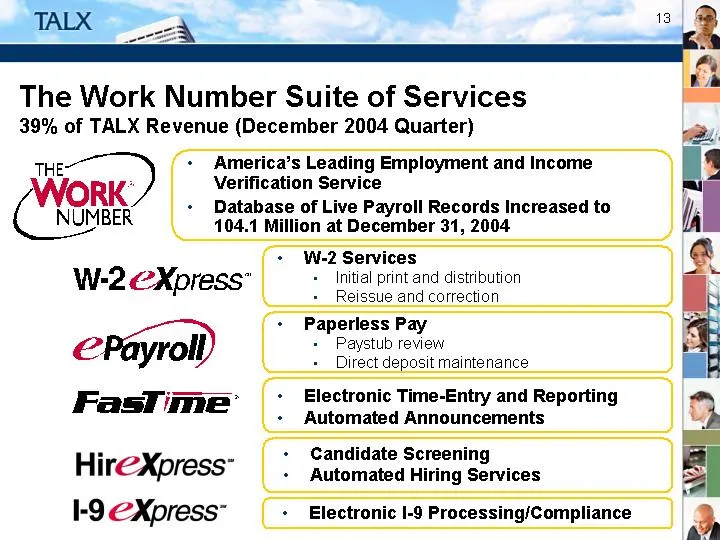
The Work Number Suite of Services 39% of TALX Revenue (December 2004 Quarter) America's Leading Employment and Income Verification Service Database of Live Payroll Records Increased to 104.1 Million at December 31, 2004 Paperless Pay Paystub review Direct deposit maintenance Electronic Time-Entry an
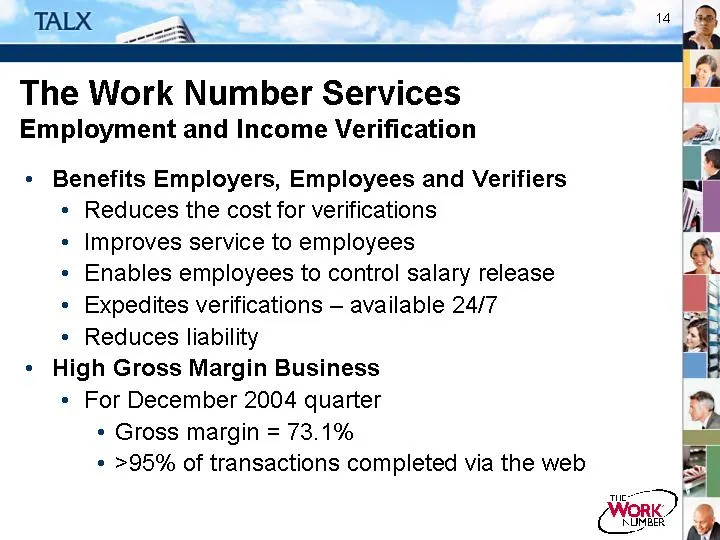
Slide 14: The Work Number Services: Employment and Income Verification Benefits
The Work Number Services Employment and Income Verification Benefits Employers, Employees and Verifiers Reduces the cost for verifications Improves service to employees Enables employees to control salary release Expedites verifications - available 24/7 Reduces liability High Gross Margin Business F
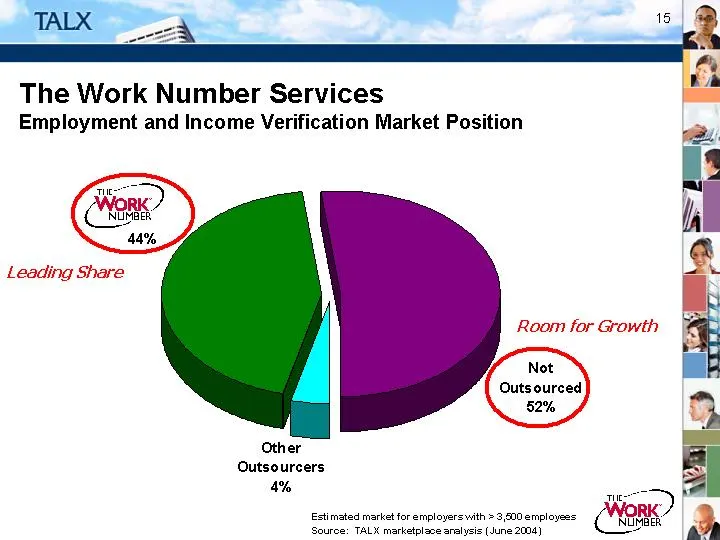
Slide 15: The Work Number Services Market Position
Other Outsourcers The Work Number Not Outsourced East 2.1 24.4 28.5 The Work Number Services Employment and Income Verification Market Position Leading Share Room for Growth Estimated market for employers with > 3,500 employees Source: TALX marketplace analysis (June 2004)
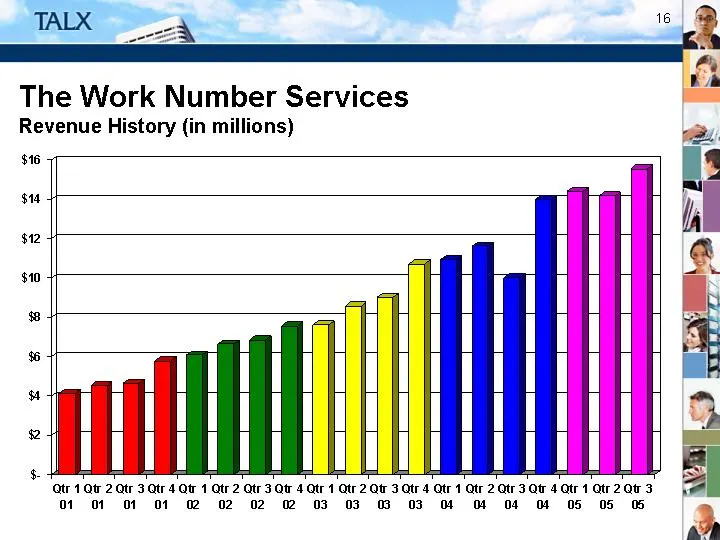
Slide 16: The Work Number Services Revenue History
The Work Number Services Revenue History (in millions) Qtr 1 01 Qtr 2 01 Qtr 3 01 Qtr 4 01 Qtr 1 02 Qtr 2 02 Qtr 3 02 Qtr 4 02 Qtr 1 03 Qtr 2 03 Qtr 3 03 Qtr 4 03 Qtr 1 04 Qtr 2 04 Qtr 3 04 Qtr 4 04 Qtr 1 05 Qtr 2 05 Qtr 3 05 East 4.132 4.531 4.635 5.796 6.103 6.659 6.856 7.566 7.617 8.573 9.011 10.
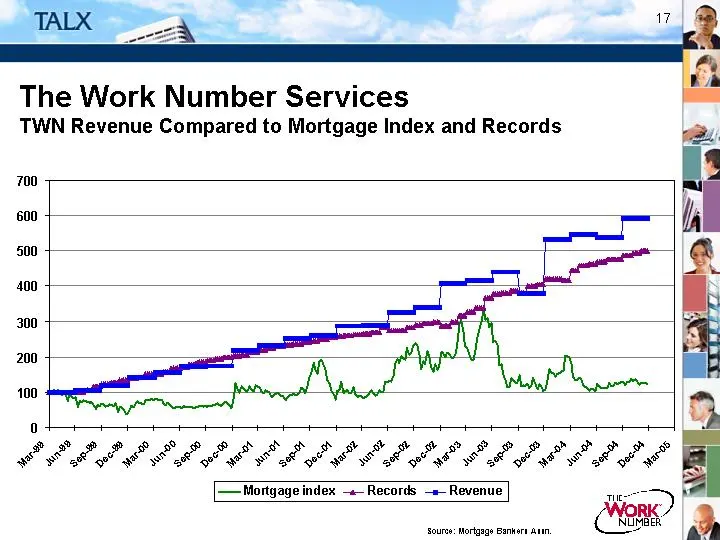
Slide 17: Mortgage index, Records, Revenue
Mortgage index Records Revenue 3/31/1999 100 100 100 4/2/1999 100 100 100 4/9/1999 98.2 100 100 4/16/1999 106.9 100 100 4/23/1999 102.9 100 100 4/30/1999 106.6 100 100 5/7/1999 103.8 100 100 5/14/1999 93.1 100 100 5/21/1999 96.6 100 100 5/28/1999 96.6 100 100 6/4/1999 74.9 100 100 6/11/1999 95.8 100
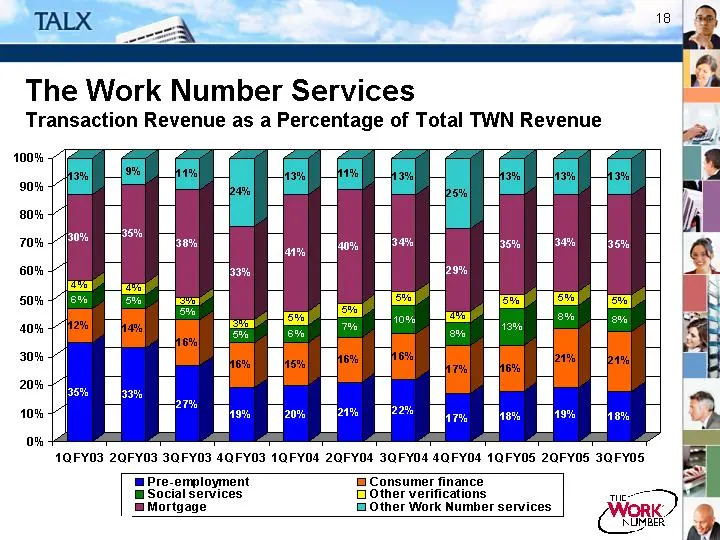
Slide 18: Transaction Revenue as a Percentage of Total TWN Revenue
The Work Number Services Transaction Revenue as a Percentage of Total TWN Revenue 1QFY03 2QFY03 3QFY03 4QFY03 1QFY04 2QFY04 3QFY04 4QFY04 1QFY05 2QFY05 3QFY05 Pre-employment 0.35 0.33 0.27 0.19 0.2 0.21 0.22 0.17 0.18 0.19 0.18 Consumer finance 0.12 0.14 0.16 0.16 0.15 0.16 0.16 0.17 0.16 0.21 0.21
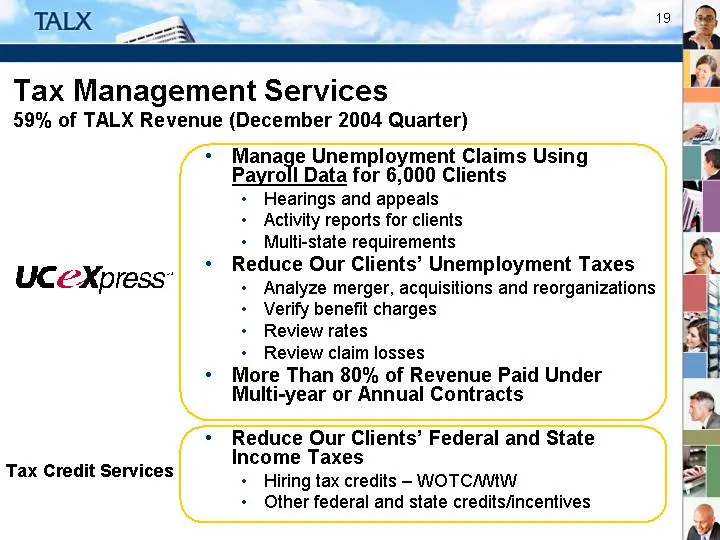
Slide 19: Tax Management Services
Tax Management Services 59% of TALX Revenue (December 2004 Quarter) Manage Unemployment Claims Using Payroll Data for 6,000 Clients Hearings and appeals Activity reports for clients Multi-state requirements Reduce Our Clients' Unemployment Taxes Analyze merger, acquisitions and reorganizations Verif
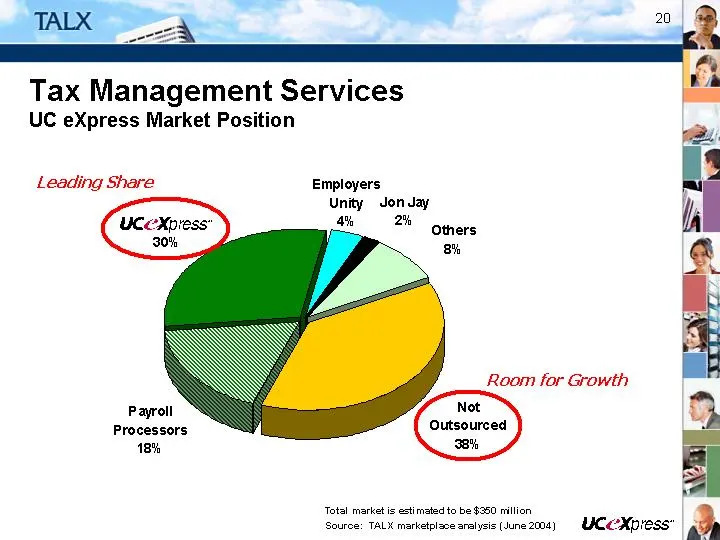
Slide 20: UC eXpress Market Position
Tax Management Services UC eXpress Market Position Payroll Processors TALX Employers Unity Jon Jay Others Not Outsourced East 53 88 11 6 25 113 Room for Growth Leading Share Total market is estimated to be $350 million Source: TALX marketplace analysis (June 2004)
Slide 21: Growth Strategy
Growth Strategy
Slide 22: Growth Drivers
Growth Drivers Organic Growth Initiatives The Work Number services Tax management services Cross-Selling Acquisitions
Slide 23: Organic Growth Initiatives: The Work Number Services
Organic Growth Initiatives The Work Number Services Add Records to the Database Direct sales Partner with payroll providers Grow Revenue in Excess of the Database Growth Regular price increases Add new verifiers - pre-employment, consumer finance, new industries Expand REACH within existing verifier
Slide 24: The I-9 eXpress Service
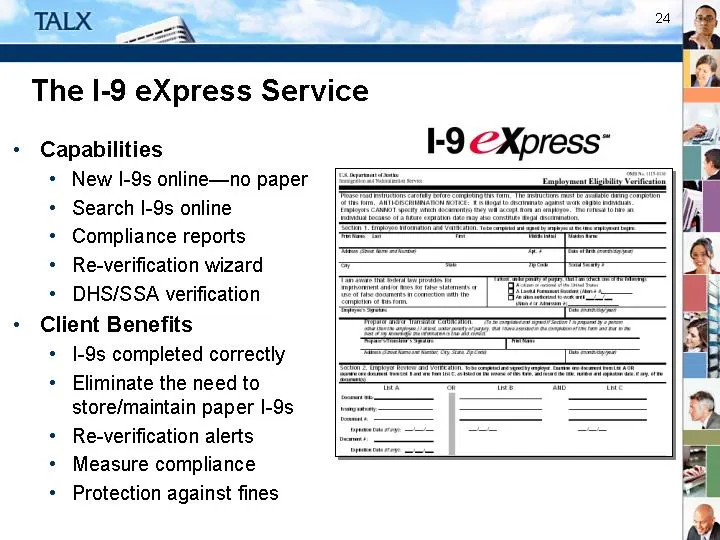
The I-9 eXpress Service Capabilities New I-9s online-no paper Search I-9s online Compliance reports Re-verification wizard DHS/SSA verification Client Benefits I-9s completed correctly Eliminate the need to store/maintain paper I-9s Re-verification alerts Measure compliance Protection against fines
Slide 25: Organic Growth Initiatives: Tax Management Services
Organic Growth Initiatives Tax Management Services Include Fee Escalation Provisions in UC eXpress Contracts 5% per year on 3-year contracts 3% per year on 5-year contracts Unbundle Standard UC eXpress Services Claims contingencies Hearings Tax rate verifications New Applications e-Learning
Slide 26: Growth Strategy - Cross-Selling
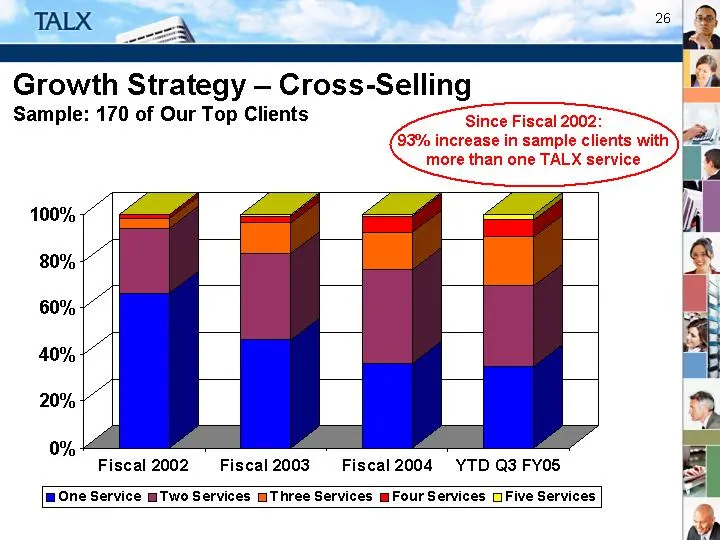
Growth Strategy - Cross-Selling Sample: 170 of Our Top Clients Fiscal 2002 Fiscal 2003 Fiscal 2004 YTD Q3 FY05 One Service 112 78 61 59 Two Services 47 63 68 58 Three Services 7 22 27 36 Four Services 3 5 12 12 Five Services 0 1 1 4 Since Fiscal 2002: 93% increase in sample clients with more than on
Slide 27: Growth Strategy - Acquisitions
Growth Strategy - Acquisitions Active but Disciplined Approach Acquisition Objectives Accretive to Earning Per Share Provide records for The Work Number database Same or complementary services Strong management Previous Acquisitions TBT Enterprises, Inc. (hiring tax credit services) - October 2004 N
Slide 28: yr eB RI W2eXpress Fastime Hit %
yr eB RI W2eXpress Fastime Hit % Pago) = UCeXpress fis press ireXpress
Slide 29: Revenues
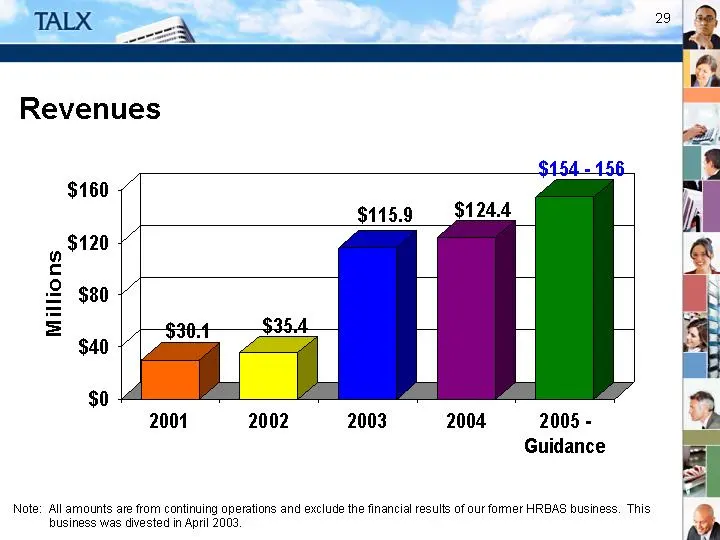
Revenues 2001 2002 2003 2004 2005 - Guidance Revenue 30.1 35.4 115.9 124.4 155 Note: All amounts are from continuing operations and exclude the financial results of our former HRBAS business. This business was divested in April 2003.
Slide 30: Margins
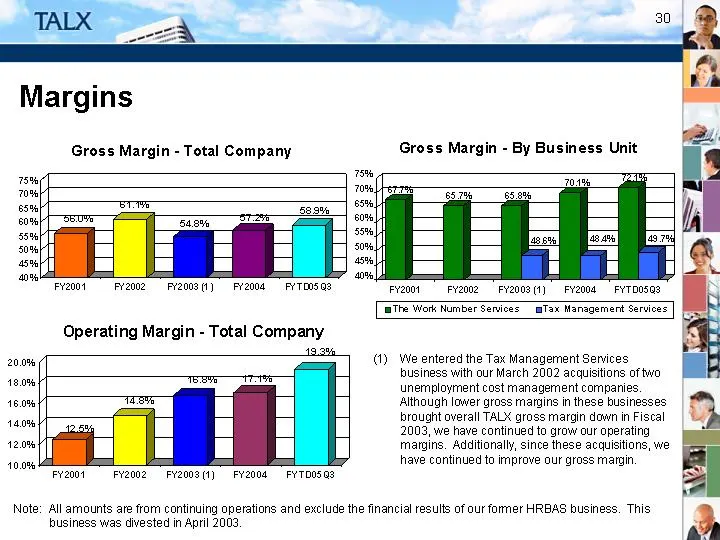
Margins (1) We entered the Tax Management Services business with our March 2002 acquisitions of two unemployment cost management companies. Although lower gross margins in these businesses brought overall TALX gross margin down in Fiscal 2003, we have continued to grow our operating margins. Additio
Slide 31: Earnings From Continuing Operations
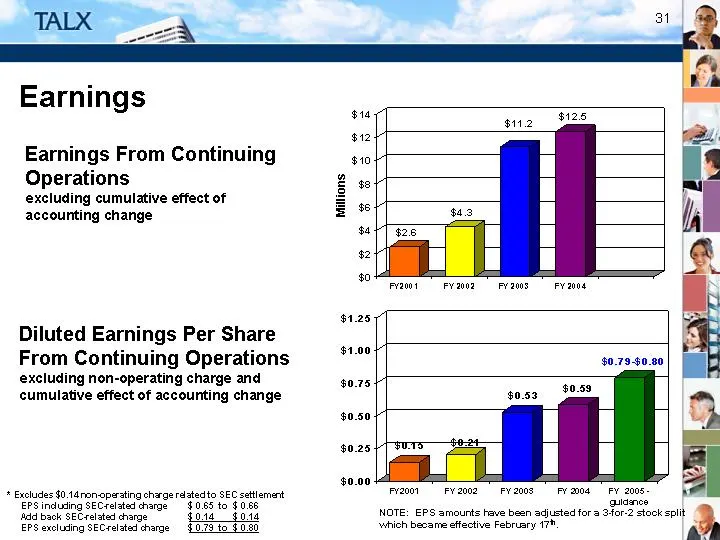
Earnings From Continuing Operations excluding cumulative effect of accounting change FY2001 FY 2002 FY 2003 FY 2004 FY 2005 - guidance 0.15 0.21 0.53 0.59 0.795 FY2001 FY 2002 FY 2003 FY 2004 2.6 4.3 11.2 12.5 Diluted Earnings Per Share From Continuing Operations excluding non-operating charge and c
Slide 32: Cash Flow Components
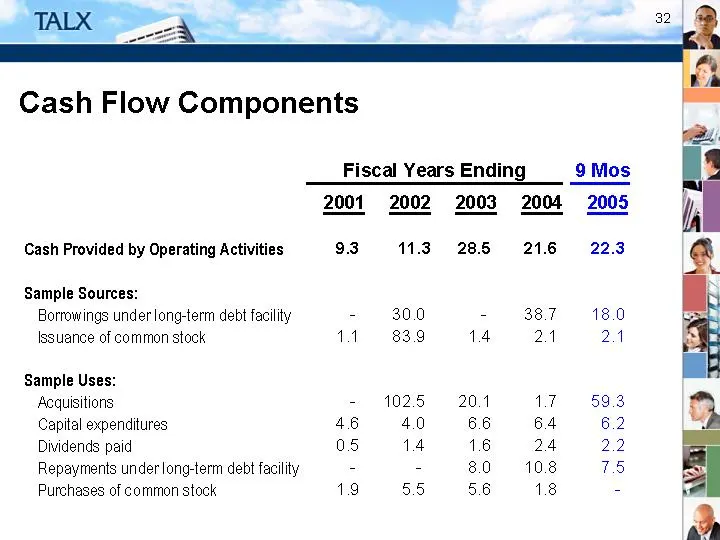
Cash Flow Components Cash Provided by Operating Activities Sample Sources: Borrowings under long-term debt facility Issuance of common stock Sample Uses: Acquisitions Capital expenditures Dividends paid Repayments under long-term debt facility Purchases of common stock Fiscal Years Ending 2001 46 05
Slide 33: Balance Sheet Components
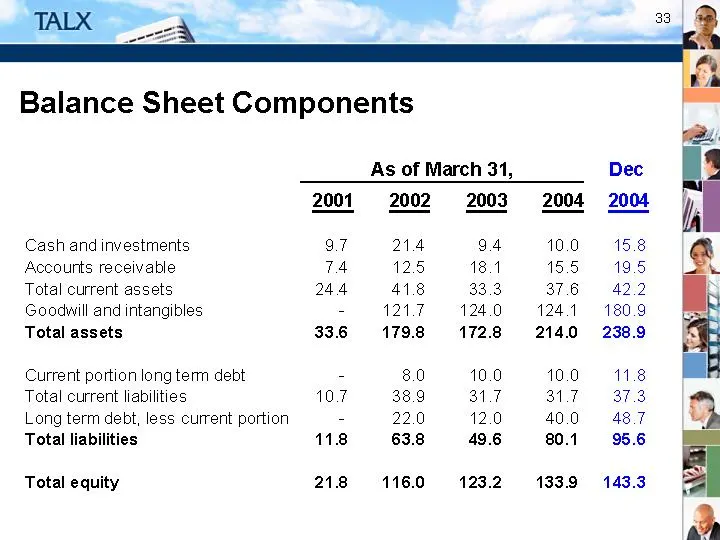
Balance Sheet Components Cash and investments Accounts receivable Total current assets Goodwill and intangibles Total assets Current portion long term debt Total current liabilities Long term debt, less current portion Total liabilities Total equity 2001 a7 74 244 33.6 107 118 218 As of March 31, 20
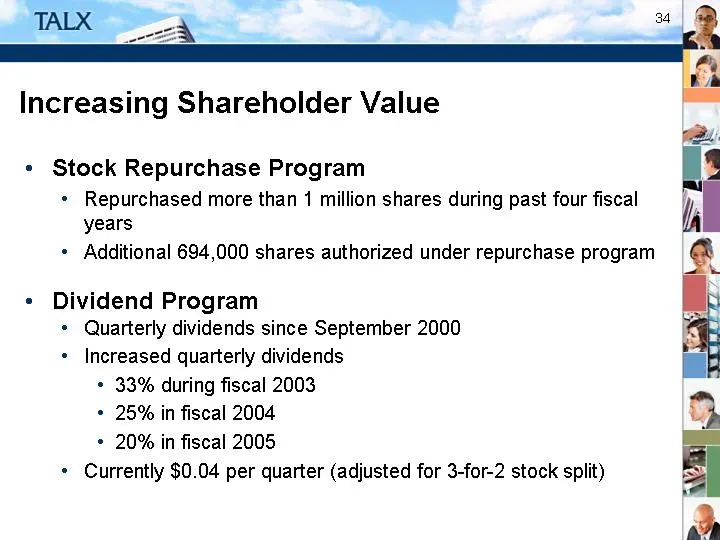
Slide 34: Increasing Shareholder Value
Increasing Shareholder Value Stock Repurchase Program Repurchased more than 1 million shares during past four fiscal years Additional 694,000 shares authorized under repurchase program Dividend Program Quarterly dividends since September 2000 Increased quarterly dividends 33% during fiscal 2003 25%

Slide 35: TALX Corporation: A Leader in Payroll/HR Outsourcing
Baird Business Solutions Conference February 2005 TALX Corporation A Leader in Payroll/HR Outsourcing
Source: SEC EDGAR · 8-K filed Feb 22, 2005
More decks from Talx Corp
 Q4 FY2007 Earnings Presentation18 slides · May 9, 2007
 Talx — Merger or Acquisition (March 2007)31 slides · Mar 6, 2007
 TALX — Merger or Acquisition (February 2007)31 slides · Feb 28, 2007
 TALX — Merger or Acquisition (February 2007)17 slides · Feb 15, 2007
 Q3 FY2007 Earnings Presentation18 slides · Jan 24, 2007
 Q1 FY2007 Earnings Presentation13 slides · Jul 27, 2006