KT Corporation · KRX:030200
KT — Q3 2026 Earnings Presentation
19 slides from KT's earnings presentation, Nov 10, 2026
Slide 1: 3Q26 Earnings Release
KT 3Q26 Earnings Release 2026. 11.| Investor Relations
Slide 2: Disclaimer
2 Disclaimer This presentation has been prepared by KT Corp.(the “Company”) in accordance with K-IFRS. This presentation contains forward-looking statements, which are subject to risks, uncertainties, and assumptions. This presentation is being presented solely for your information and is subject to
Slide 3: Contents
1 3Q26 Highlights 2 Financial Highlights 3 Business Overview 4 Appendix Contents
Slide 4: 3Q26 Highlights
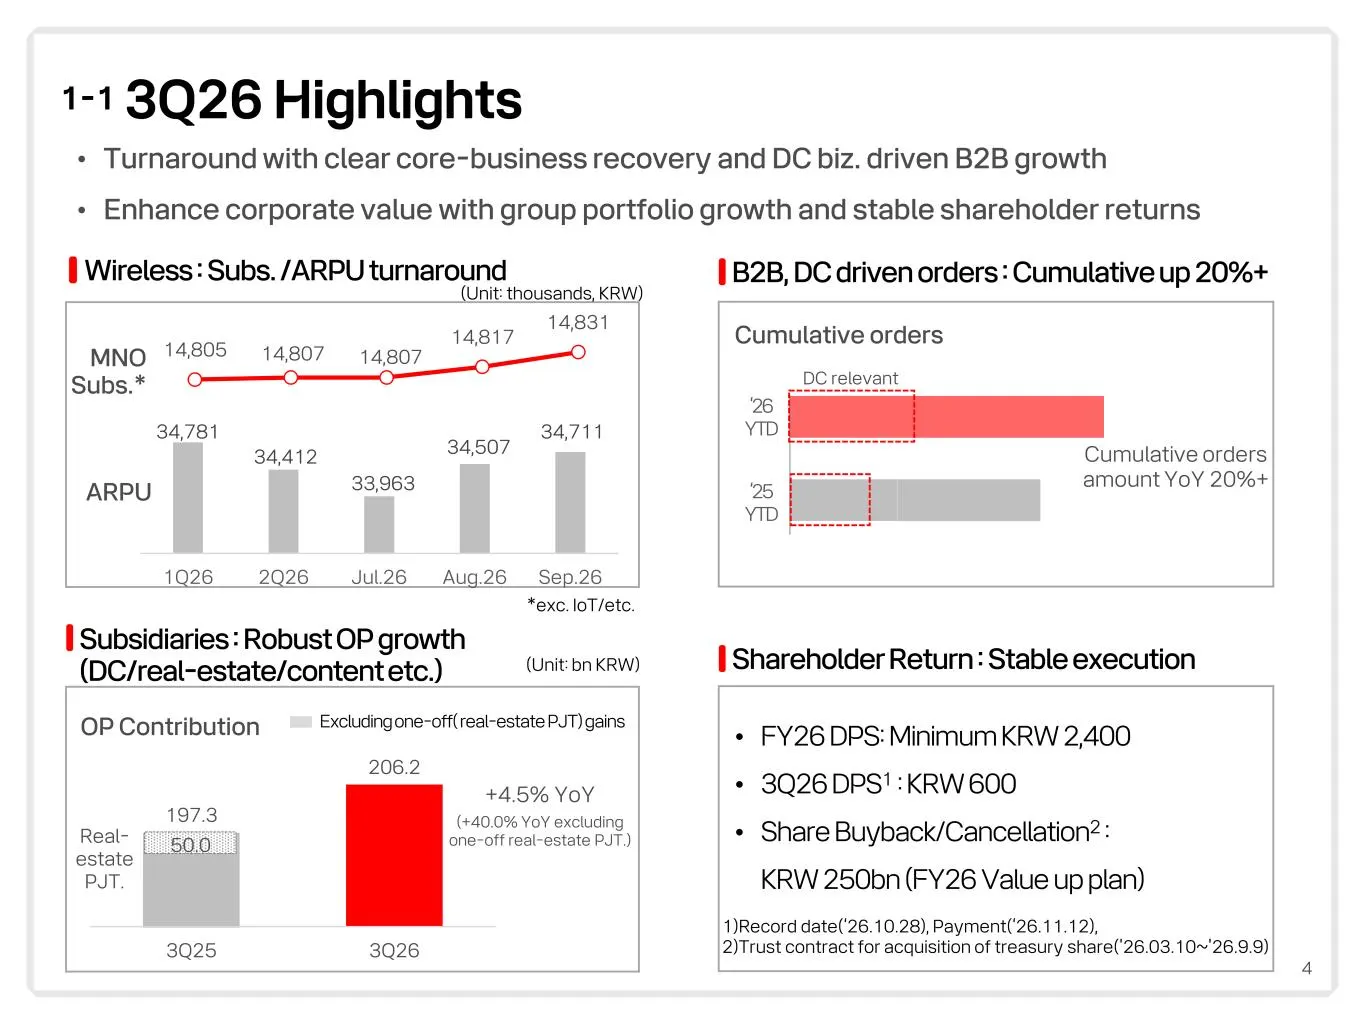
4 3Q26 Highlights1-1 Wireless : Subs. /ARPU turnaround B2B, DC driven orders : Cumulative up 20%+ Subsidiaries : Robust OP growth (DC/real-estate/content etc.) Shareholder Return : Stable execution 34,781 34,412 33,963 34,507 34,711 1Q26 2Q26 Jul.26 Aug.26 Sep.26 • Turnaround with clear core-busines
Slide 5: 3Q26 Highlights: AX Infra and AX Solution
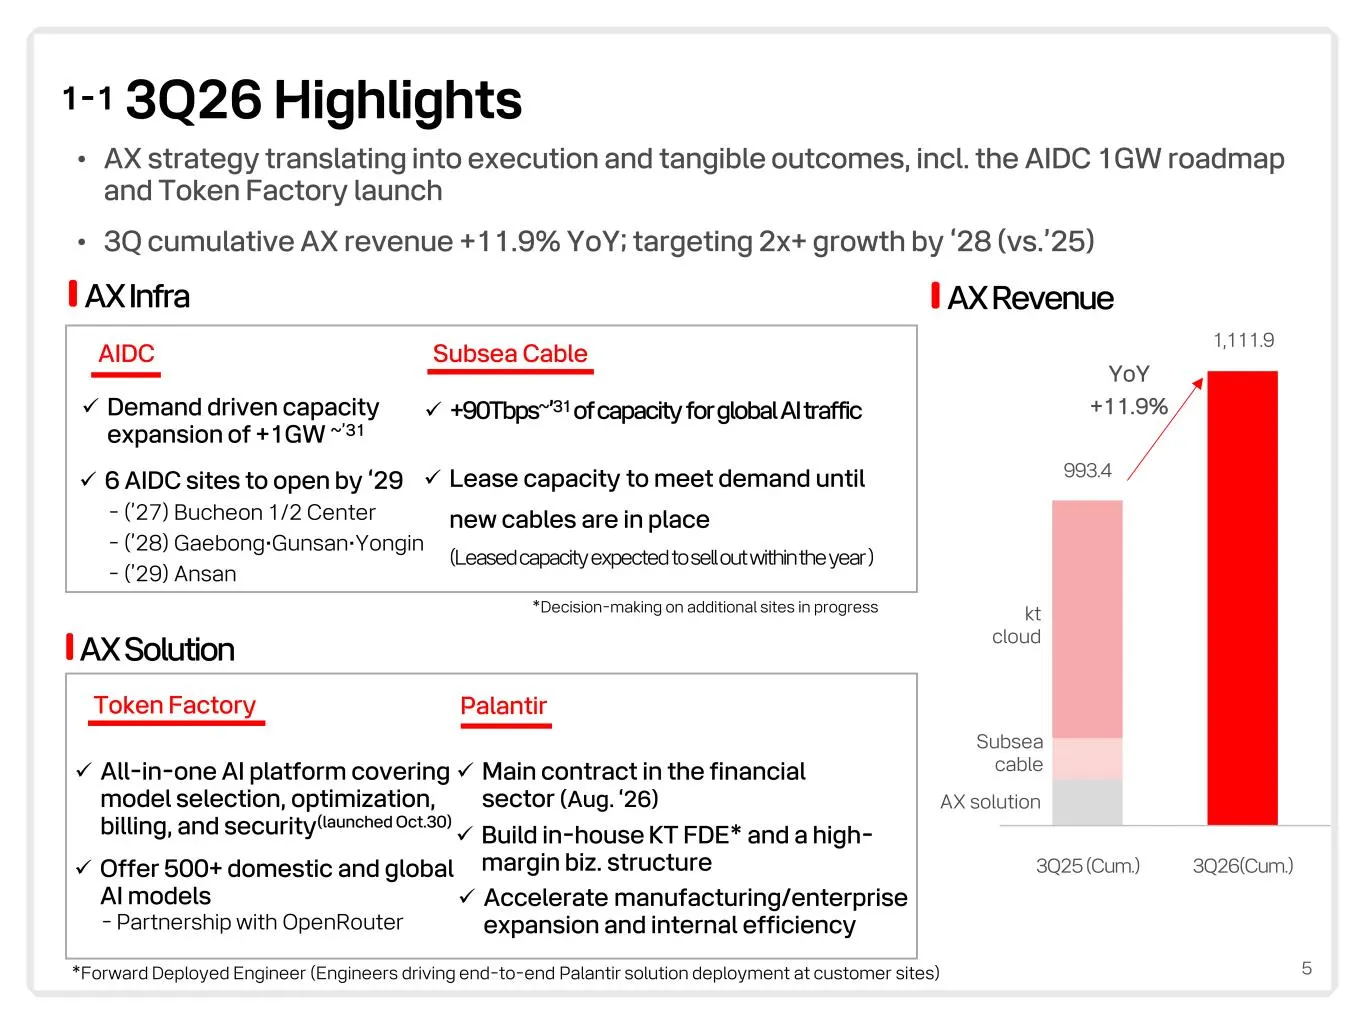
5 3Q26 Highlights1-1 AX Infra AX Solution • AX strategy translating into execution and tangible outcomes, incl. the AIDC 1GW roadmap and Token Factory launch • 3Q cumulative AX revenue +11.9% YoY; targeting 2x+ growth by ‘28 (vs.’25) AXRevenue AIDC Subsea Cable Token Factory Palantir ✓ Demand driven
Slide 6: FY2028 Financial Target and Action Plans
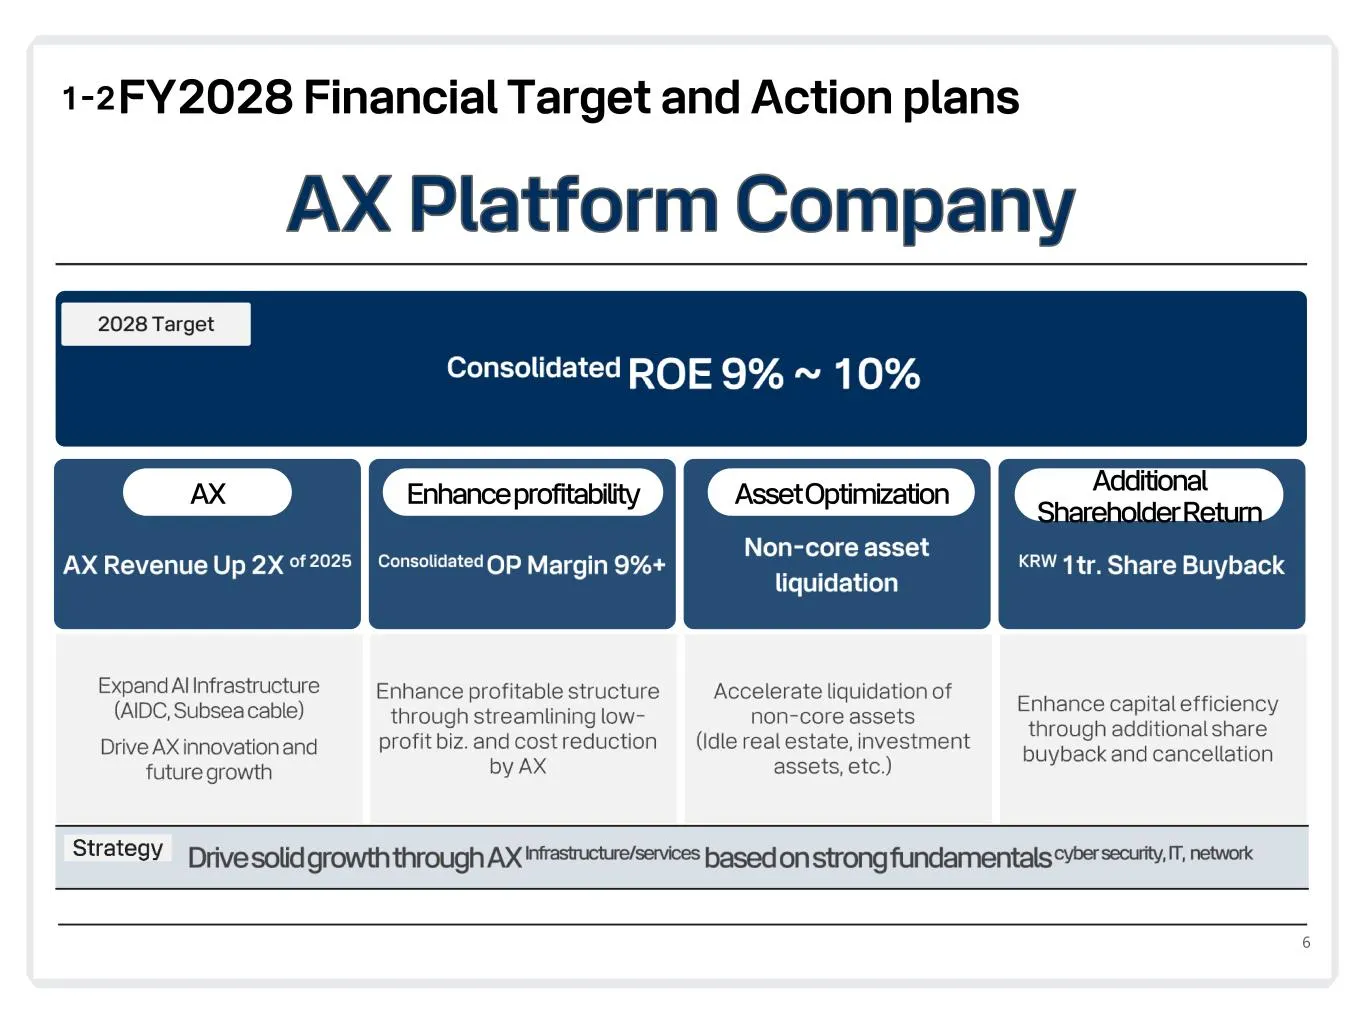
6 AX Platform Company AX Enhance profitability AssetOptimization Additional Shareholder Return FY2028 Financial Target and Action plans1-2
Slide 7: Financial Highlights
1 3Q26 Highlights 2 Financial Highlights 3 Business Overview 4 Appendix Contents
Slide 8: Financial Highlights
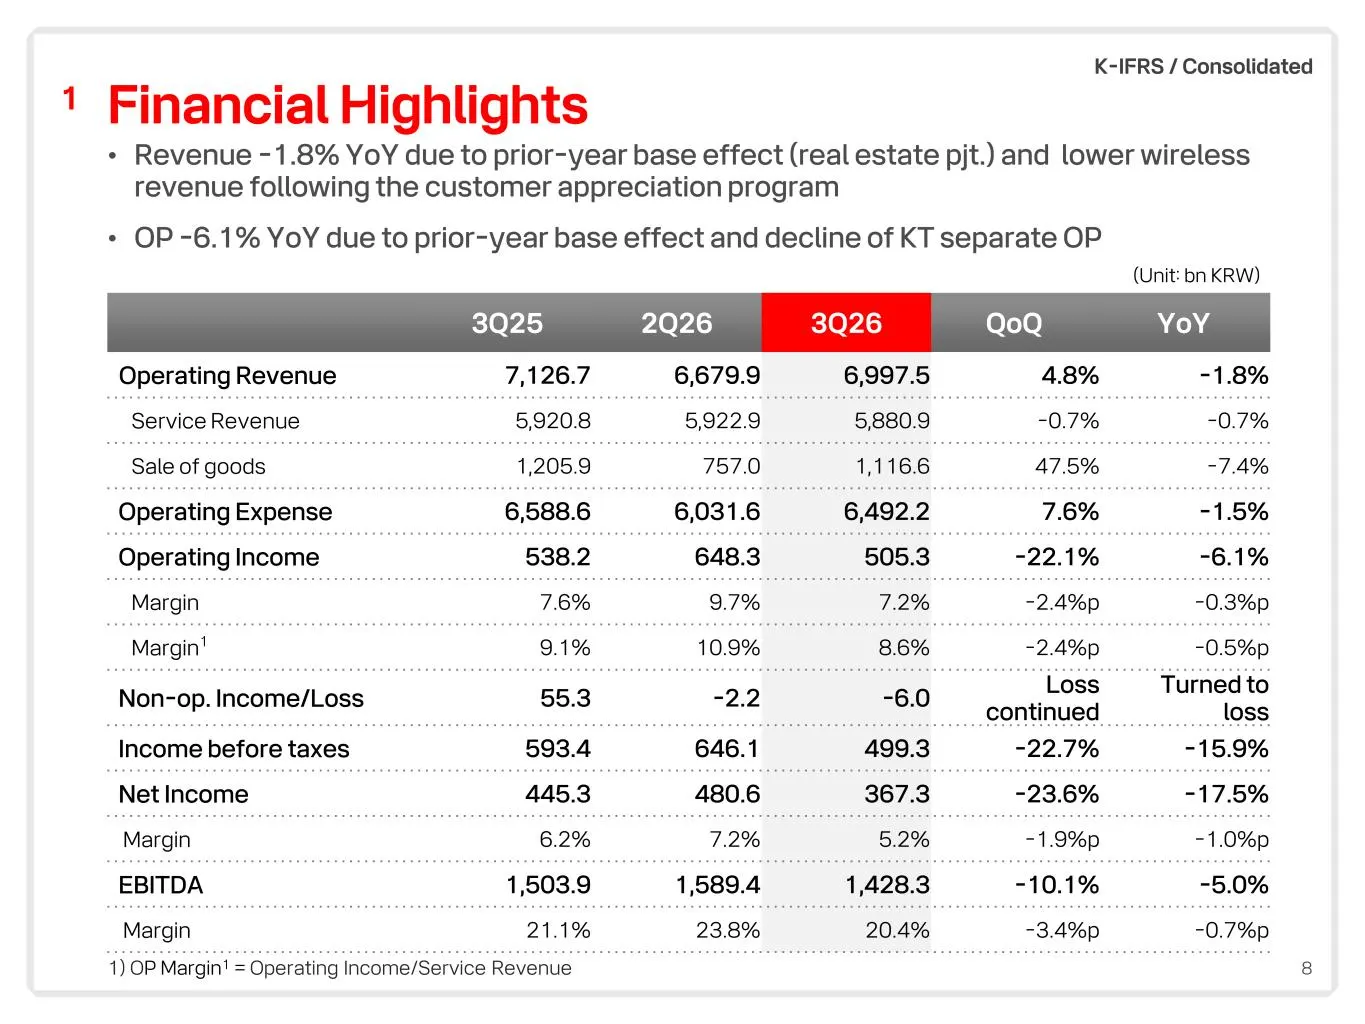
8 Financial Highlights1 (Unit: bn KRW) 3Q25 2Q26 3Q26 QoQ YoY Operating Revenue 7,126.7 6,679.9 6,997.5 4.8% -1.8% Service Revenue 5,920.8 5,922.9 5,880.9 -0.7% -0.7% Sale of goods 1,205.9 757.0 1,116.6 47.5% -7.4% Operating Expense 6,588.6 6,031.6 6,492.2 7.6% -1.5% Operating Income 538.2 648.3 505
Slide 9: CAPEX
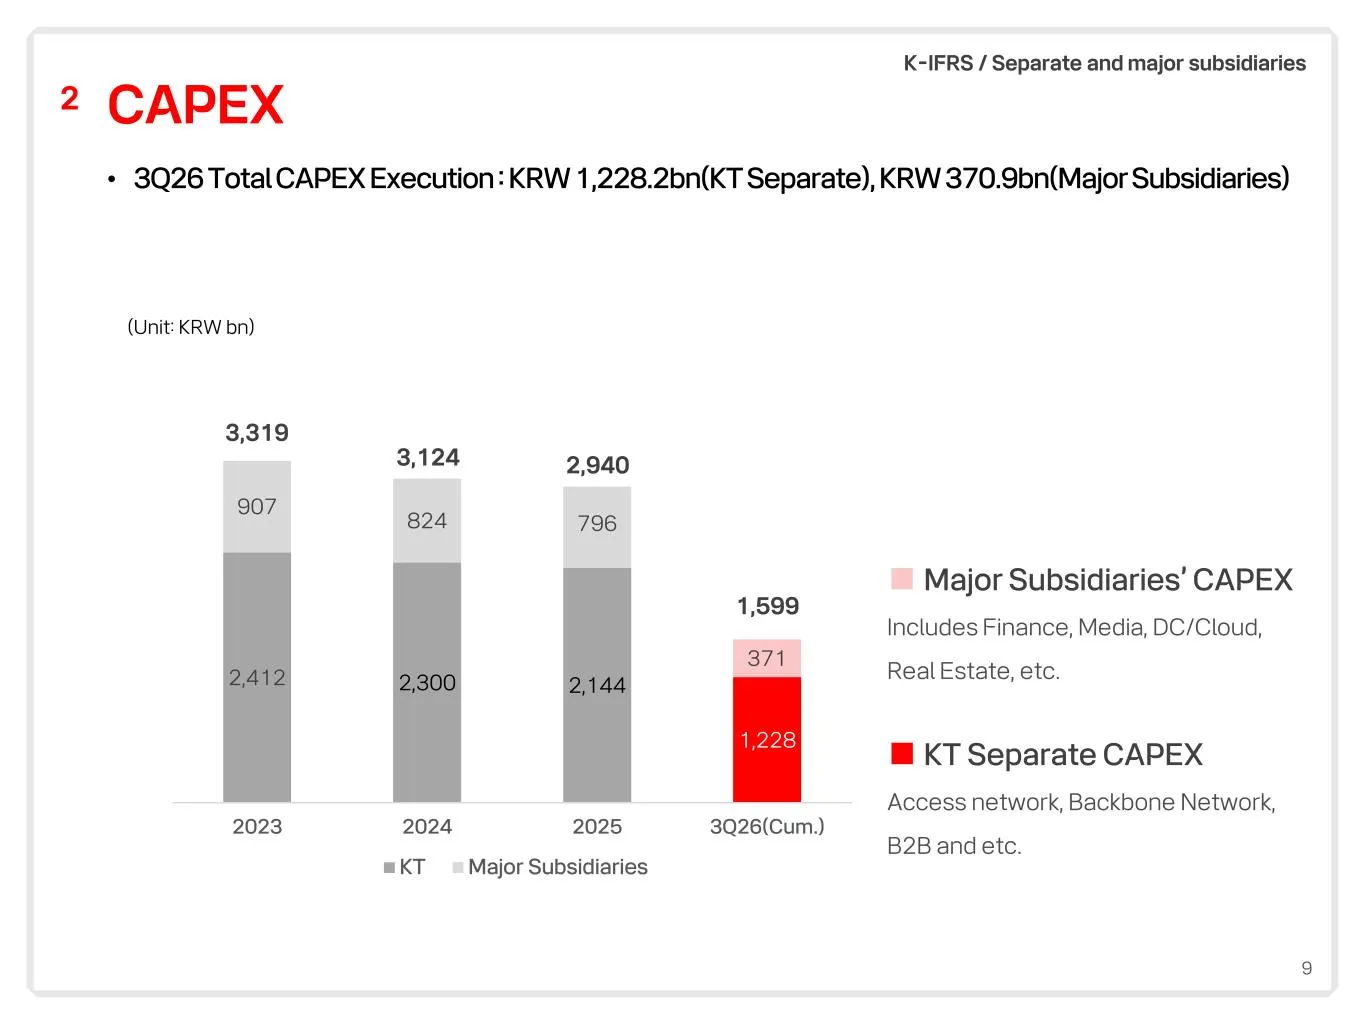
9 CAPEX • 3Q26 Total CAPEX Execution : KRW 1,228.2bn(KT Separate), KRW 370.9bn(Major Subsidiaries) 2 (Unit: KRW bn) 2,412 2,300 2,144 1,228 907 824 796 371 2023 2024 2025 3Q26(Cum.) KT Major Subsidiaries 3,319 3,124 2,940 1,599 ■ Major Subsidiaries’ CAPEX Includes Finance, Media, DC/Cloud, Real Esta
Slide 10: Business Overview
1 3Q26 Highlights 2 Financial Highlights 3 Business Overview 4 Appendix Contents
Slide 11: KT - Wireless
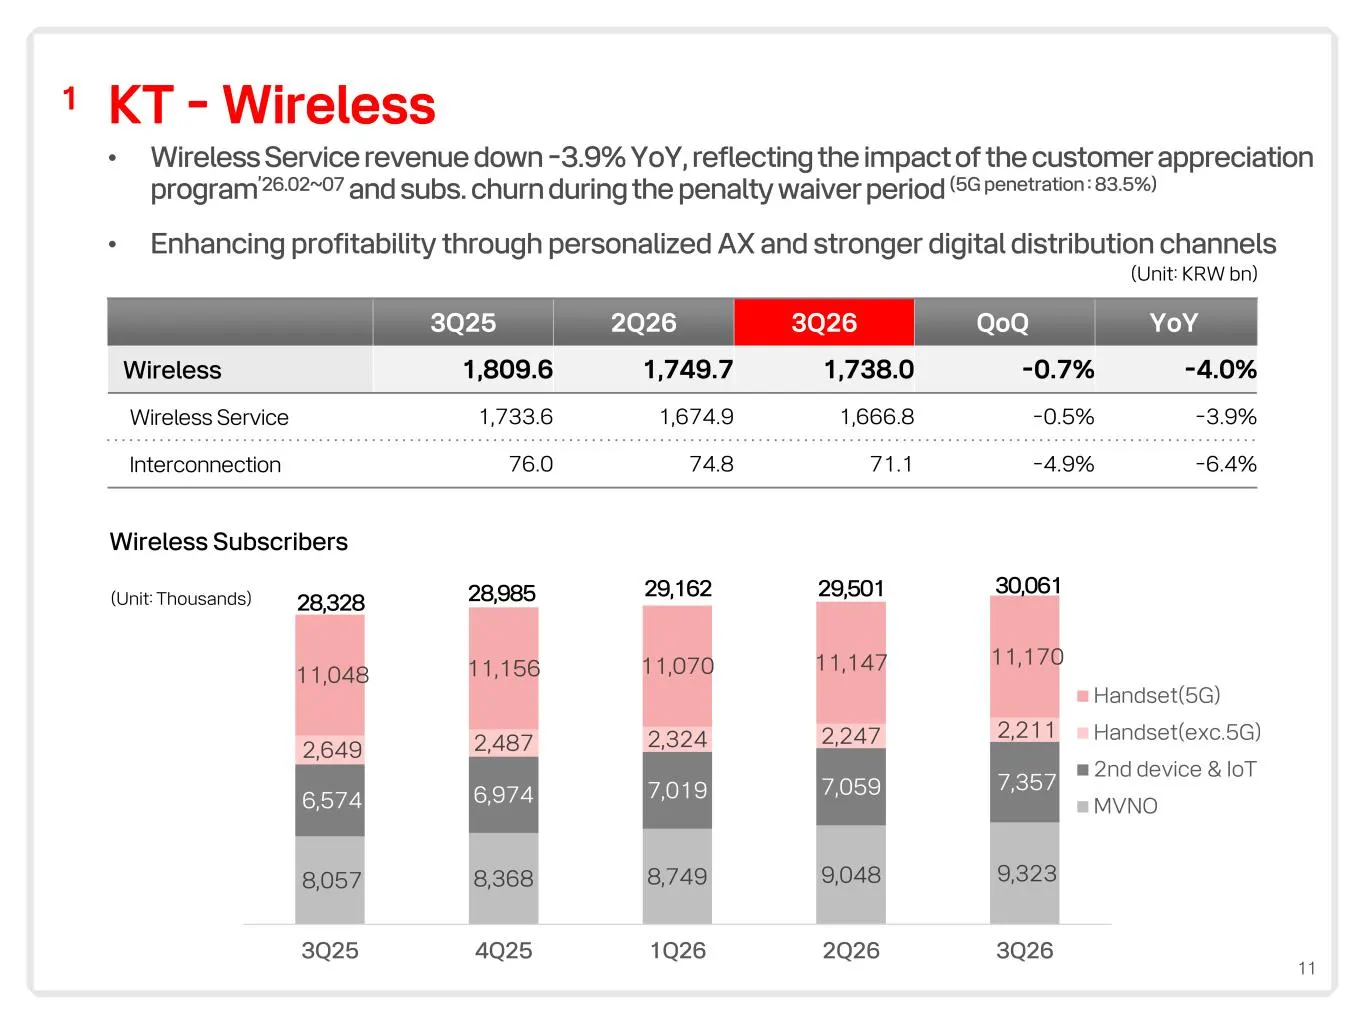
11 KT - Wireless • Wireless Service revenue down -3.9% YoY, reflecting the impact of the customer appreciation program’26.02~07 and subs. churn during the penalty waiver period (5G penetration : 83.5%) • Enhancing profitability through personalized AX and stronger digital distribution channels 1 (Un
Slide 12: KT – Fixed Line
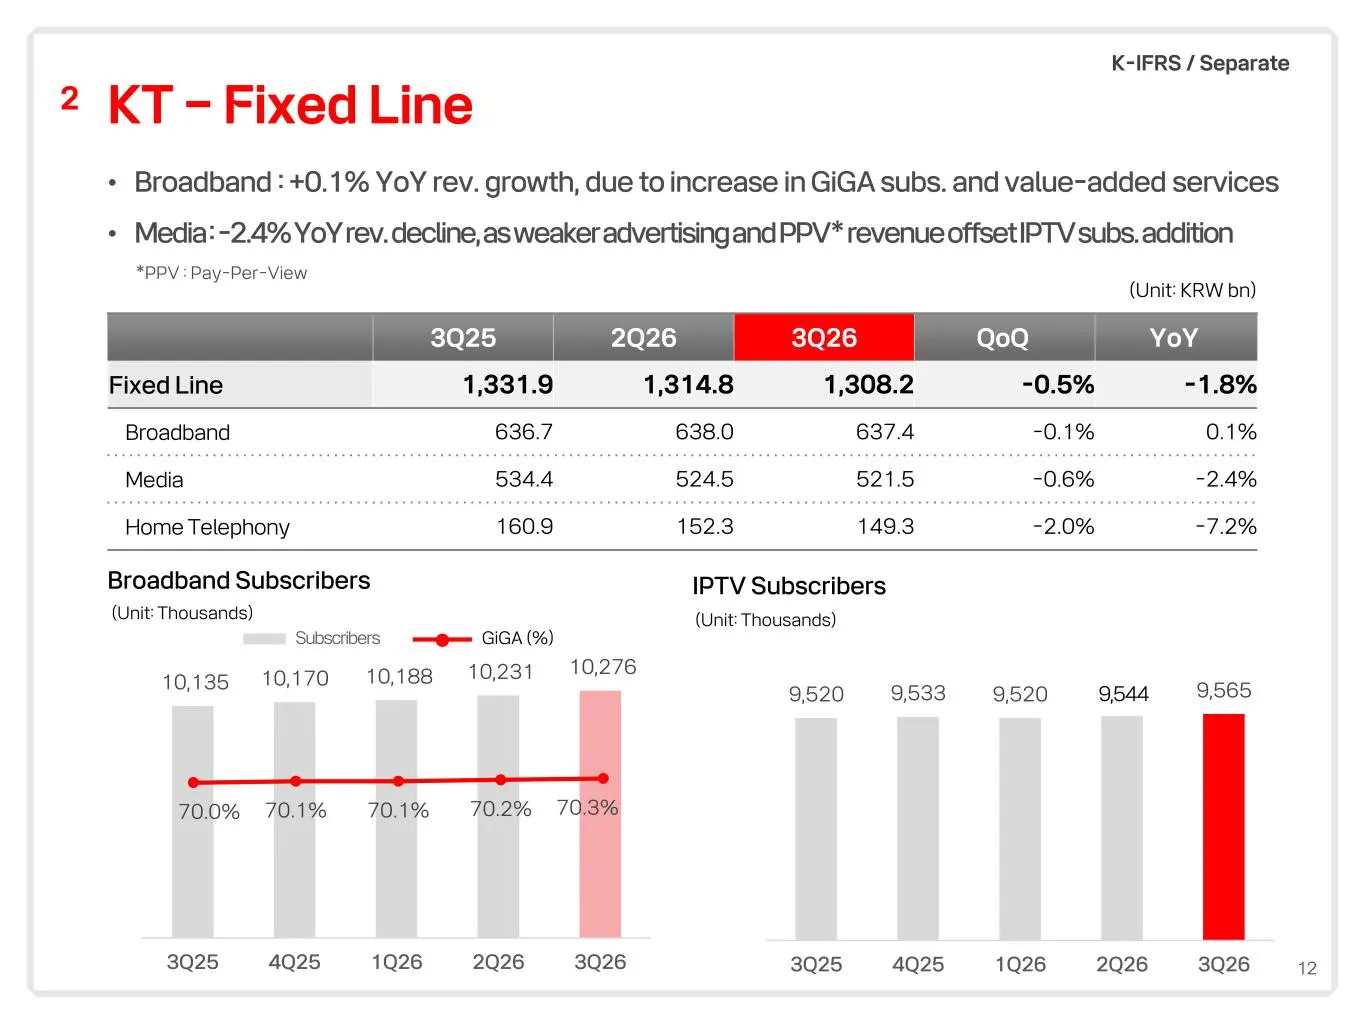
12 KT – Fixed Line2 3Q25 2Q26 3Q26 QoQ YoY Fixed Line 1,331.9 1,314.8 1,308.2 -0.5% -1.8% Broadband 636.7 638.0 637.4 -0.1% 0.1% Media 534.4 524.5 521.5 -0.6% -2.4% Home Telephony 160.9 152.3 149.3 -2.0% -7.2% 10,135 10,170 10,188 10,231 10,276 3Q25 4Q25 1Q26 2Q26 3Q26 70.0% 70.1% 70.1% 70.2% 70.3%
Slide 13: KT – B2B Services
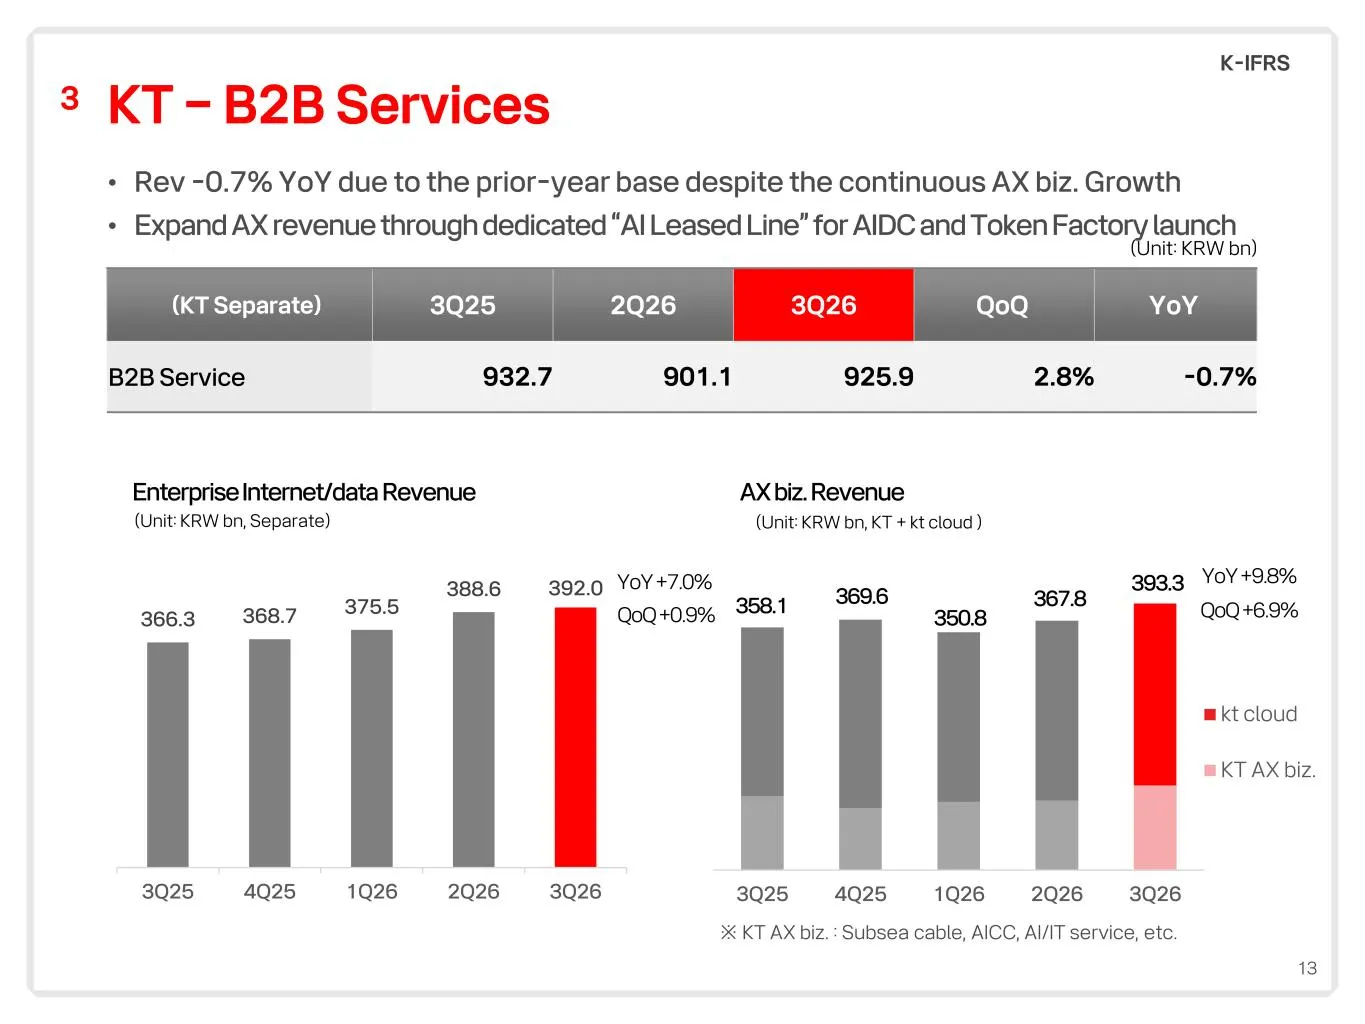
13 KT – B2B Services • Rev -0.7% YoY due to the prior-year base despite the continuous AX biz. Growth • Expand AX revenue through dedicated “AI Leased Line” for AIDC and Token Factory launch 3 Enterprise Internet/data Revenue AX biz. Revenue (KT Separate) 3Q25 2Q26 3Q26 QoQ YoY B2B Service 932.7 901
Slide 14: Major Subsidiaries
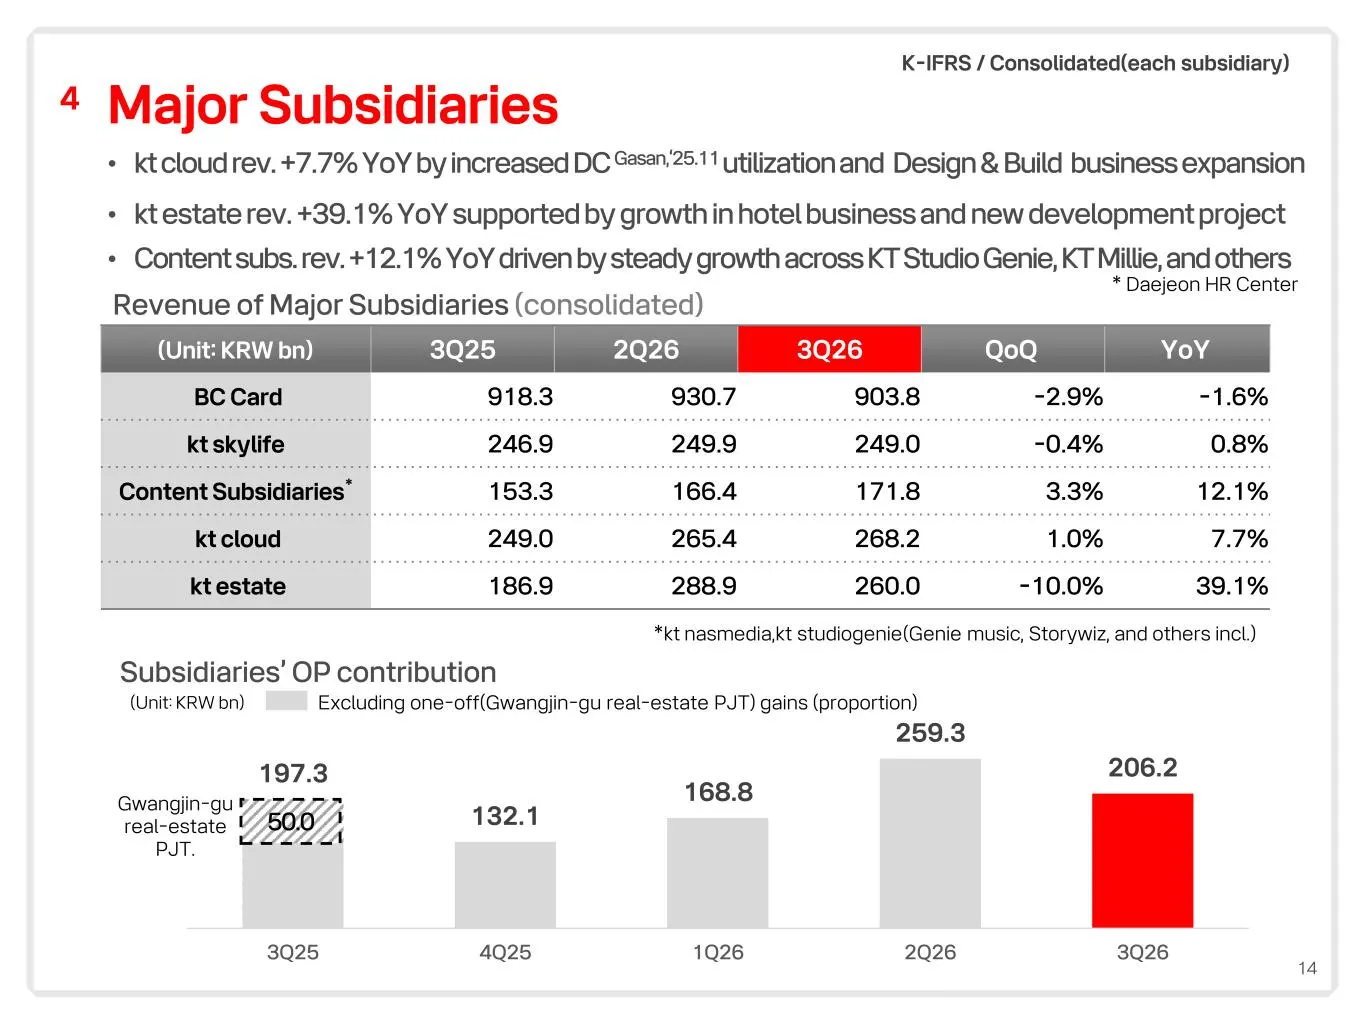
14 Major Subsidiaries4 • kt cloud rev. +7.7% YoY by increased DC Gasan,‘25.11 utilization and Design & Build business expansion • kt estate rev. +39.1% YoY supported by growth in hotel business and new development project • Content subs. rev. +12.1% YoY driven by steady growth across KT Studio Genie
Slide 15: Appendix
1 3Q26 Highlights 2 Financial Highlights 3 Business Overview 4 Appendix Contents
Slide 16: K-IFRS Income Statement
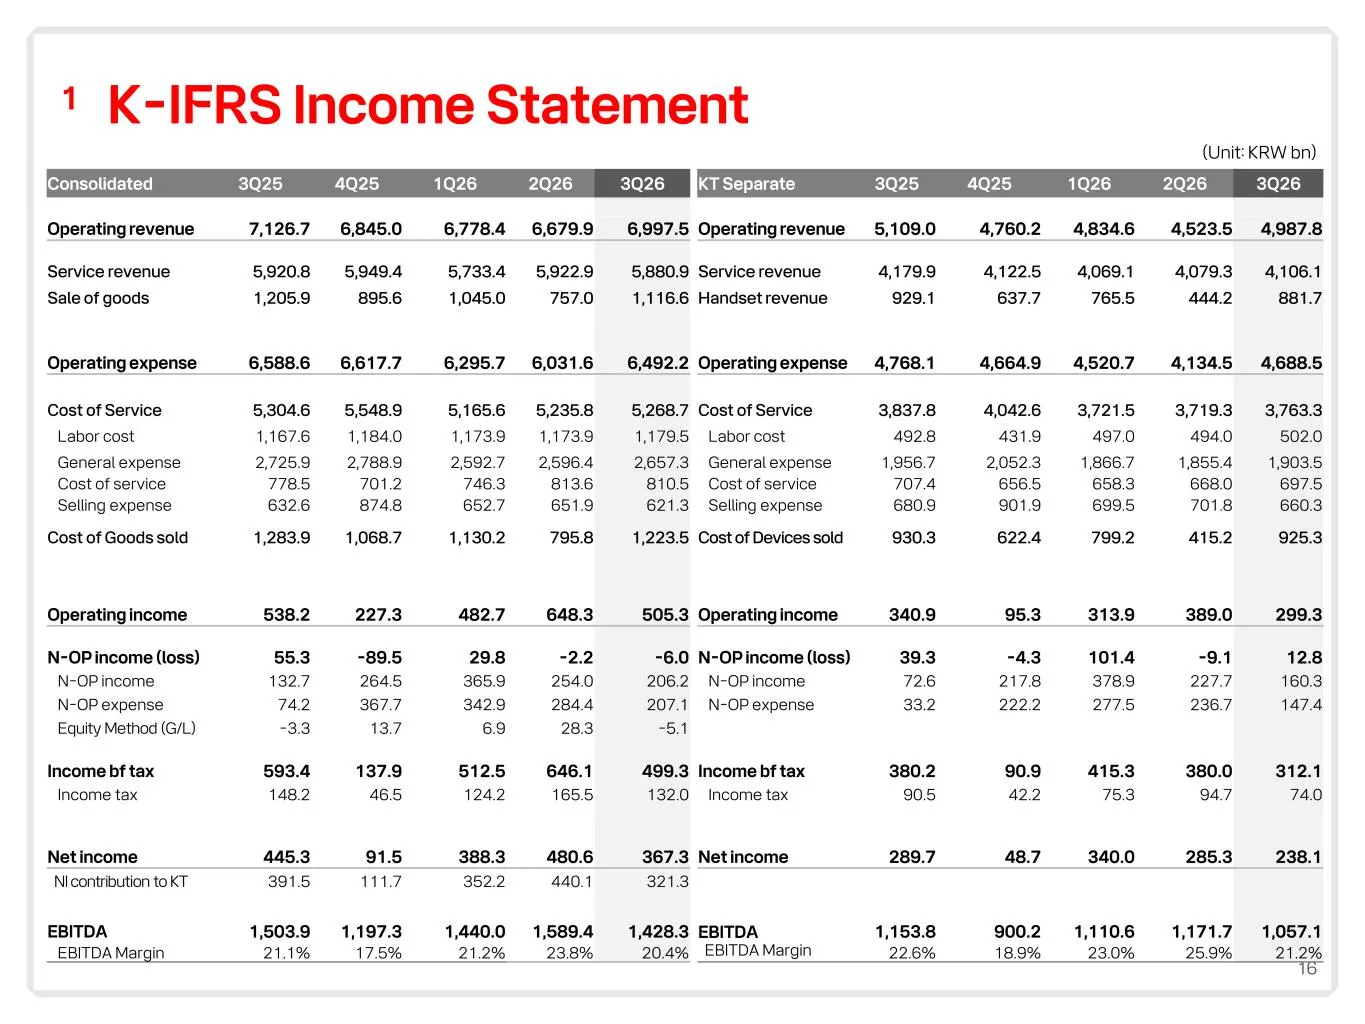
16 K-IFRS Income Statement1 Consolidated 3Q25 4Q25 1Q26 2Q26 3Q26 KT Separate 3Q25 4Q25 1Q26 2Q26 3Q26 Operating revenue 7,126.7 6,845.0 6,778.4 6,679.9 6,997.5 Operating revenue 5,109.0 4,760.2 4,834.6 4,523.5 4,987.8 Service revenue 5,920.8 5,949.4 5,733.4 5,922.9 5,880.9 Service revenue 4,179.9 4
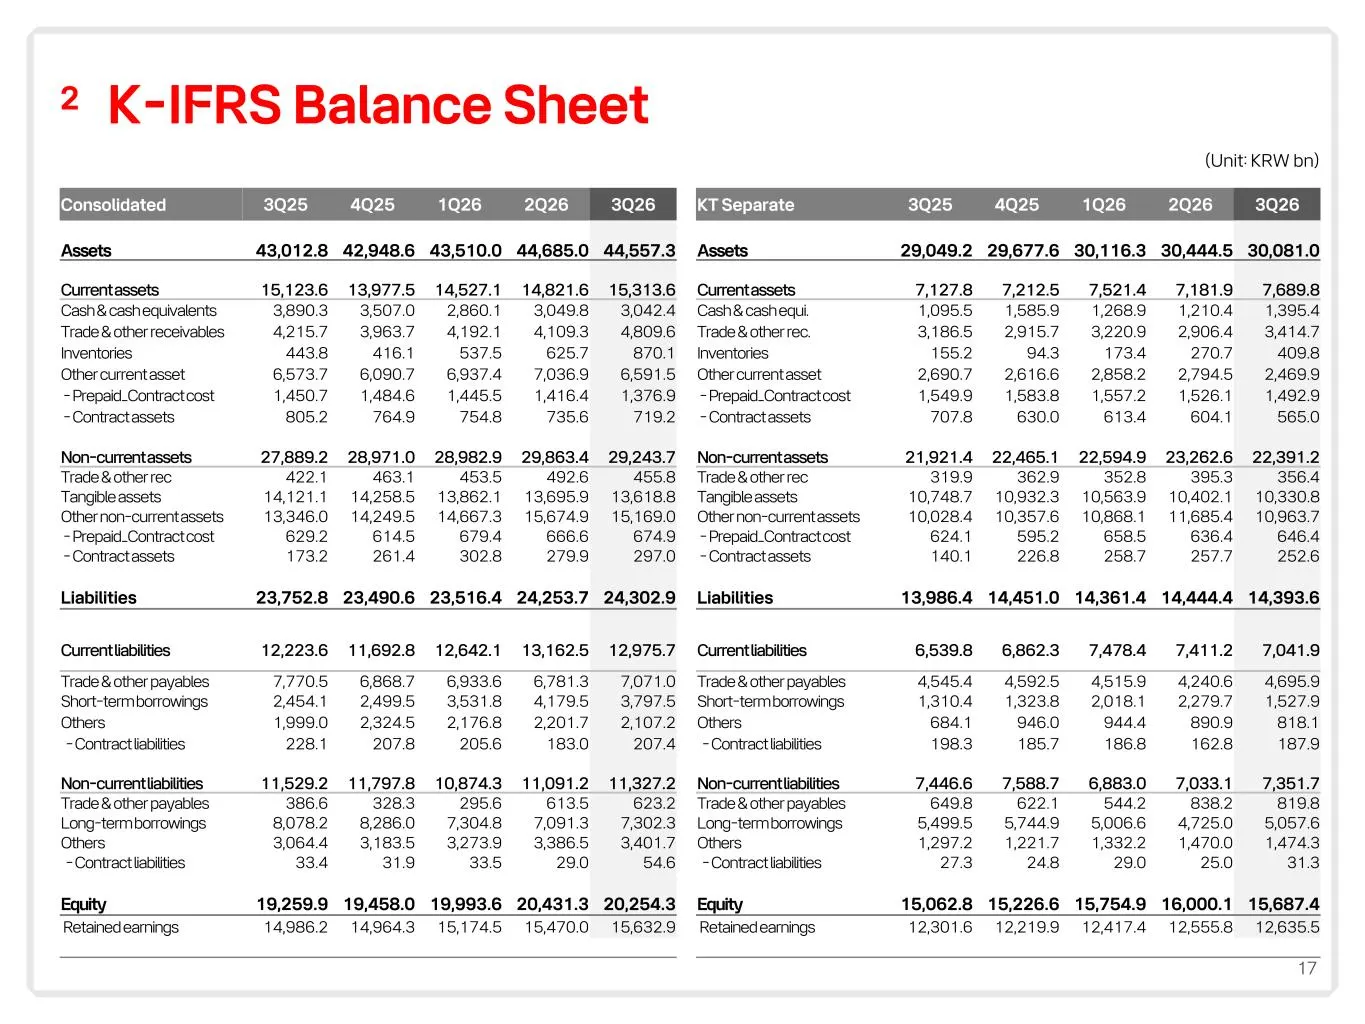
Slide 17: K-IFRS Balance Sheet
17 K-IFRS Balance Sheet2 Consolidated 3Q25 4Q25 1Q26 2Q26 3Q26 KT Separate 3Q25 4Q25 1Q26 2Q26 3Q26 Assets 43,012.8 42,948.6 43,510.0 44,685.0 44,557.3 Assets 29,049.2 29,677.6 30,116.3 30,444.5 30,081.0 Current assets 15,123.6 13,977.5 14,527.1 14,821.6 15,313.6 Current assets 7,127.8 7,212.5 7,521
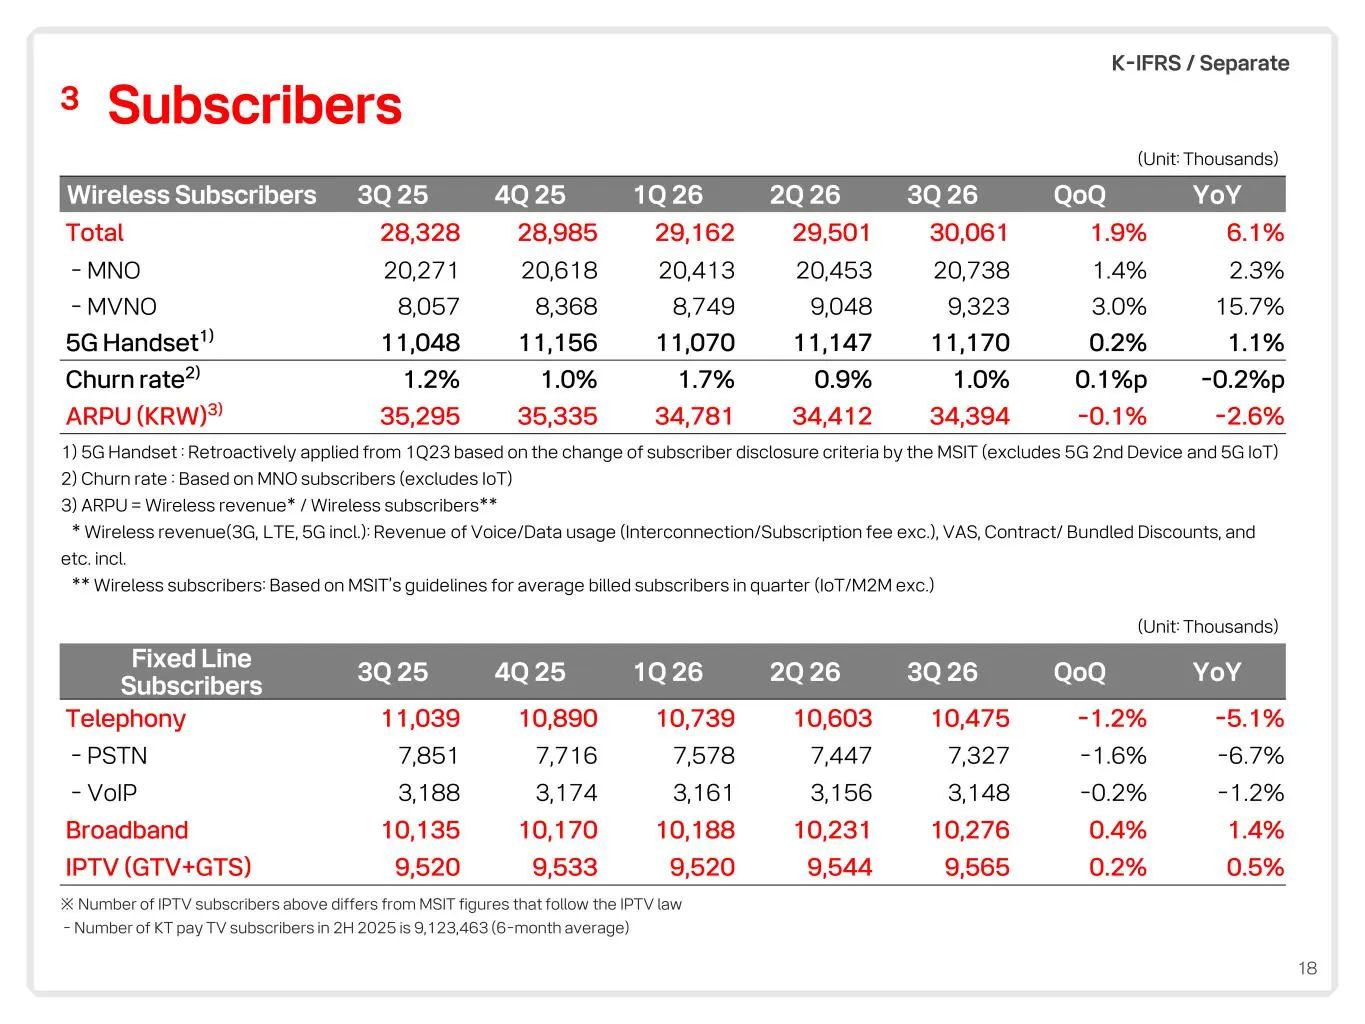
Slide 18: Subscribers
18 Subscribers3 Wireless Subscribers 3Q 25 4Q 25 1Q 26 2Q 26 3Q 26 QoQ YoY Total 28,328 28,985 29,162 29,501 30,061 1.9% 6.1% - MNO 20,271 20,618 20,413 20,453 20,738 1.4% 2.3% - MVNO 8,057 8,368 8,749 9,048 9,323 3.0% 15.7% 5G Handset1) 11,048 11,156 11,070 11,147 11,170 0.2% 1.1% Churn rate2) 1.2%

Slide 19
Source: SEC EDGAR · 6-K filed Nov 10, 2026
More decks from KT Corporation
 Investor Presentation (August 2026)24 slides · Aug 12, 2026
 Q2 2026 Earnings Presentation18 slides · Aug 12, 2026
 Q1 2026 Earnings Presentation19 slides · May 12, 2026
 Q4 2025 Earnings Presentation21 slides · Feb 10, 2026
 Investor Presentation (November 2025)24 slides · Nov 12, 2025
 Q3 2025 Earnings Presentation20 slides · Nov 10, 2025