Airtran — Calyon Airline Conference 2007
21 slides from Airtran's conference presentation, Dec 5, 2007
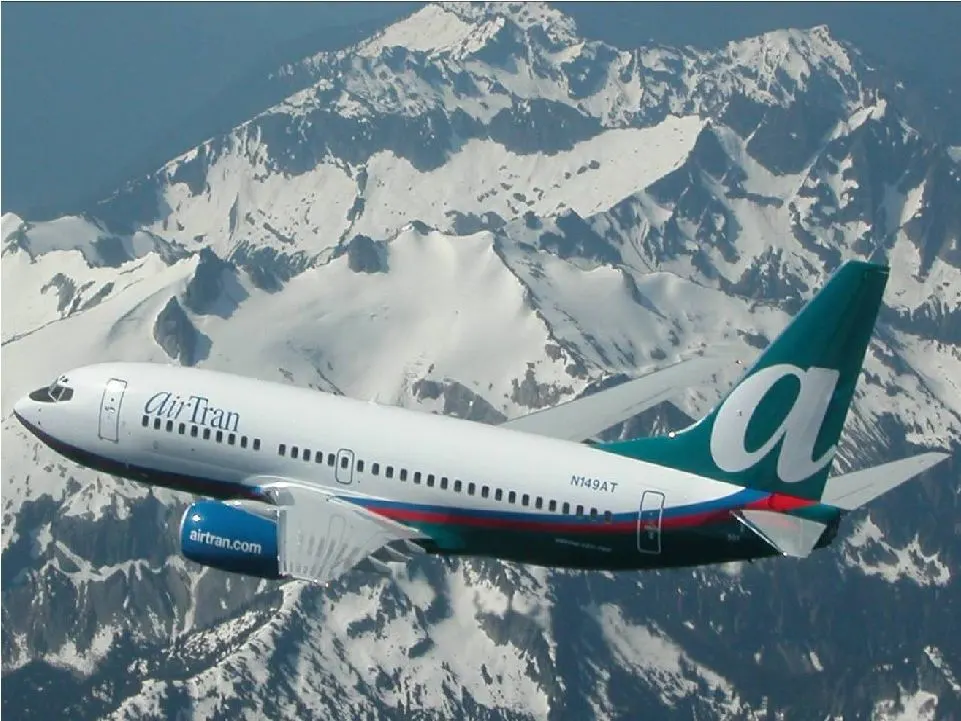
Slide 1: Calyon Airline Conference December 4, 2007
Calyon Airline Conference December 4, 2007 Calyon Airline Conference December 4, 2007 Exhibit 99.1
Slide 2: Safe Harbor
2 Safe Harbor Safe Harbor Certain of the statements contained herein should be considered “forward-looking statements,” including within the meaning of the Private Securities Litigation Reform Act of 1995. These forward-looking statements may be identified by words such as “may”, “will”, “expect,” “
Slide 3: AirTran Airways Profile
3 Youngest all-Boeing fleet in America 55 cities served Very low costs Consistent record of profitability Total Aircraft: 2007 2006 AirTran Airways Profile AirTran Airways Profile
Slide 4: AirTran Airways Business Model
4 To provide a superior product with very low costs — Assigned seating — Business class Only major U.S. airline with business class on every flight — Convenient distribution Internet, telephone reservations, and travel agencies — XM Radio and oversized luggage bins — Friendly crewmembers Provide val
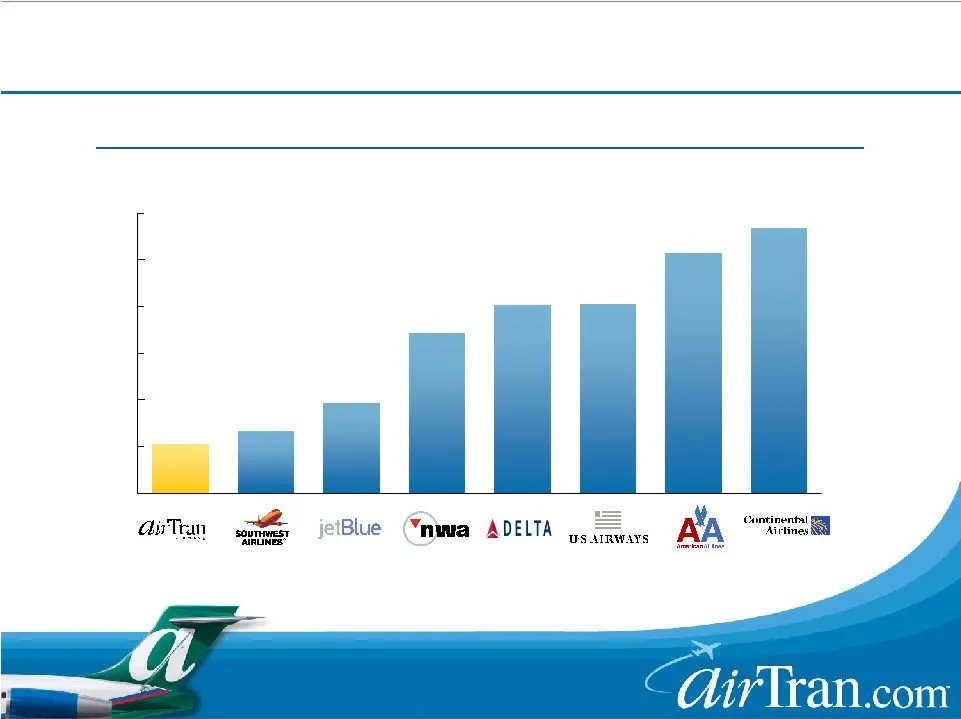
Slide 5: AirTran Has Very Low Costs
5 (cents) While legacy costs are down, gap remains large * Excludes fuel and special items Industry Cost Comparison Non-Fuel Unit Costs at 685 Miles for 1H 2007 AirTran Has Very Low Costs AirTran Has Very Low Costs
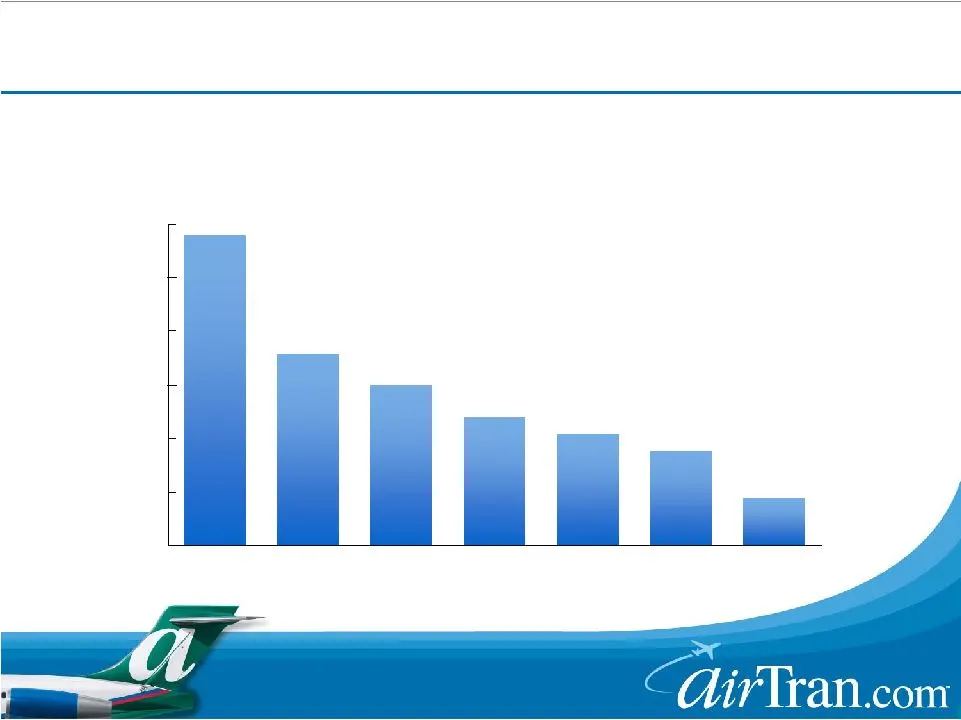
Slide 6: AirTran's Non-Fuel Unit Cost Trend
6 5.75 6.00 6.25 6.50 6.75 7.00 7.25 2001 2002 2003 2004 2005 2006 2007E * Excludes non-recurring special items (cents per mile) AirTran’s Non-Fuel Unit Cost Trend Projecting A Sixth Consecutive Year Of Cost Reductions Projecting A Sixth Consecutive Year Of Cost Reductions
Slide 7: How We Have Maintained Our Low Cost Advantage
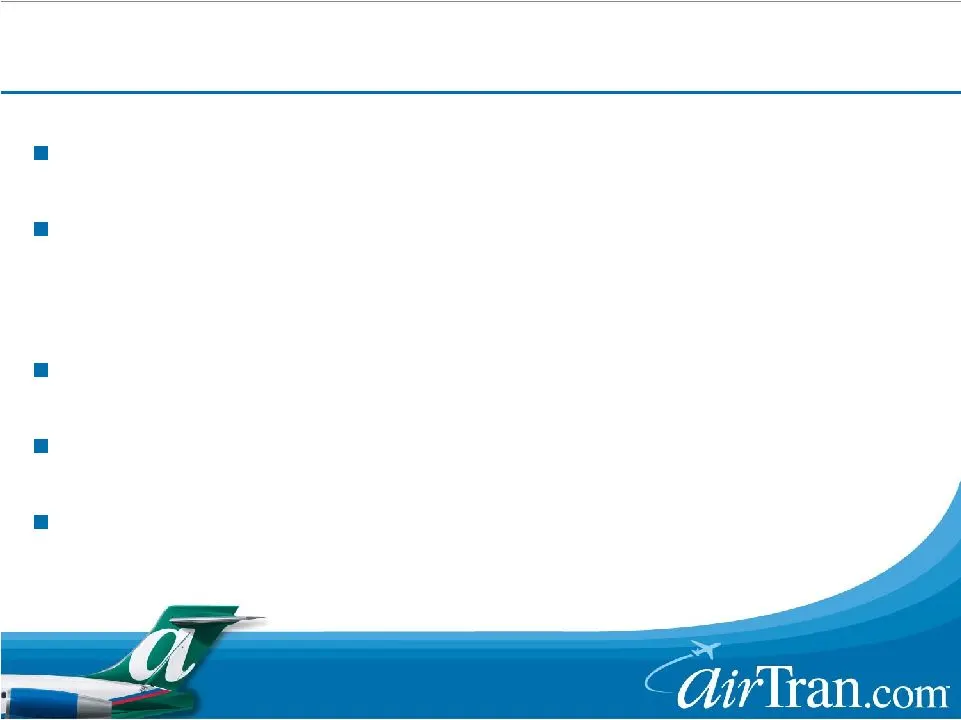
7 Productive workforce at all levels Young, simplified fleet — Fuel efficient — Attractive ownership costs Efficient use of facilities Competition for heavy maintenance contracts Low cost distribution — Over 70% of sales are directly with AirTran (Reservations or Airtran.com) How We Have Maintained
Slide 8: Operational Quality Excels In 2007
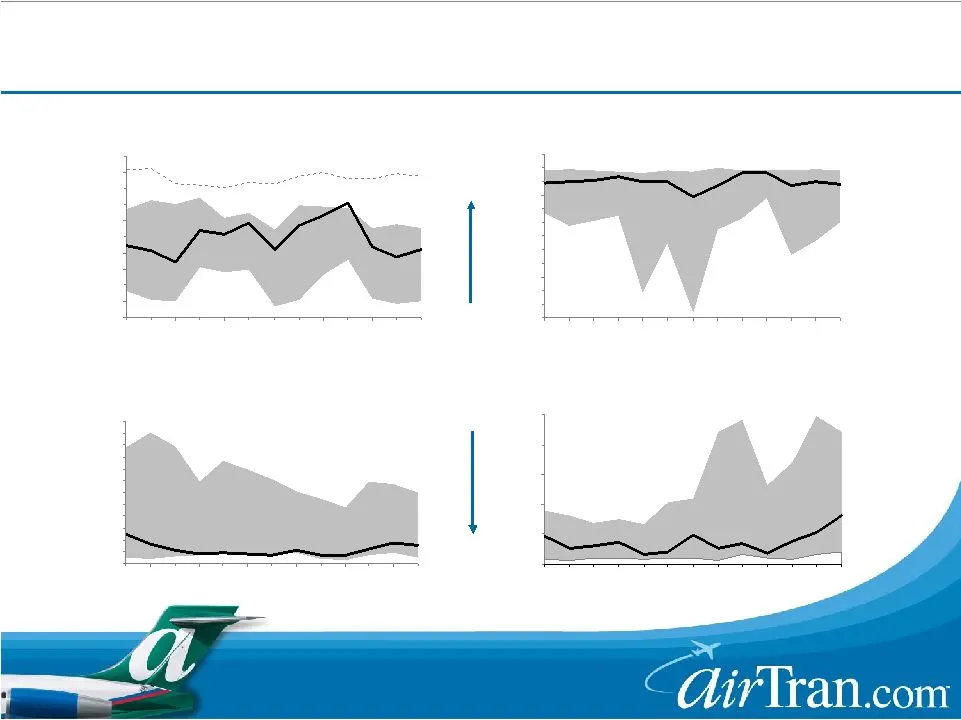
8 On-Time Arrivals Hawaiian 50% 55% 60% 65% 70% 75% 80% 85% 90% 95% 100% A S O N D J F M A M J J A Completion Factor 89% 90% 91% 92% 93% 94% 95% 96% 97% 98% 99% 100% 101% A S O N D J F M A M J J A Mishandled Baggage per 1,000 Passengers A S O N D J F M A M J J A Consumer Complaints per 100,000 Enpla
Slide 9: AirTran Quality Ranks Among The Best
9 0.82 0.65 Consumer Complaints (100K Enplanements) 4.09 4.81 Mishandled Baggage (1K Passengers) 99.0% 99.2% Completion Factor 77.2% 74.6% On-Time Arrival A14 2007 YTD Major Carrier Rank YTD 2007 2006 AirTran Quality Ranks Among The Best AirTran Quality Ranks Among The Best
Slide 10: AirTran Moving Forward – Sticking With Plan A
10 Continue profitable growth Superior costs, going lower Strengthening position in key markets Opportunistic mindset Continually improving brand / quality service AirTran Moving Forward – AirTran Moving Forward – Sticking With “Plan A” Sticking With “Plan A”
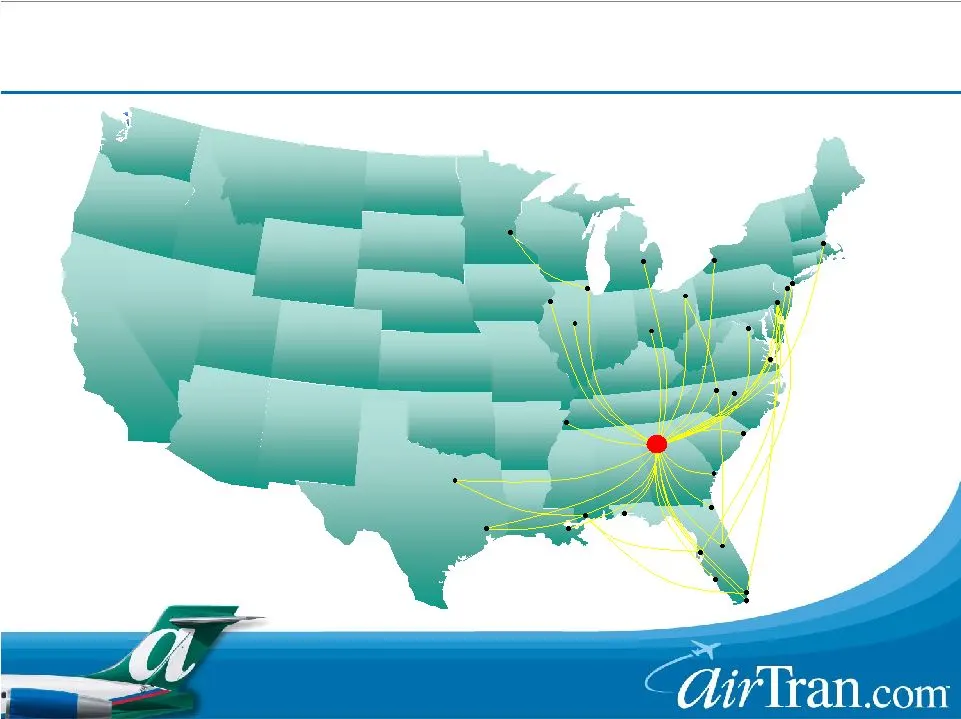
Slide 11: AirTran Route Map – August 2000
11 AirTran Route Map – AirTran Route Map – August 2000 August 2000 Boston Boston Buffalo Buffalo Newark Newark New York City New York City Philadelphia Philadelphia Washington, D.C. (IAD) Washington, D.C. (IAD) Newport News Newport News Dayton Dayton Ft. Lauderdale Ft. Lauderdale New Orleans New Orl
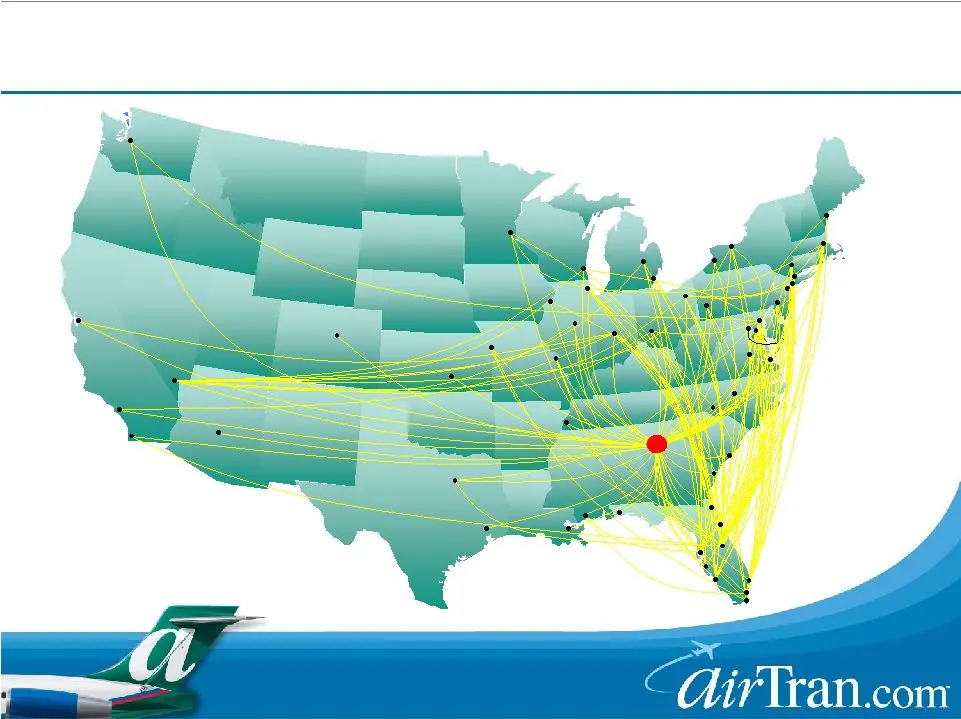
Slide 12: AirTran Route Map – November 2007
12 AirTran Route Map – AirTran Route Map – November 2007 November 2007 Portland Portland Denver Denver Las Vegas Las Vegas Seattle Seattle Phoenix Phoenix Boston Boston Rochester Rochester Ft. Lauderdale Ft. Lauderdale West Palm Beach West Palm Beach Miami Miami Gulfport/Biloxi Gulfport/Biloxi New O
Slide 13: Network Breadth Drives Cost And Revenue Efficiencies
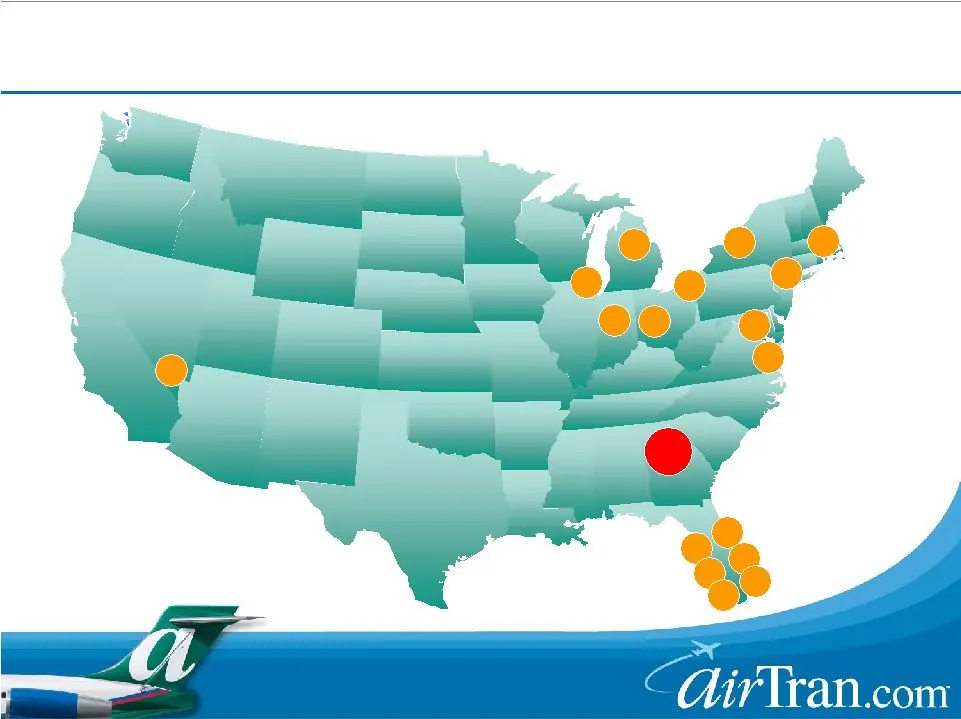
13 53 Orlando Orlando Atlanta Atlanta Baltimore Baltimore Tampa Tampa West Palm Beach West Palm Beach Newport News Newport News Akron / Akron / Canton Canton Boston Boston Ft. Lauderdale Ft. Lauderdale Indianapolis Indianapolis Chicago Chicago Network Breadth Drives Cost And Revenue Efficiencies Net
Slide 14: AirTran Operates The World's Largest Low Cost Hub
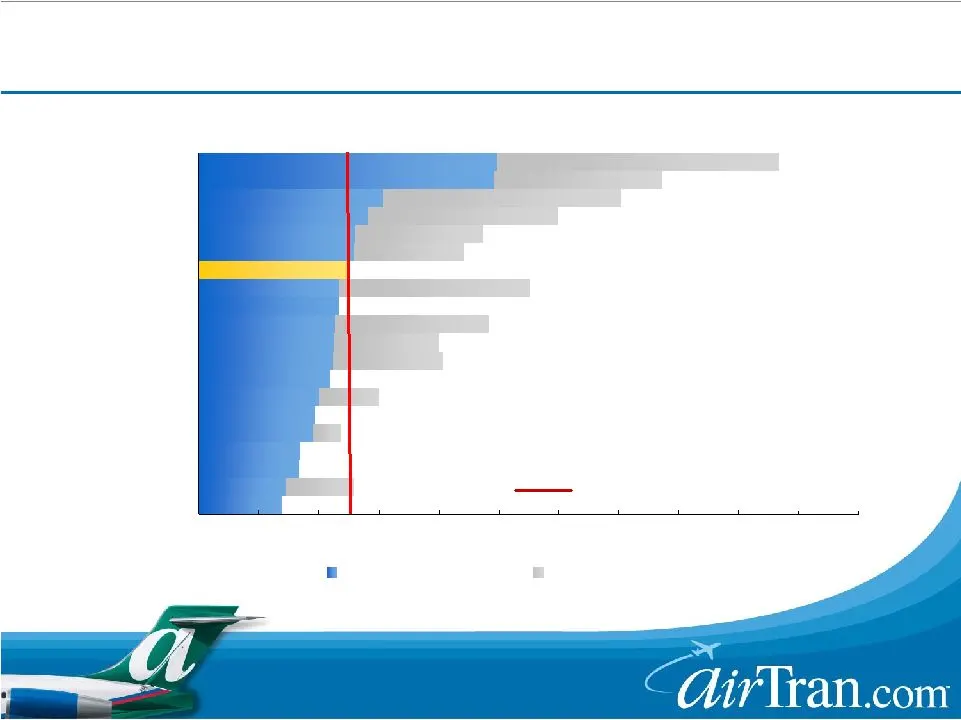
14 1,000 1,100 LUV - Houston UAUA - San Francisco LUV - Baltimore JBLU - New York AMR - Miami LUV - Phoenix LCC - Phoenix LUV - Chicago UAUA - Denver CAL - Newark AMR - Chicago LUV - Las Vegas LCC - Charlotte AAI - Atlanta NWA - Minneapolis NWA - Detroit UAUA - Chicago CAL - Houston AMR - Dallas DAL
Slide 15: Recent Fleet Actions To Improve Cash Flow
15 Restructured 737 delivery schedule — Fall 2006 - 8 aircraft from 2007/08 to 2009-2011 — April 2007 - sold 2 aircraft — June 2007 - 6 aircraft from 2008/09 to 2011 — Fall 2007 - 3 aircraft from 2008 to 2011 In light of $85+ crude oil, further fleet actions under review Recent Fleet Actions To Impr
Slide 16: Current Fleet Plan Creates Manageable Growth Rate
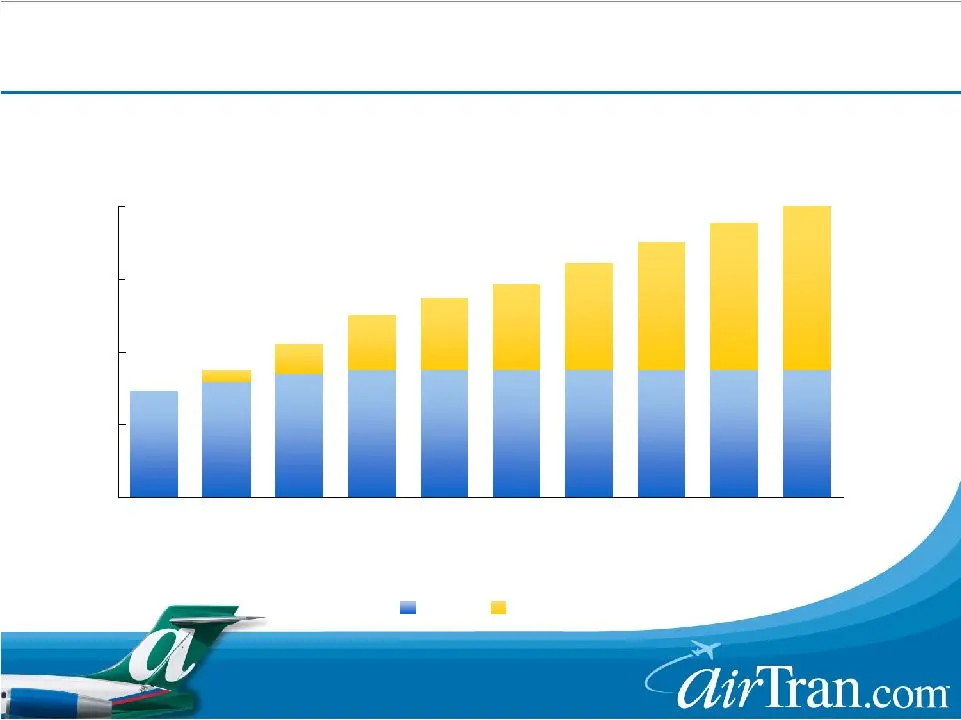
16 2003 2004 2005 2006 2007 2008 2009 2010 2011 2012 717s 737s Aircraft Currently 137 Aircraft: 87 717s / 50 737s 8% 9% 10% 9% 11% 20% 24% 28% 19% 22% ASM Growth Current Fleet Plan Creates Manageable Growth Rate Current Fleet Plan Creates Manageable Growth Rate
Slide 17: RASM Improves As Growth Rate Slows Down
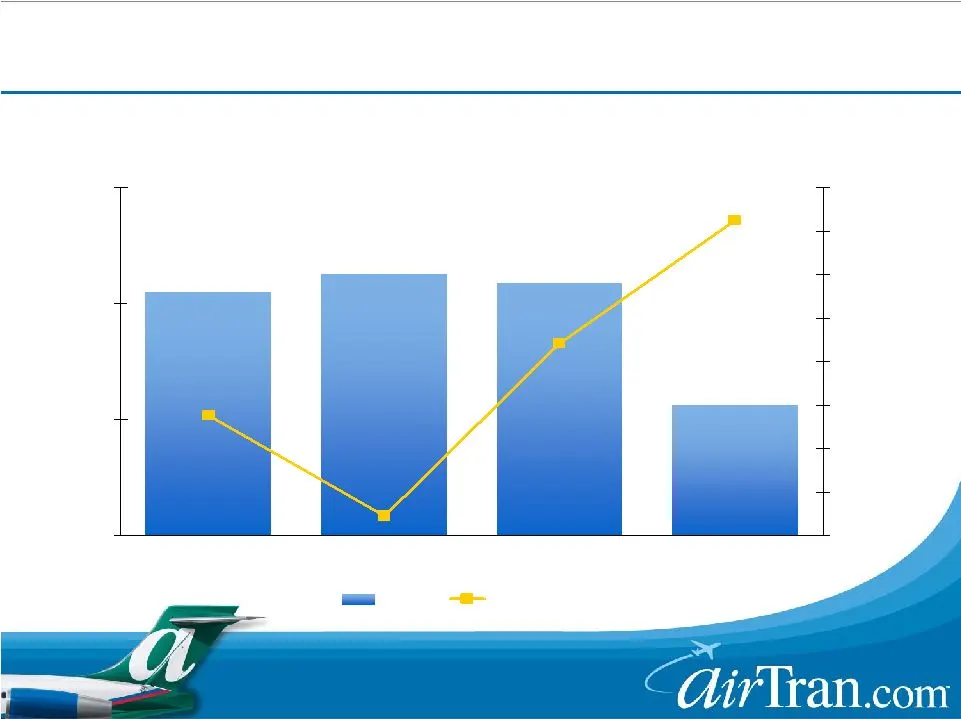
17 -0.5% 2.8% -5.1% 20.5% 21.3% 20.9% 15.6% 8% - 9% 10% 15% 20% 25% Q107 Q207 Q307 Q407 -6% -4% -2% 0% 2% 4% 6% 8% 10% ASMs PAX RASM ASM Growth RASM Improves As Growth Rate Slows Down RASM Improves As Growth Rate Slows Down PAX RASM Growth
Slide 18: Taking Steps To Compete In A Different Environment
18 Capacity reductions Continued cost discipline Recent fare increases / fuel surcharges Taking Steps To Compete In A Different Environment Taking Steps To Compete In A Different Environment
Slide 19: Industry M&A Would Be Favorable To AirTran
19 Any combination will provide benefits — Domestic capacity reductions due to network redundancies Well positioned to take advantage of divestitures Will likely result in a wider cost advantage for AirTran Industry M&A Would Be Favorable To AirTran Industry M&A Would Be Favorable To AirTran
Slide 20: Summary
20 AirTran has solid fundamentals — Young fleet — Very low costs going lower — Strong network Capacity discipline is supportive of improved revenue growth Taking steps to compete in a difficult environment Industry M&A would create additional opportunities Summary Summary
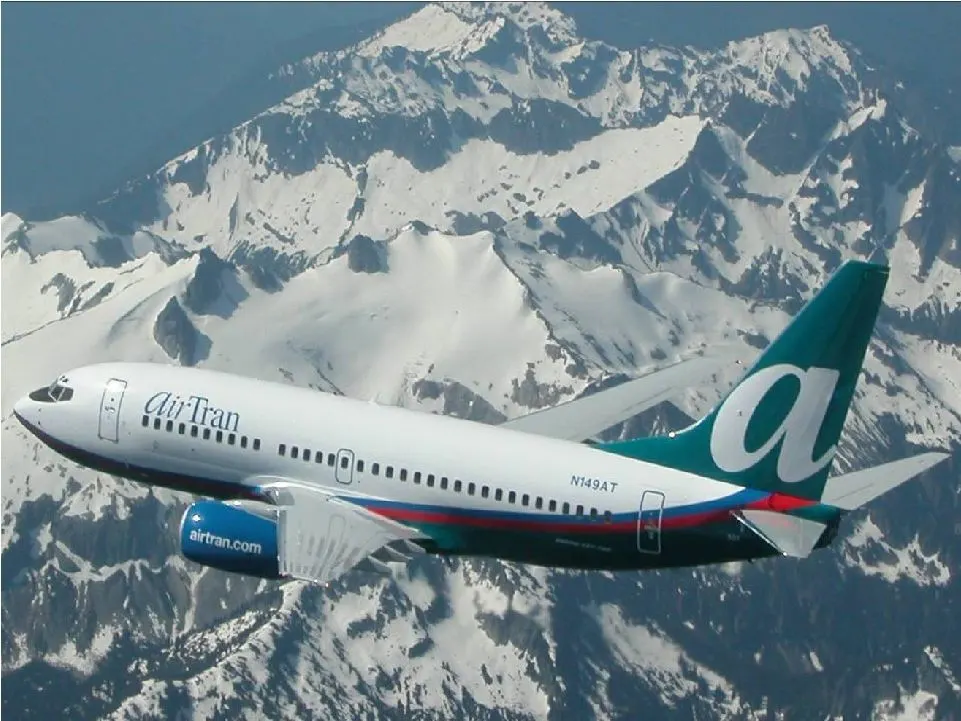
Slide 21
Source: SEC EDGAR · 8-K filed Dec 5, 2007
More decks from Airtran Holdings Inc
 Merger or Acquisition (September 2010)21 slides · Sep 27, 2010
 Bank of America - Merrill Lynch Global Transportation Conference 201025 slides · Jun 15, 2010
 Shareholder Meeting (May 2010)33 slides · May 18, 2010
 Investor Presentation (May 2010)26 slides · May 13, 2010
 JP Morgan Aviation, Transportation and Defense Conference 201025 slides · Mar 9, 2010
 Raymond James 2010 Growth Airline Conference25 slides · Feb 4, 2010