Southern Union — Wachovia Securities Houston (May 2006)
36 slides from Southern Union's conference presentation, May 16, 2006

Slide 1: Wachovia Securities
Wachovia Securities Houston May 16, 2006 www.sug.com
Slide 2: Trunkline LNG History
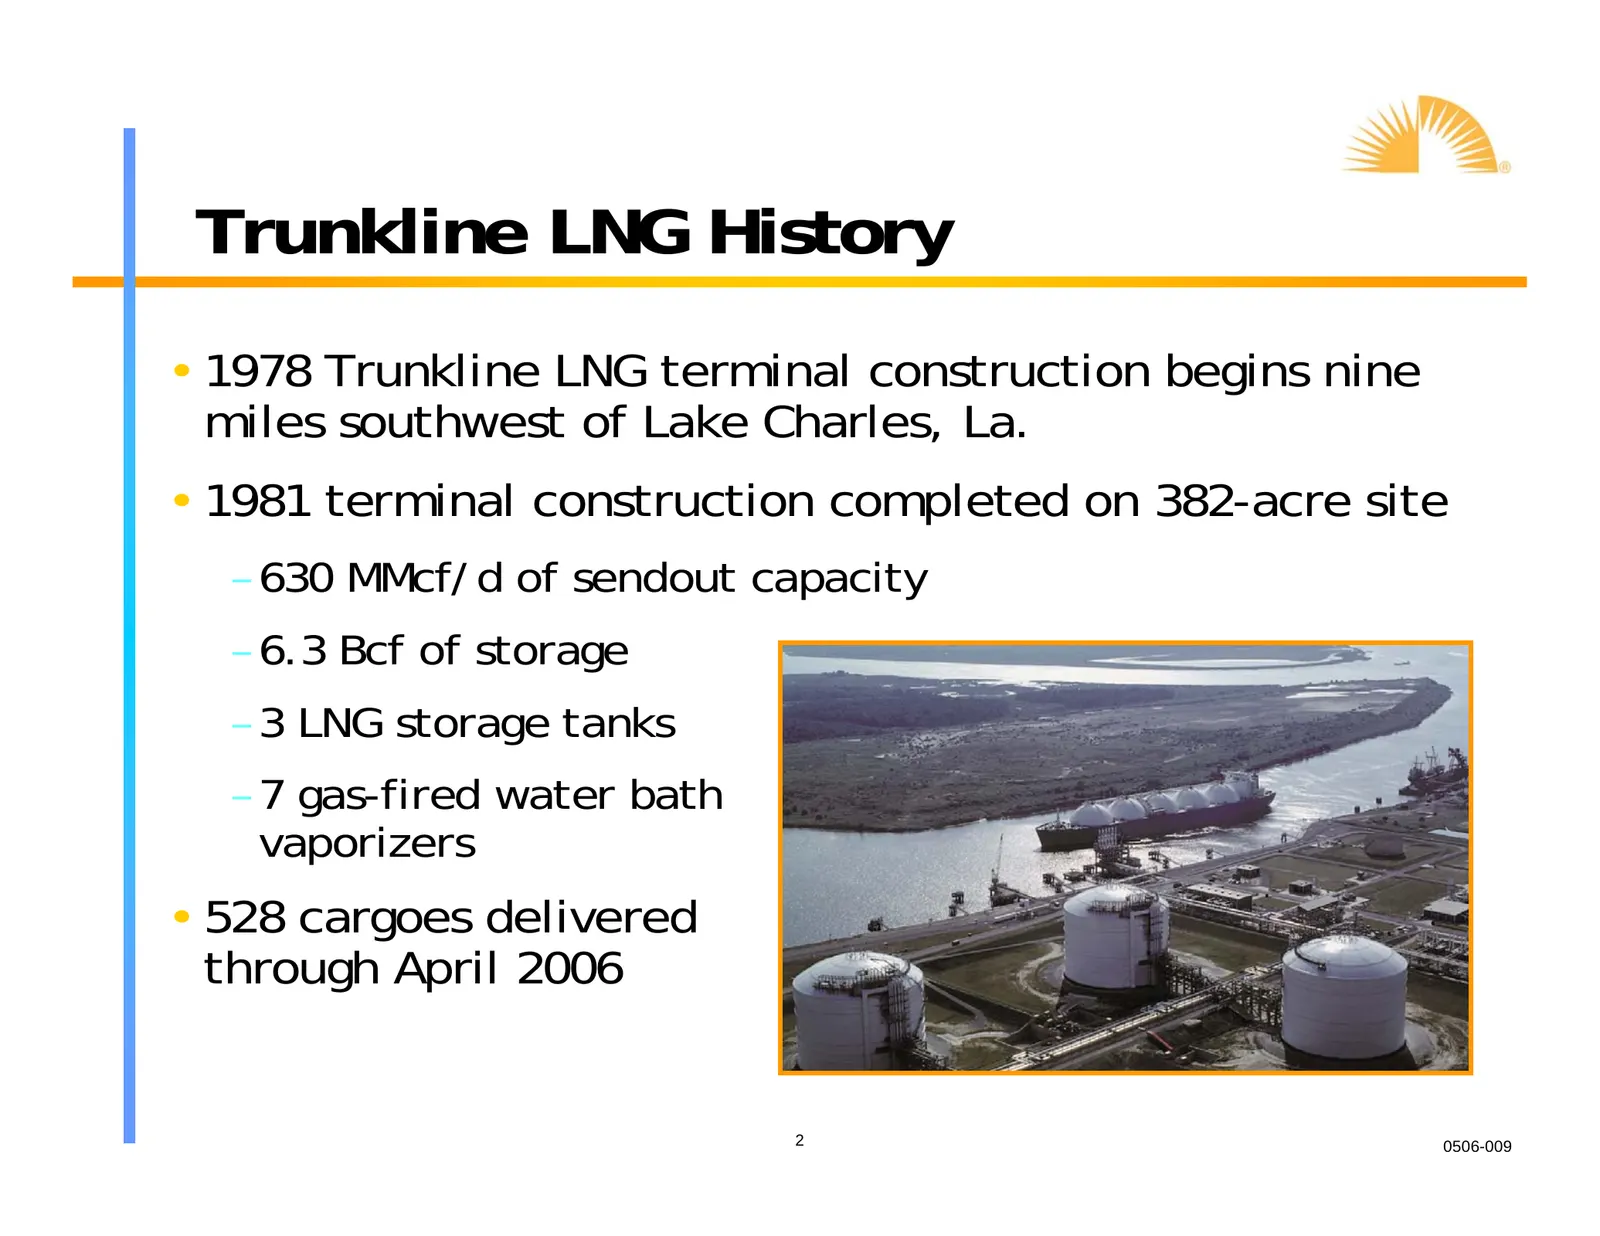
Trunkline LNG History • 1978 Trunkline LNG terminal construction begins nine miles southwest of Lake Charles, La. • 1981 terminal construction completed on 382-acre site – 630 MMcf/d of sendout capacity – 6.3 Bcf of storage – 3 LNG storage tanks – 7 gas-fired water bath vaporizers • 528 cargoes deli
Slide 3: Trunkline LNG Company
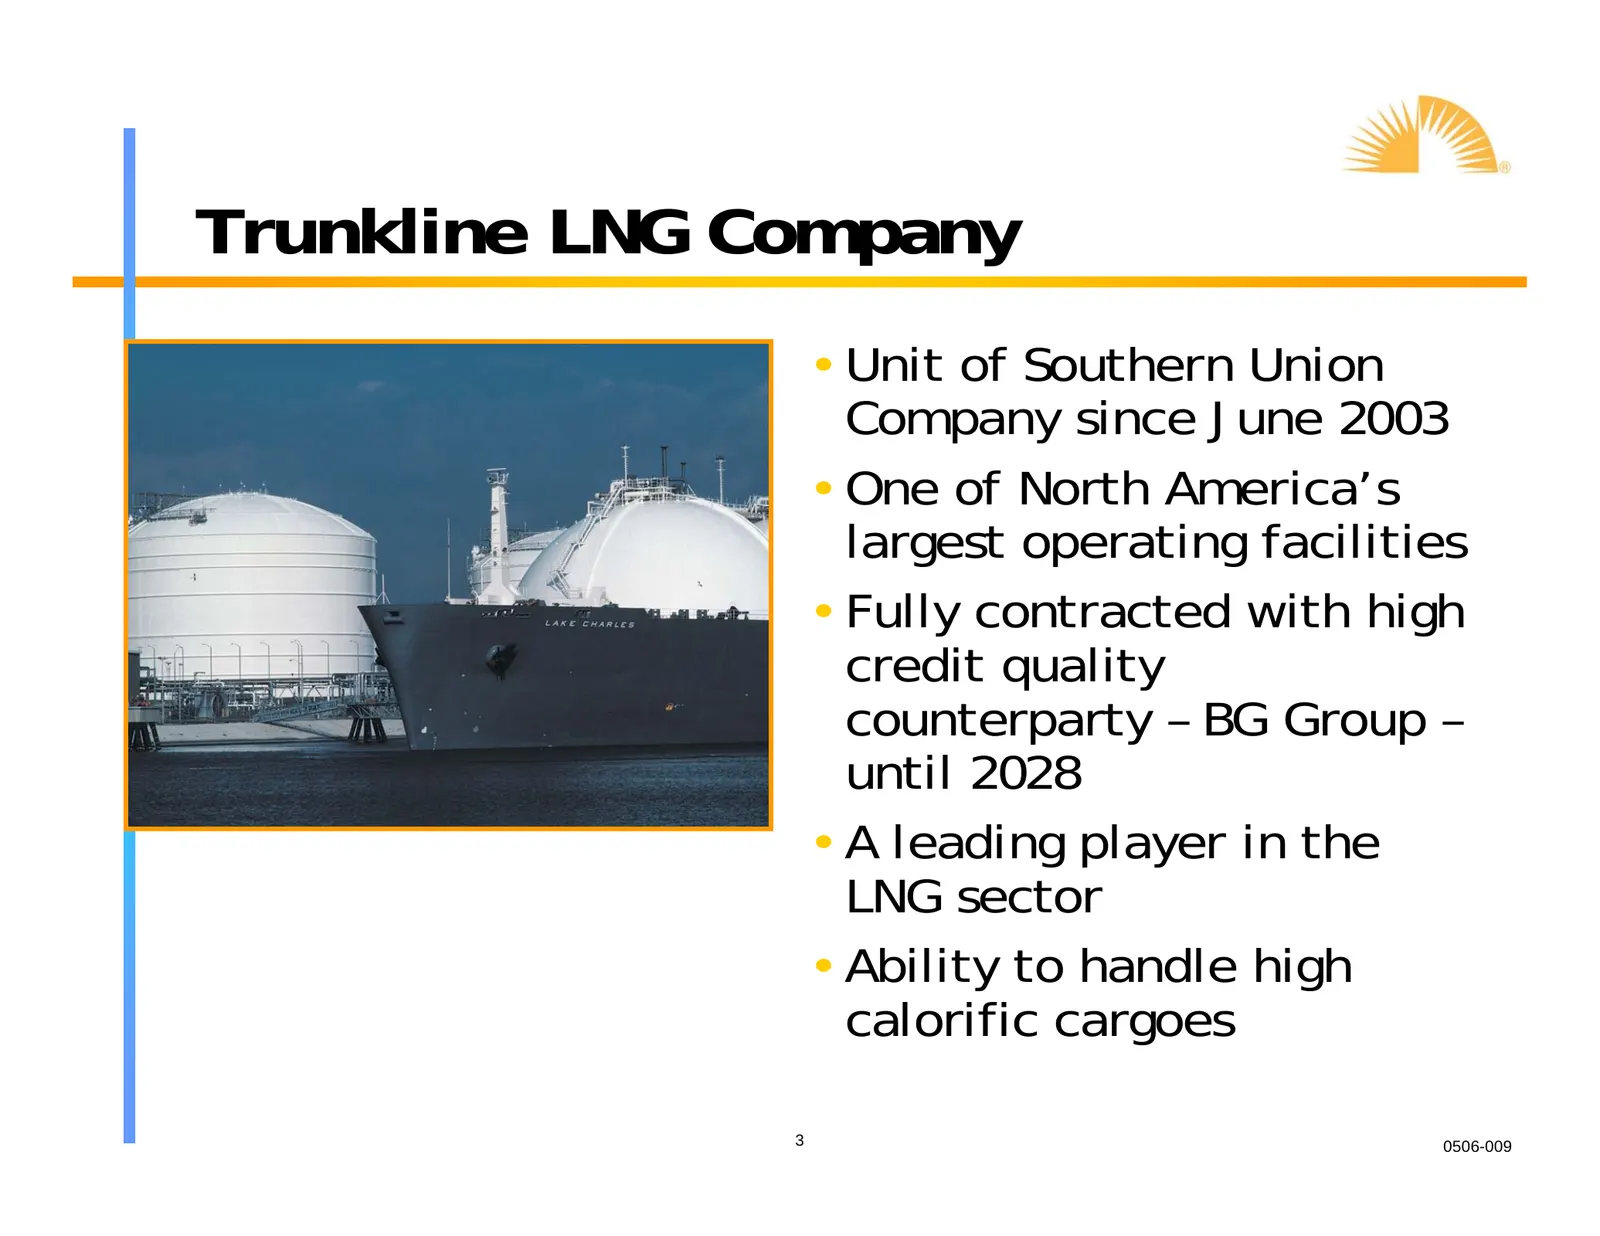
Trunkline LNG Company • Unit of Southern Union Company since June 2003 • One of North America’s largest operating facilities • Fully contracted with high credit quality counterparty – BG Group – until 2028 • A leading player in the LNG sector • Ability to handle high calorific cargoes 3 0506-009
Slide 4: Trunkline Gas Company
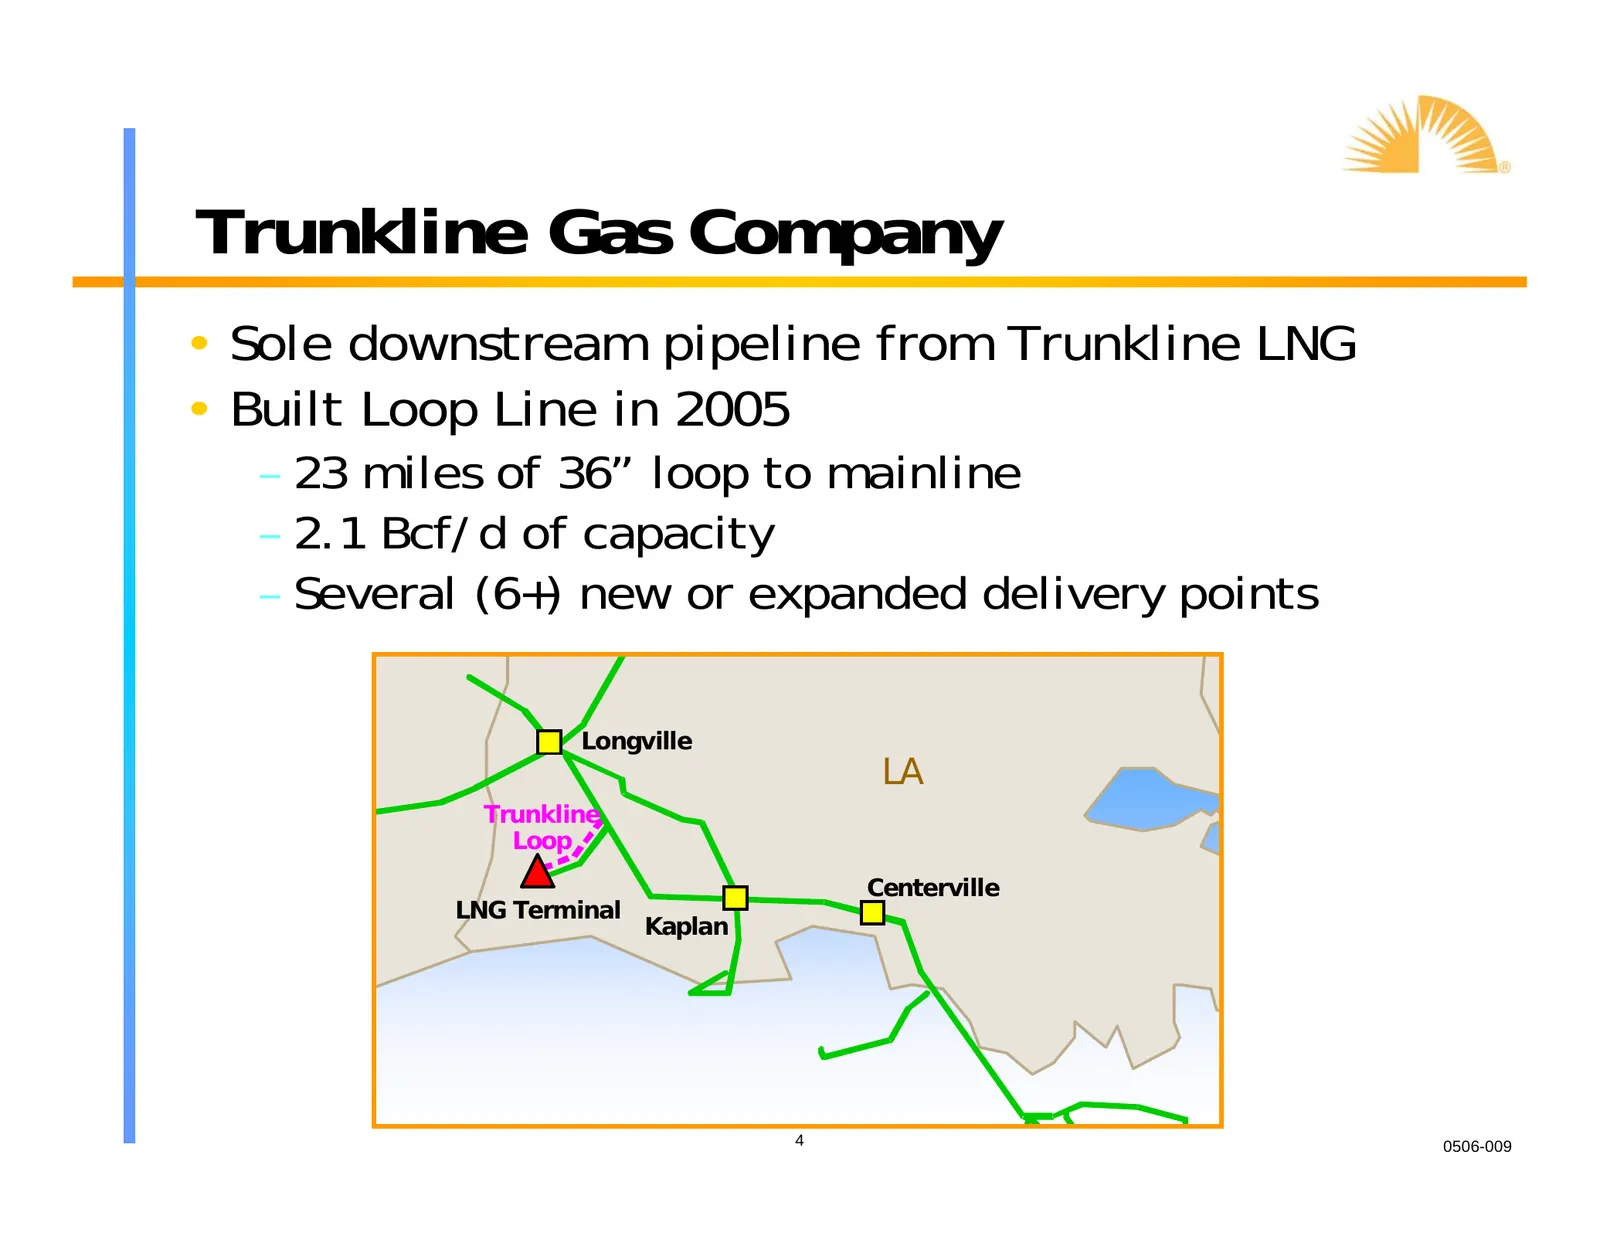
Trunkline Gas Company • Sole downstream pipeline from Trunkline LNG • Built Loop Line in 2005 – 23 miles of 36” loop to mainline – 2.1 Bcf/d of capacity – Several (6+) new or expanded delivery points Longville LA Trunkline Loop Centerville LNG Terminal Kaplan 4 0506-009
Slide 5: Phase I Expansion
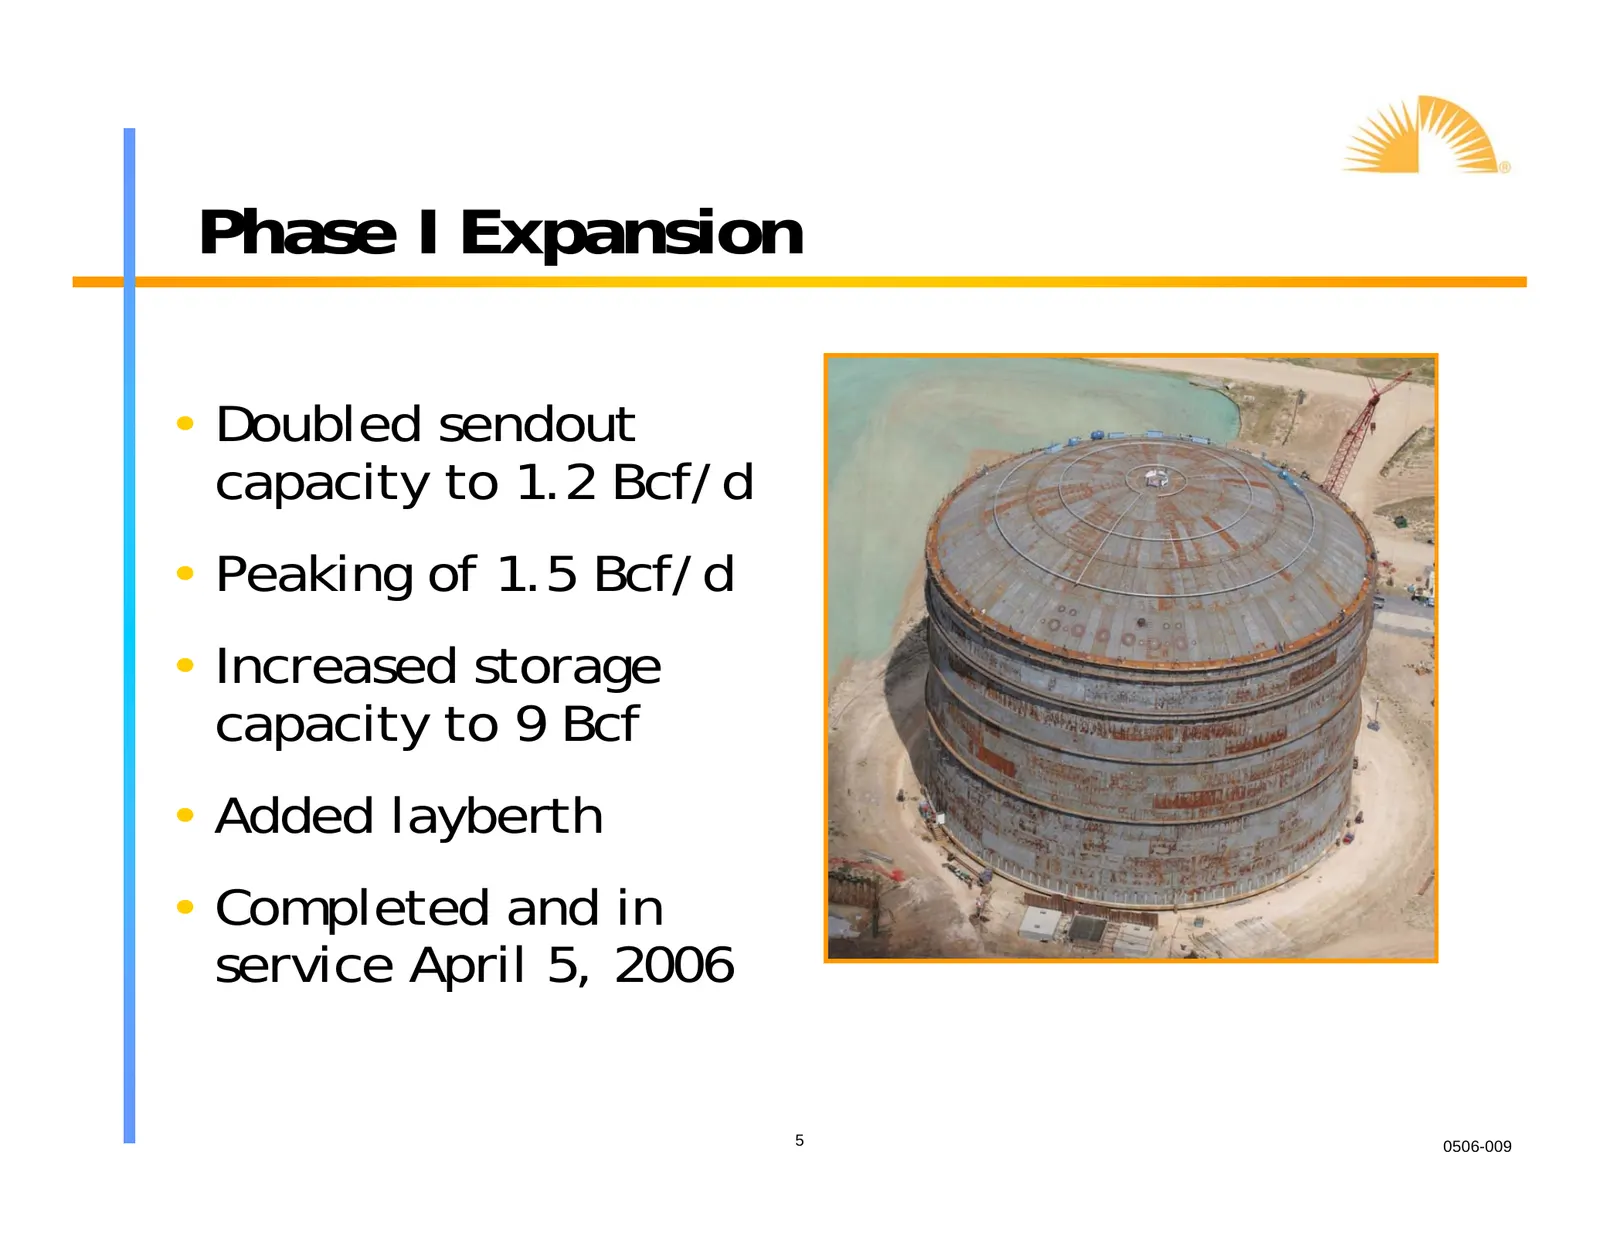
Phase I Expansion • Doubled sendout capacity to 1.2 Bcf/d • Peaking of 1.5 Bcf/d • Increased storage capacity to 9 Bcf • Added layberth • Completed and in service April 5, 2006 5 0506-009
Slide 6: Phase II Expansion
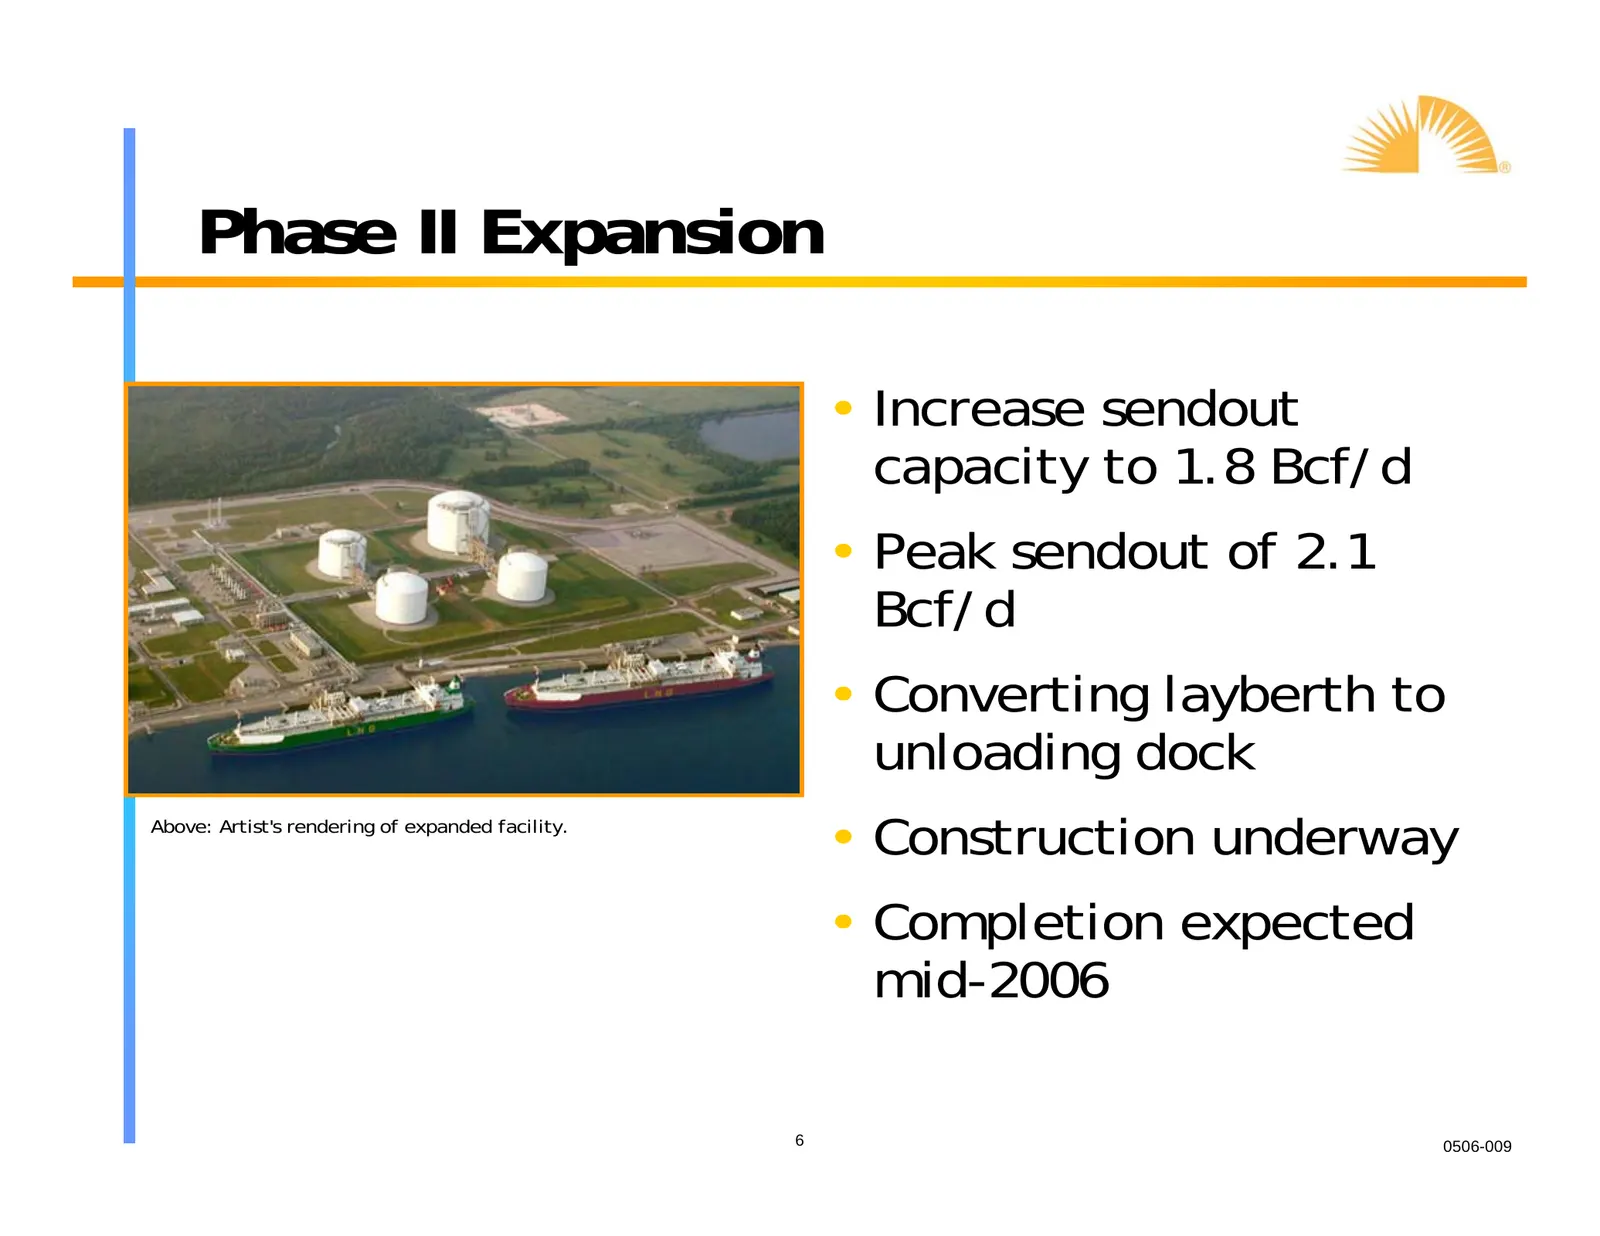
Phase II Expansion • Increase sendout capacity to 1.8 Bcf/d • Peak sendout of 2.1 Bcf/d • Converting layberth to unloading dock Above: Artist's rendering of expanded facility. • Construction underway • Completion expected mid-2006 6 0506-009
Slide 7: Trunkline LNG: Infrastructure Enhancement Project (IEP)
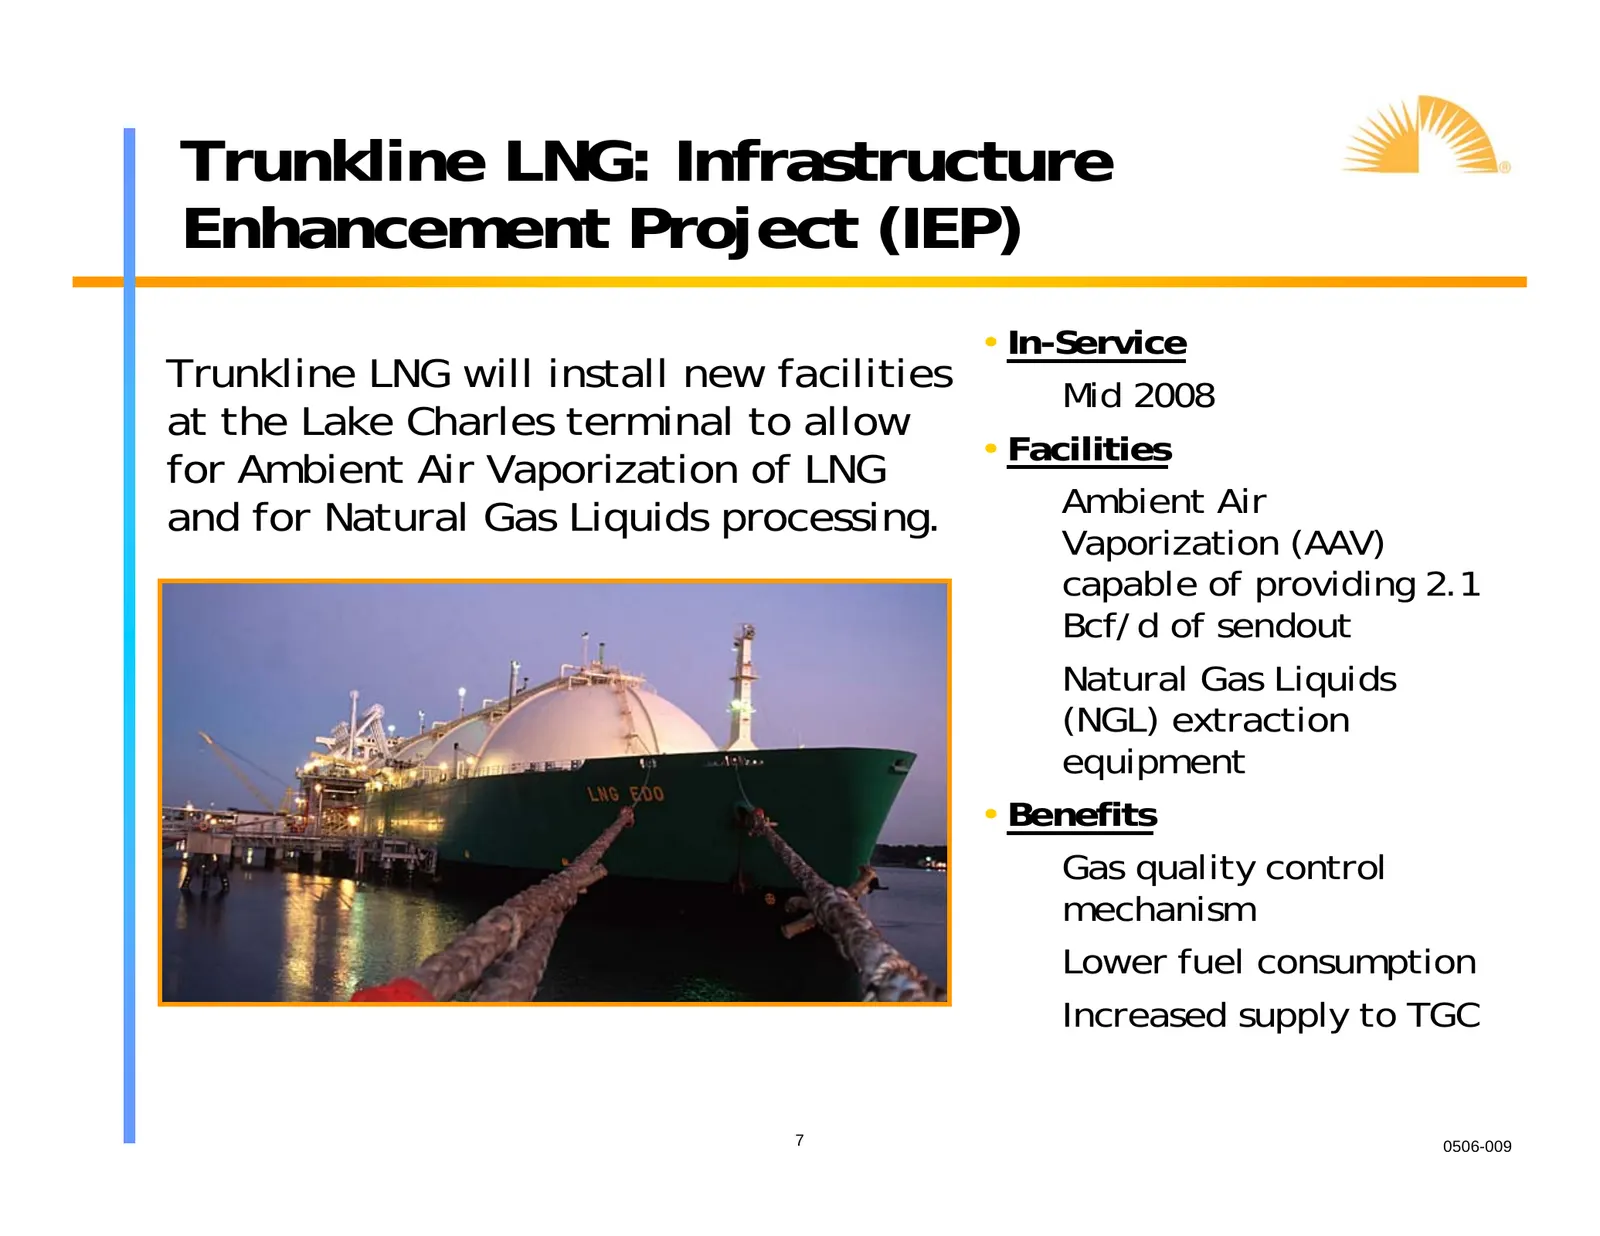
Trunkline LNG: Infrastructure Enhancement Project (IEP) • In-Service Trunkline LNG will install new facilities – Mid 2008 at the Lake Charles terminal to allow • Facilities for Ambient Air Vaporization of LNG and for Natural Gas Liquids processing. – Ambient Air Vaporization (AAV) capable of providi
Slide 8: LNG Business Strategy
LNG Business Strategy • Mitigate risk through contracts – High credit counterparty – BG Group – Long term contract - 2028 – Minimal financial impact related to terminal usage – reservation based • Produce stable earnings and cash flow • Grow with our customer 8 0506-009
Slide 9: LNG Project Summary
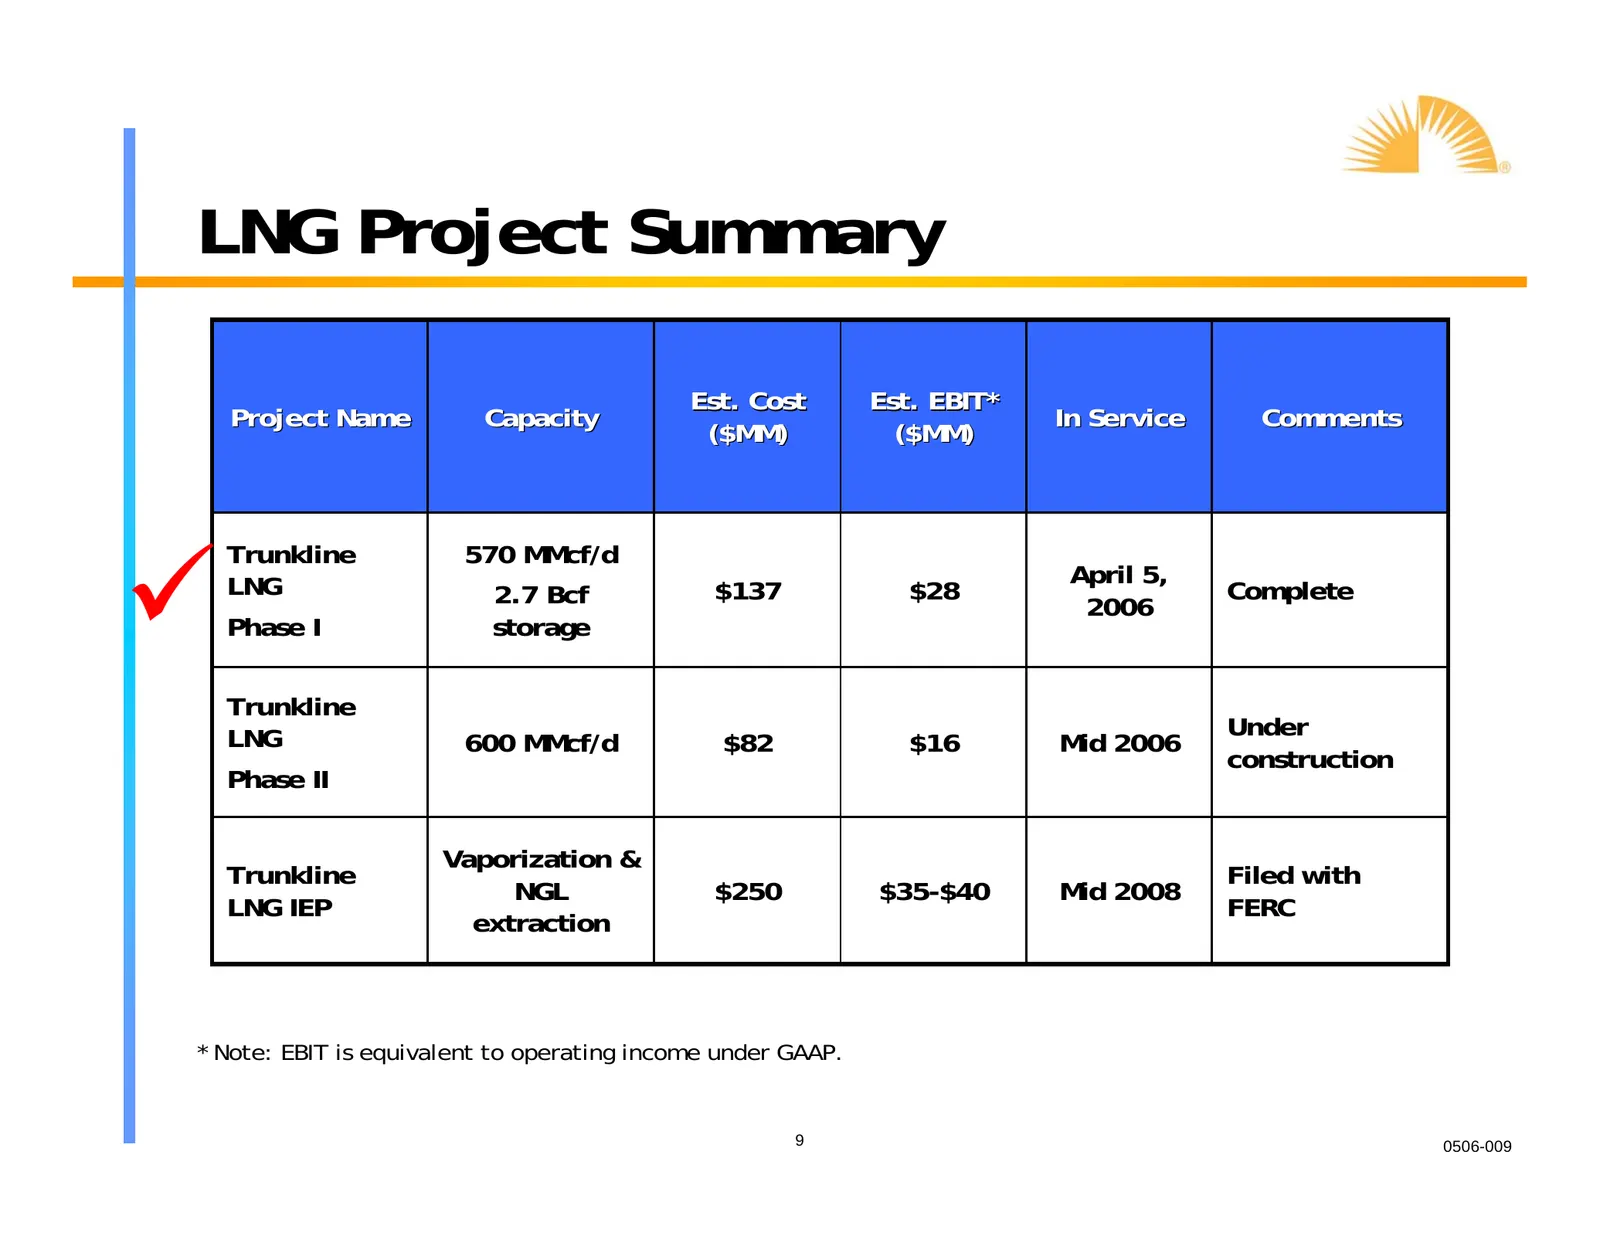
LNG Project Summary Est. Cost Est. EBIT* Project Name Capacity In Service Comments ($MM) ($MM) 9 Trunkline 570 MMcf/d LNG April 5, 2.7 Bcf $137 $28 Complete 2006 Phase I storage Trunkline LNG Under 600 MMcf/d $82 $16 Mid 2006 construction Phase II Vaporization & Trunkline Filed with NGL $250 $35-$40

Slide 10: Southern Union Today
yl”, Southern Union Today
Slide 11: The Transforming Years
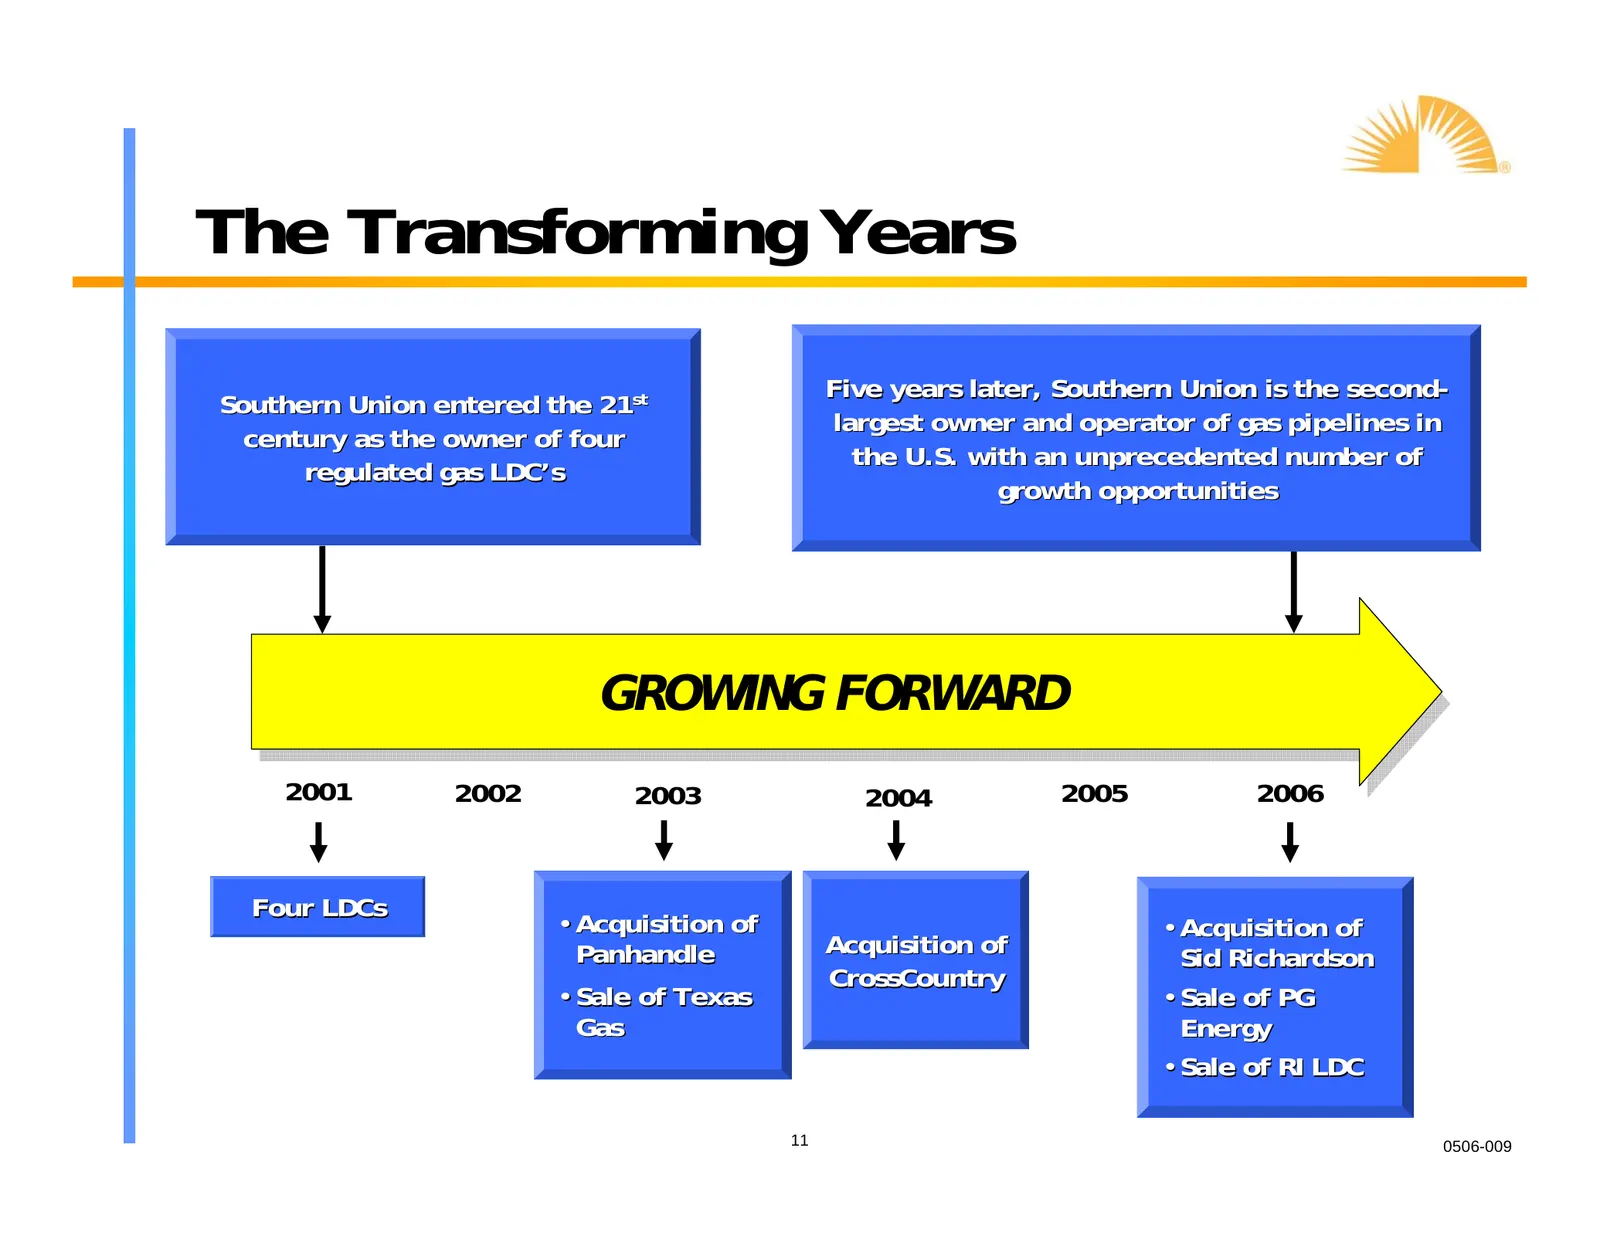
The Transforming Years Five years later, Southern Union is the second- Southern Union entered the 21st largest owner and operator of gas pipelines in century as the owner of four the U.S. with an unprecedented number of regulated gas LDC’s growth opportunities GROWING FORWARD 2001 2002 2003 2004 200
Slide 12: Delivering Growth in Value
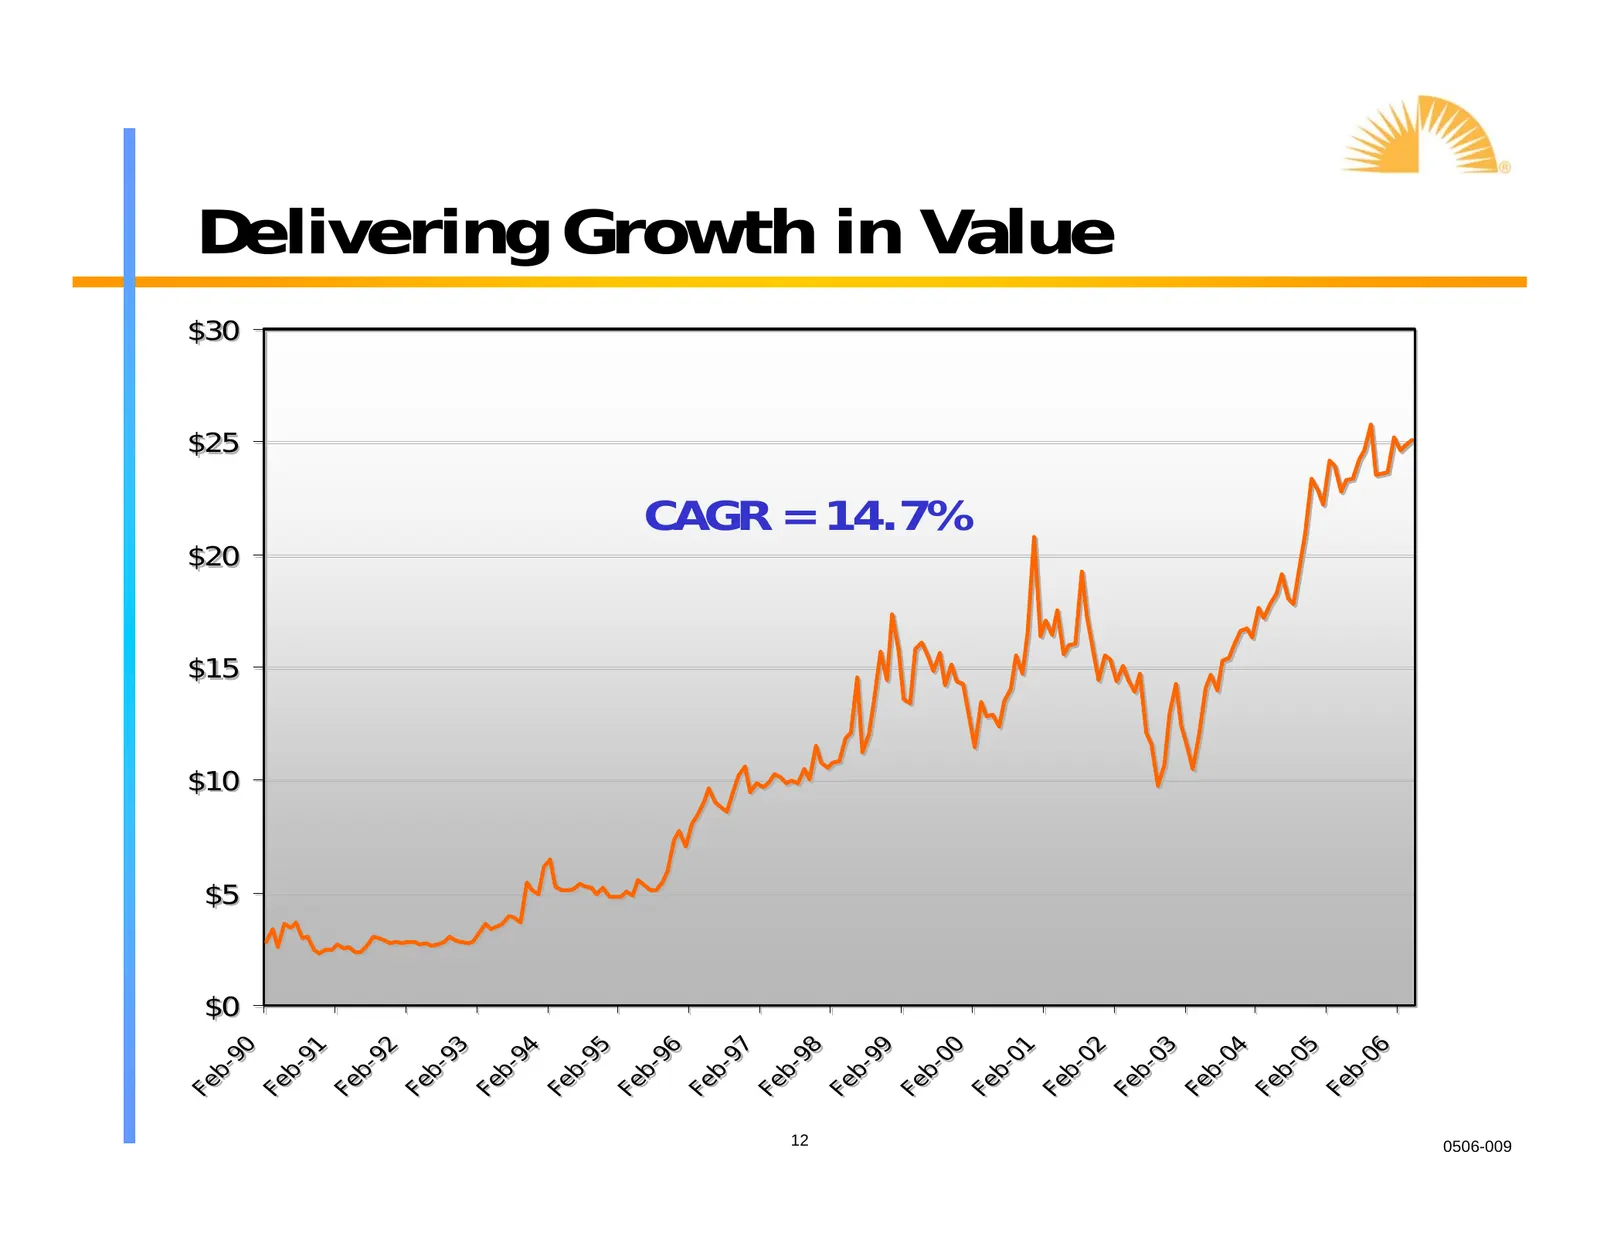
Fe $0 $5 $10 $15 $20 $25 $30 b- 90 Fe b- 91 Fe b- 92 Fe b- 93 Fe b- 94 Fe b- 95 Fe b- 96 Fe b- 97 Fe b- 12 98 Fe b- 99 Fe b- CAGR = 14.7% 00 Fe b- 01 Fe b- 02 Delivering Growth in Value Fe b- 03 Fe b- 04 Fe b- 05 Fe b- 06 0506-009
Slide 13: Value Creation Strategy
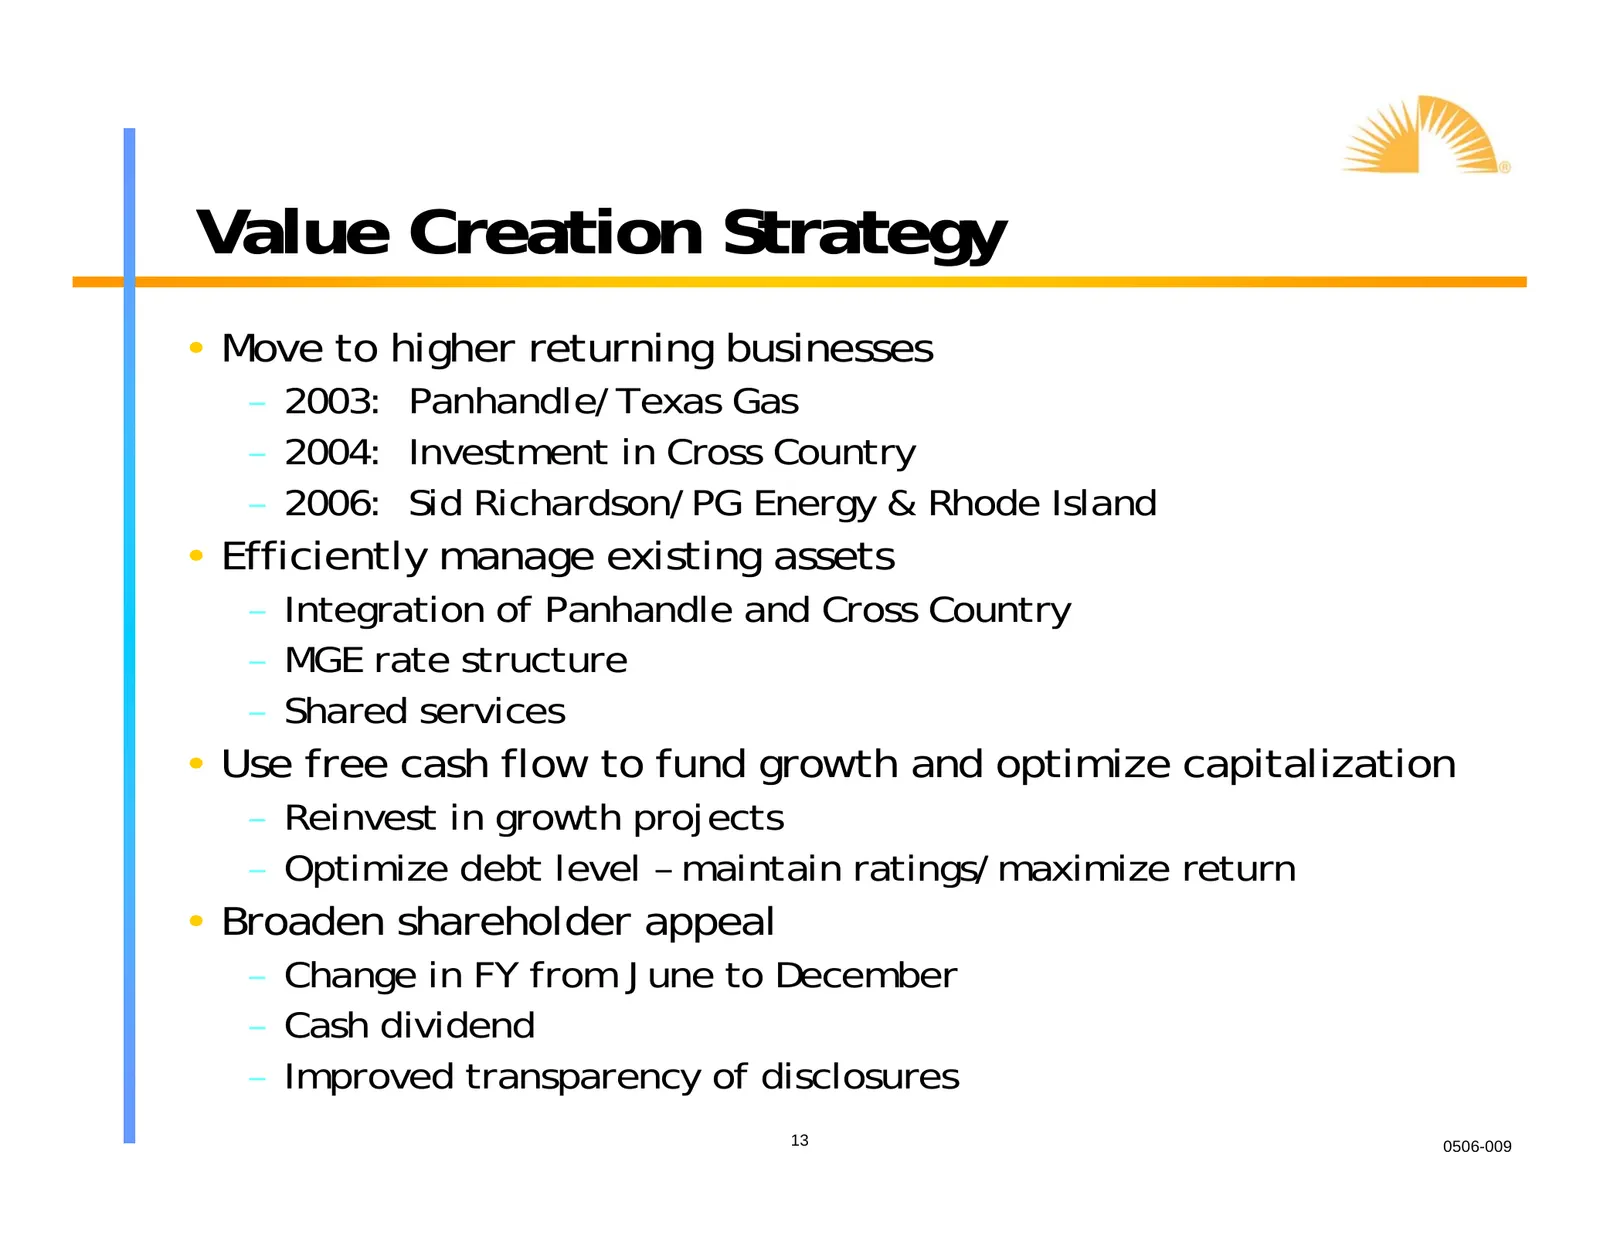
Value Creation Strategy • Move to higher returning businesses – 2003: Panhandle/Texas Gas – 2004: Investment in Cross Country – 2006: Sid Richardson/PG Energy & Rhode Island • Efficiently manage existing assets – Integration of Panhandle and Cross Country – MGE rate structure – Shared services • Use
Slide 14: Expansive Footprint
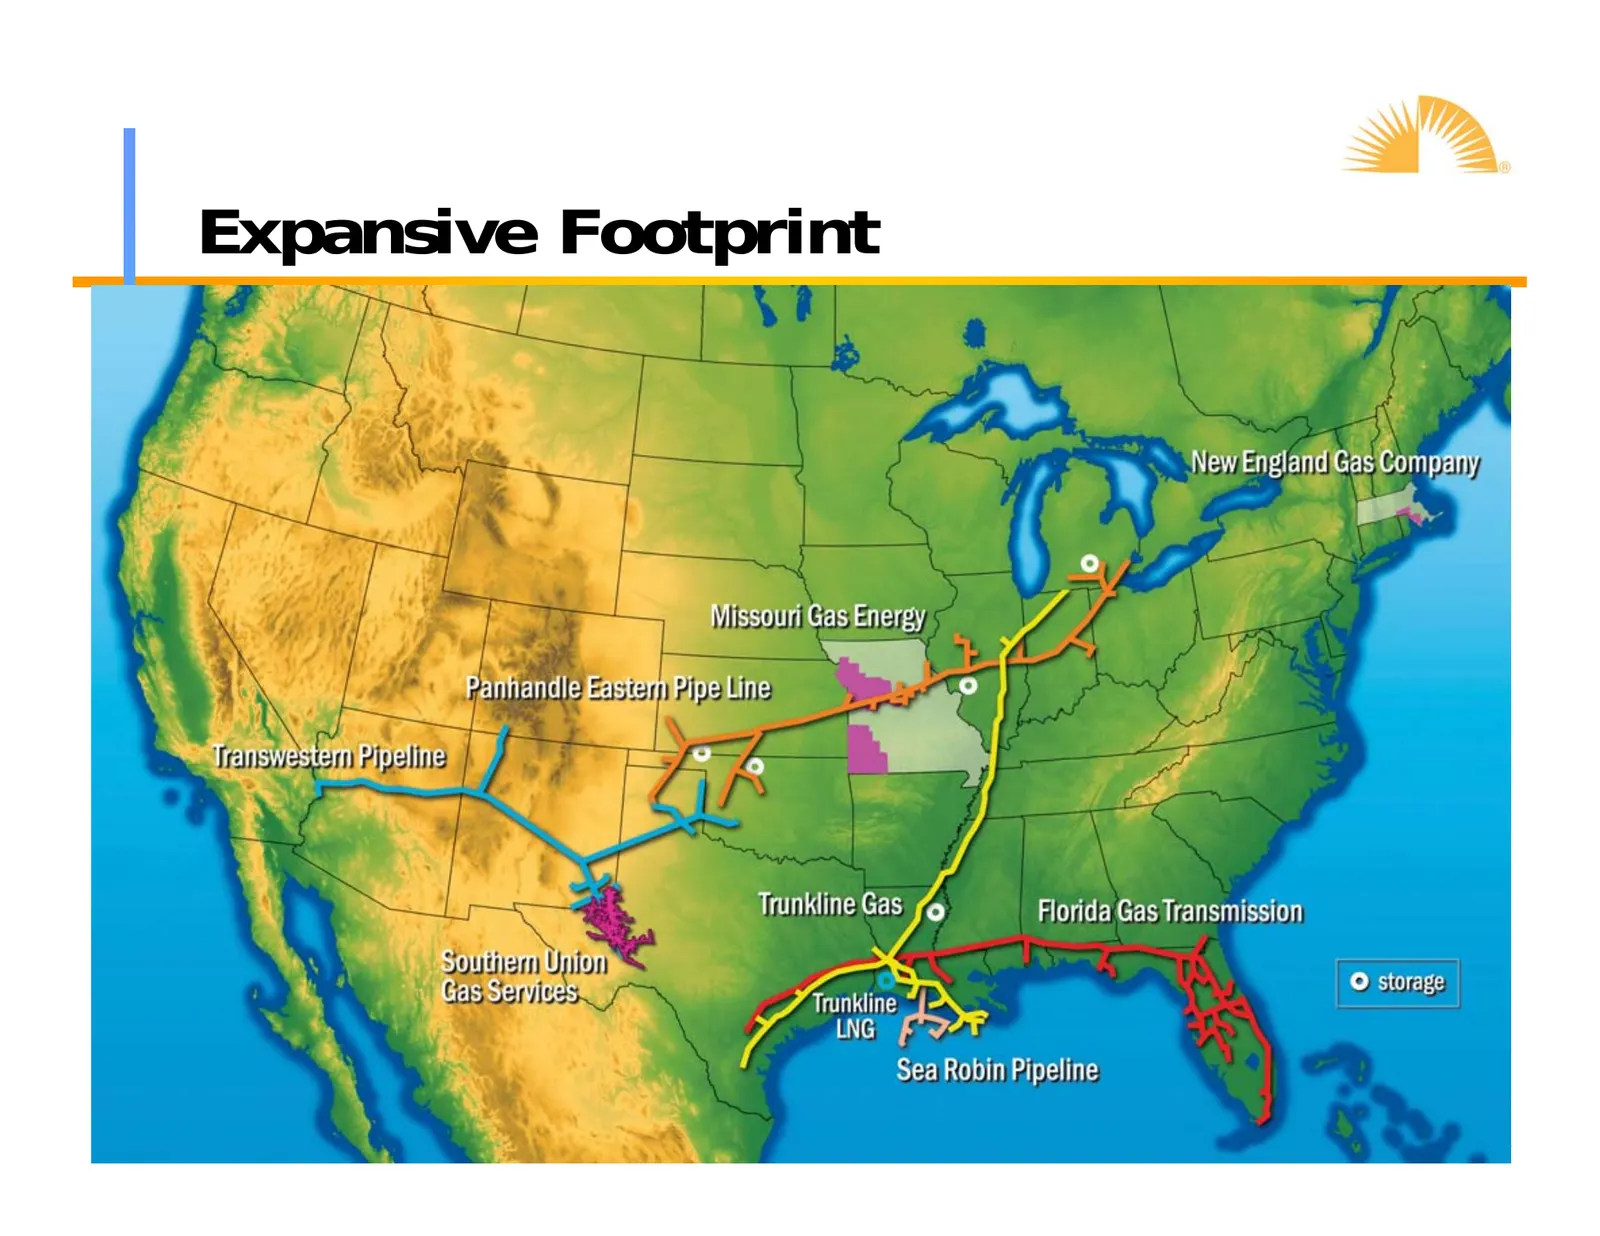
Expansive Footprint 14 0506-009
Slide 15: Business Segments
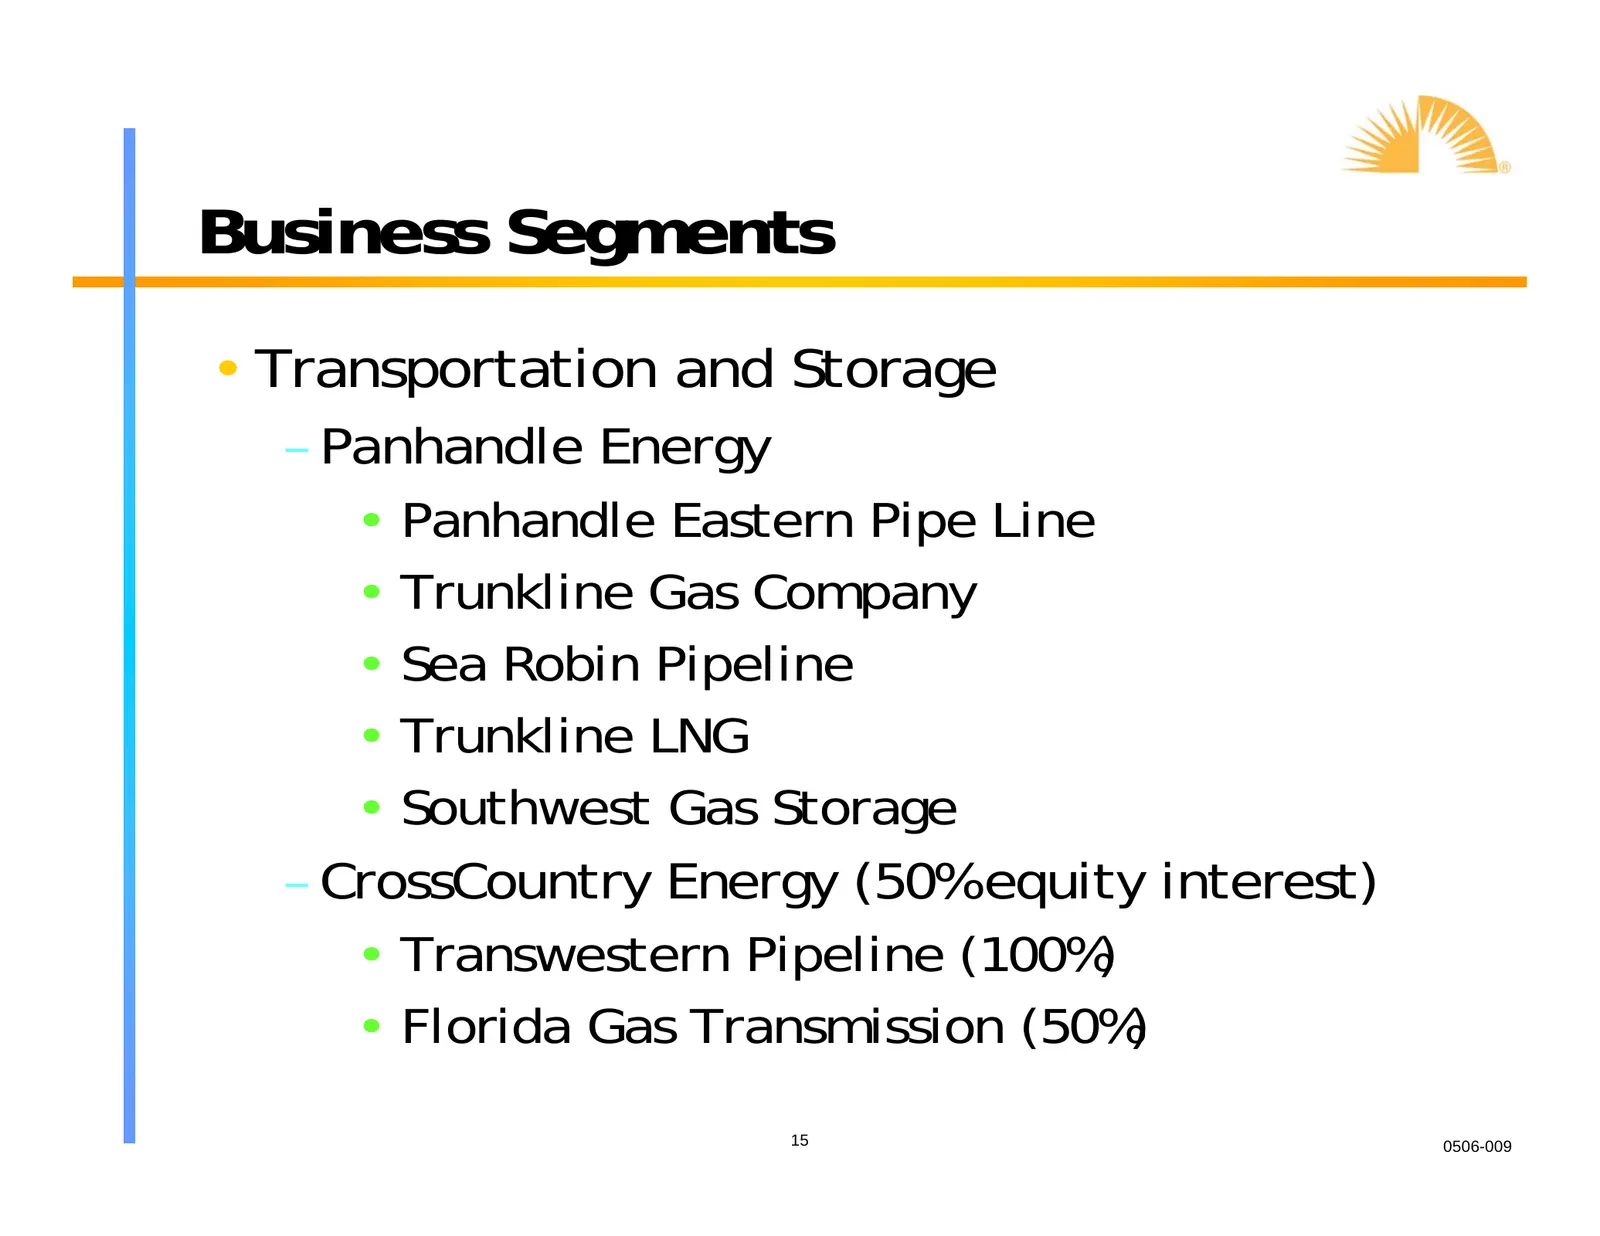
Business Segments • Transportation and Storage – Panhandle Energy • Panhandle Eastern Pipe Line • Trunkline Gas Company • Sea Robin Pipeline • Trunkline LNG • Southwest Gas Storage – CrossCountry Energy (50% equity interest) • Transwestern Pipeline (100%) • Florida Gas Transmission (50%) 15 0506-009
Slide 16: Business Segments
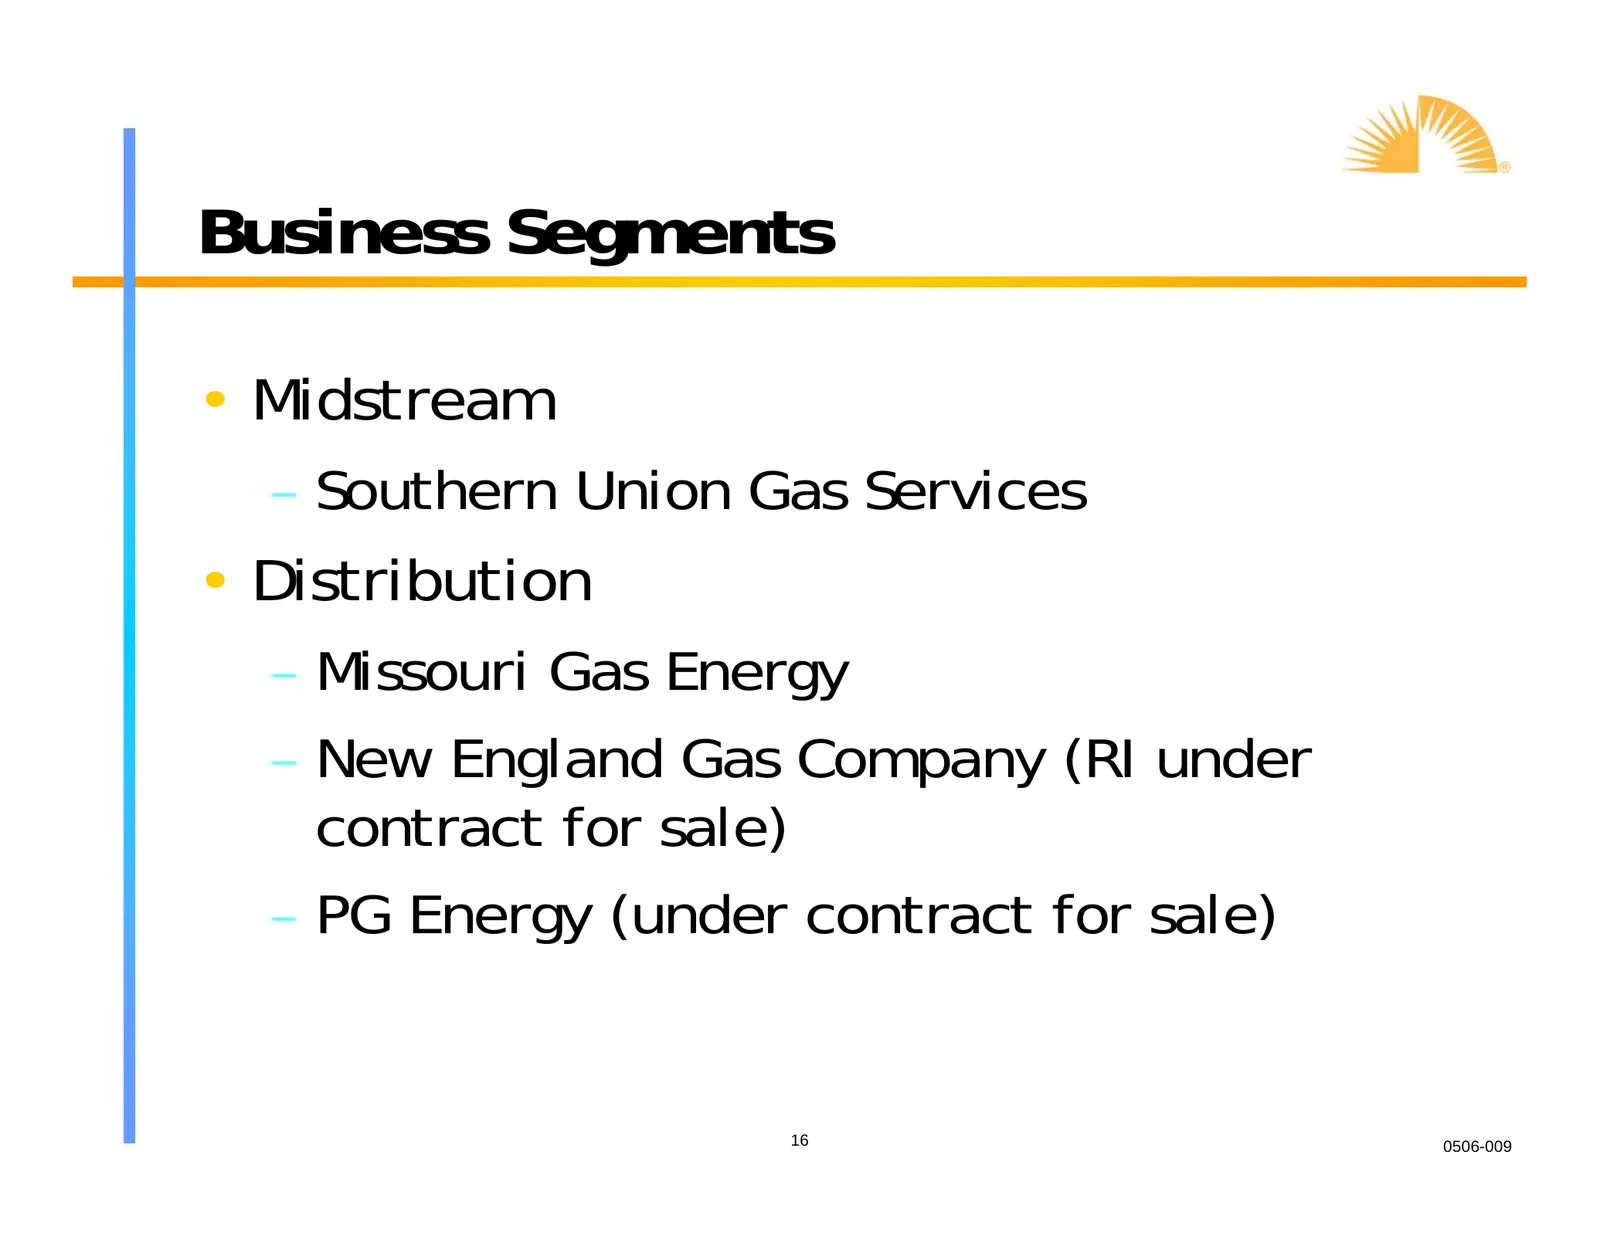
Business Segments • Midstream – Southern Union Gas Services • Distribution – Missouri Gas Energy – New England Gas Company (RI under contract for sale) – PG Energy (under contract for sale) 16 0506-009
Slide 17: Pipeline Assets
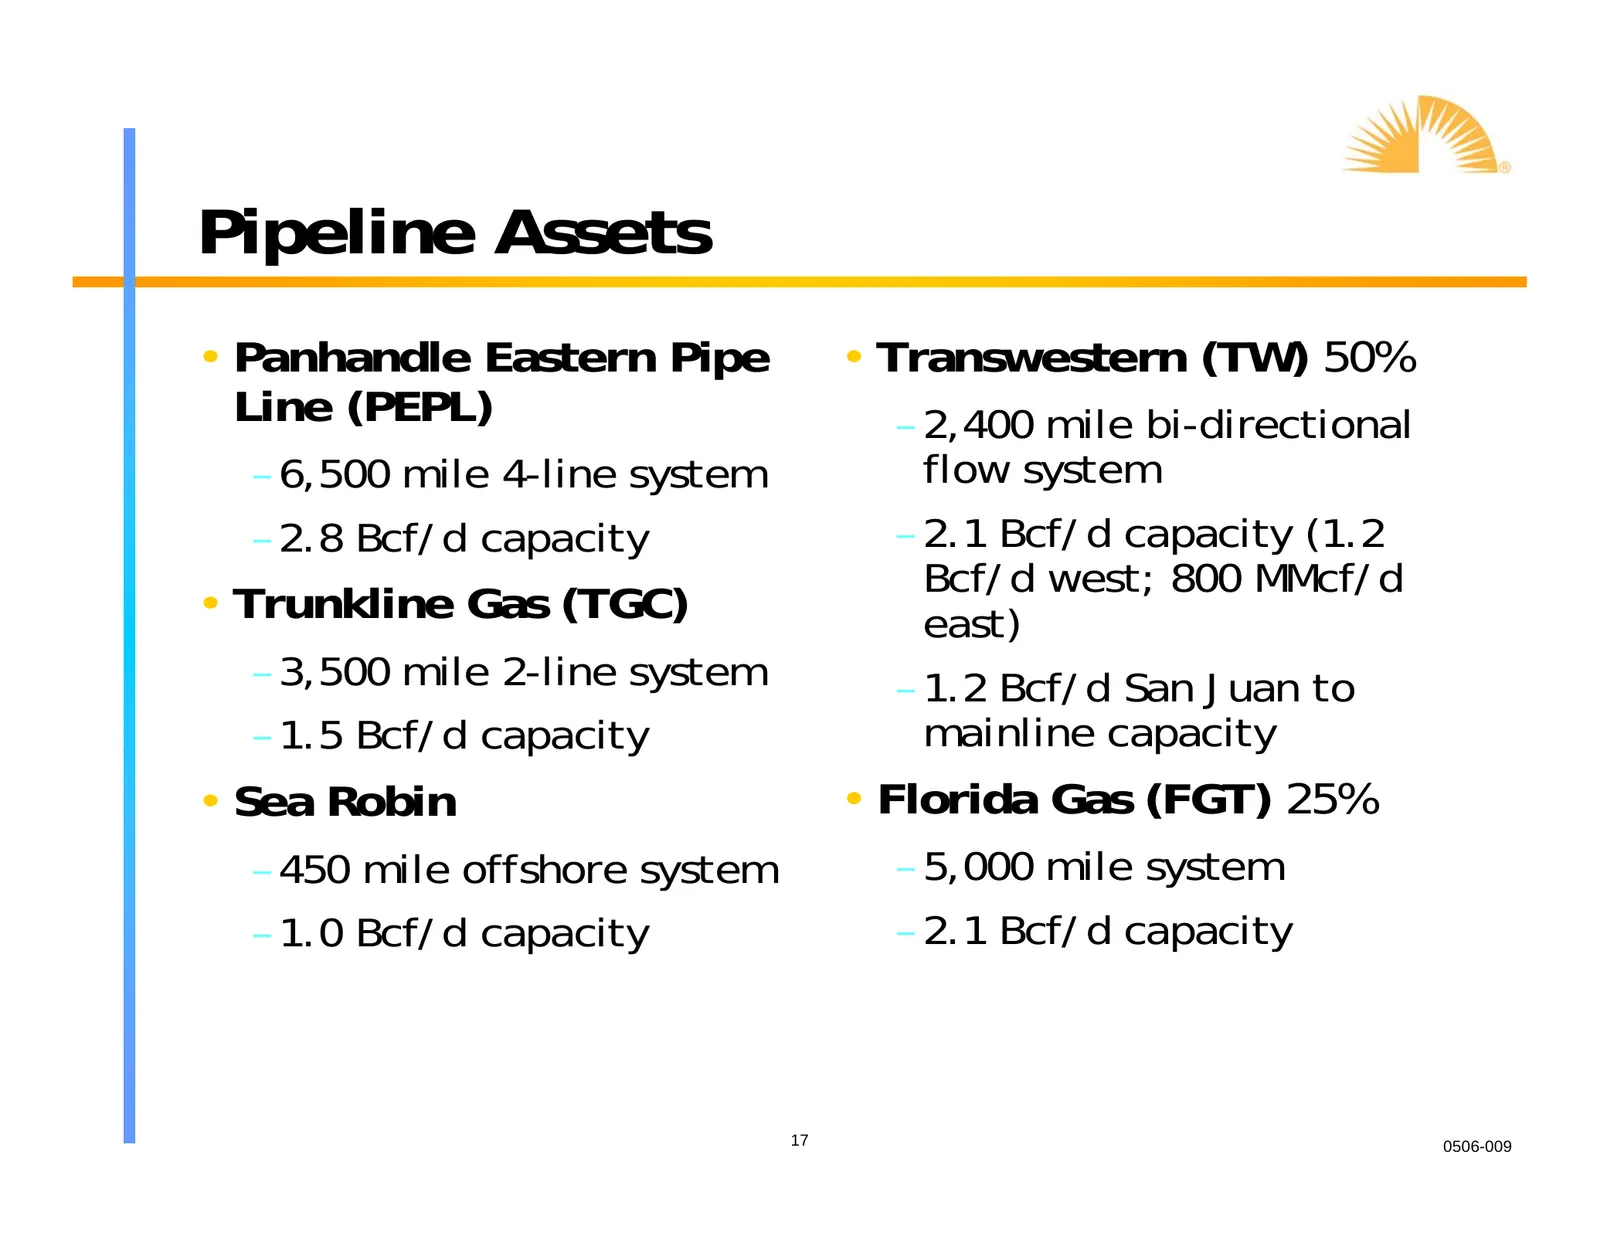
Pipeline Assets • Panhandle Eastern Pipe • Transwestern (TW) 50% Line (PEPL) – 2,400 mile bi-directional – 6,500 mile 4-line system flow system – 2.8 Bcf/d capacity – 2.1 Bcf/d capacity (1.2 Bcf/d west; 800 MMcf/d • Trunkline Gas (TGC) east) – 3,500 mile 2-line system – 1.2 Bcf/d San Juan to – 1.5 B
Slide 18: Trunkline LNG Company
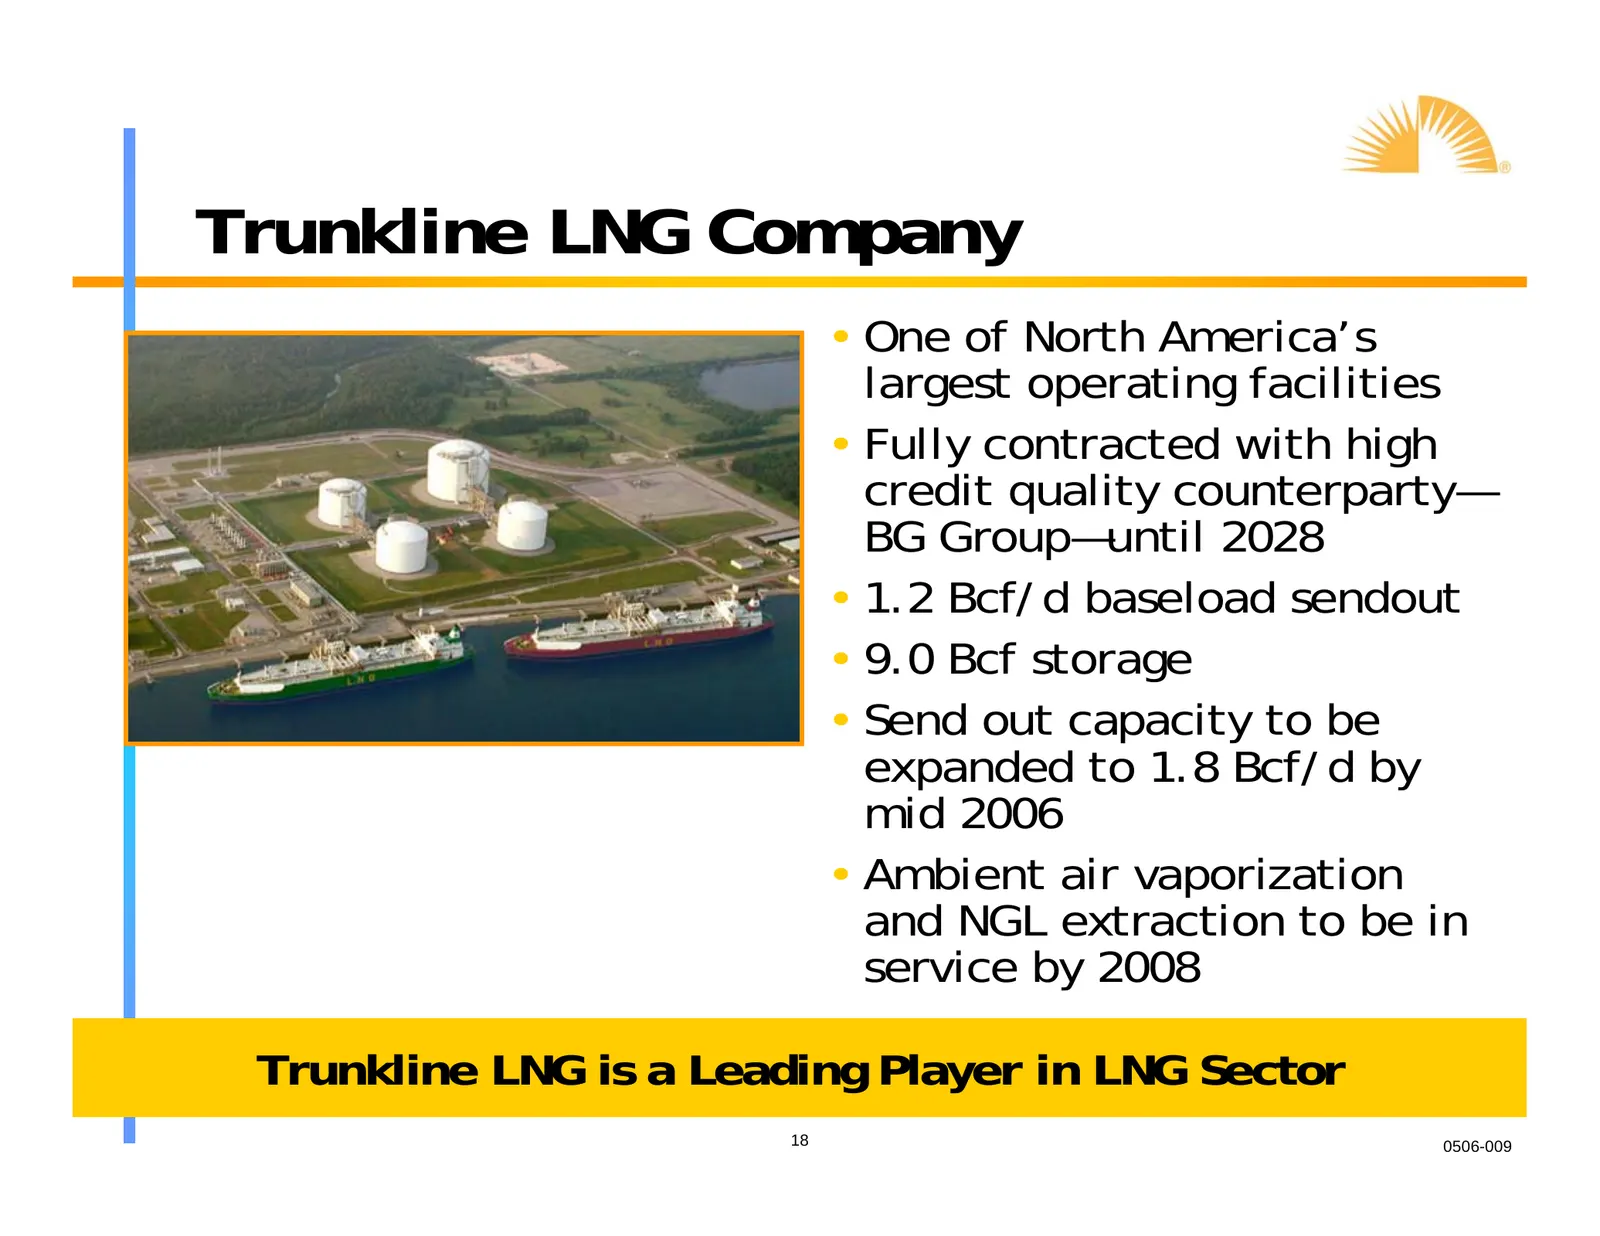
Trunkline LNG Company • One of North America’s largest operating facilities • Fully contracted with high credit quality counterparty— BG Group—until 2028 • 1.2 Bcf/d baseload sendout • 9.0 Bcf storage • Send out capacity to be Above: Artist's rendering of expanded facility. expanded to 1.8 Bcf/d by
Slide 19: Distribution Assets
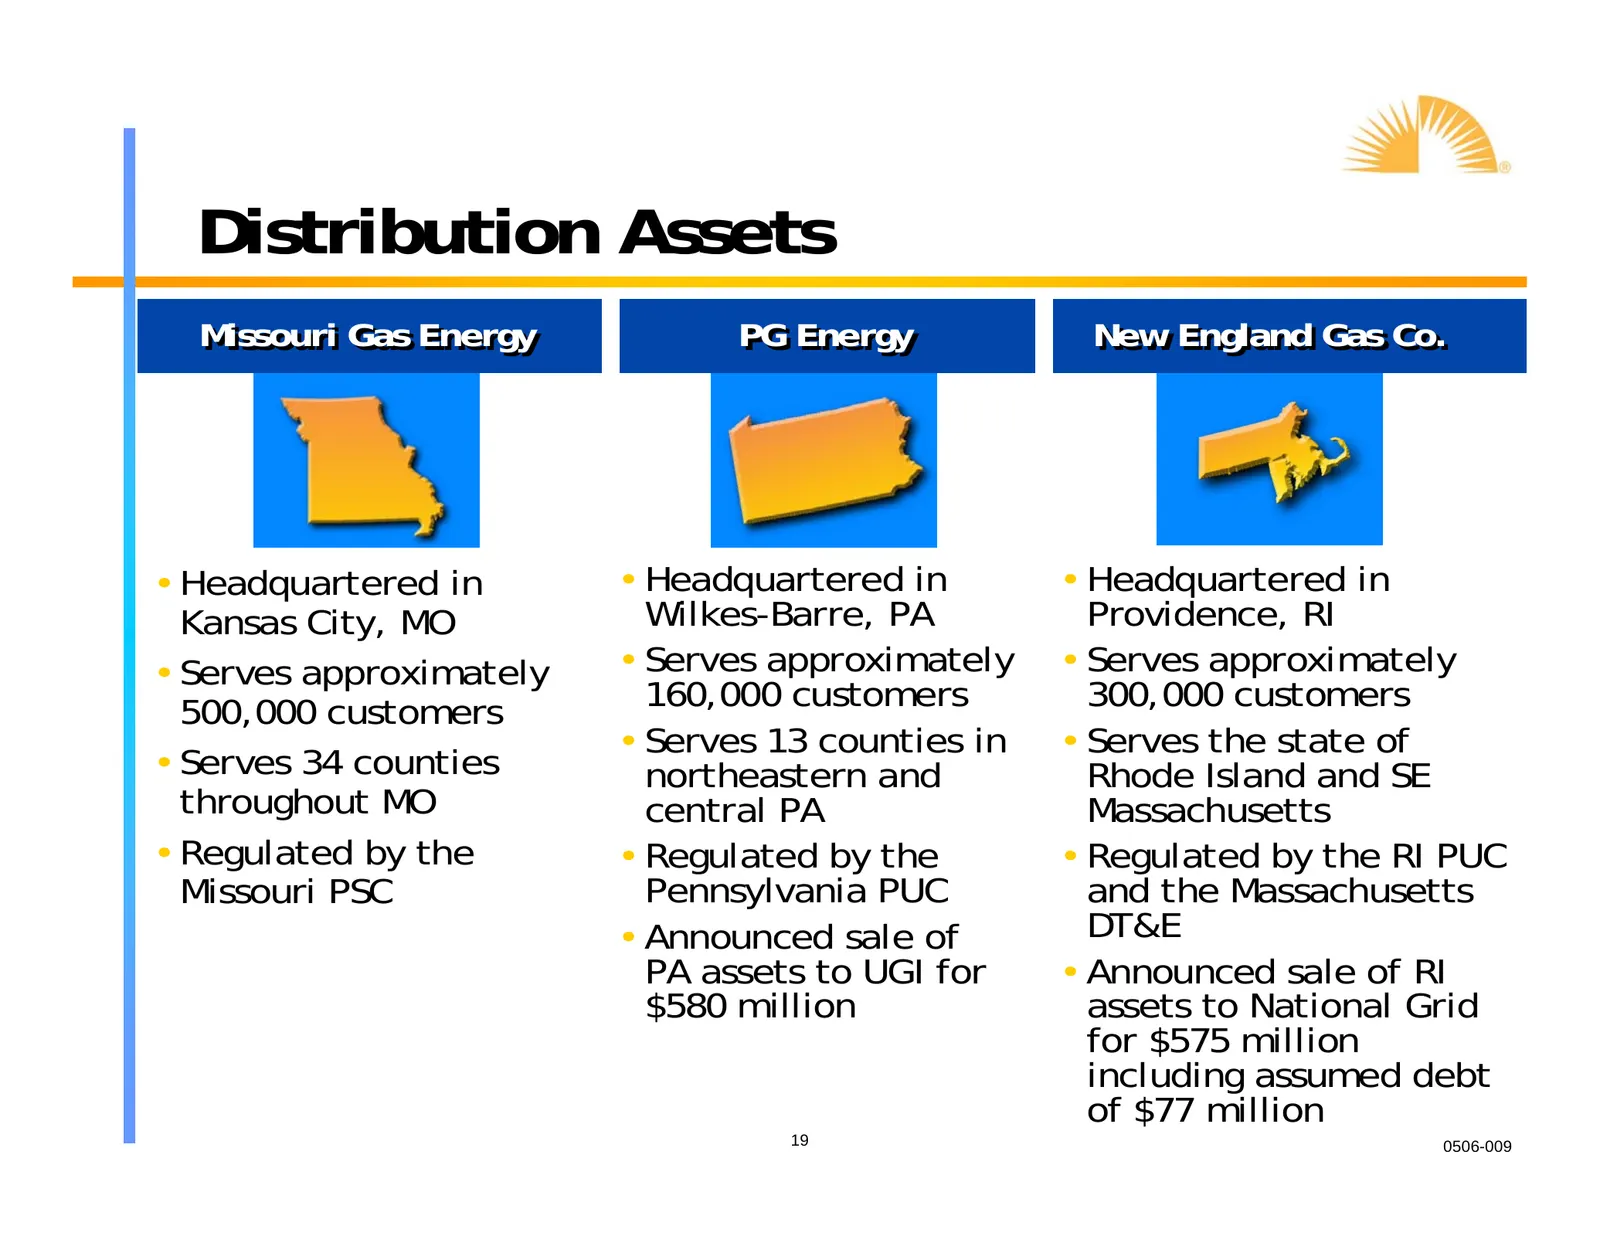
Distribution Assets Missouri Missouri Gas Gas Energy Energy PG PG Energy Energy New New England England Gas Gas Co. Co. • Headquartered in • Headquartered in • Headquartered in Kansas City, MO Wilkes-Barre, PA Providence, RI • Serves approximately • Serves approximately • Serves approximately 500,00
Slide 20: Gathering and Processing
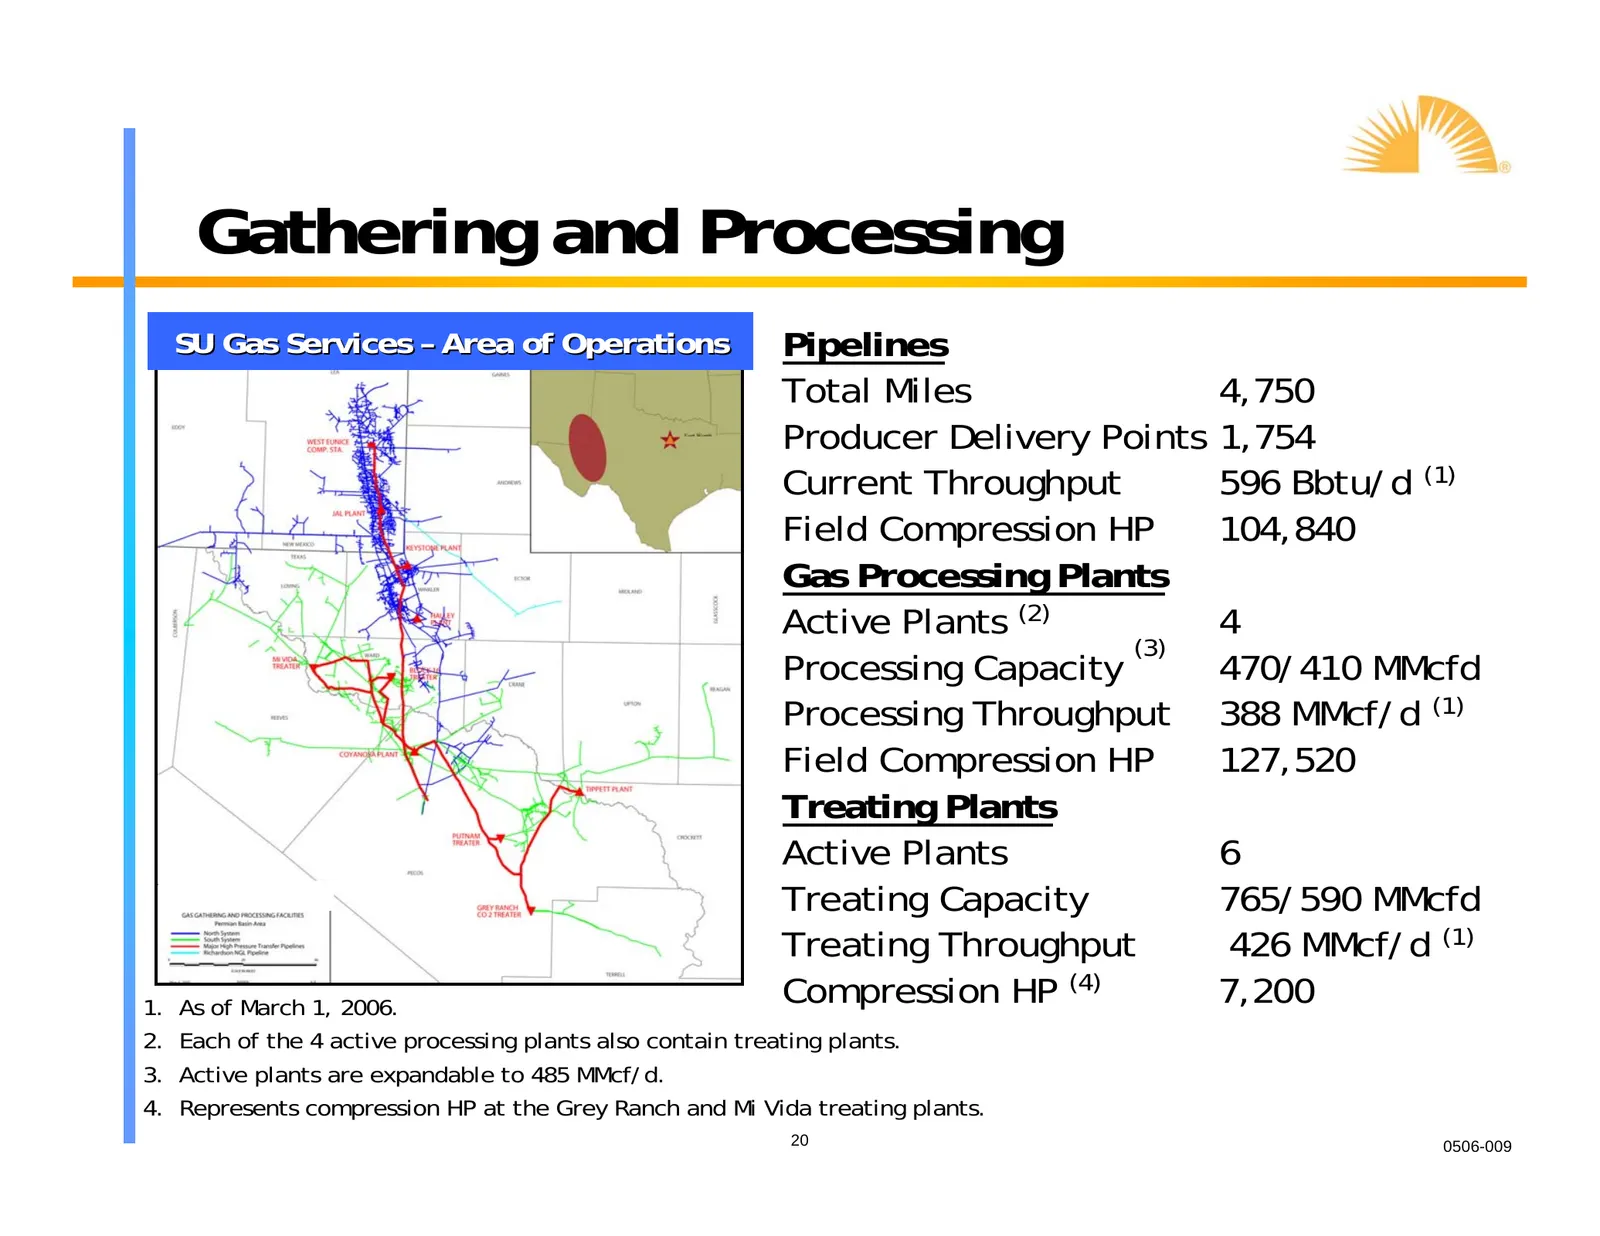
Gathering and Processing SU Gas Services – Area of Operations Pipelines Total Miles 4,750 Producer Delivery Points 1,754 Current Throughput 596 Bbtu/d (1) Field Compression HP 104,840 Gas Processing Plants Active Plants (2) 4 (3) Processing Capacity 470/410 MMcfd Processing Throughput 388 MMcf/d (1)
Slide 21: The Sid Rich Acquisition
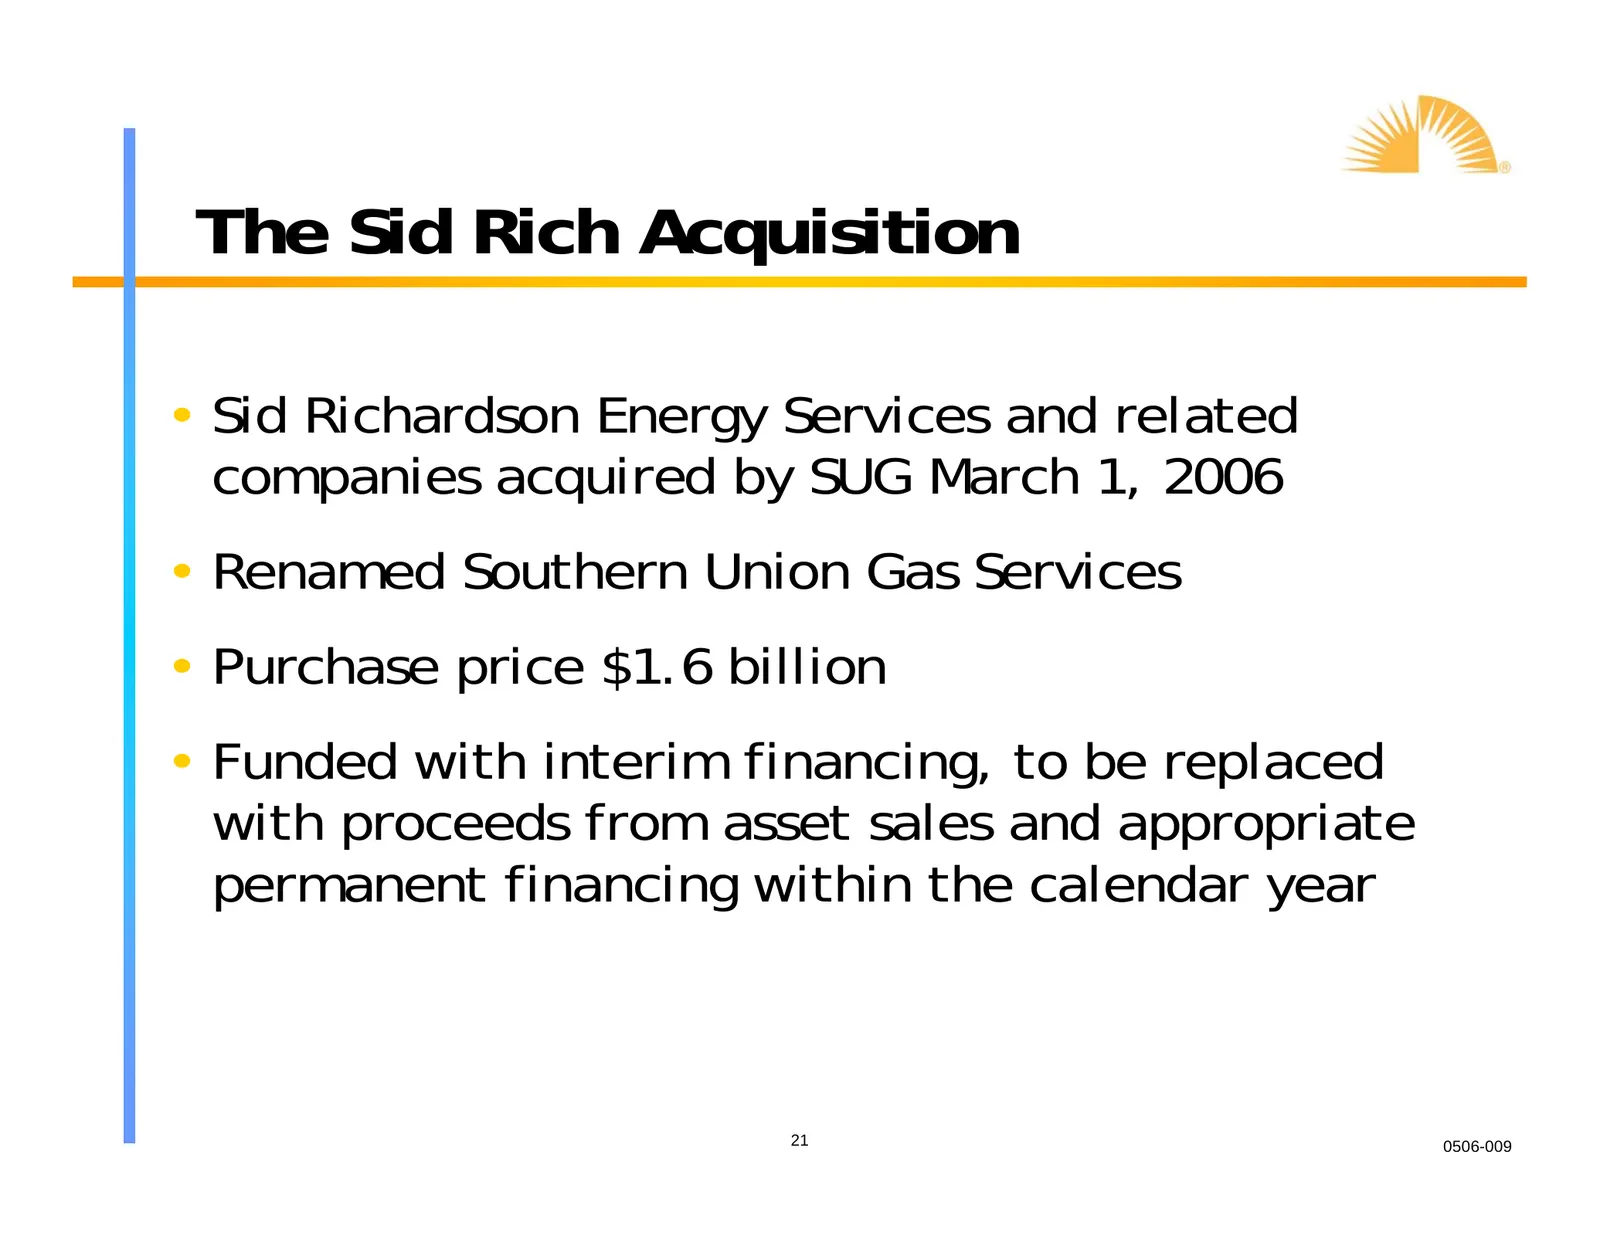
The Sid Rich Acquisition • Sid Richardson Energy Services and related companies acquired by SUG March 1, 2006 • Renamed Southern Union Gas Services • Purchase price $1.6 billion • Funded with interim financing, to be replaced with proceeds from asset sales and appropriate permanent financing within
Slide 22: SU Gas Services Overview
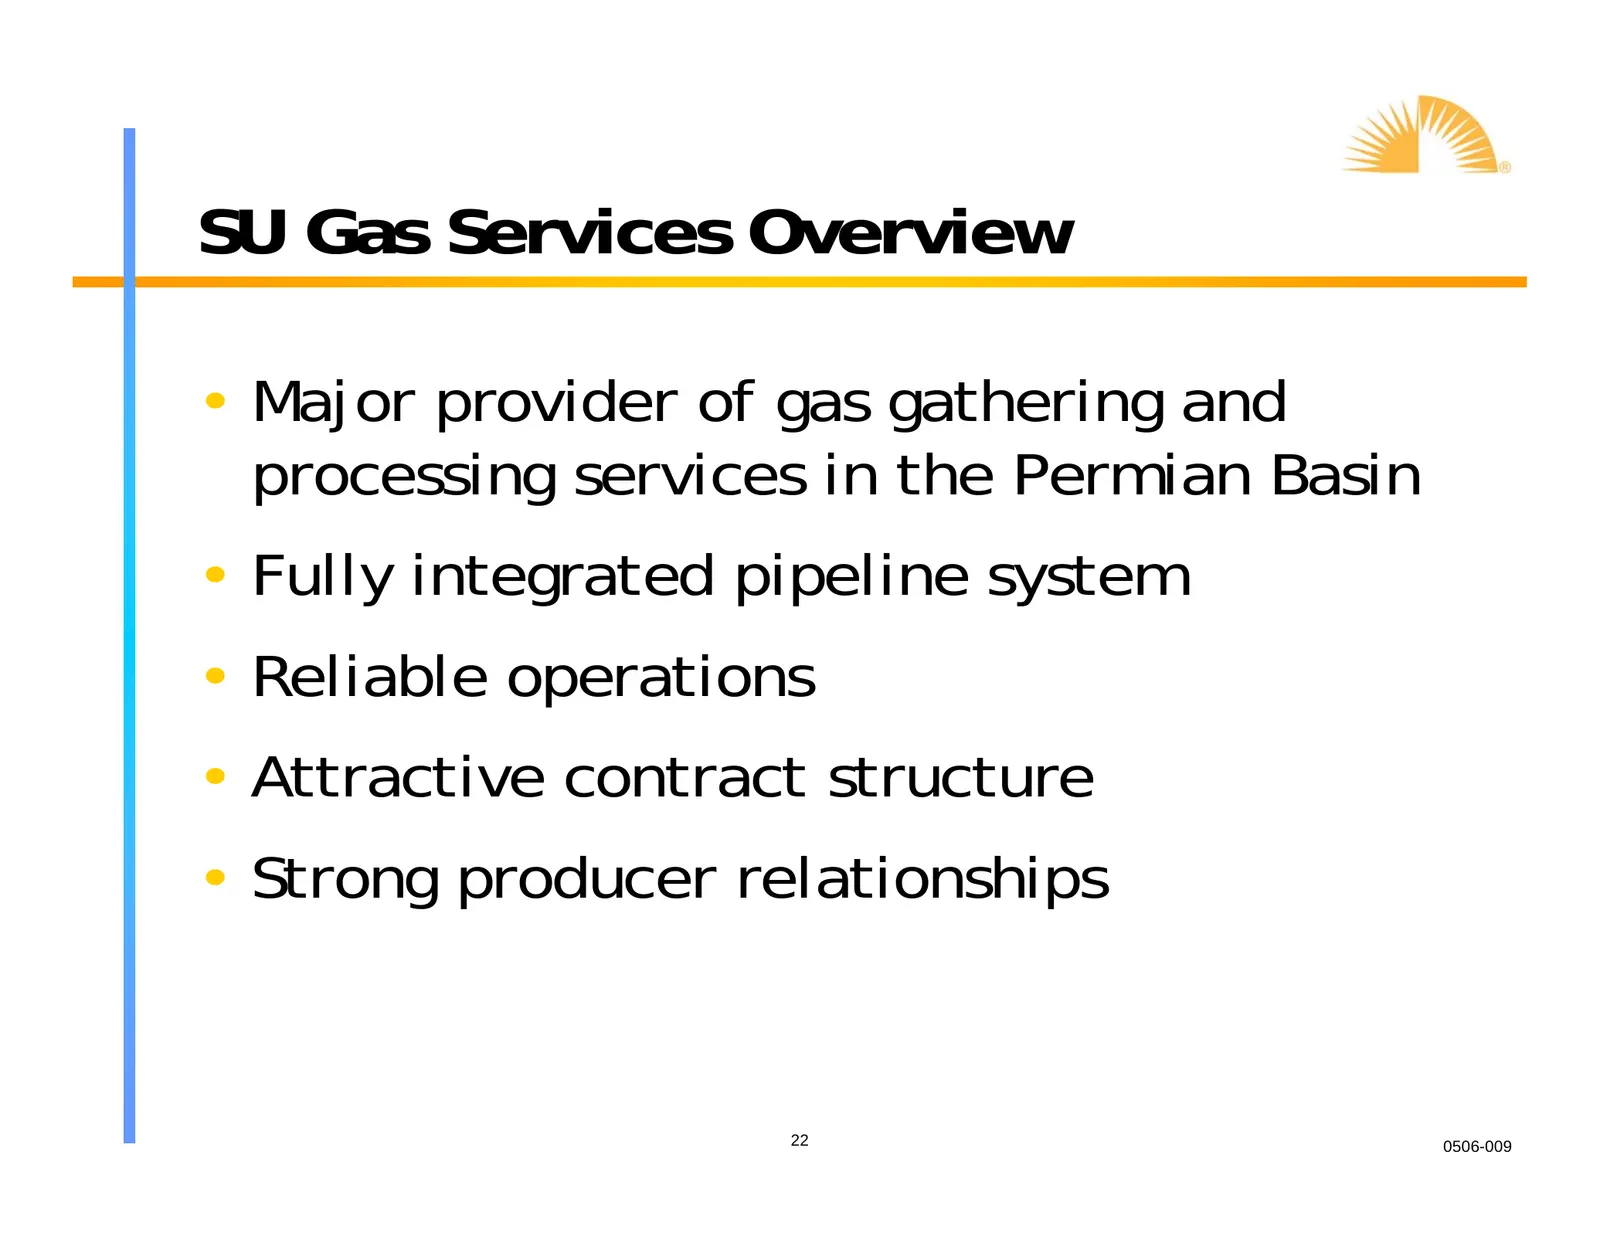
SU Gas Services Overview • Major provider of gas gathering and processing services in the Permian Basin • Fully integrated pipeline system • Reliable operations • Attractive contract structure • Strong producer relationships 22 0506-009
Slide 23: Differentiating Factors
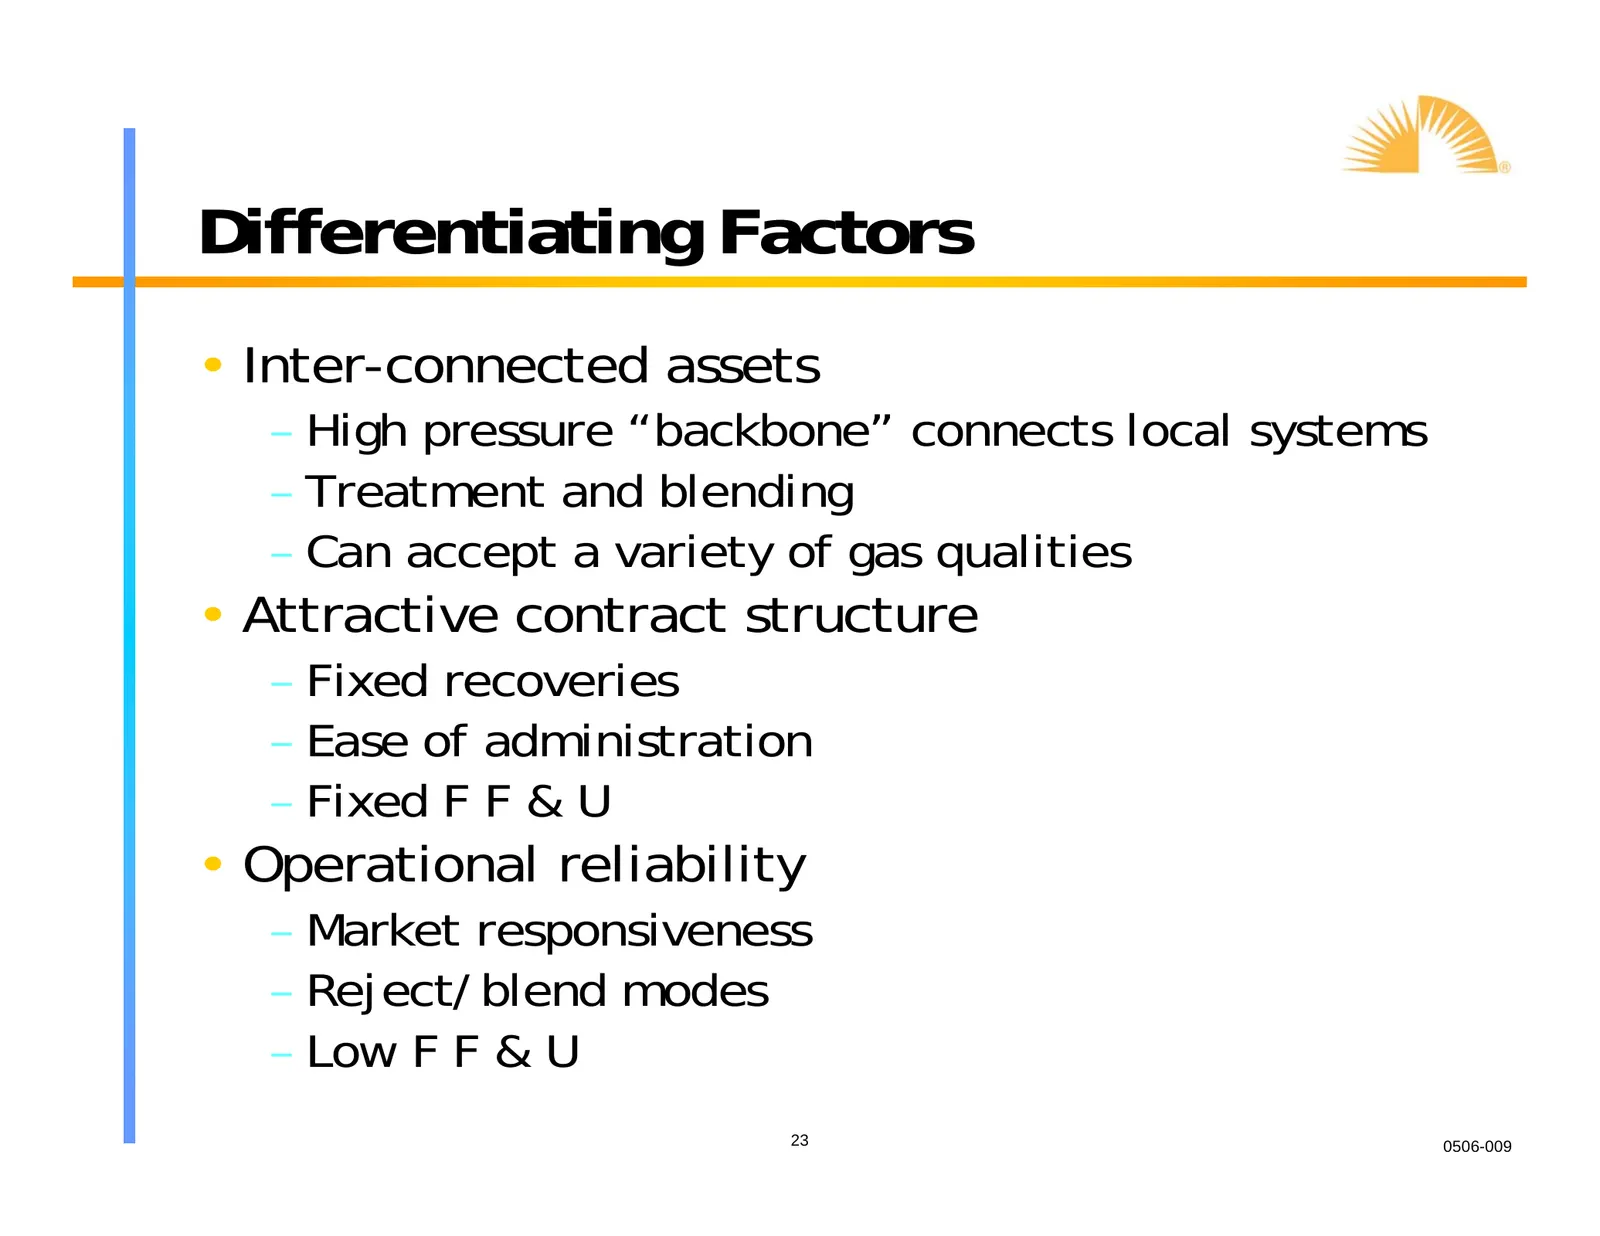
Differentiating Factors • Inter-connected assets – High pressure “backbone” connects local systems – Treatment and blending – Can accept a variety of gas qualities • Attractive contract structure – Fixed recoveries – Ease of administration – Fixed F F & U • Operational reliability – Market responsiv
Slide 24: Differentiating Factors
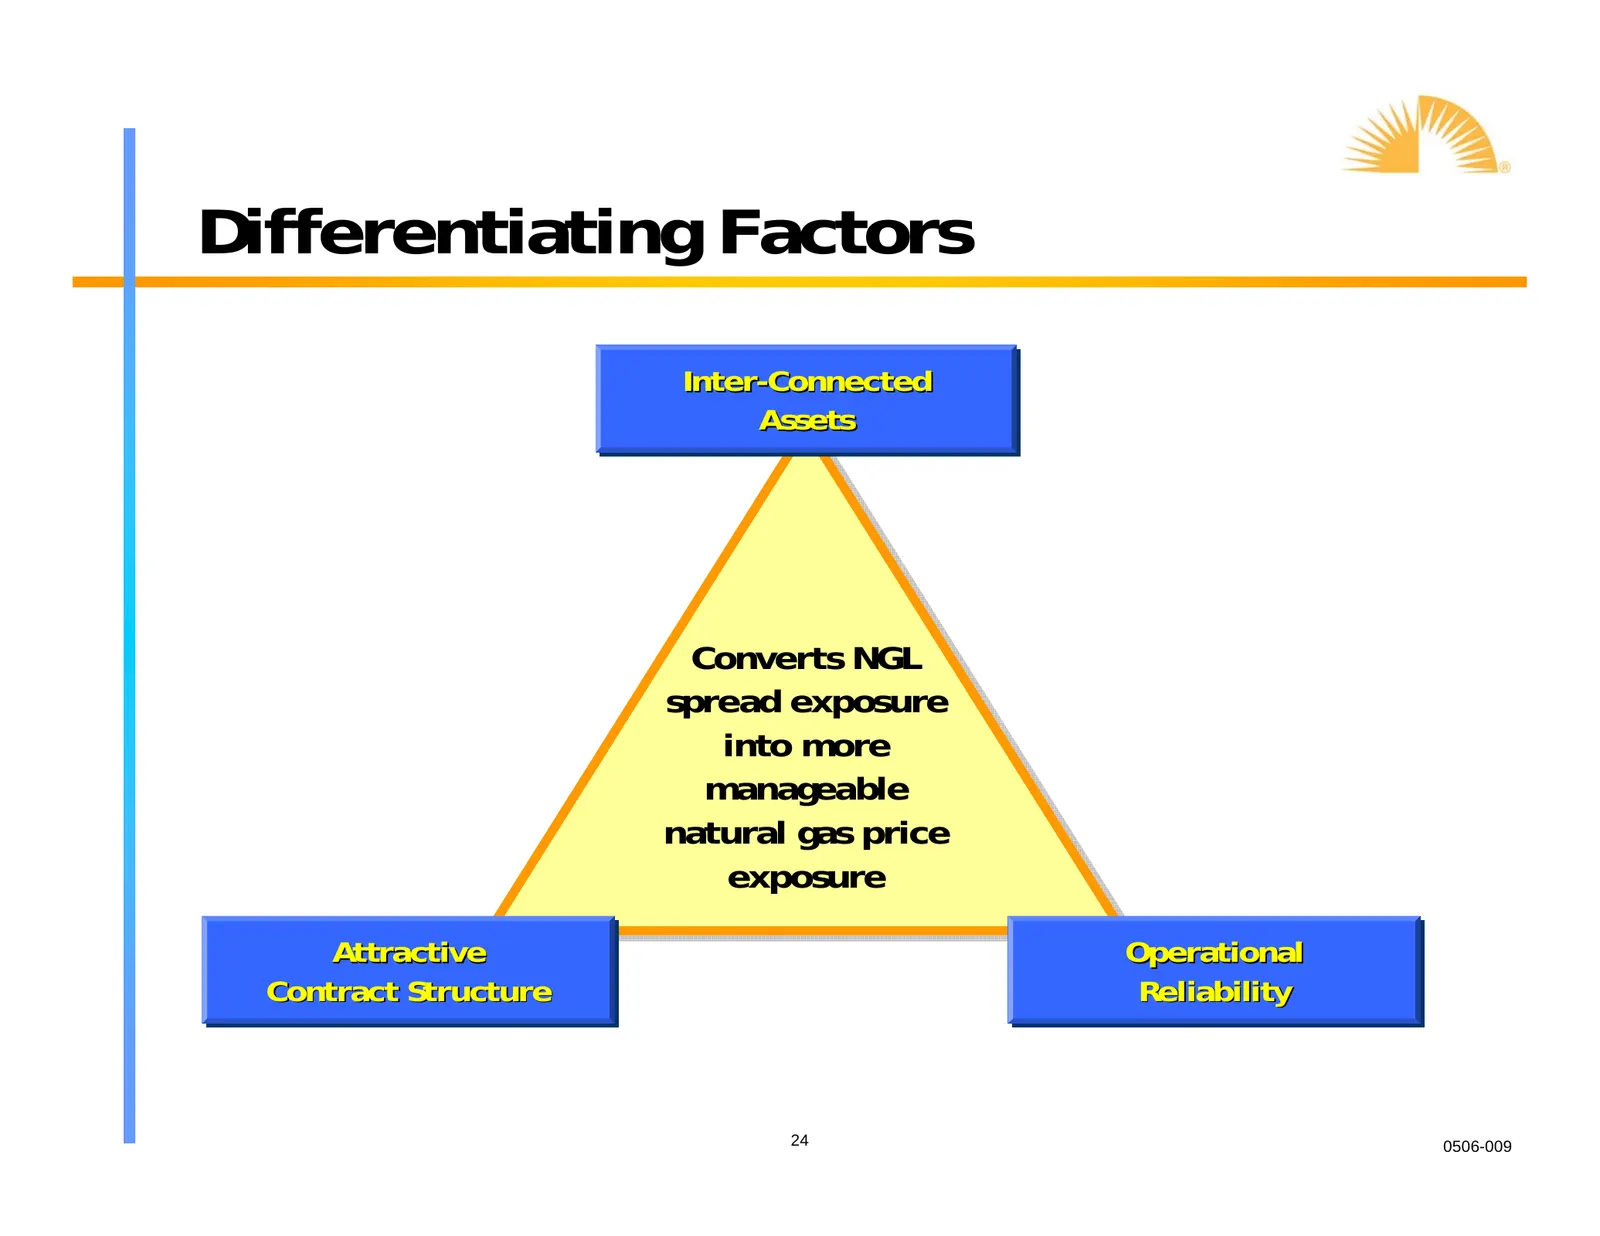
Differentiating Factors Inter -Connected Inter-Connected Assets Assets Converts NGL spread exposure into more manageable natural gas price exposure Attractive Attractive Operational Operational Contract Contract Structure Structure Reliability Reliability 24 0506-009
Slide 25: Processing Risk Profile
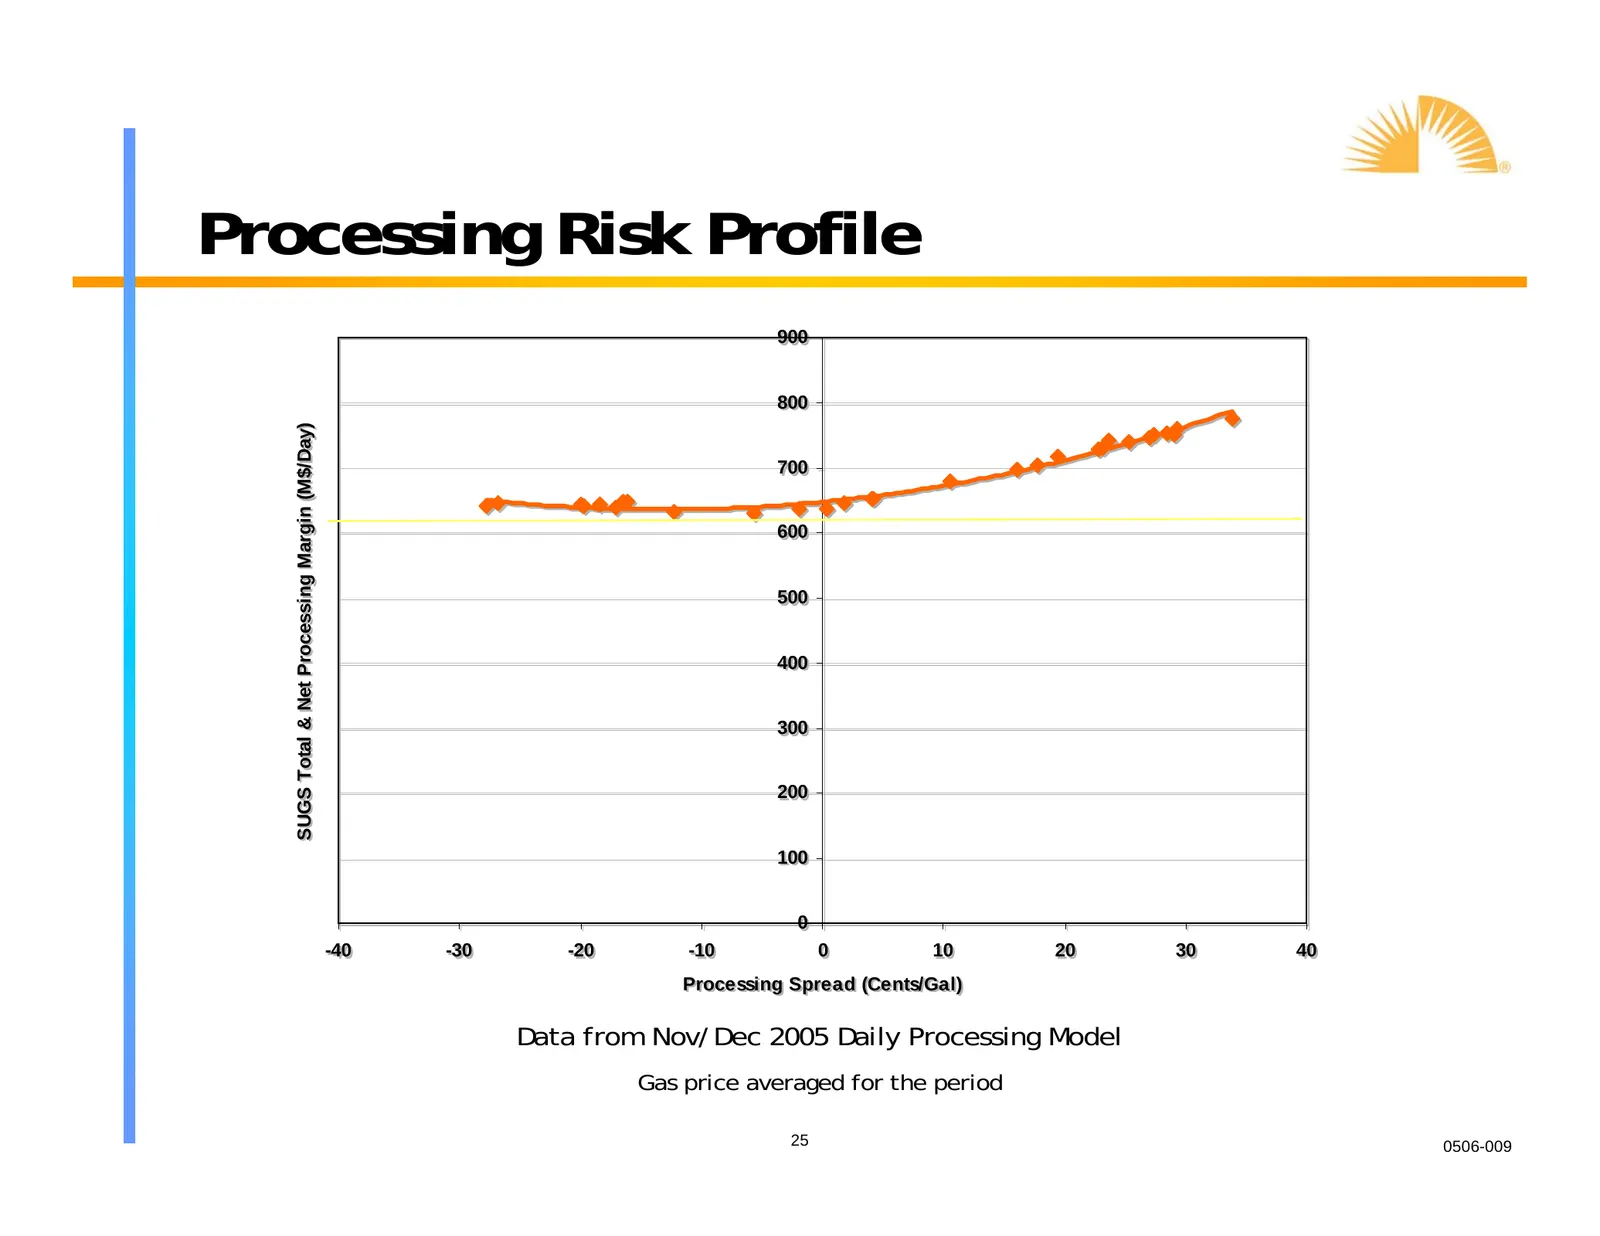
Processing Risk Profile 900 900 800 800 (M$/Day) Margin (M$/Day) 700 700 Processing Margin 600 600 Net Processing 500 500 400 400 & Net Total & 300 300 SUGS Total 200 200 SUGS 100 100 00 -40 -40 -30 -30 -20 -20 -10 -10 00 10 10 20 20 30 30 40 40 Processing Processing Spread Spread (Cents/Gal) (Cents
Slide 26: Hedging Strategy
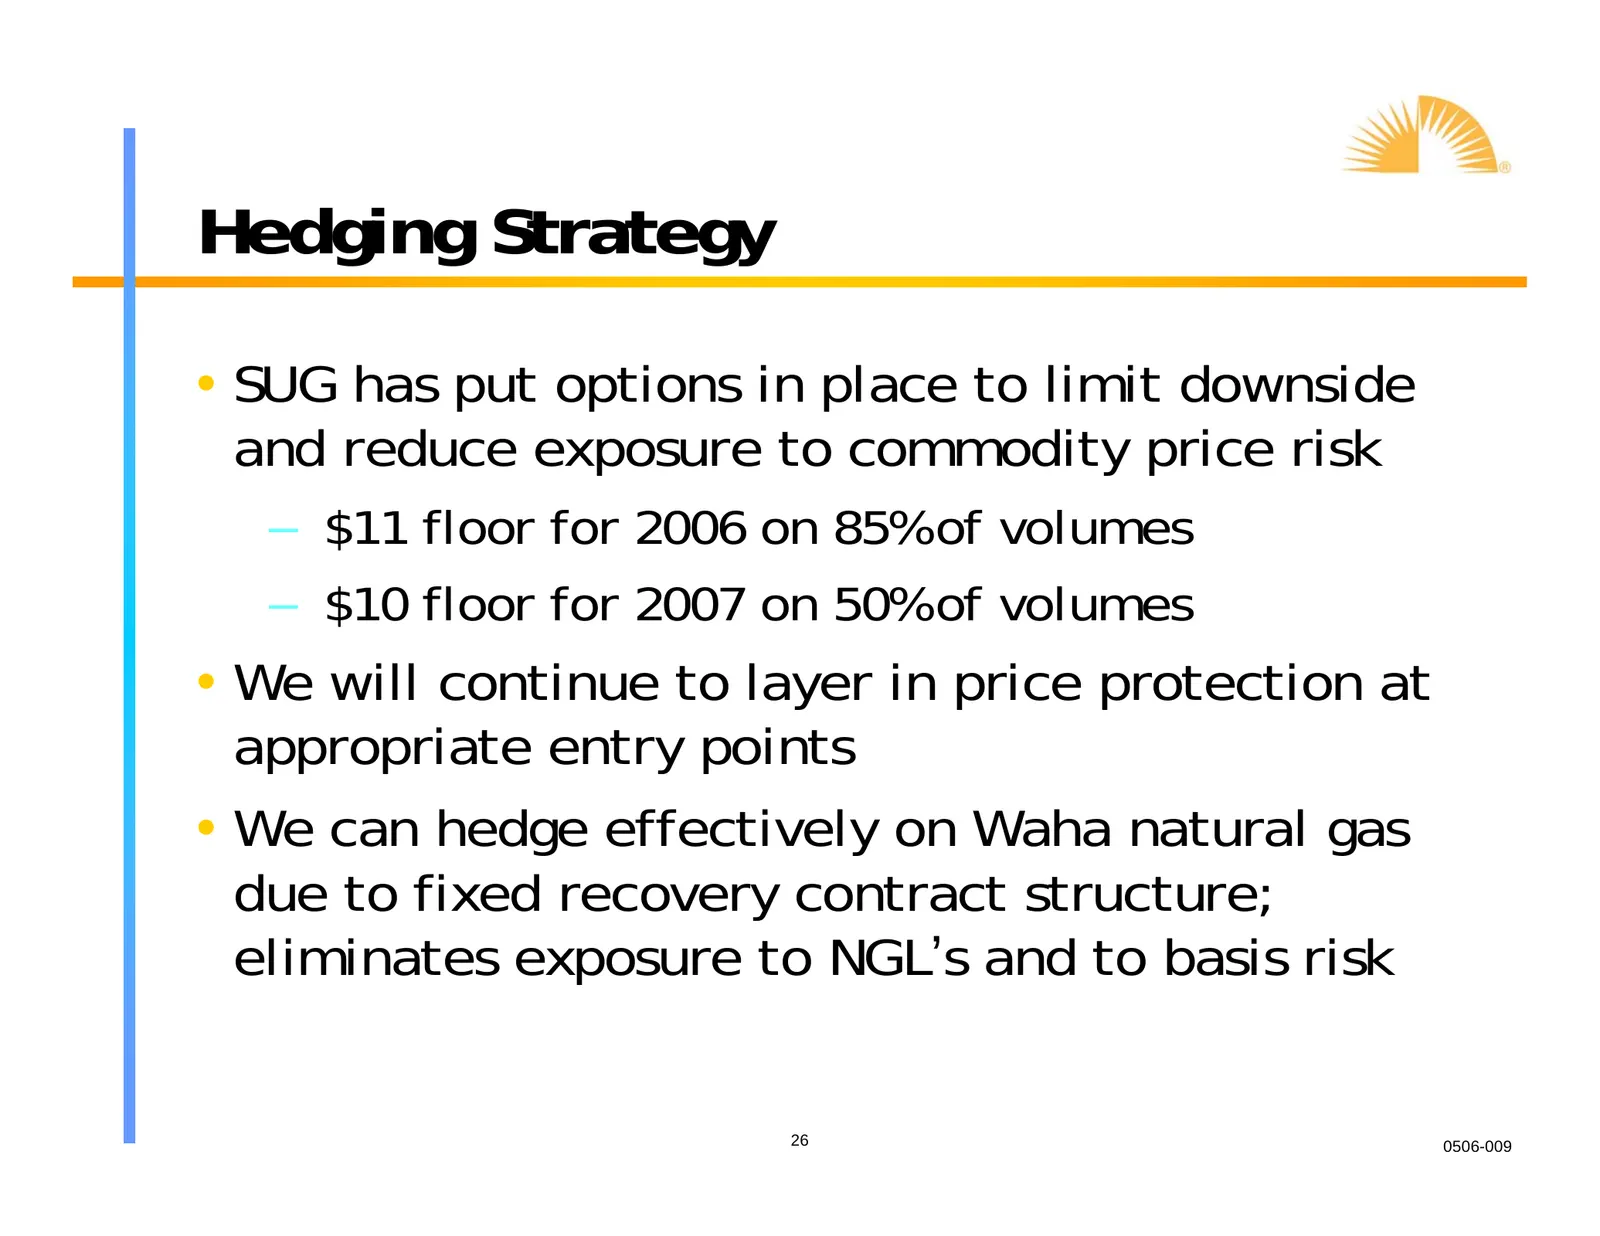
Hedging Strategy • SUG has put options in place to limit downside and reduce exposure to commodity price risk – $11 floor for 2006 on 85% of volumes – $10 floor for 2007 on 50% of volumes • We will continue to layer in price protection at appropriate entry points • We can hedge effectively on Waha n

Slide 27: Growth Projects
yl”, Growth Projects
Slide 28: Projects in Process
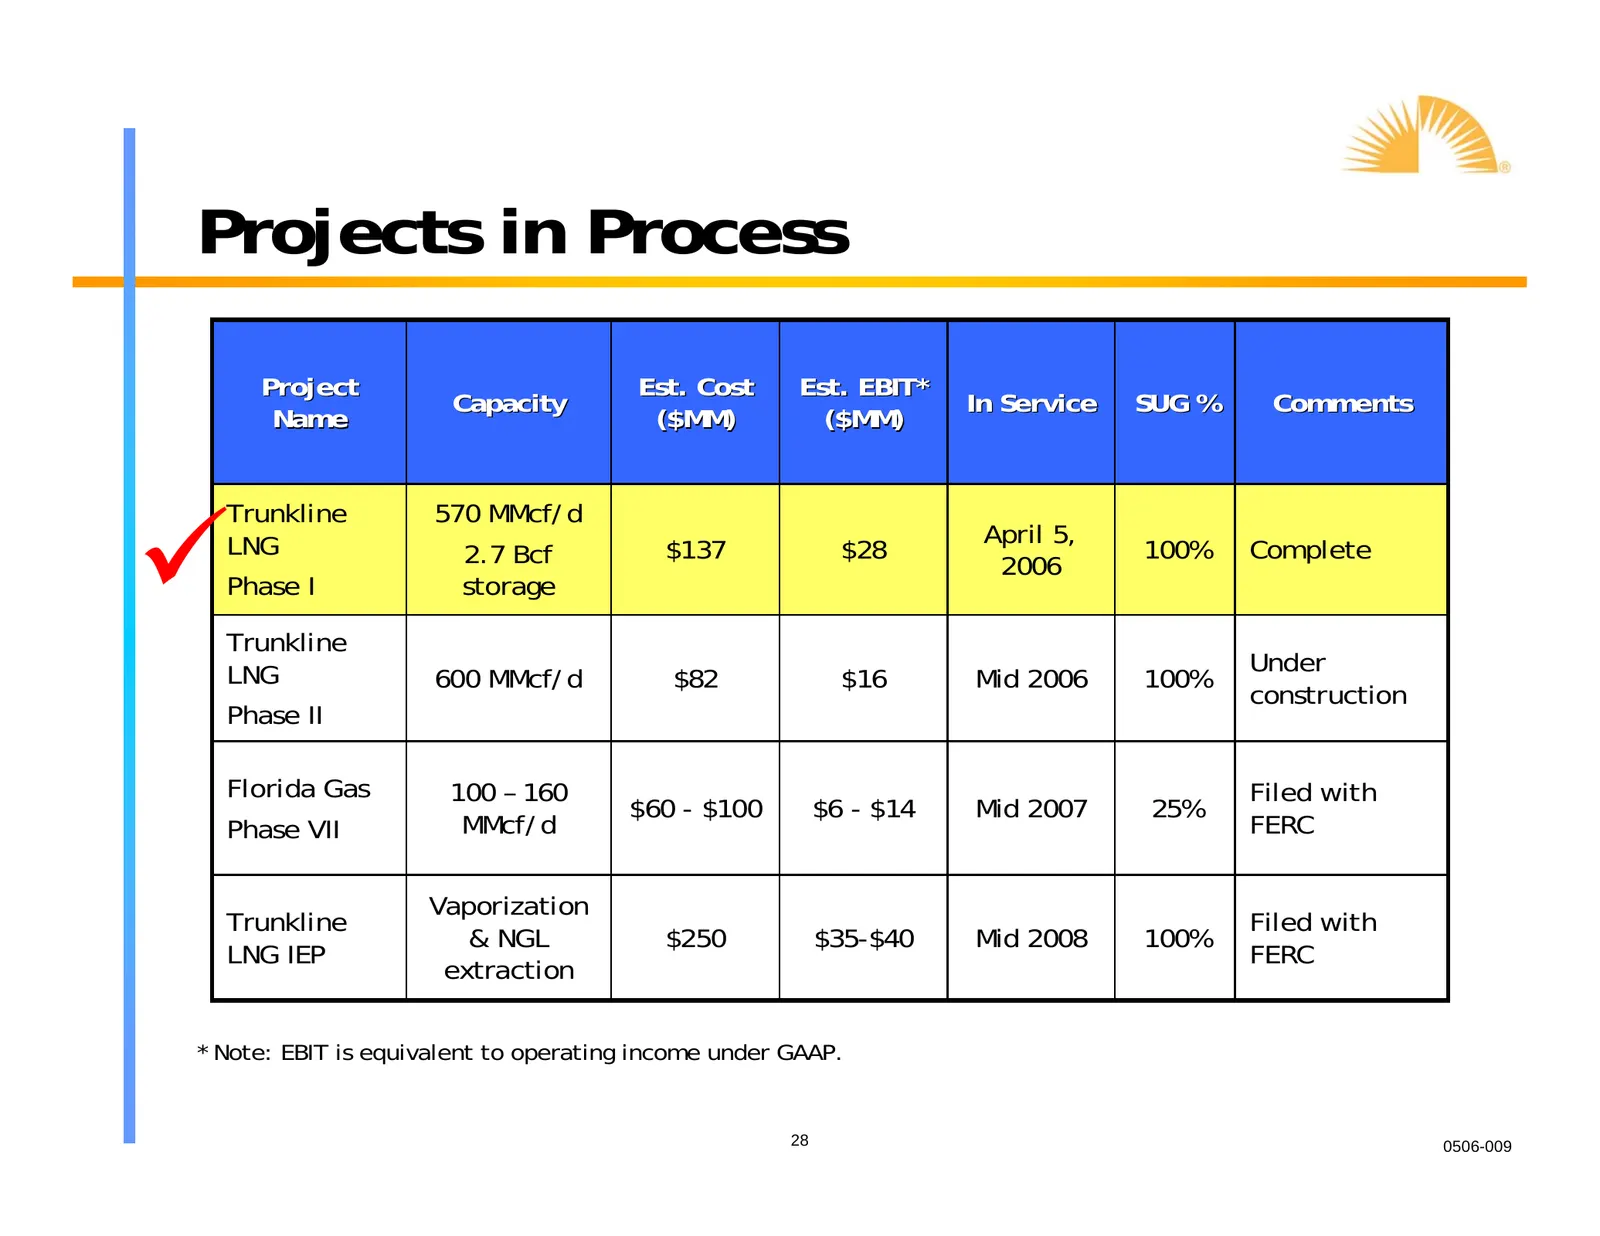
Projects in Process Project Est. Cost Est. EBIT* Capacity In Service SUG % Comments Name ($MM) ($MM) 9 Trunkline 570 MMcf/d LNG April 5, 2.7 Bcf $137 $28 100% Complete 2006 Phase I storage Trunkline LNG Under 600 MMcf/d $82 $16 Mid 2006 100% construction Phase II Florida Gas 100 – 160 Filed with $60
Slide 29: Projects Under Negotiation
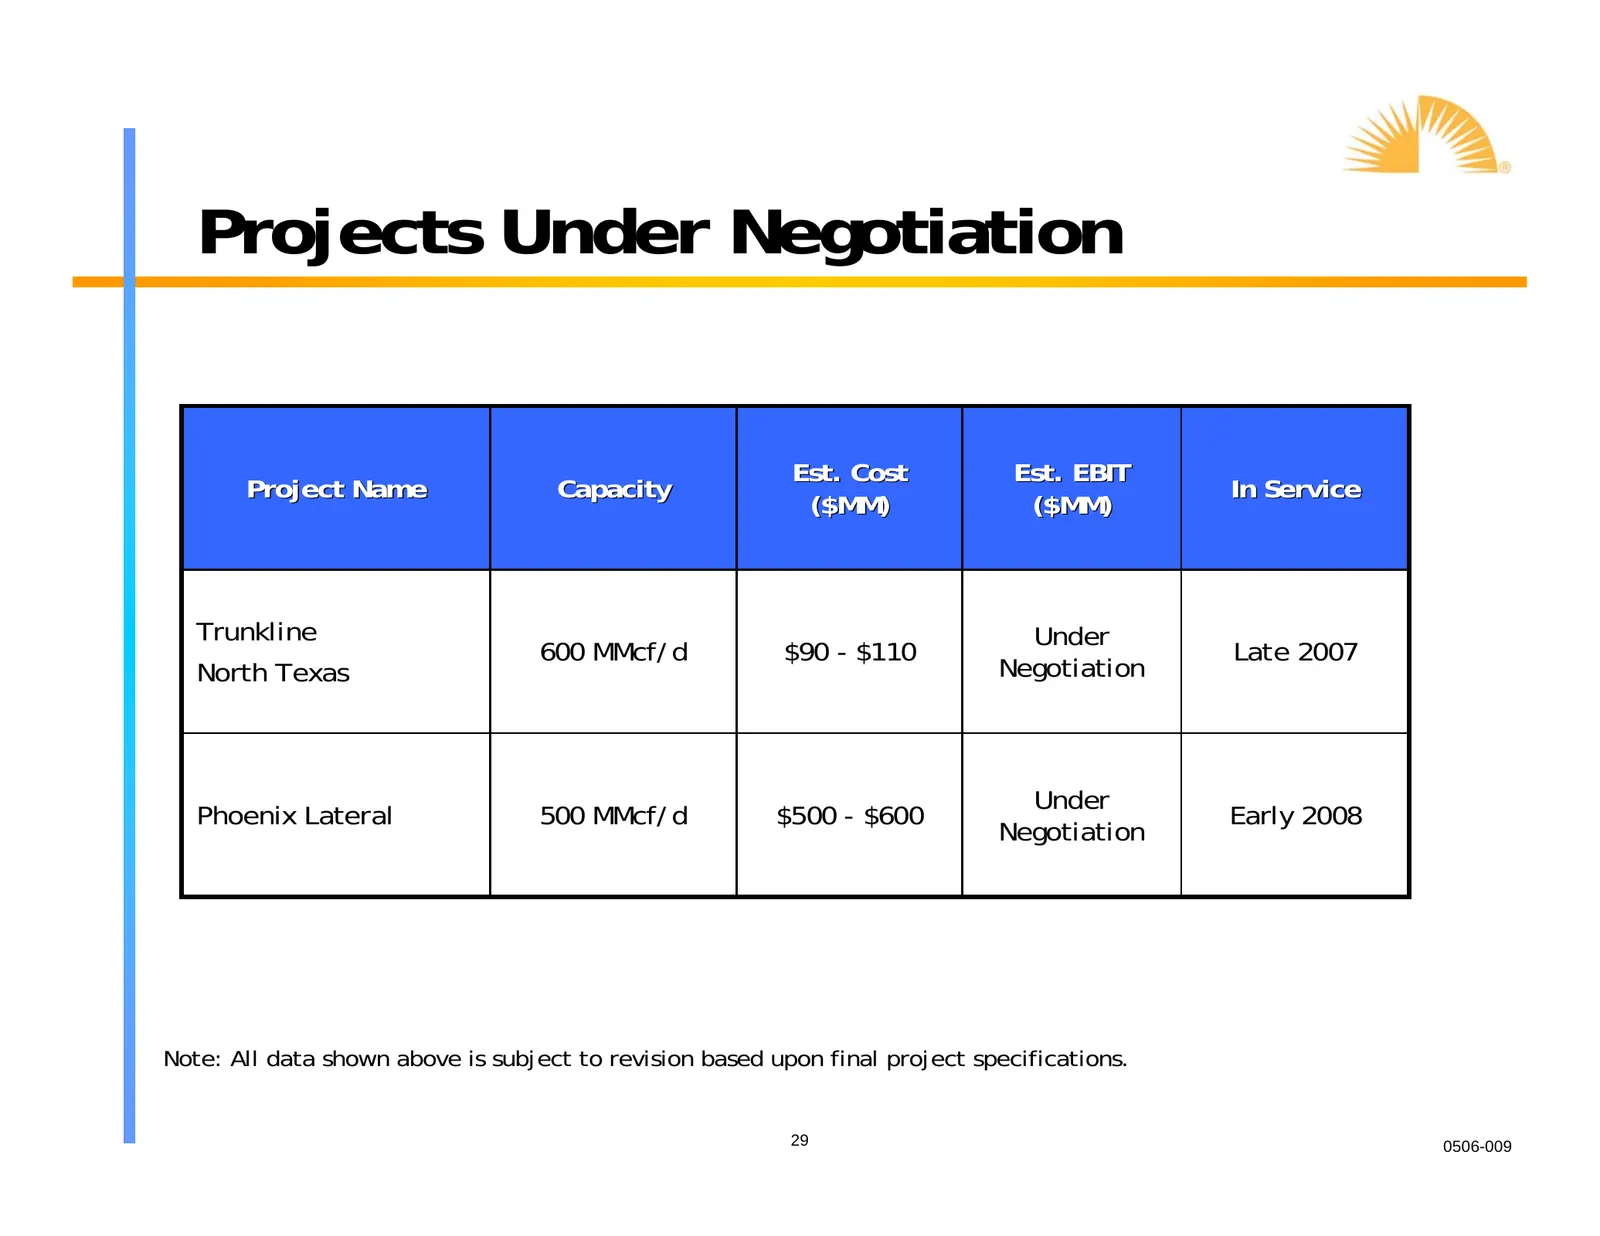
Projects Under Negotiation Est. Cost Est. EBIT Project Name Capacity In Service ($MM) ($MM) Trunkline Under 600 MMcf/d $90 - $110 Late 2007 North Texas Negotiation Under Phoenix Lateral 500 MMcf/d $500 - $600 Early 2008 Negotiation Note: All data shown above is subject to revision based upon final p

Slide 30: Financial Information
yl”, Financial Information
Slide 31: EPS Growth Profile
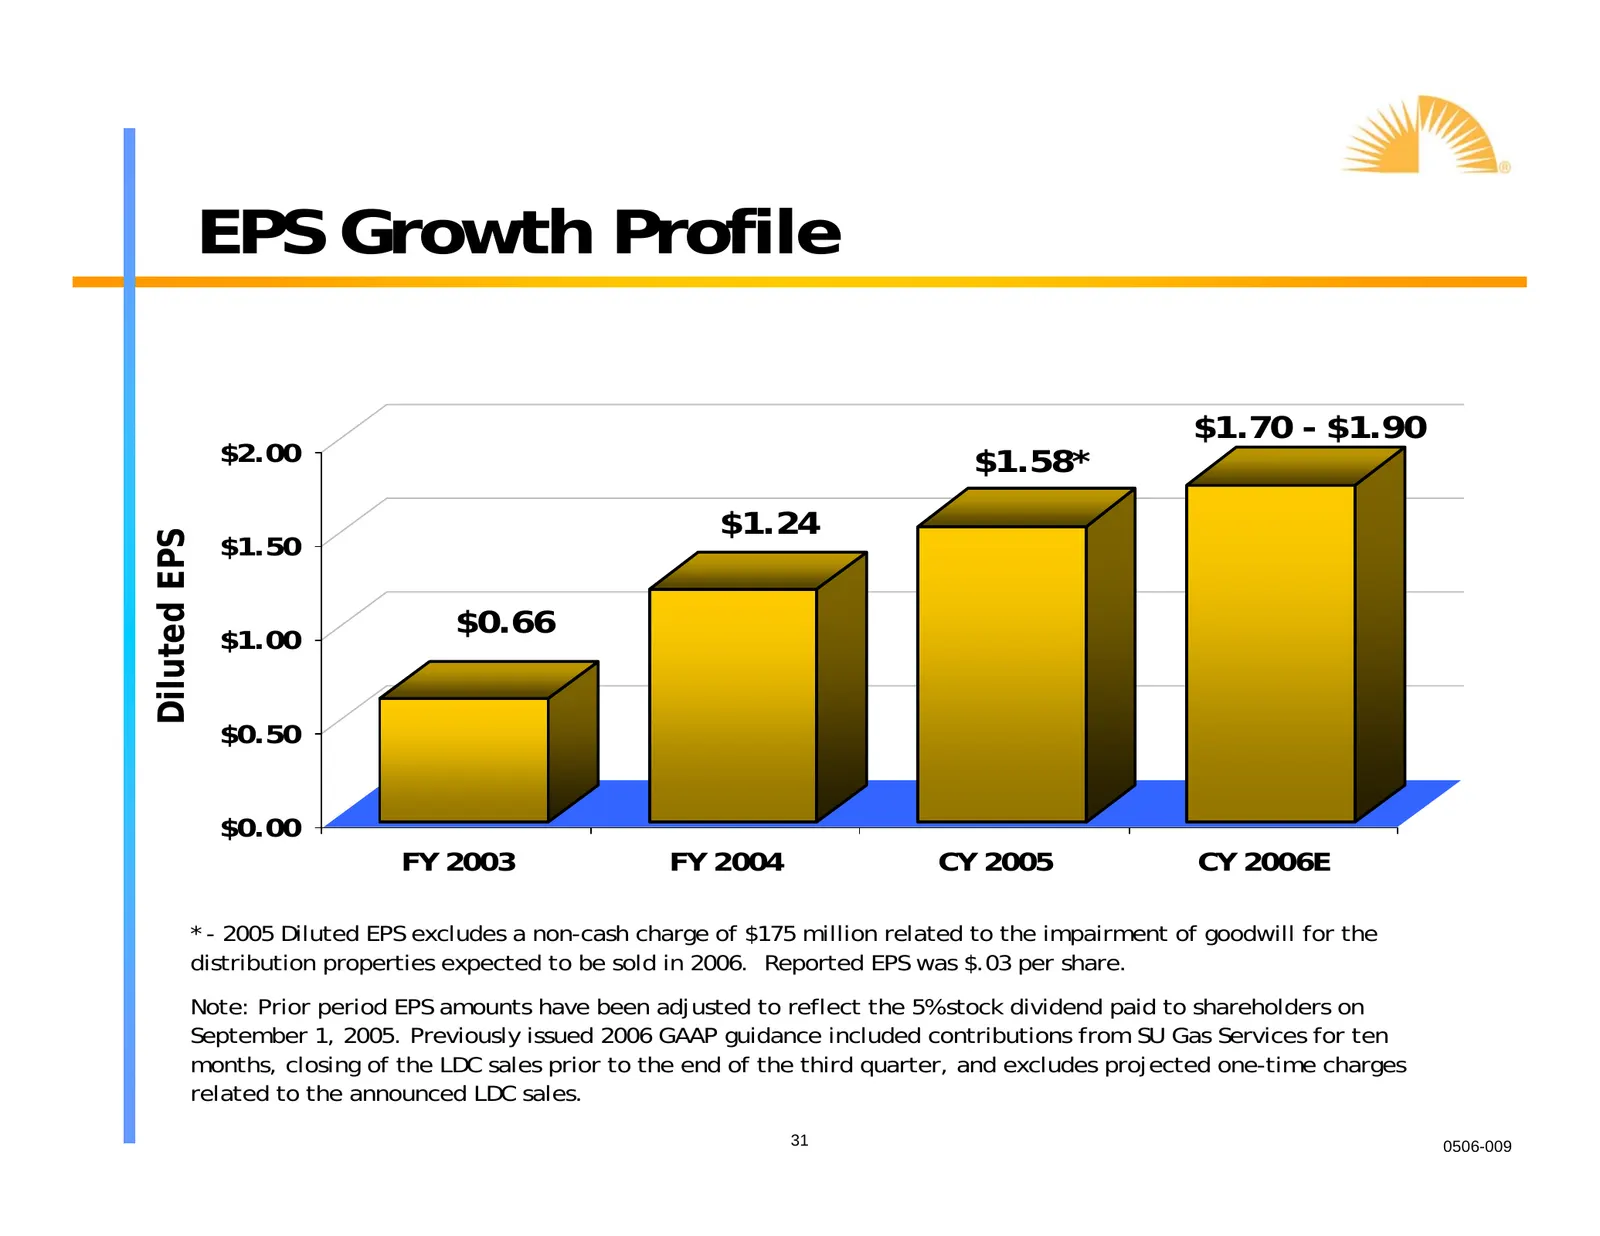
EPS Growth Profile $1.70 - $1.90 $2.00 $1.58* $1.24 $1.50 Diluted EPS $1.00 $0.66 $0.50 $0.00 FY 2003 FY 2004 CY 2005 CY 2006E * - 2005 Diluted EPS excludes a non-cash charge of $175 million related to the impairment of goodwill for the distribution properties expected to be sold in 2006. Reported E
Slide 32: Strong Cash Generator
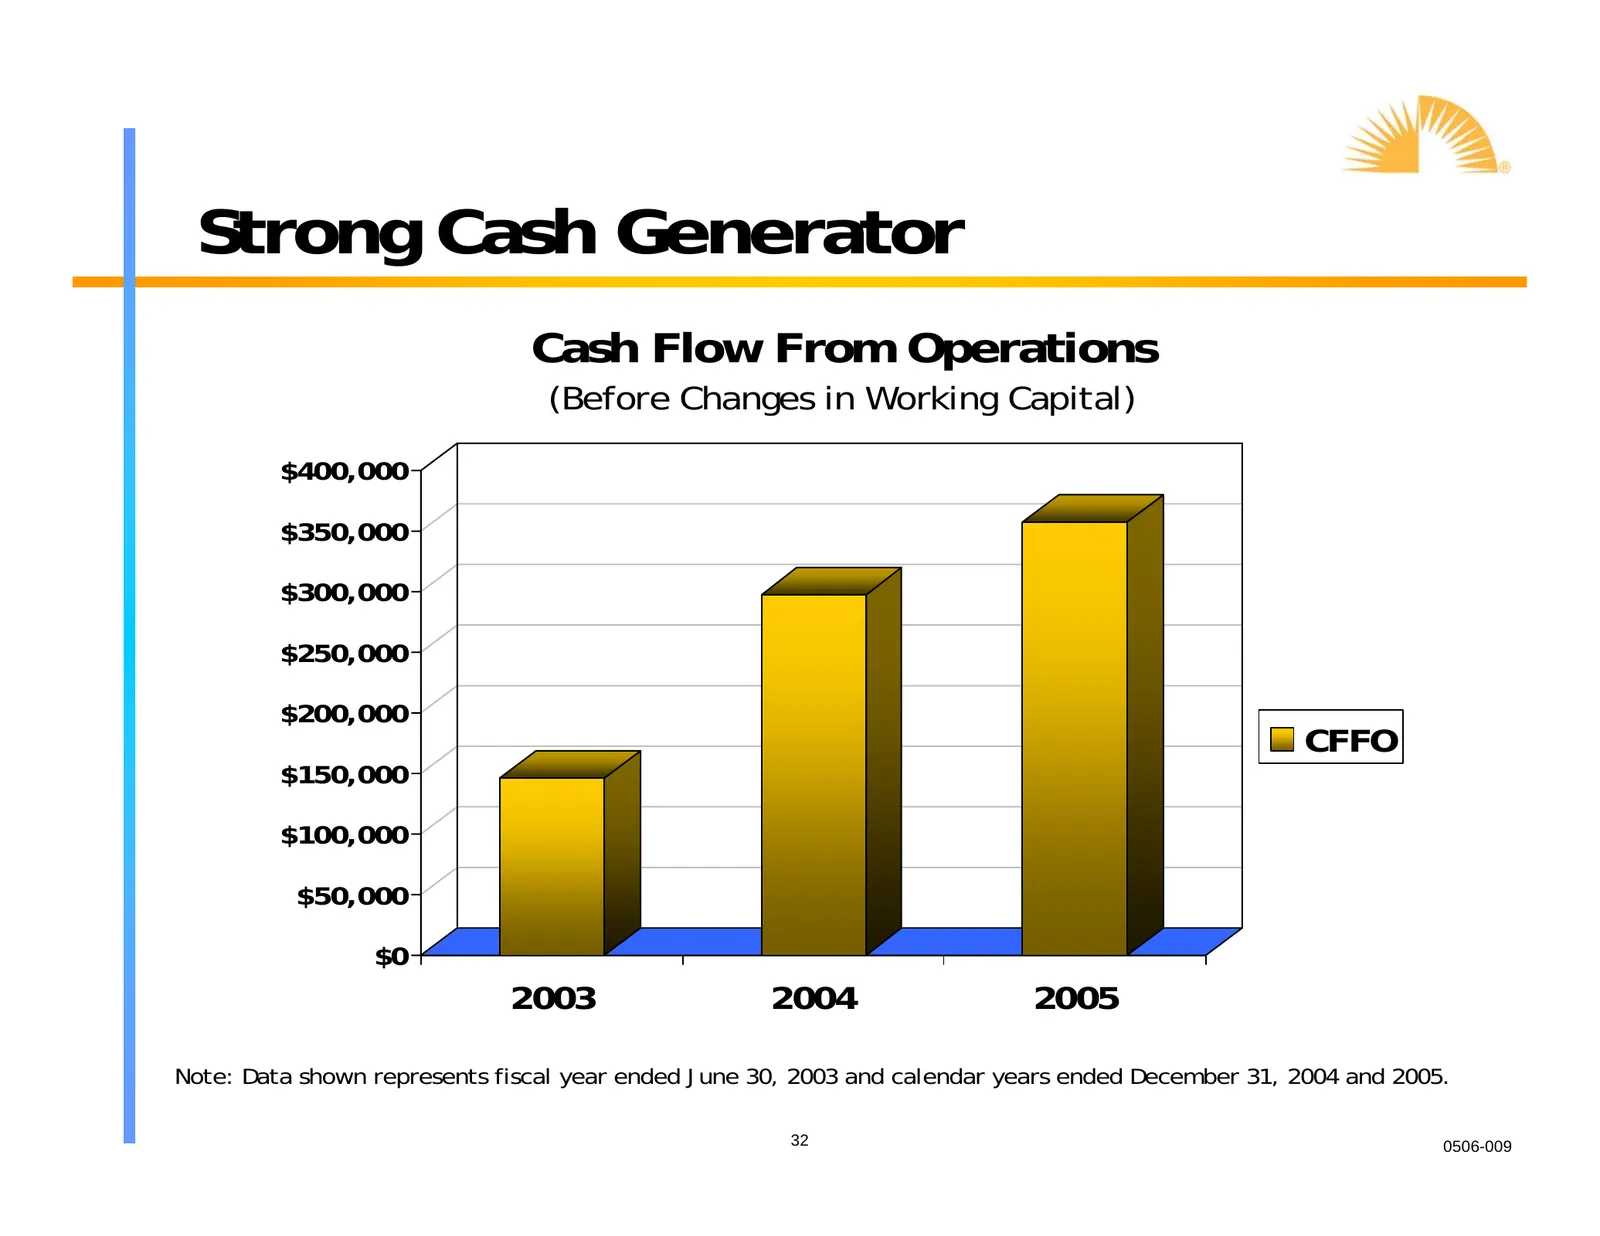
Strong Cash Generator Cash Flow From Operations (Before Changes in Working Capital) $400,000 $350,000 $300,000 $250,000 ($000) $200,000 CFFO $150,000 $100,000 $50,000 $0 2003 2004 2005 Note: Data shown represents fiscal year ended June 30, 2003 and calendar years ended December 31, 2004 and 2005. 32
Slide 33: Segment Operating Income
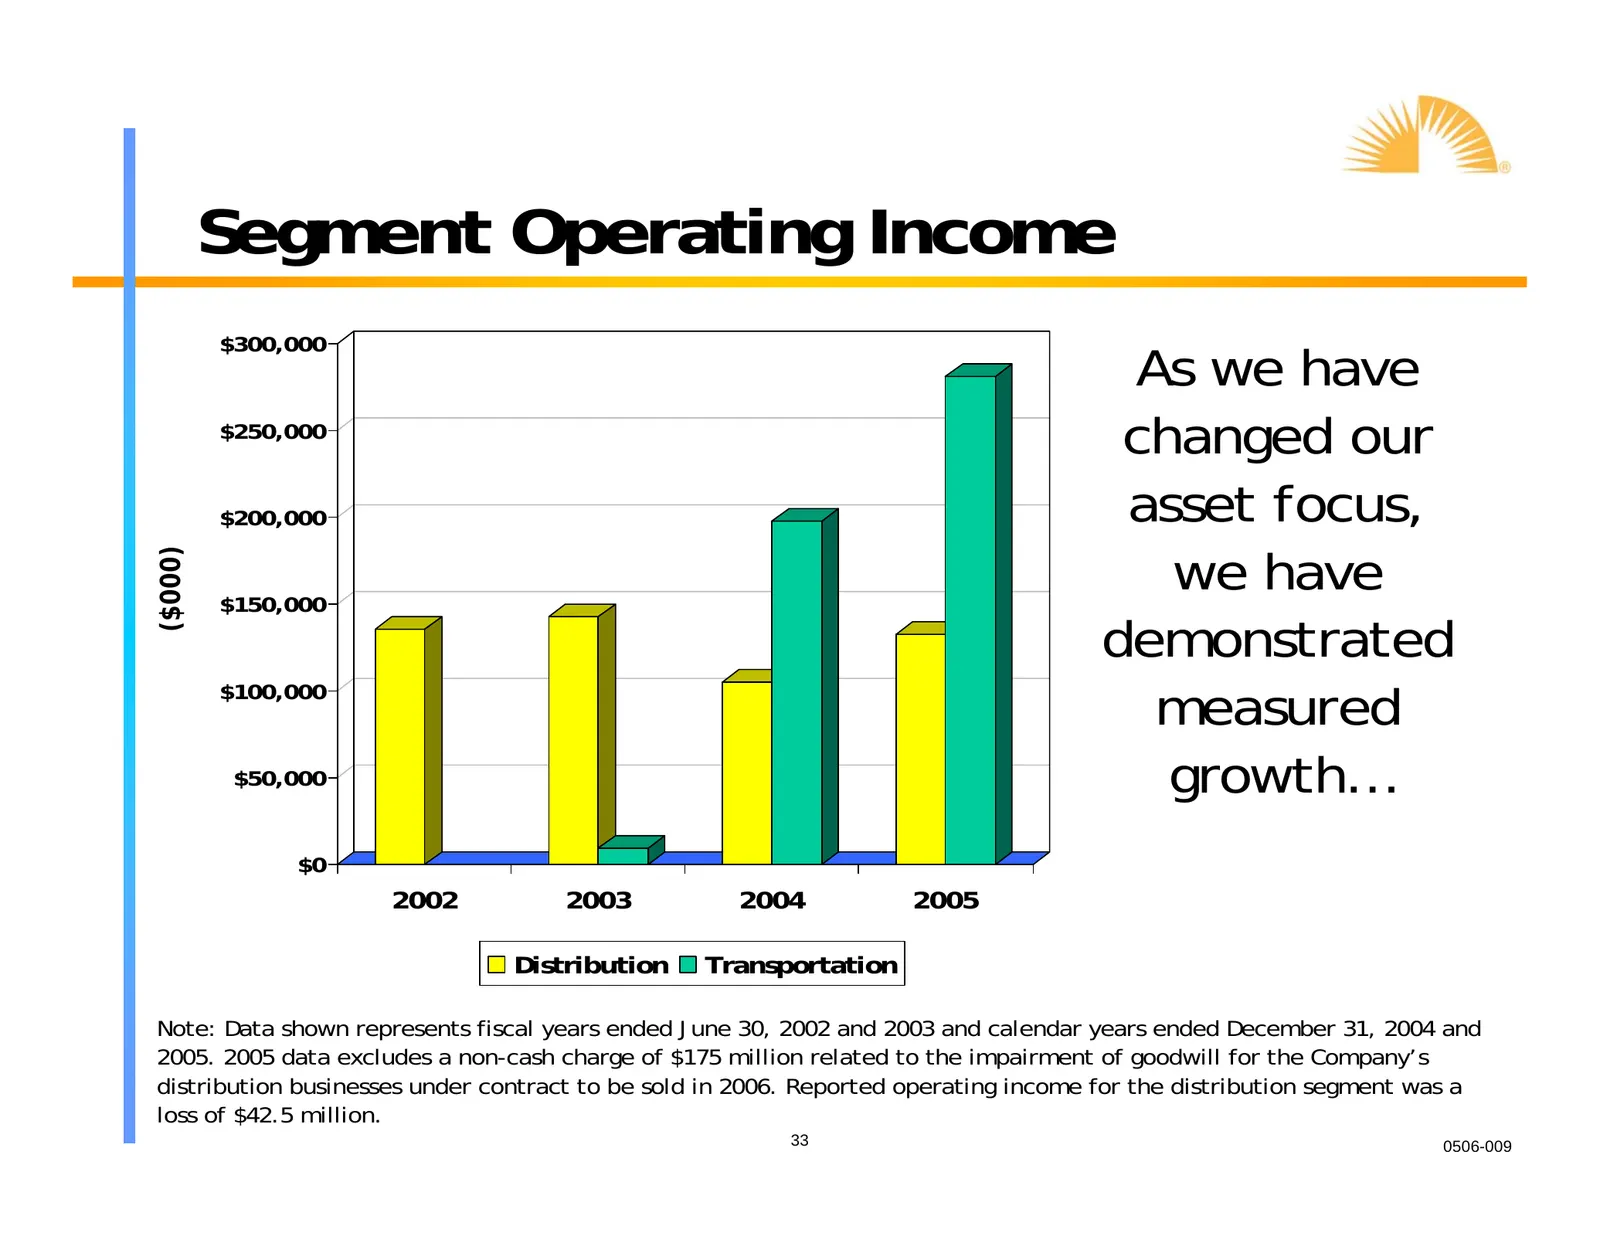
Segment Operating Income $300,000 As we have $250,000 changed our $200,000 asset focus, we have ($000) $150,000 demonstrated $100,000 measured $50,000 growth… $0 2002 2003 2004 2005 Distribution Transportation Note: Data shown represents fiscal years ended June 30, 2002 and 2003 and calendar years e
Slide 34: Respect for the Balance Sheet
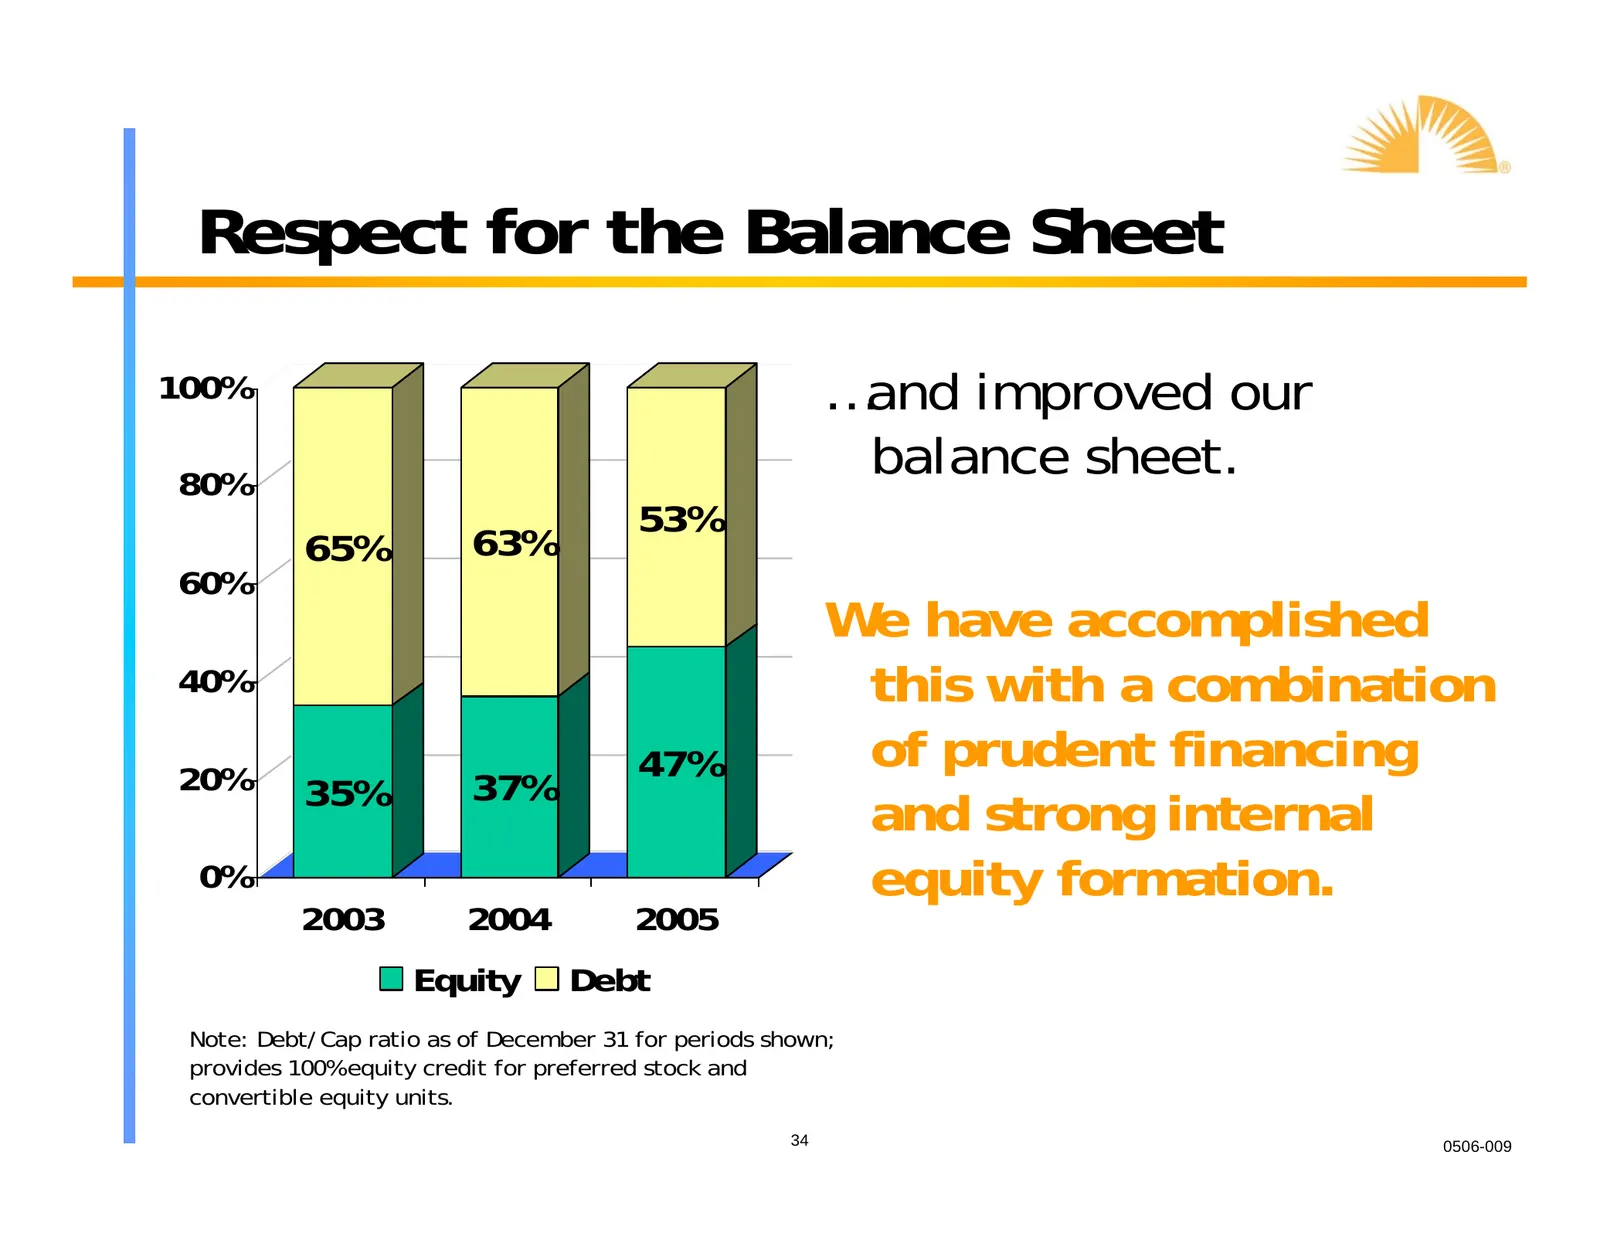
Respect for the Balance Sheet 100% …and improved our 80% balance sheet. 53% 65% 63% 60% We have accomplished 40% this with a combination 20% 47% of prudent financing 35% 37% and strong internal 0% equity formation. 2003 2004 2005 Equity Debt Note: Debt/Cap ratio as of December 31 for periods shown;
Slide 35: 1Q 2006 Highlights ($000s)
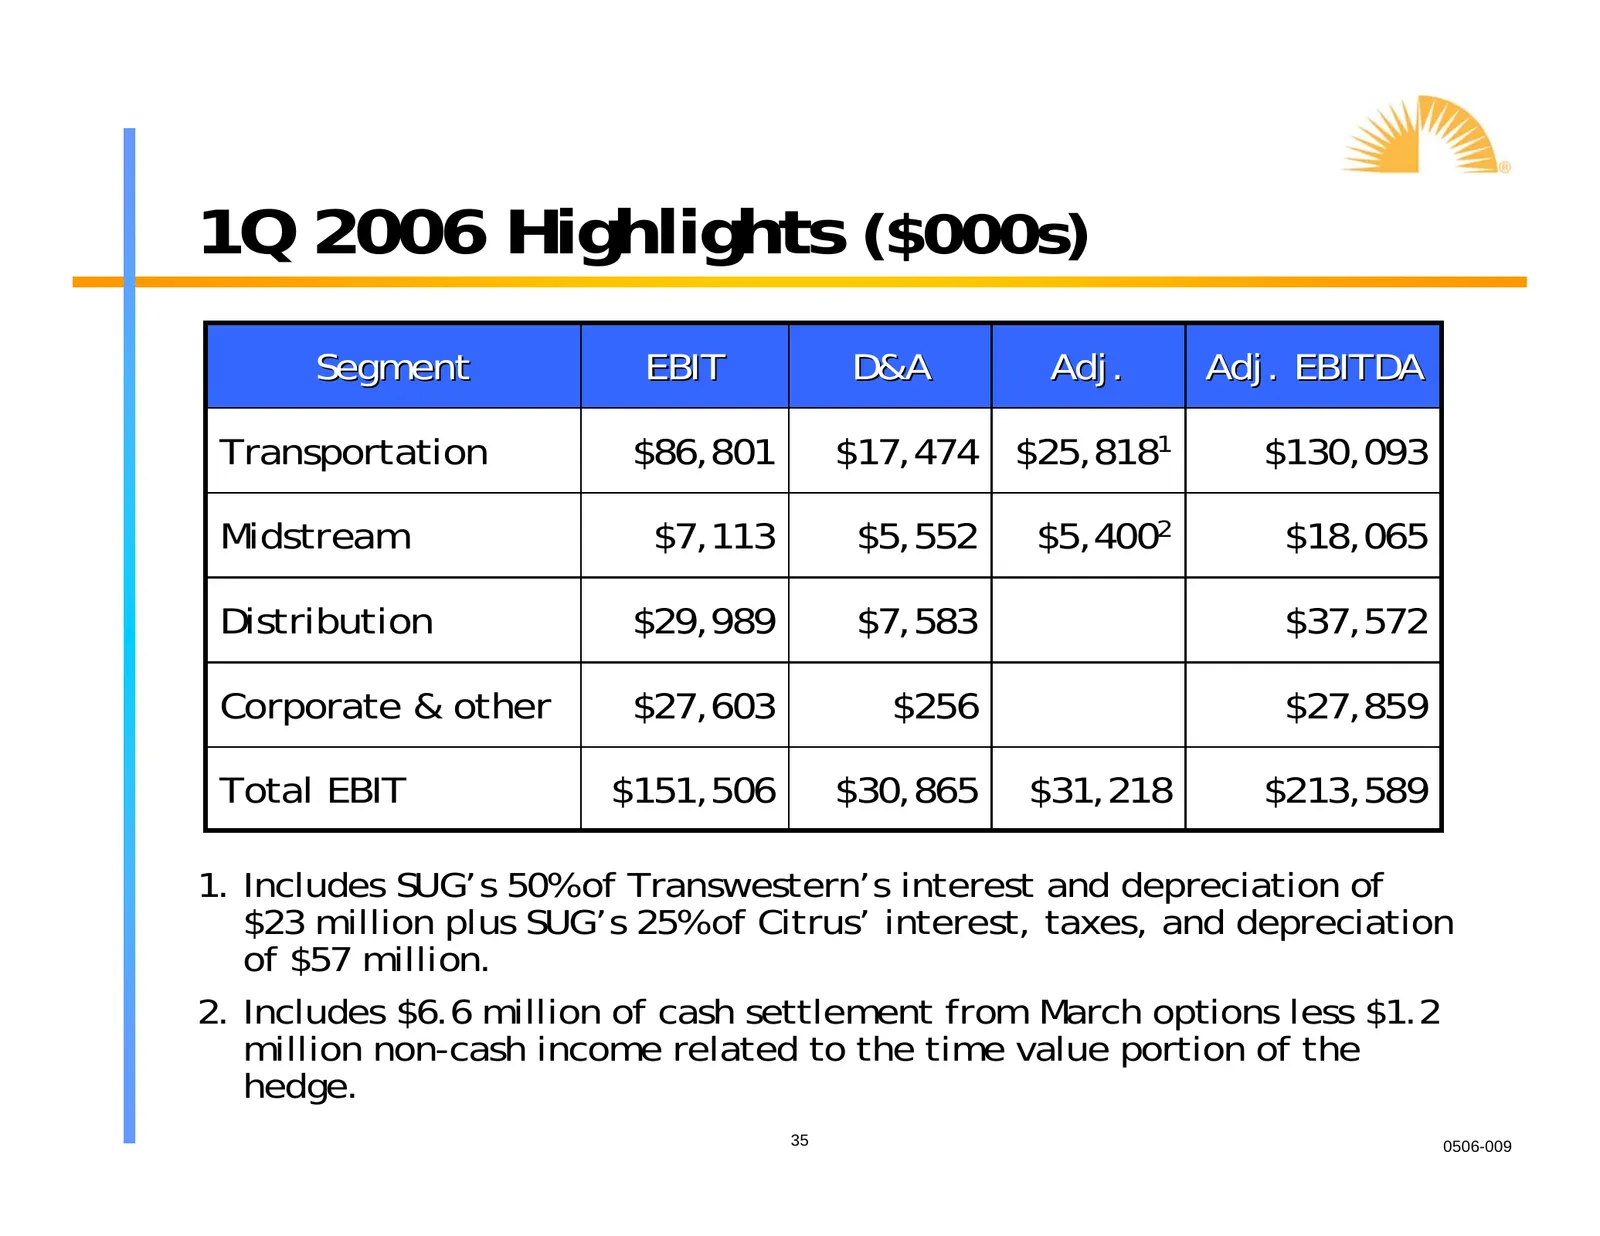
1Q 2006 Highlights ($000s) Segment EBIT D&A Adj. Adj. EBITDA Transportation $86,801 $17,474 $25,8181 $130,093 Midstream $7,113 $5,552 $5,4002 $18,065 Distribution $29,989 $7,583 $37,572 Corporate & other $27,603 $256 $27,859 Total EBIT $151,506 $30,865 $31,218 $213,589 1. Includes SUG’s 50% of Trans
Slide 36: 1Q EBIT Reconciliation ($000s)
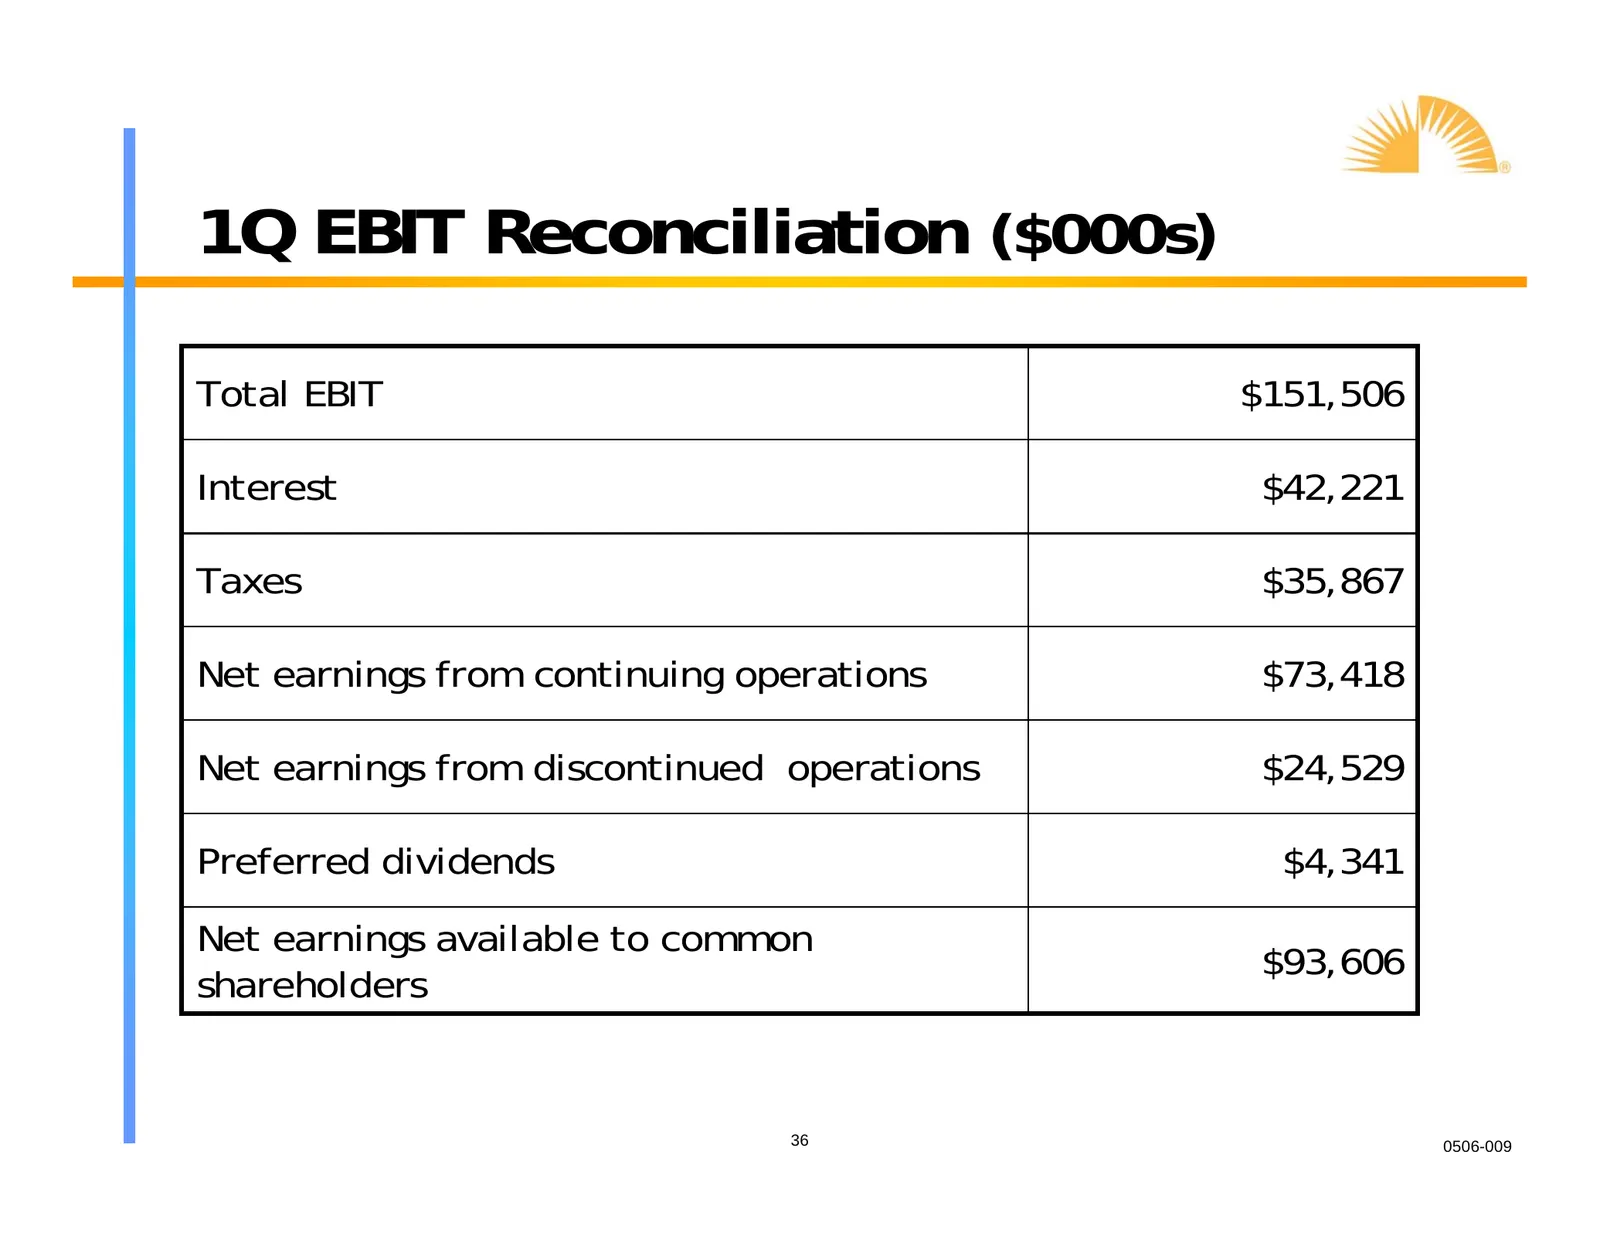
1Q EBIT Reconciliation ($000s) Total EBIT $151,506 Interest $42,221 Taxes $35,867 Net earnings from continuing operations $73,418 Net earnings from discontinued operations $24,529 Preferred dividends $4,341 Net earnings available to common $93,606 shareholders 36 0506-009
Source: SEC EDGAR · 8-K filed May 16, 2006
More decks from Southern Union Co
 Barclays Capital Investment Grade Energy and Pipeline Conference 201232 slides · Mar 8, 2012
 Debt Investor Presentation (February 2012)33 slides · Feb 22, 2012
 Merger or Acquisition (July 2011)11 slides · Jul 5, 2011
 Merger or Acquisition (June 2011)22 slides · Jun 16, 2011
 Investor Presentation (February 2011)37 slides · Feb 25, 2011
 BMO Capital Markets 2010 Utilities and Pipelines Day23 slides · Nov 30, 2010