MasterBrand, Inc. · NYSE:MBC
MasterBrand — Q3 2026 Earnings Presentation
23 slides from MasterBrand's earnings presentation, Nov 5, 2026
Slide 1: Q3 2026 Investor Presentation
Q3 2026 Investor Presentation November 5, 2026 1
Slide 2: Forward Looking Statements
Forward Looking Statements Certain statements contained in this presentation, other than purely historical information, including, but not limited to estimates, projections, statements relating to our business plans, objectives and expected operating results, financial outlook and cost synergies, an
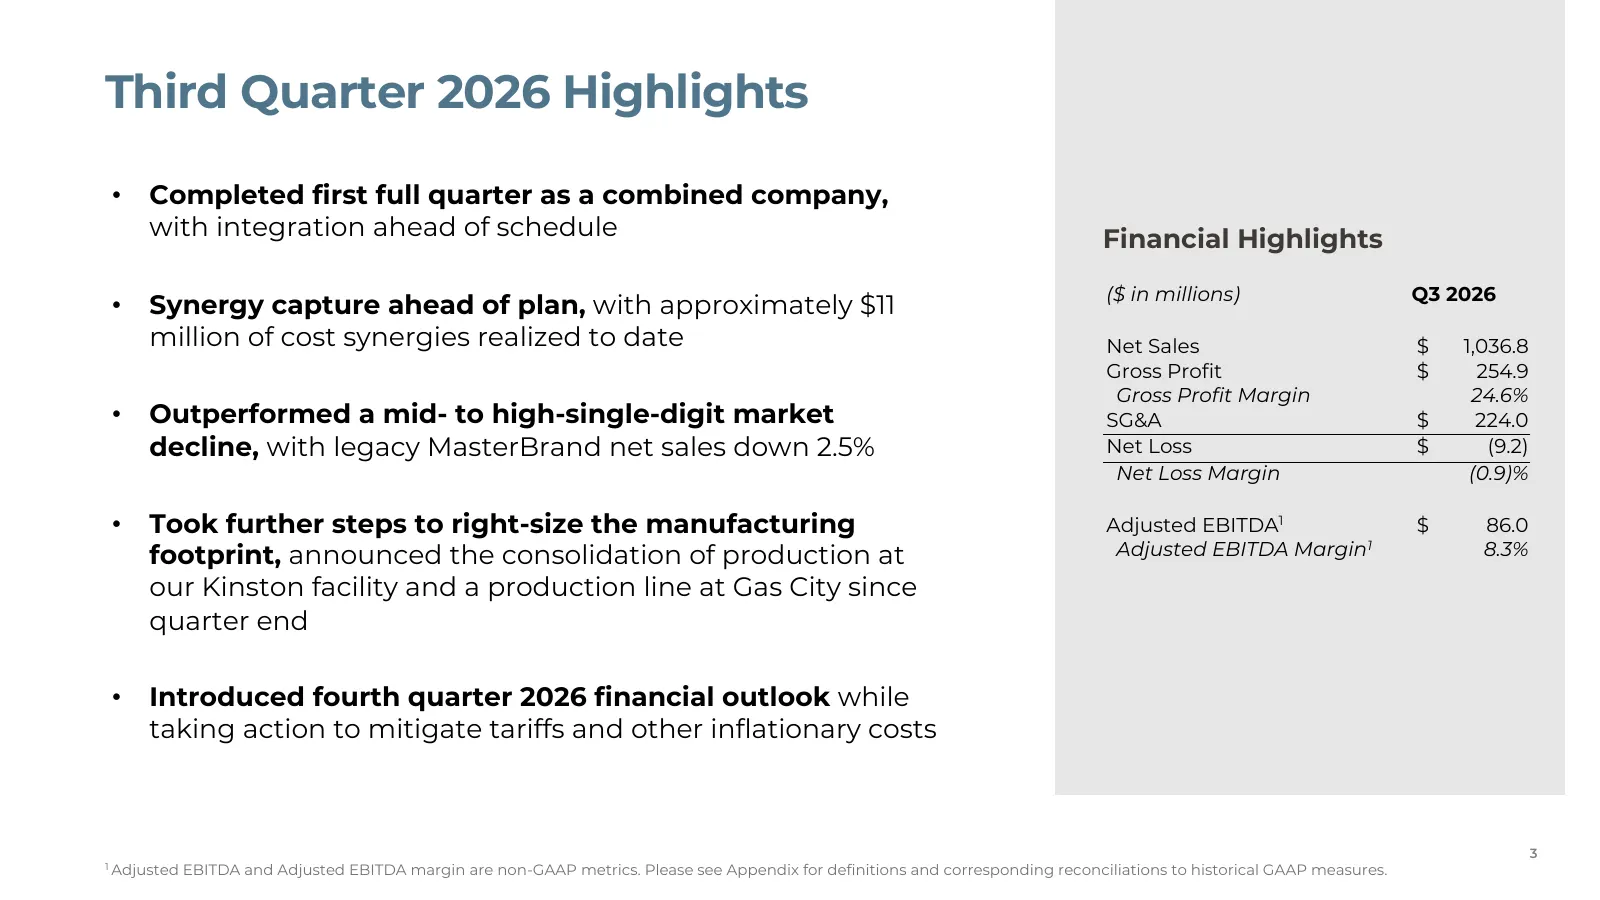
Slide 3: Third Quarter 2026 Highlights
Third Quarter 2026 Highlights • Completed first full quarter as a combined company, with integration ahead of schedule Financial Highlights ($ in millions) Q3 2026 • Synergy capture ahead of plan, with approximately $11 million of cost synergies realized to date Net Sales $ 1,036.8 Gross Profit $ 25
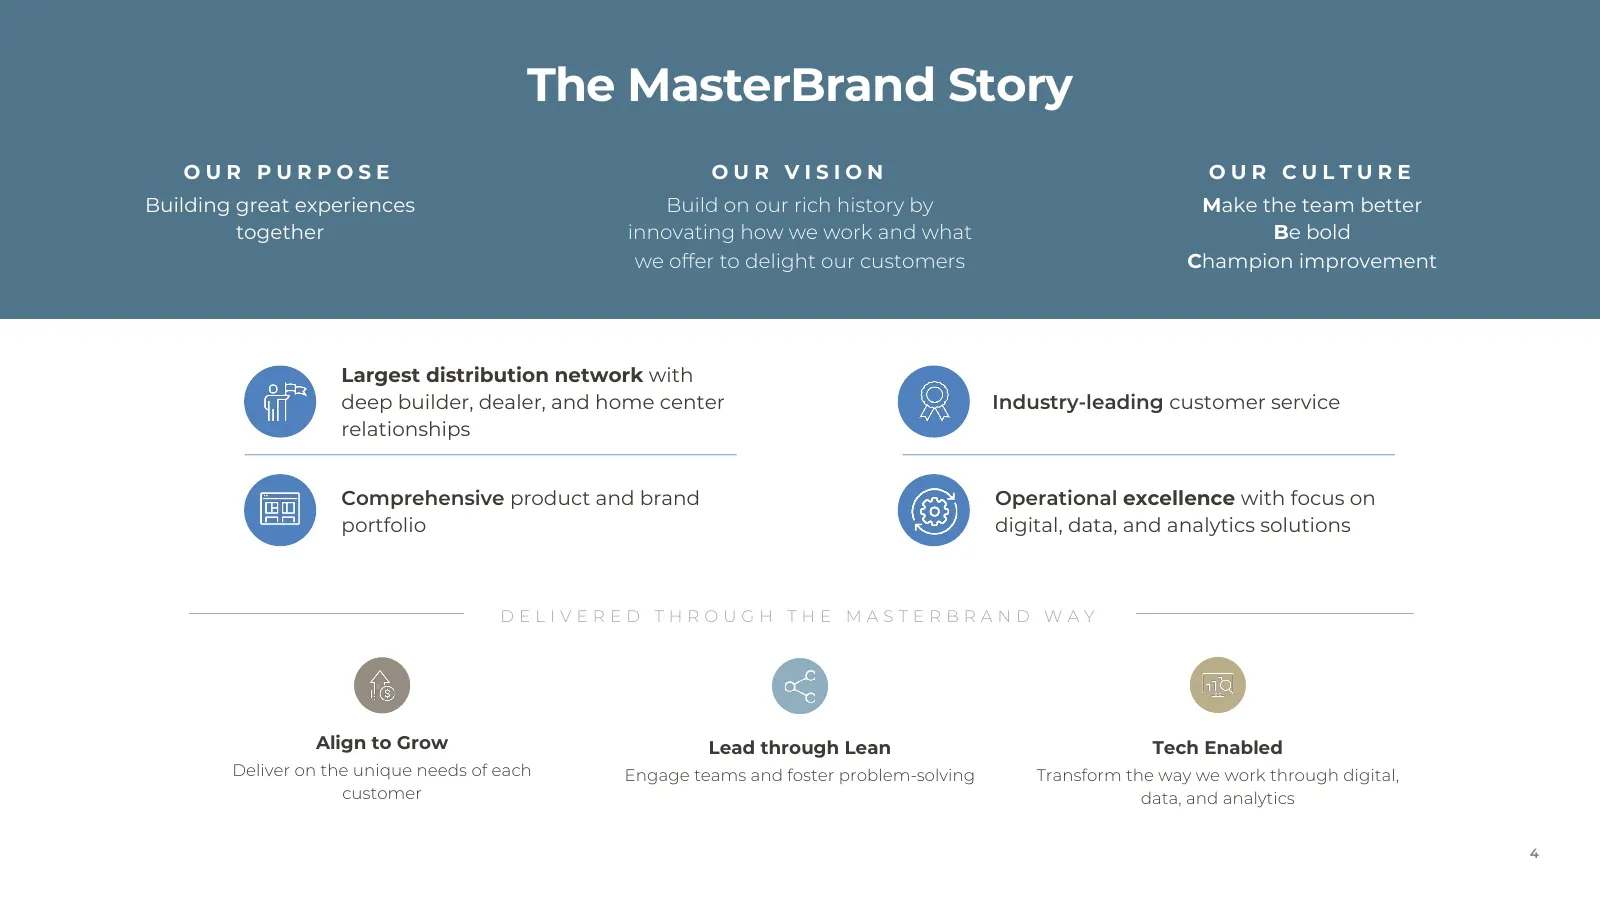
Slide 4: The MasterBrand Story
The MasterBrand Story OUR PURPOSE OUR VISION OUR CULTURE Building great experiences Build on our rich history by Make the team better together innovating how we work and what Be bold we offer to delight our customers Champion improvement Largest distribution network with deep builder, dealer, and ho
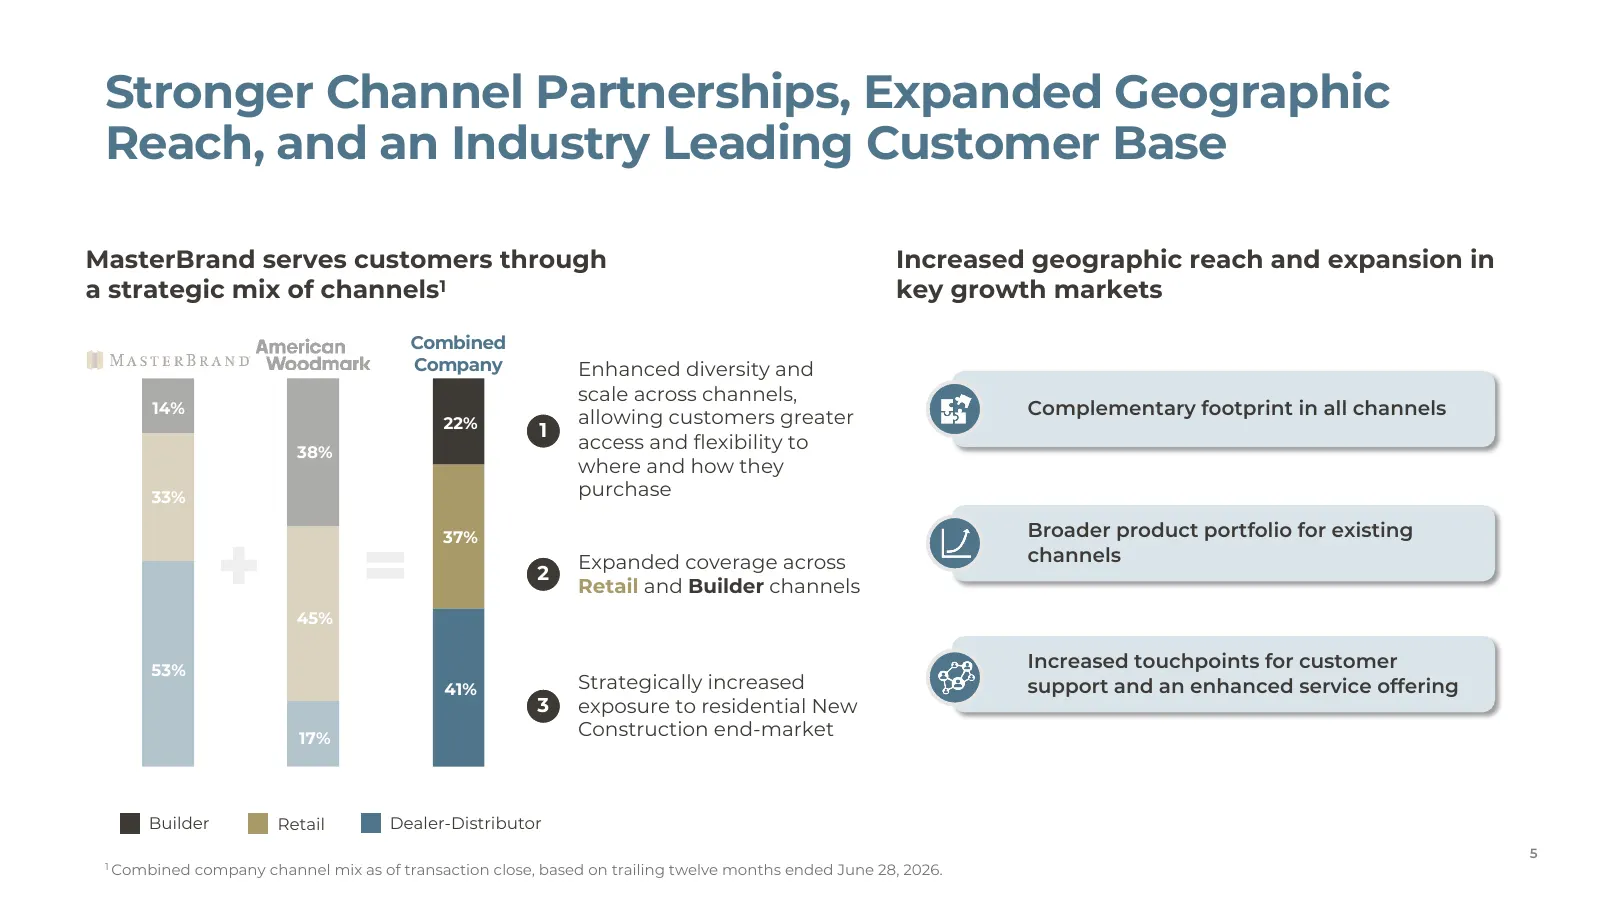
Slide 5: Stronger Channel Partnerships, Expanded Geographic Reach, and an Industry Leading Customer Base
Stronger Channel Partnerships, Expanded Geographic Reach, and an Industry Leading Customer Base MasterBrand serves customers through Increased geographic reach and expansion in a strategic mix of channels1 key growth markets Combined Company Enhanced diversity and scale across channels, 14% allowing
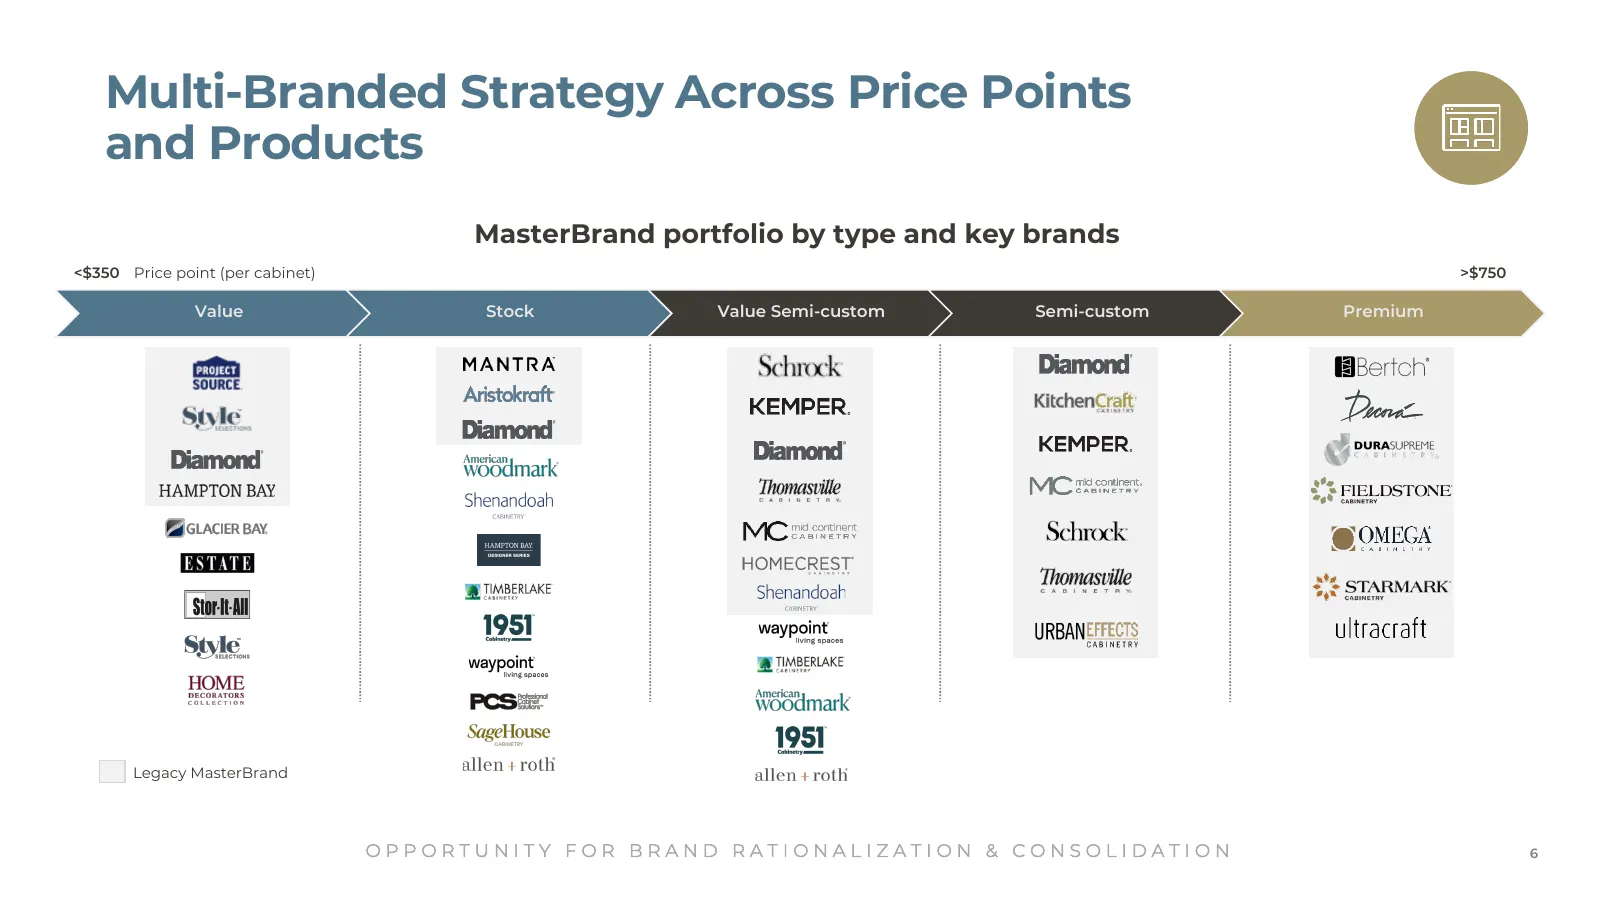
Slide 6: Multi-Branded Strategy Across Price Points and Products
Multi-Branded Strategy Across Price Points and Products MasterBrand portfolio by type and key brands <$350 Price point (per cabinet) >$750 Value Stock Value Semi-custom Semi-custom Premium Legacy MasterBrand OPPORTUNITY FOR BRAND RATIONALIZATION & CONSOLIDATION 6
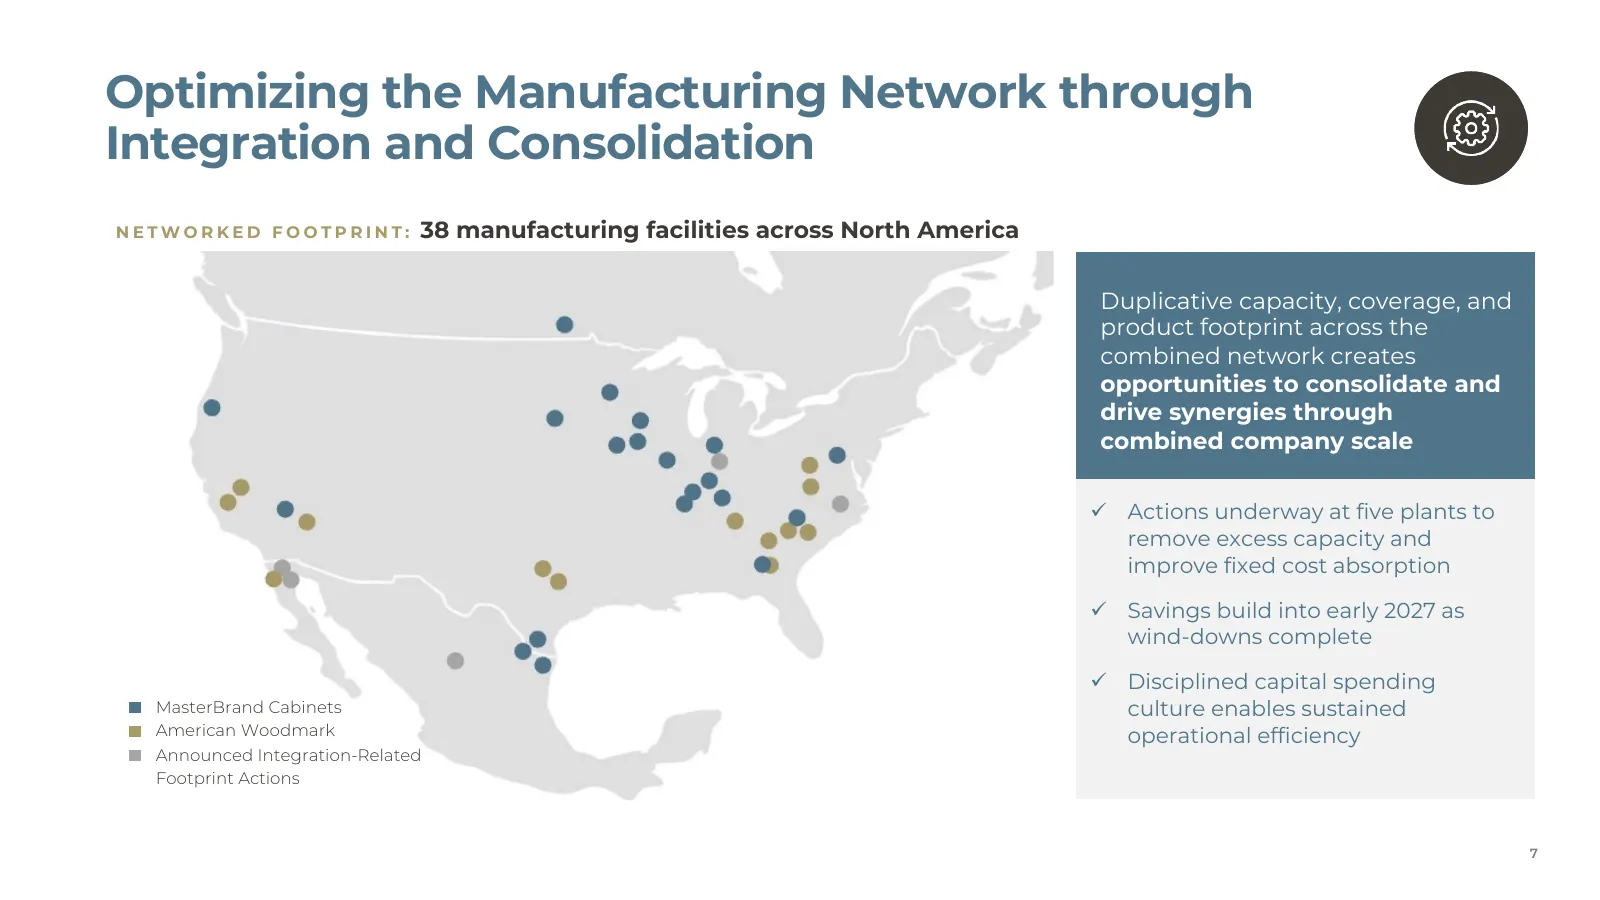
Slide 7: Optimizing the Manufacturing Network through Integration and Consolidation
Optimizing the Manufacturing Network through Integration and Consolidation N E T W O R K E D F O O T P R I N T : 38 manufacturing facilities across North America Duplicative capacity, coverage, and product footprint across the combined network creates opportunities to consolidate and drive synergies
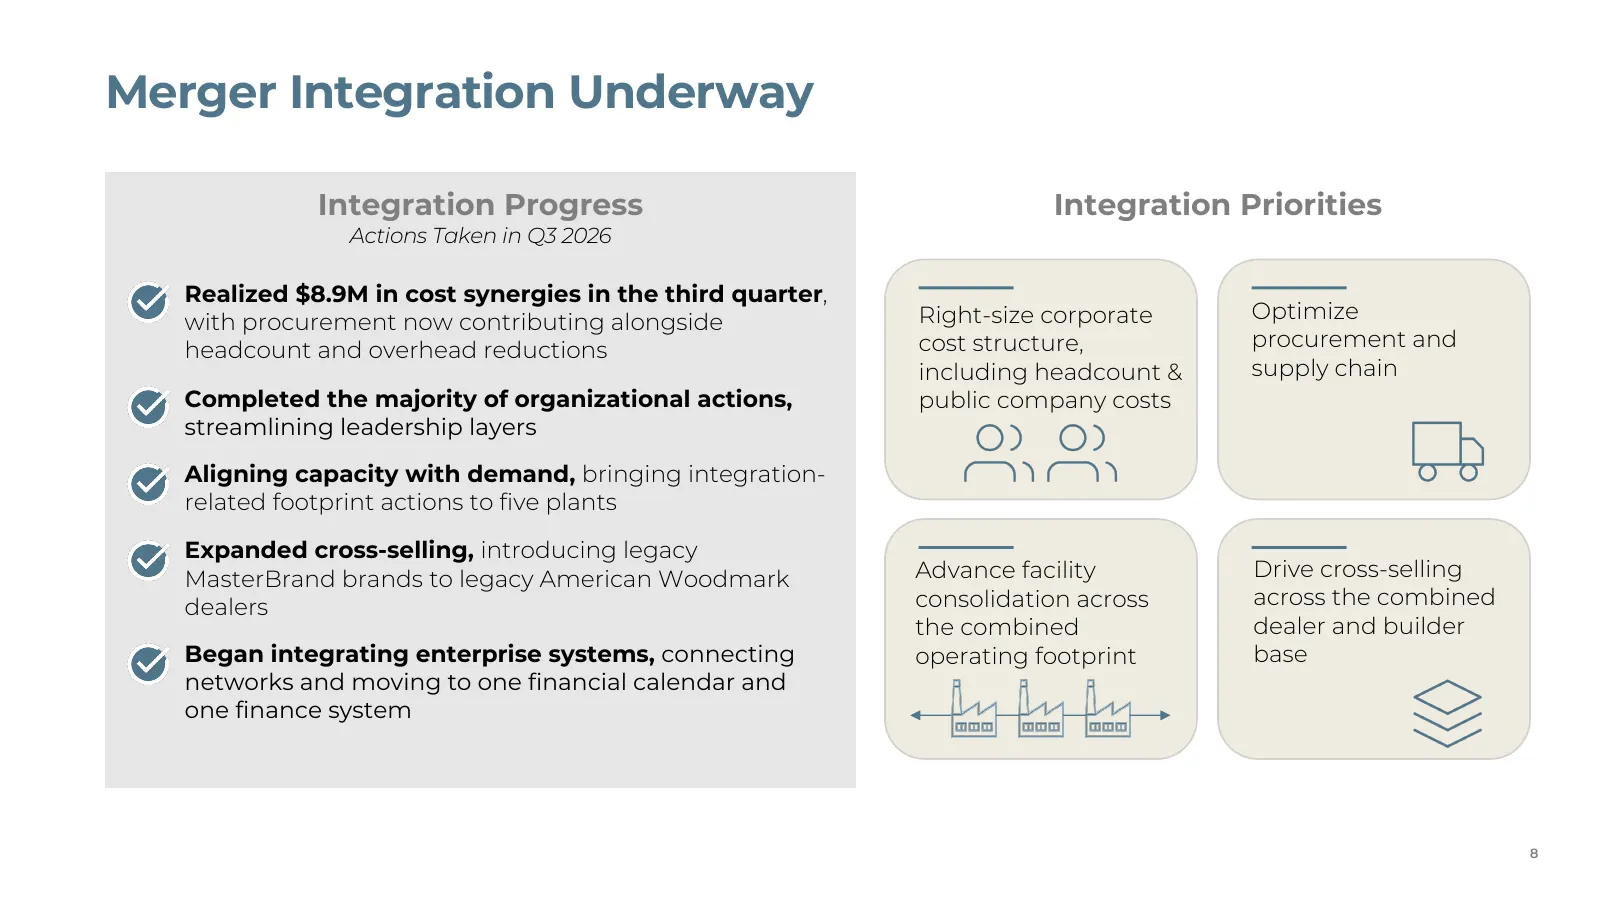
Slide 8: Merger Integration Underway
Merger Integration Underway Integration Progress Integration Priorities Actions Taken in Q3 2026 • Realized $8.9M in cost synergies in the third quarter, with procurement now contributing alongside Right-size corporate Optimize headcount and overhead reductions cost structure, procurement and includ
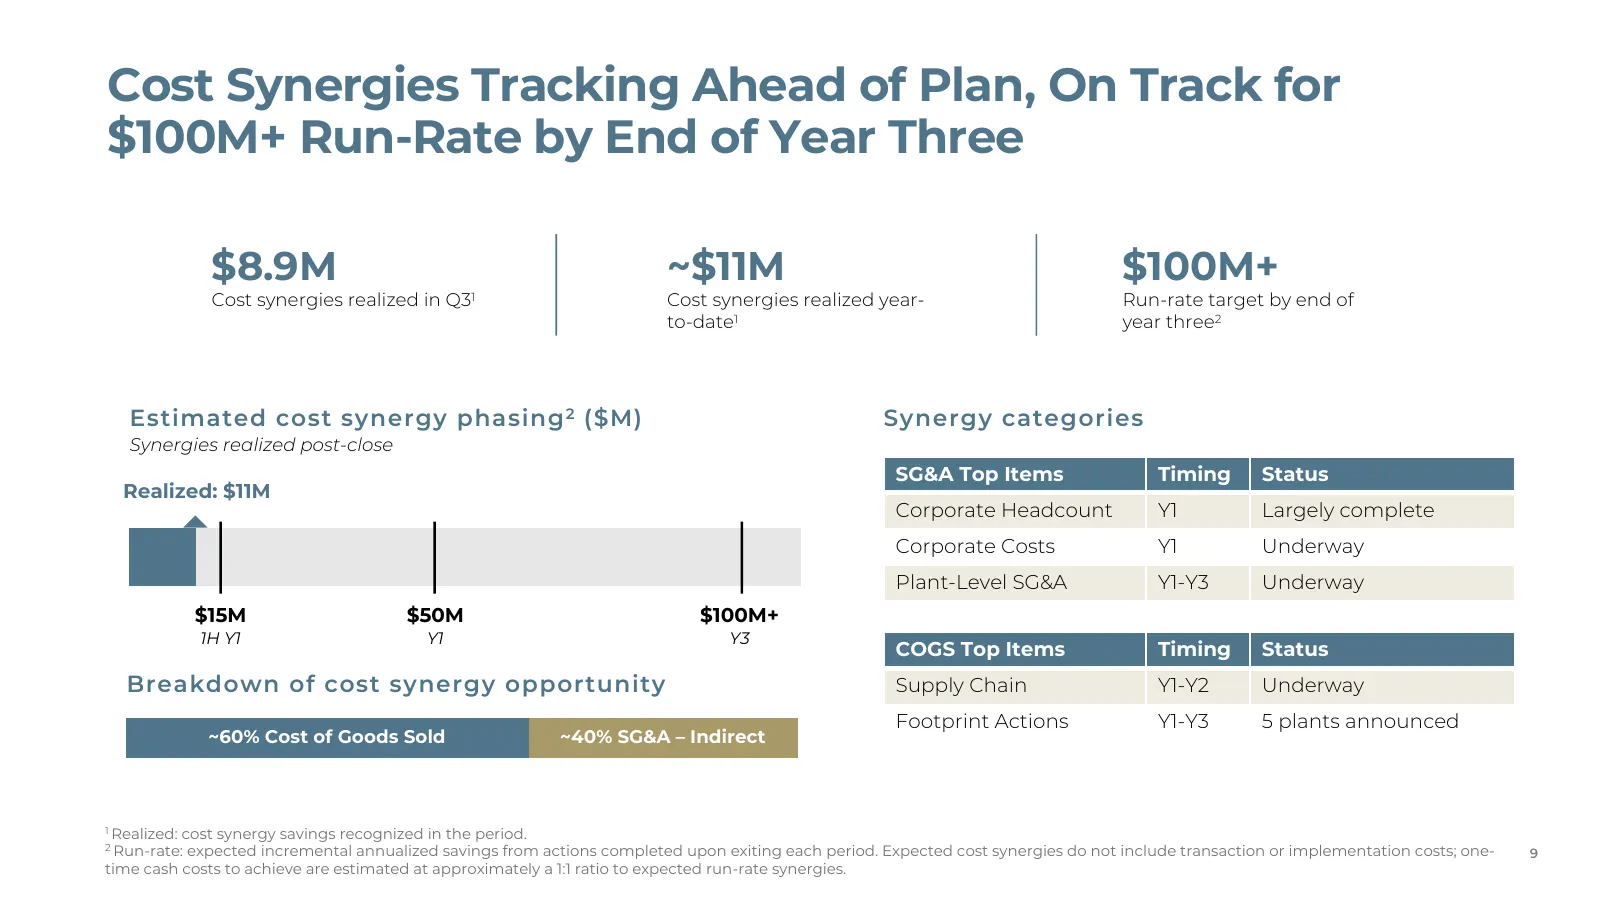
Slide 9: Cost Synergies Tracking Ahead of Plan, On Track for $100M+ Run-Rate by End of Year Three
Cost Synergies Tracking Ahead of Plan, On Track for $100M+ Run-Rate by End of Year Three $8.9M ~$11M $100M+ Cost synergies realized in Q31 Cost synergies realized year- Run-rate target by end of to-date1 year three2 $50M+ Y2-Y3 Estimated cost synergy phasing 2 ($M) Synergy categories Synergies reali
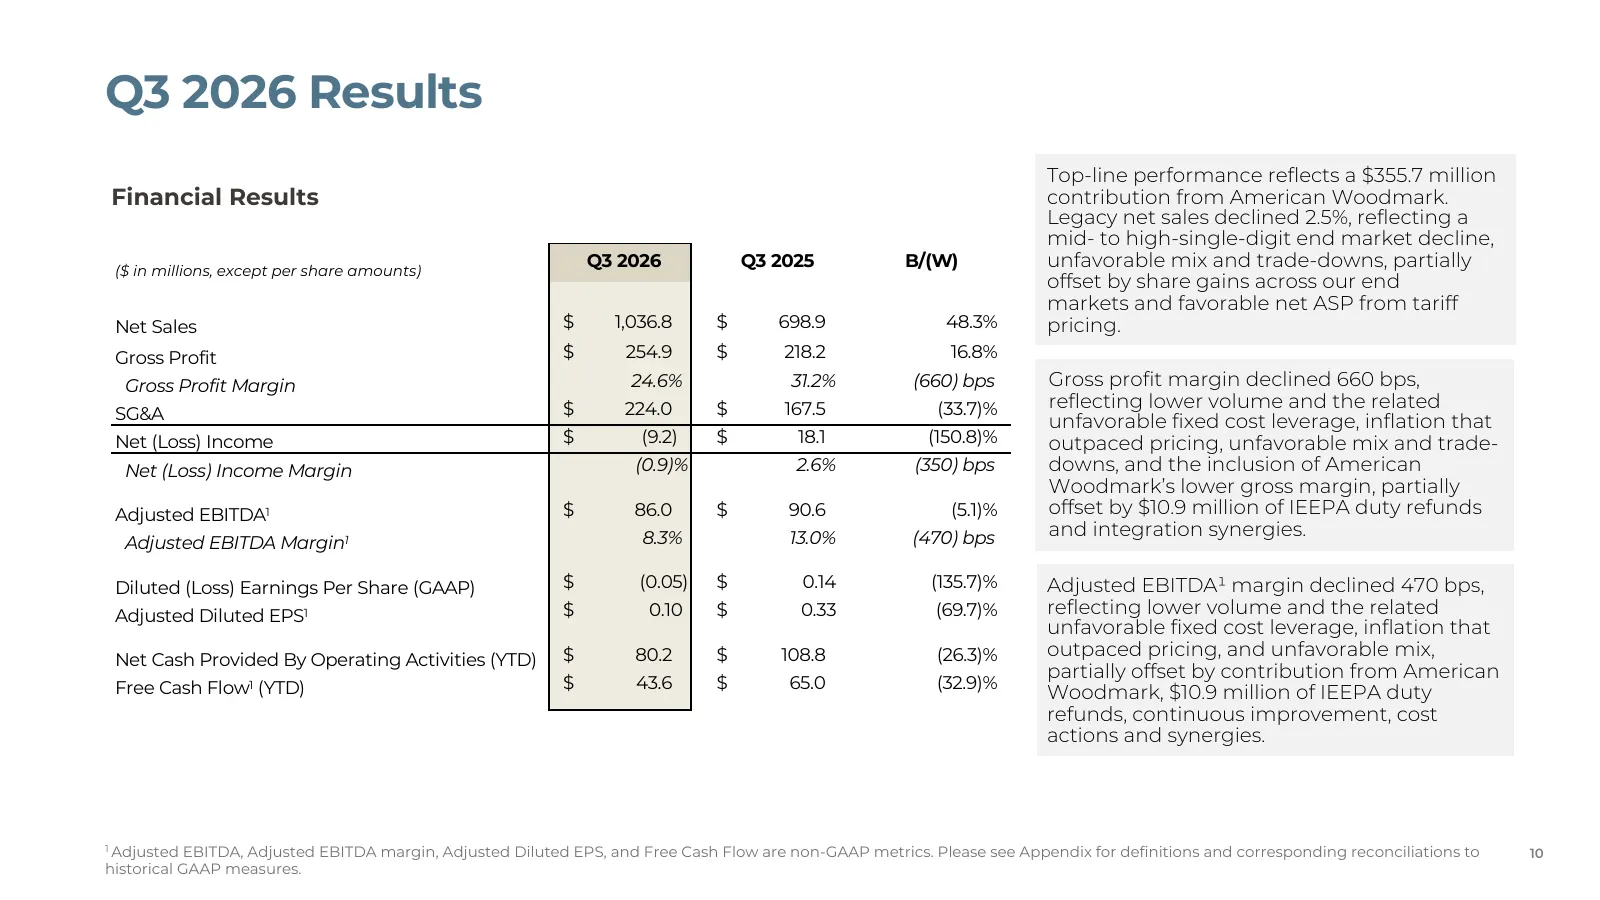
Slide 10: Q3 2026 Results
Q3 2026 Results Top-line performance reflects a $355.7 million Financial Results contribution from American Woodmark. Legacy net sales declined 2.5%, reflecting a mid- to high-single-digit end market decline, ($ in millions, except per share amounts) Q3 2026 Q3 2025 B/(W) unfavorable mix and trade-d
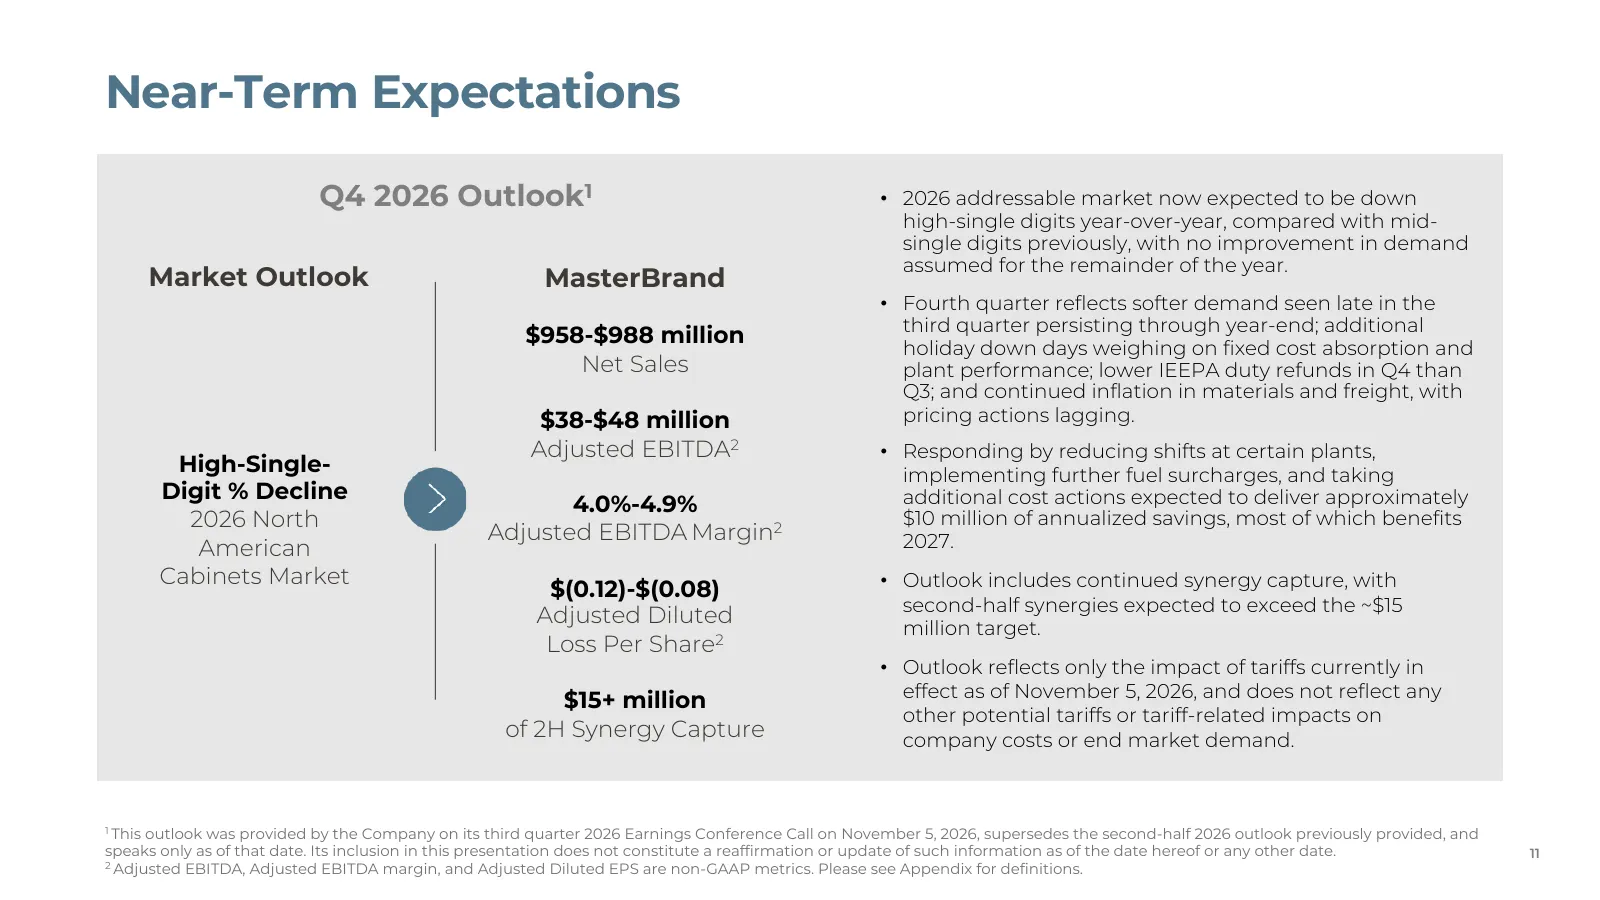
Slide 11: Near-Term Expectations
Near-Term Expectations Q4 2026 Outlook1 • 2026 addressable market now expected to be down high-single digits year-over-year, compared with mid- single digits previously, with no improvement in demand assumed for the remainder of the year. Market Outlook MasterBrand • Fourth quarter reflects softer d
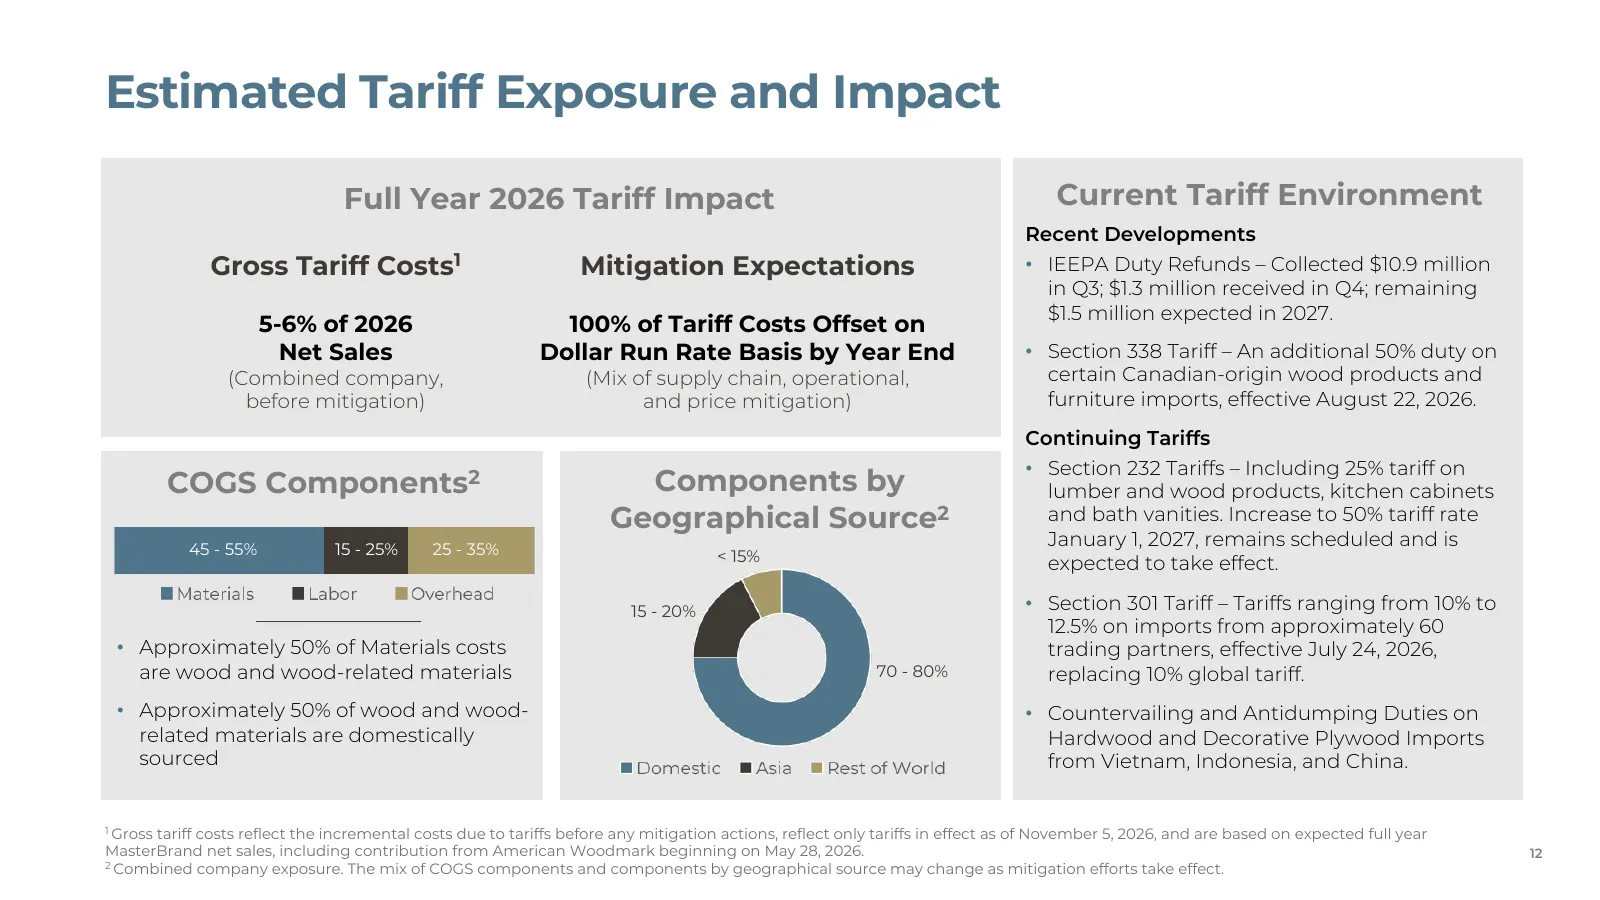
Slide 12: Estimated Tariff Exposure and Impact
Estimated Tariff Exposure and Impact Full Year 2026 Tariff Impact Current Tariff Environment Recent Developments Gross Tariff Costs1 Mitigation Expectations • IEEPA Duty Refunds – Collected $10.9 million in Q3; $1.3 million received in Q4; remaining $1.5 million expected in 2027. 5-6% of 2026 100% o
Slide 13: Leverage, Liquidity, and Cash Generation
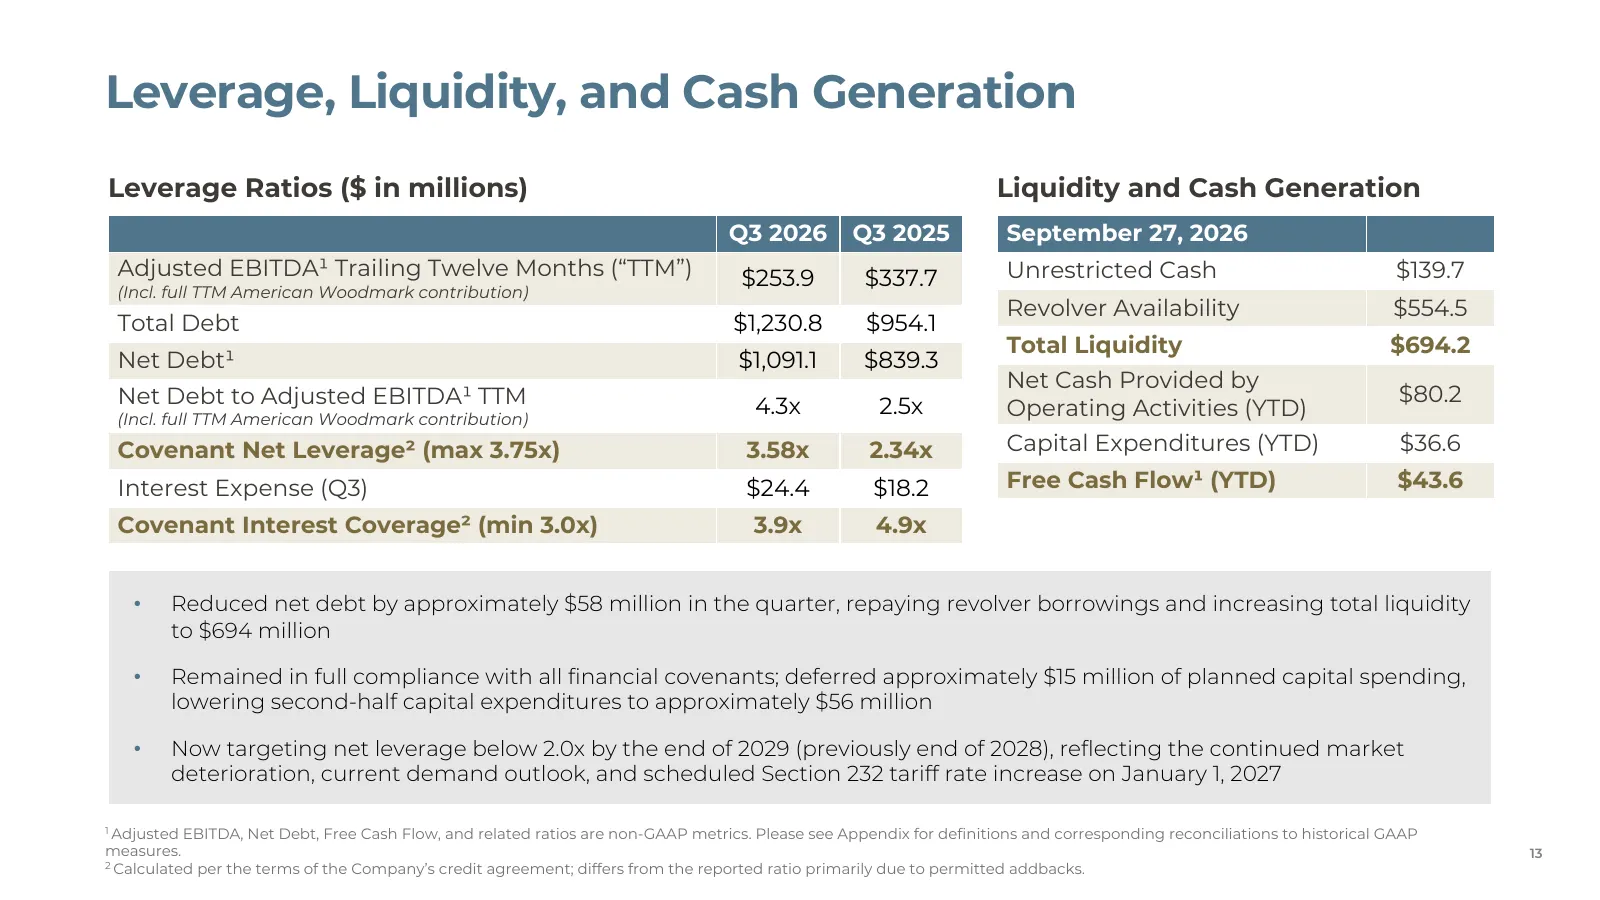
Leverage, Liquidity, and Cash Generation Leverage Ratios ($ in millions) Liquidity and Cash Generation Q3 2026 Q3 2025 September 27, 2026 Adjusted EBITDA¹ Trailing Twelve Months (“TTM”) $253.9 $337.7 Unrestricted Cash $139.7 (Incl. full TTM American Woodmark contribution) Revolver Availability $554.
Slide 14: Appendix
05 Appendix 14
Slide 15: Non-GAAP Financial Measures
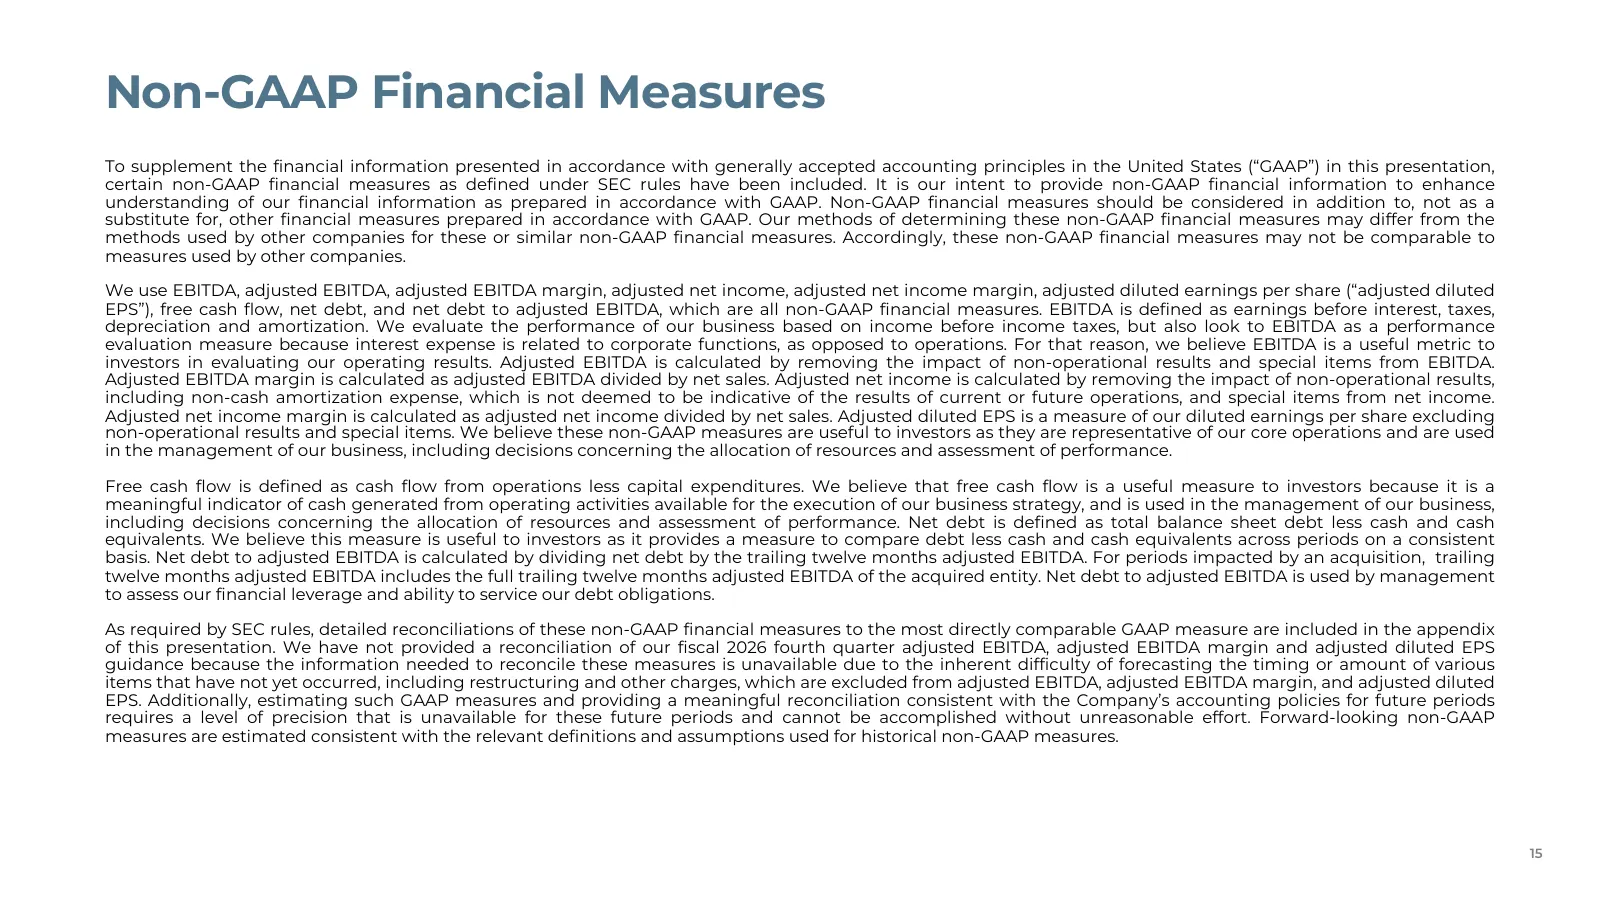
Non-GAAP Financial Measures To supplement the financial information presented in accordance with generally accepted accounting principles in the United States (“GAAP”) in this presentation, certain non-GAAP financial measures as defined under SEC rules have been included. It is our intent to provide
Slide 16: Q3 2026 Non-GAAP Reconciliations
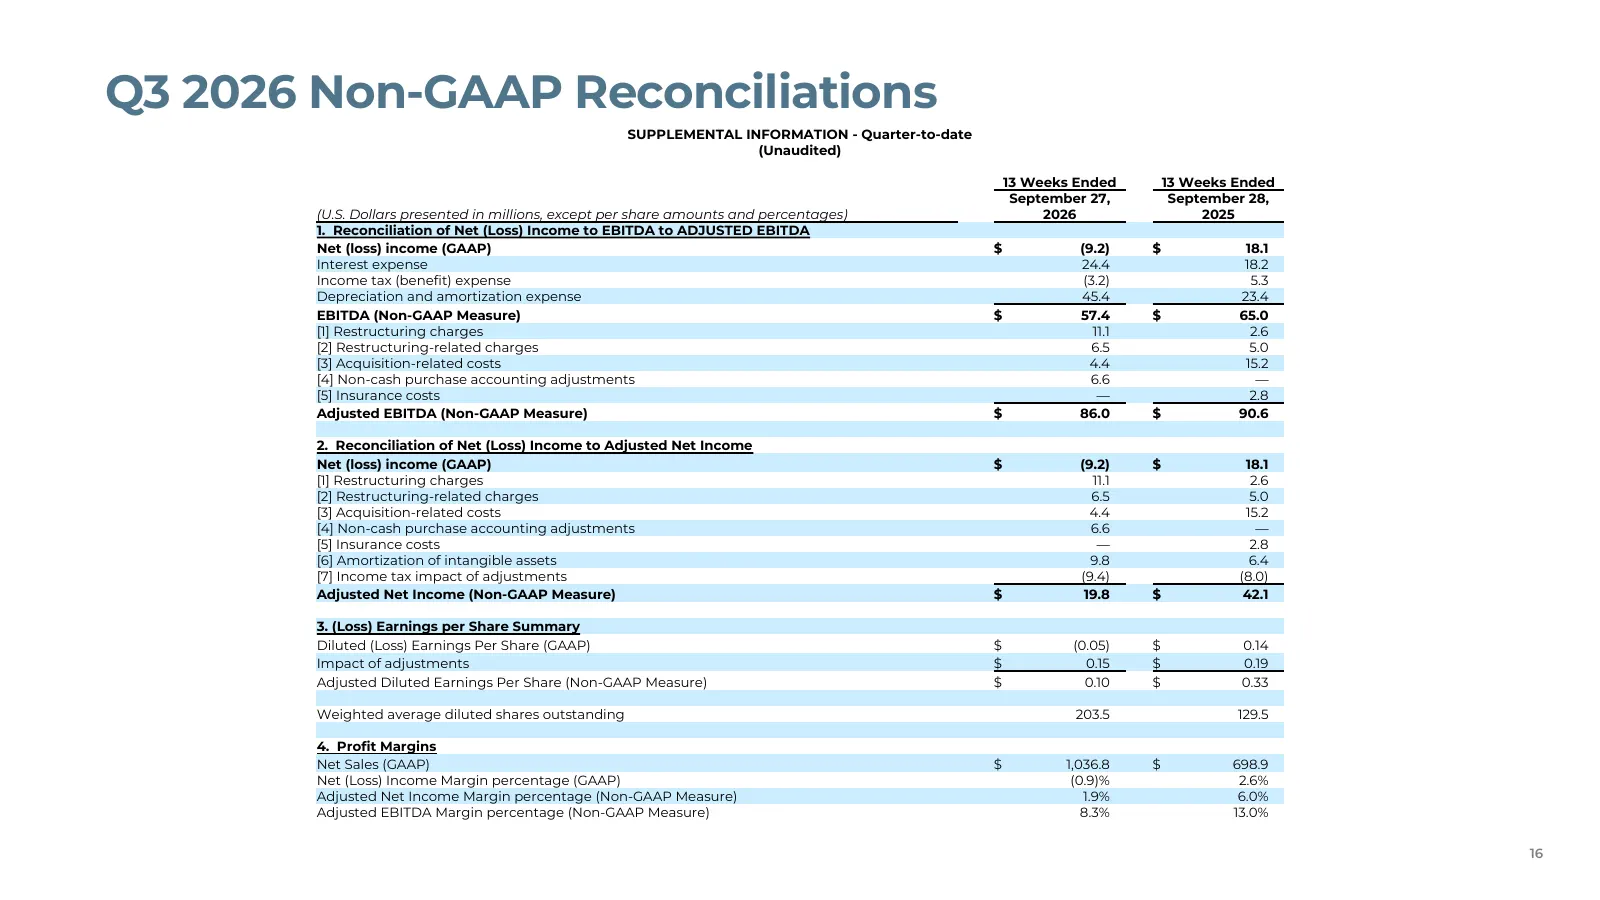
Q3 2026 Non-GAAP Reconciliations SUPPLEMENTAL INFORMATION - Quarter-to-date (Unaudited) 13 Weeks Ended 13 Weeks Ended September 27, September 28, (U.S. Dollars presented in millions, except per share amounts and percentages) 2026 2025 1. Reconciliation of Net (Loss) Income to EBITDA to ADJUSTED EBIT
Slide 17: Non-GAAP Reconciliations Tick Legend
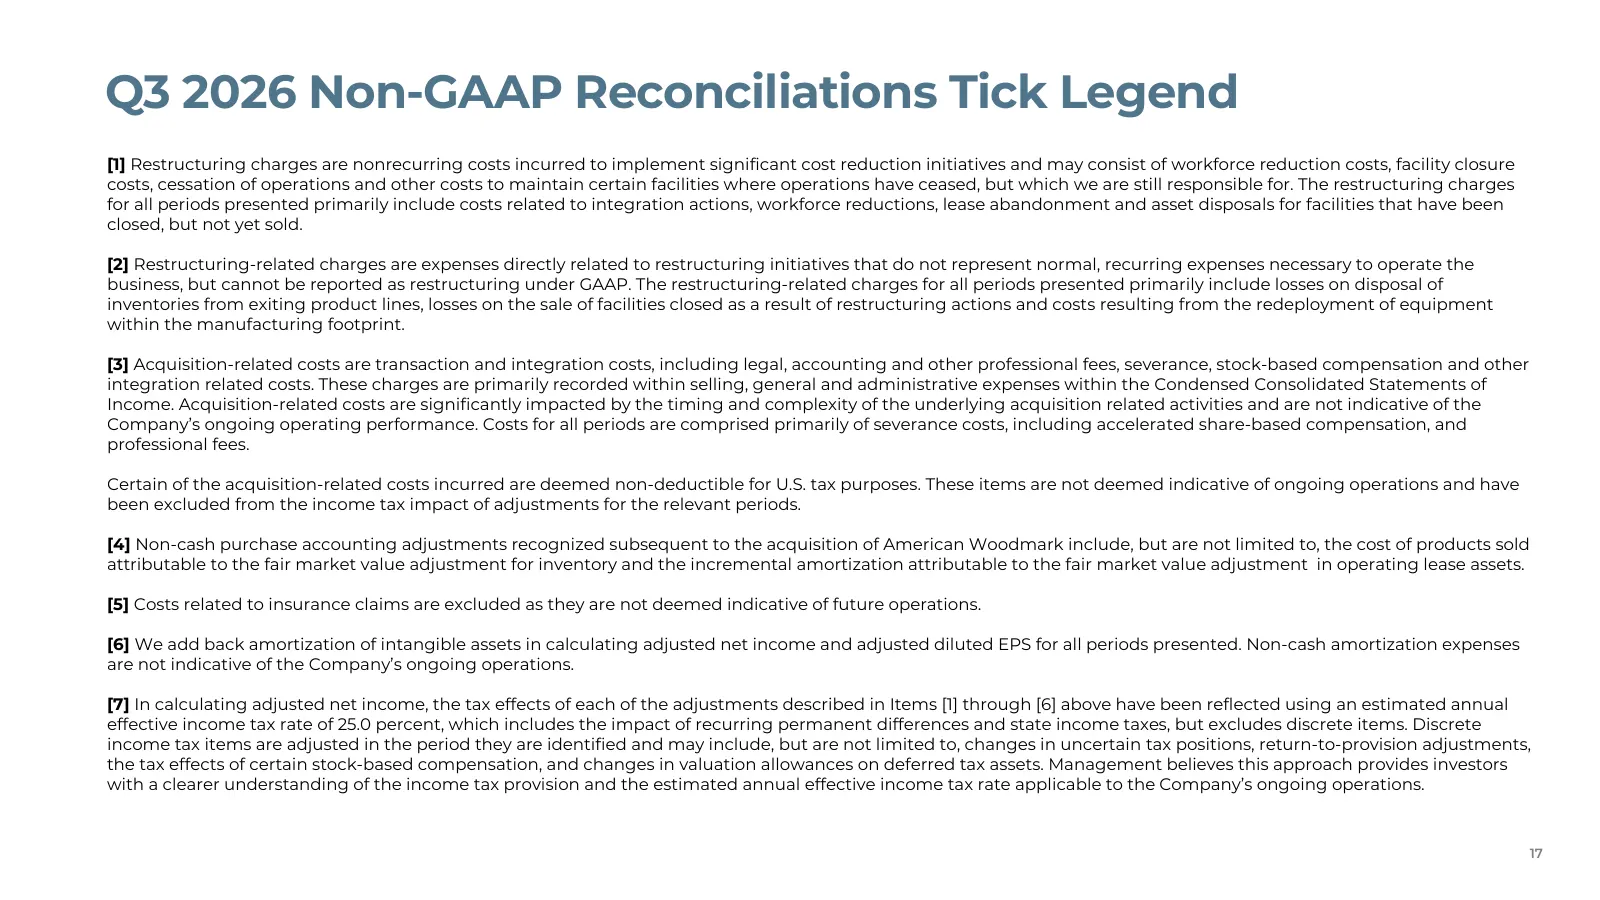
Q3 2026 Non-GAAP Reconciliations Tick Legend [1] Restructuring charges are nonrecurring costs incurred to implement significant cost reduction initiatives and may consist of workforce reduction costs, facility closure costs, cessation of operations and other costs to maintain certain facilities wher
Slide 18: Pro Forma Non-GAAP Reconciliations
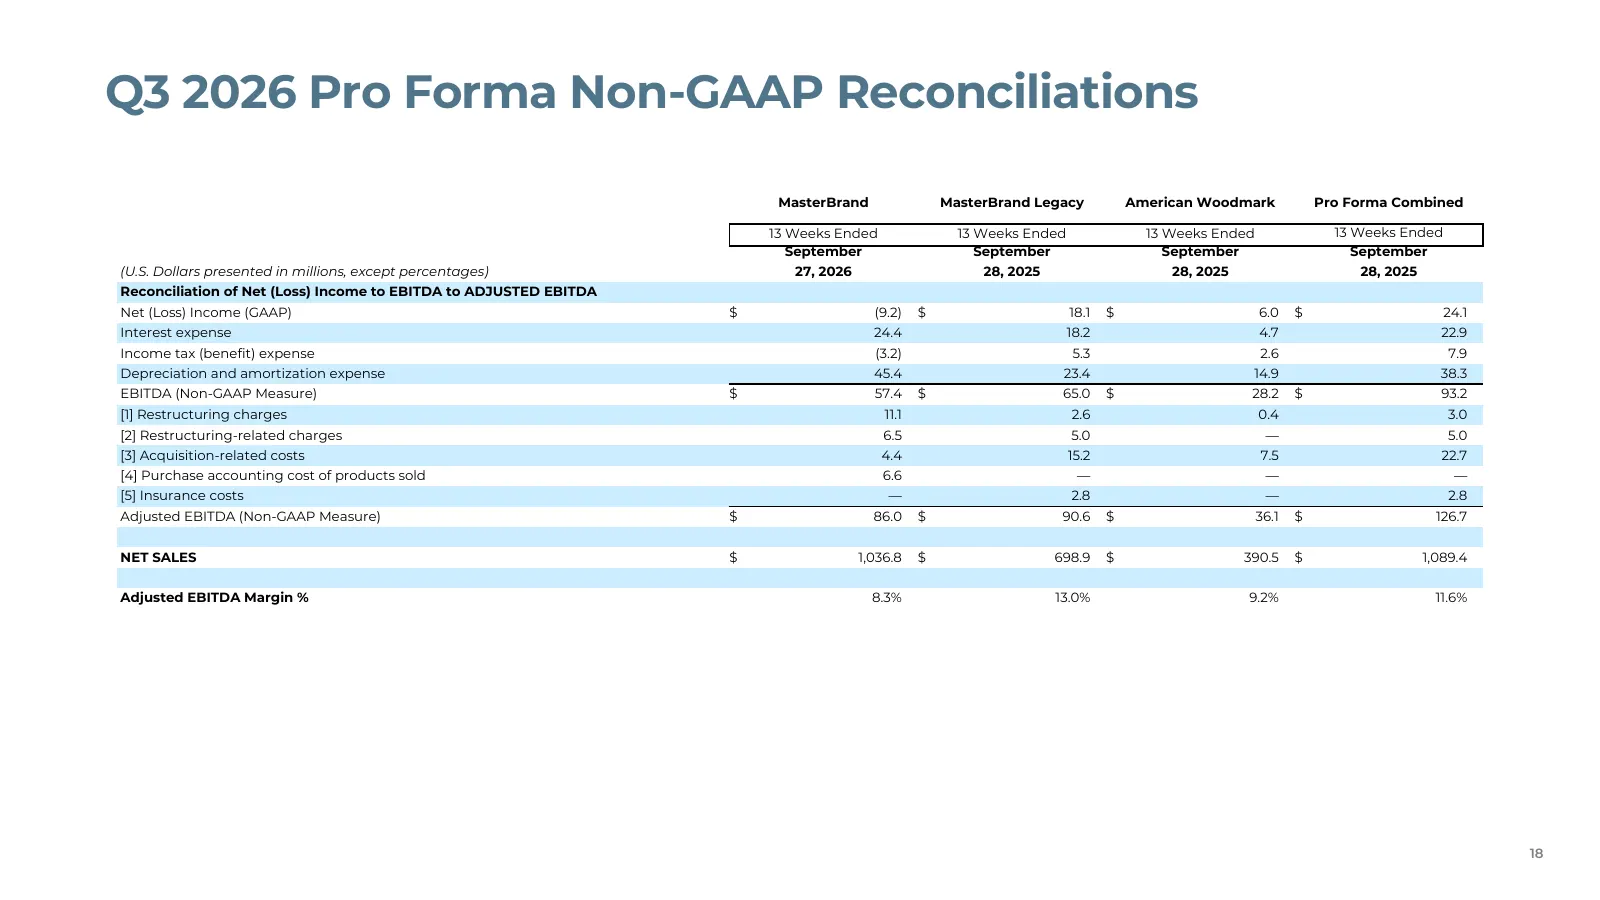
Q3 2026 Pro Forma Non-GAAP Reconciliations MasterBrand MasterBrand Legacy American Woodmark Pro Forma Combined 13 Weeks Ended 13 Weeks Ended 13 Weeks Ended 13 Weeks Ended September September September September (U.S. Dollars presented in millions, except percentages) 27, 2026 28, 2025 28, 2025 28, 2
Slide 19: TTM Non-GAAP Reconciliations
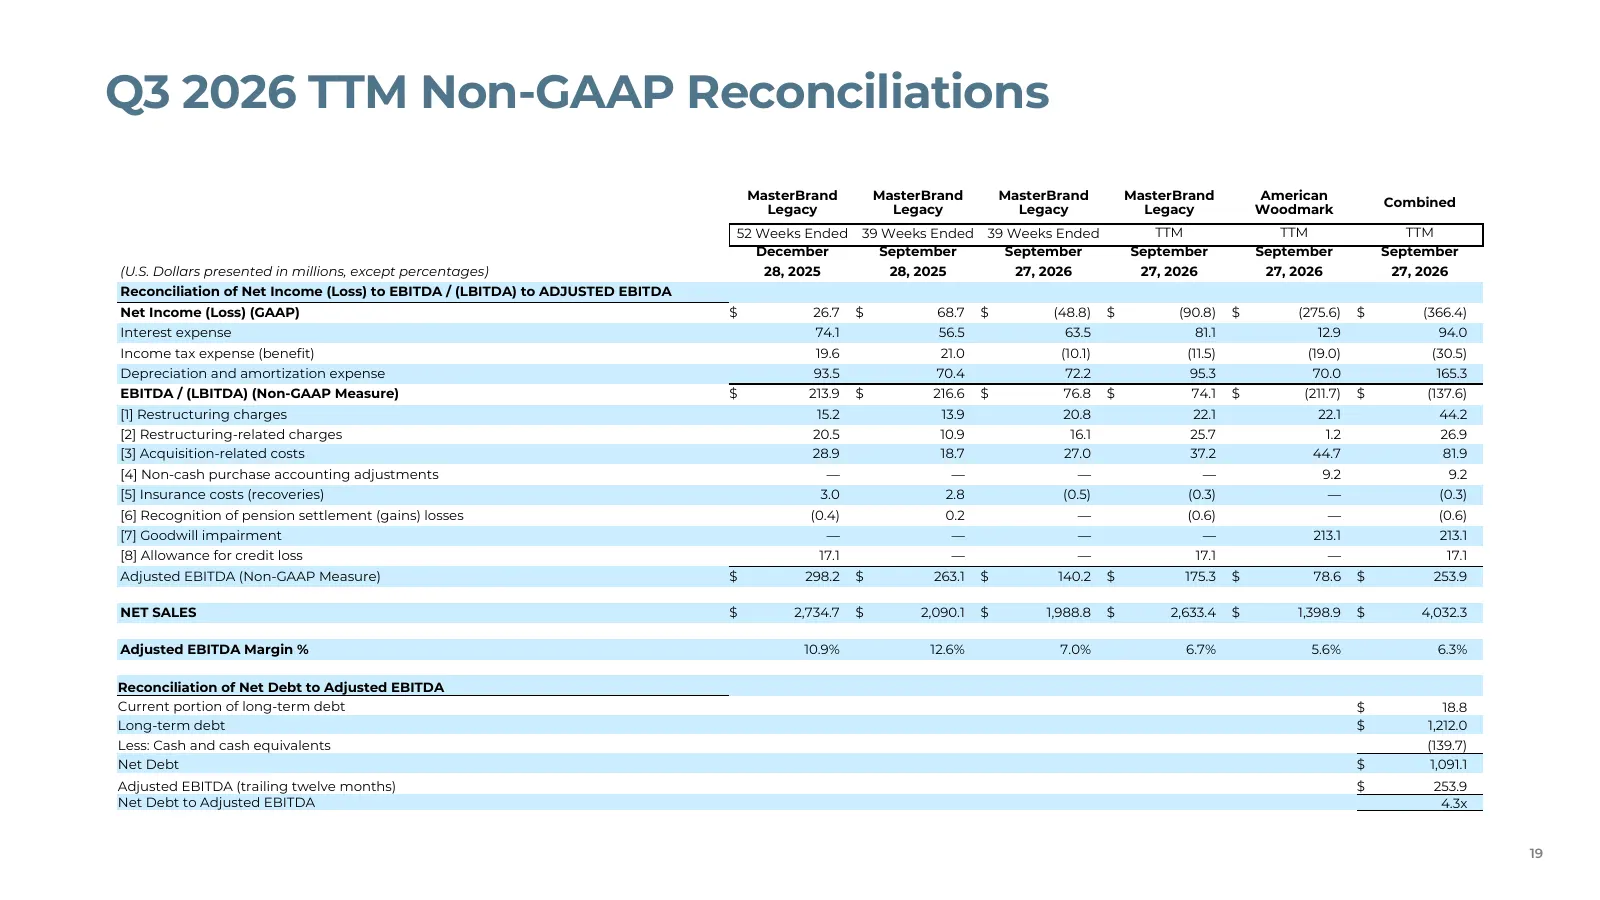
Q3 2026 TTM Non-GAAP Reconciliations MasterBrand MasterBrand MasterBrand MasterBrand American Legacy Legacy Legacy Legacy Woodmark Combined 52 Weeks Ended 39 Weeks Ended 39 Weeks Ended TTM TTM TTM December September September September September September (U.S. Dollars presented in millions, except
Slide 20: Pro Forma & TTM Non-GAAP Reconciliations Tick Legend
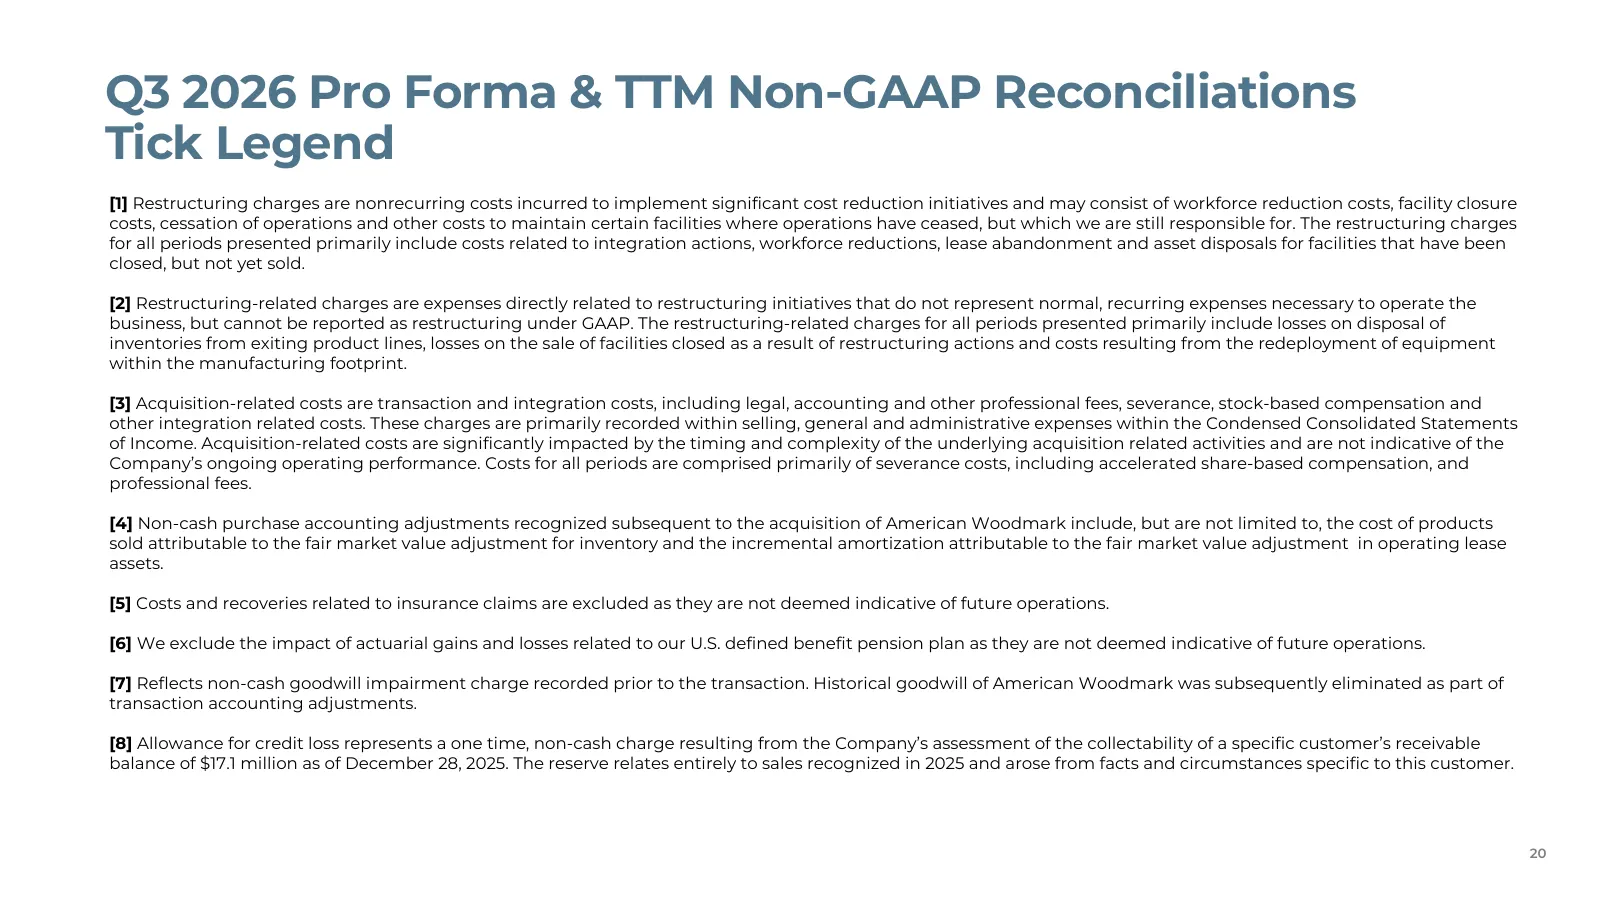
Q3 2026 Pro Forma & TTM Non-GAAP Reconciliations Tick Legend [1] Restructuring charges are nonrecurring costs incurred to implement significant cost reduction initiatives and may consist of workforce reduction costs, facility closure costs, cessation of operations and other costs to maintain certain
Slide 21: Non-GAAP Reconciliations - QTD
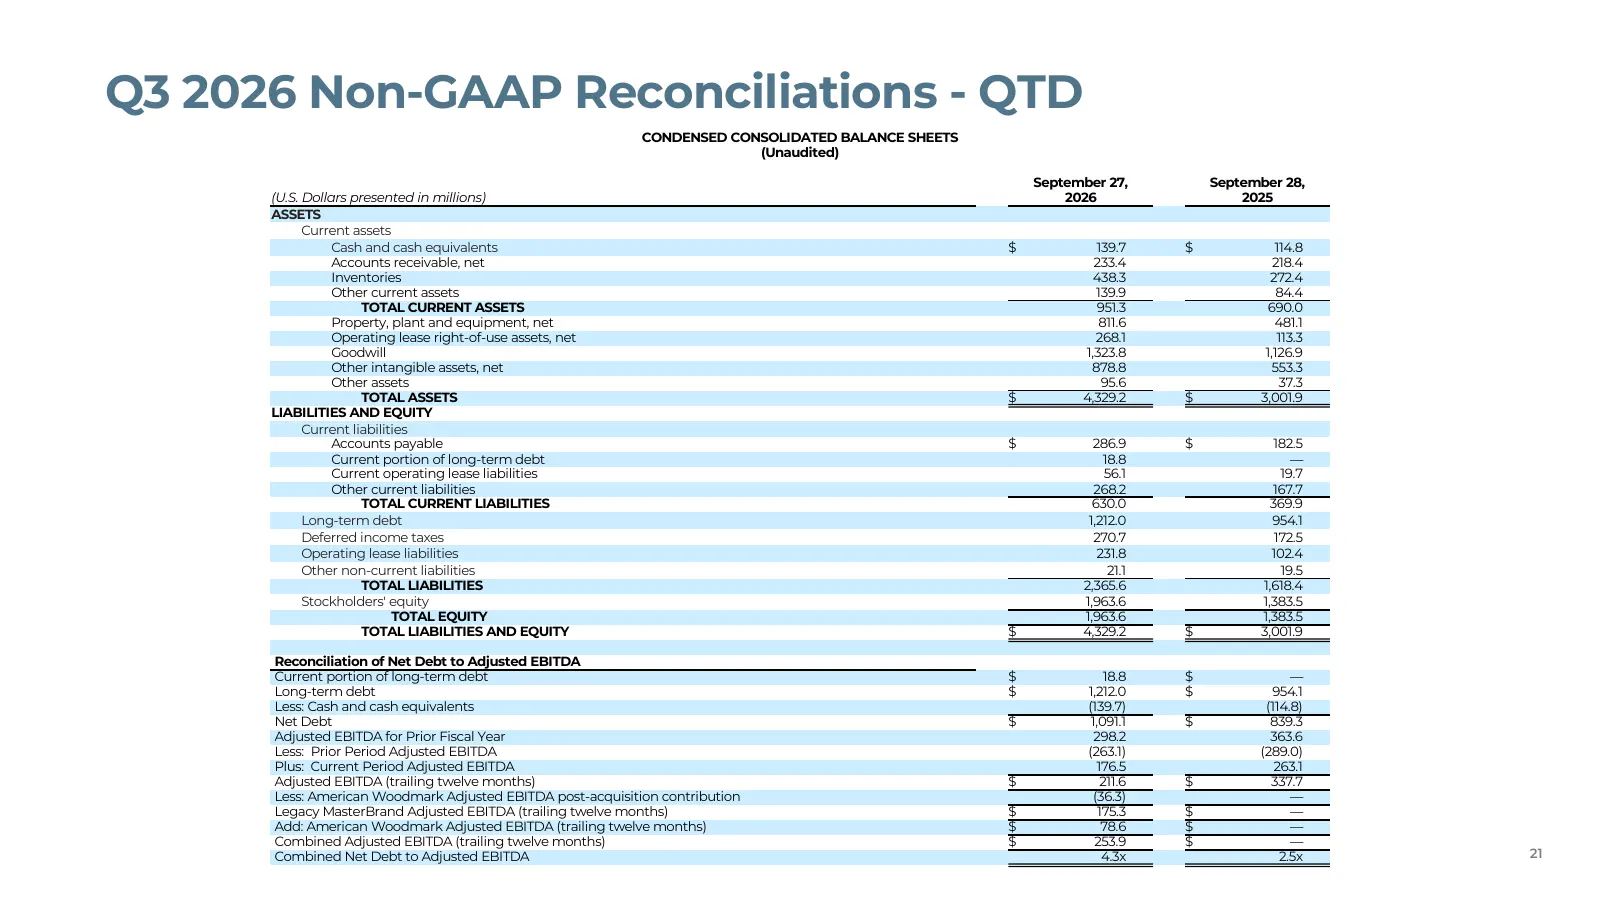
Q3 2026 Non-GAAP Reconciliations - QTD CONDENSED CONSOLIDATED BALANCE SHEETS (Unaudited) September 27, September 28, (U.S. Dollars presented in millions) 2026 2025 ASSETS Current assets Cash and cash equivalents $ 139.7 $ 114.8 Accounts receivable, net 233.4 218.4 Inventories 438.3 272.4 Other curre
Slide 22: Non-GAAP Reconciliations - YTD
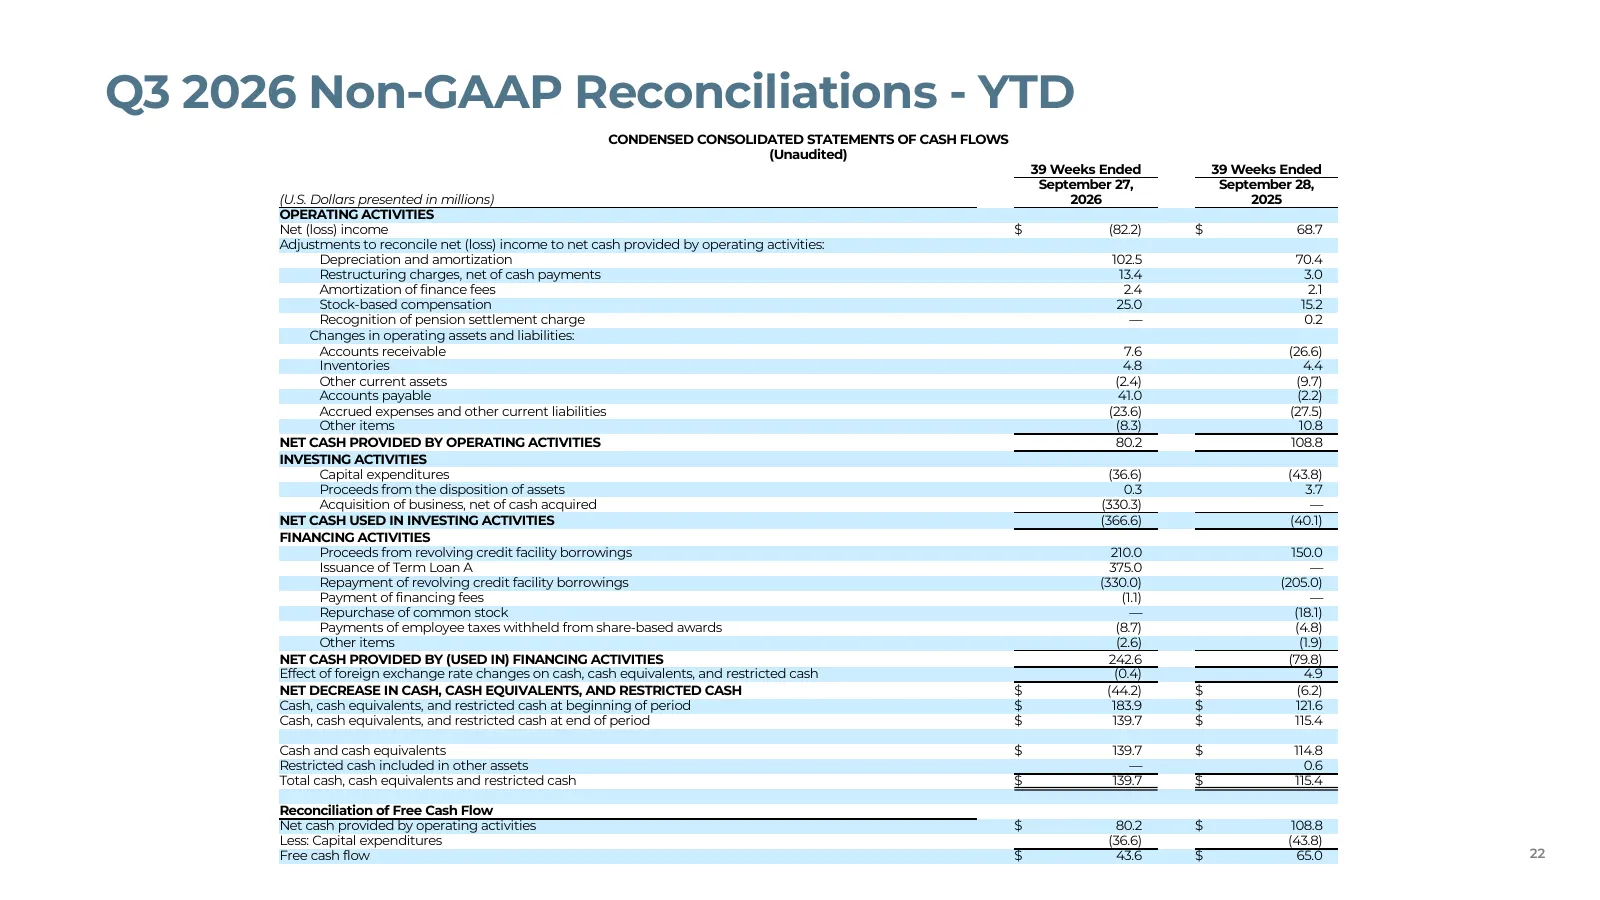
Q3 2026 Non-GAAP Reconciliations - YTD CONDENSED CONSOLIDATED STATEMENTS OF CASH FLOWS (Unaudited) 39 Weeks Ended 39 Weeks Ended September 27, September 28, (U.S. Dollars presented in millions) 2026 2025 OPERATING ACTIVITIES Net (loss) income $ (82.2) $ 68.7 Adjustments to reconcile net (loss) incom
Slide 23: Prior Year to Current Year Net Sales Walk
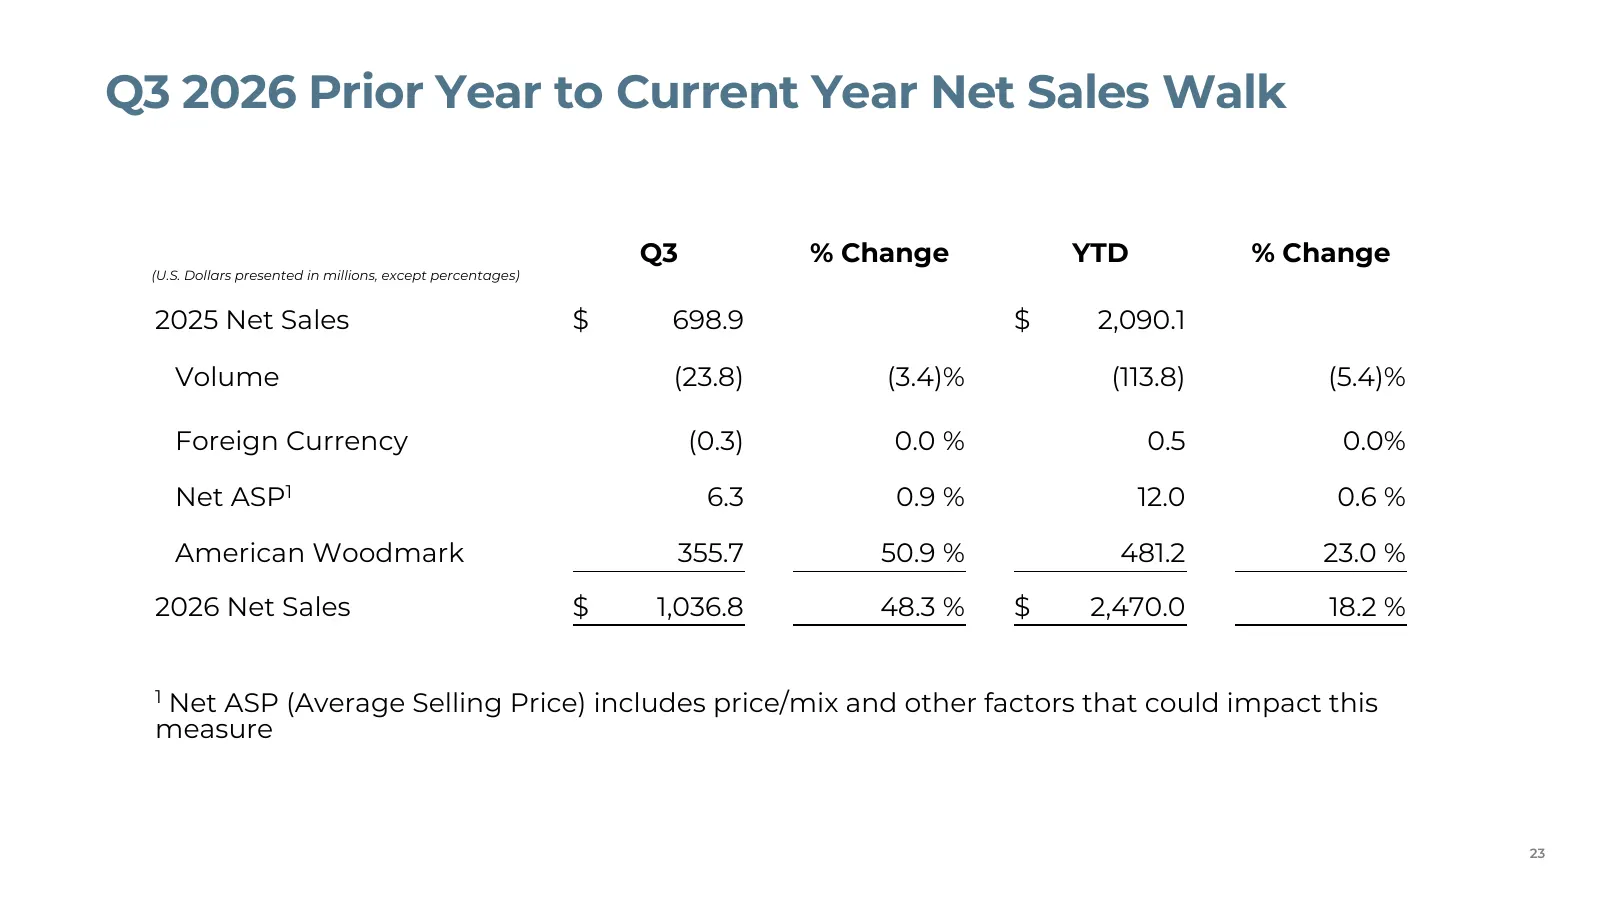
Q3 2026 Prior Year to Current Year Net Sales Walk Q3 % Change YTD % Change (U.S. Dollars presented in millions, except percentages) 2025 Net Sales $ 698.9 $ 2,090.1 Volume (23.8) (3.4)% (113.8) (5.4)% Foreign Currency (0.3) 0.0 % 0.5 0.0% Net ASP1 6.3 0.9 % 12.0 0.6 % American Woodmark 355.7 50.9 %
Source: company website
More decks from MasterBrand, Inc.
 Q2 2026 Earnings Presentation24 slides · Aug 4, 2026
 Q1 2026 Earnings Presentation21 slides · May 5, 2026
 Q4 2025 Earnings Presentation24 slides · Feb 10, 2026
 Q3 2025 Earnings Presentation22 slides · Nov 4, 2025
 Merger or Acquisition (August 2025)21 slides · Aug 6, 2025
 Q2 2025 Earnings Presentation22 slides · Aug 6, 2025