HCC Insurance — Conference Presentation (June 2004)
27 slides from HCC Insurance's conference presentation, Jun 23, 2004

Slide 1: 3/04
3/04

Slide 2: About Forward Looking Statements
ABOUT FORWARD LOOKING STATEMENTS This presentation contains certain "forward looking statements" within the meaning of Section 27A of the Securities Act of 1933, and Section 21E of the Securities Exchange Act of 1934, which are intended to be covered by the safe harbors created by those laws. These

Slide 3: Overview
OVERVIEW
Slide 4: Corporate Profile
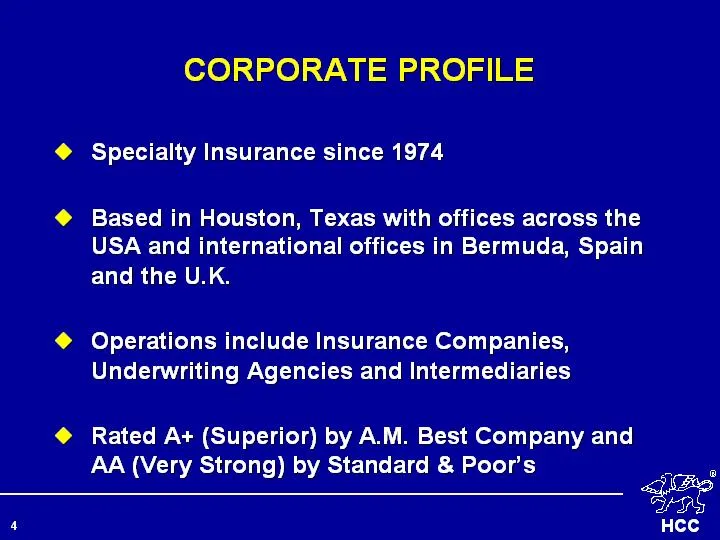
CORPORATE PROFILE Specialty Insurance since 1974 Based in Houston, Texas with offices across the USA and international offices in Bermuda, Spain and the U.K. Operations include Insurance Companies, Underwriting Agencies and Intermediaries Rated A+ (Superior) by A.M. Best Company and AA (Very Strong)
Slide 5: Corporate Philosophy
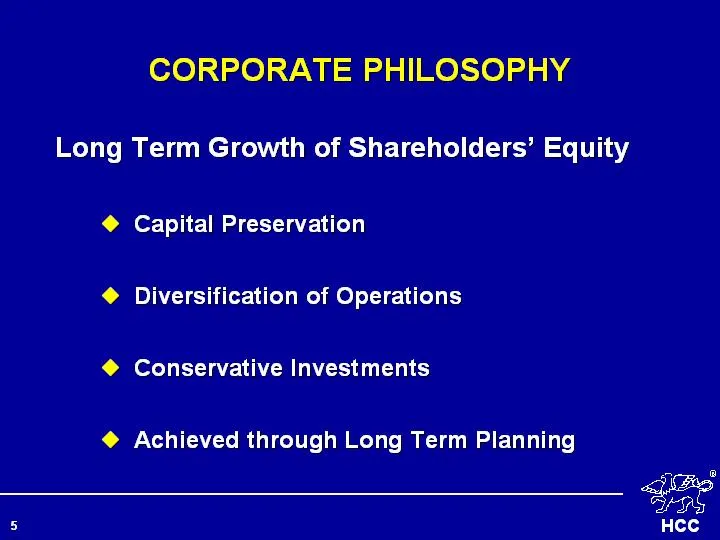
CORPORATE PHILOSOPHY Long Term Growth of Shareholders' Equity Capital Preservation Diversification of Operations Conservative Investments Achieved through Long Term Planning
Slide 6: Shareholder's Equity
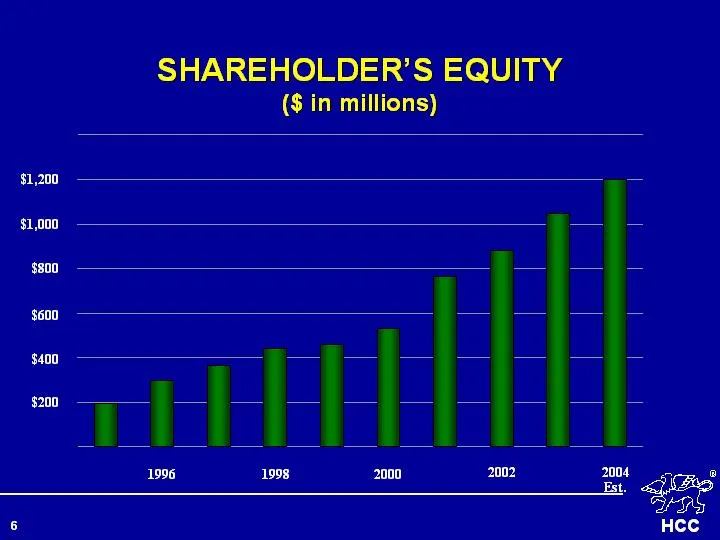
SHAREHOLDER'S EQUITY ($ in millions) $1,000 $800 $600 $400 $200 1996 1998 2000 2002 2004 Est. $1,200
Slide 7: Shareholder's Equity
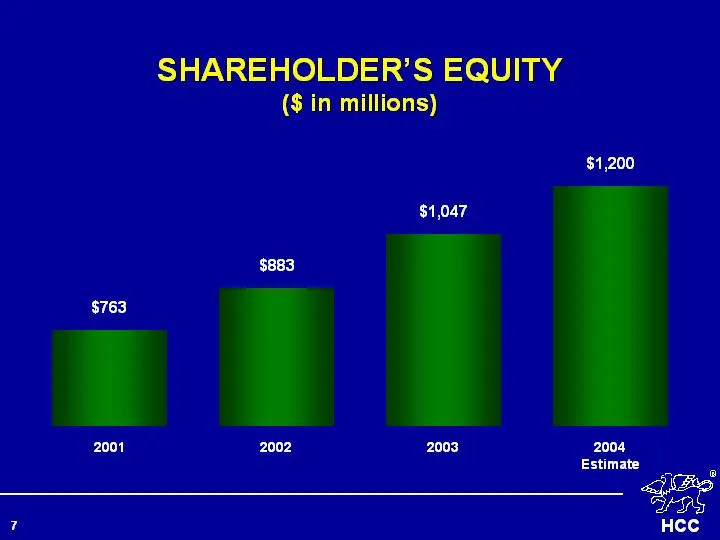
SHAREHOLDER'S EQUITY ($ in millions) 2001 $763 2002 $883 $1,047 2004 Estimate $1,200 2003
Slide 8: Consistent Growth in Book Value
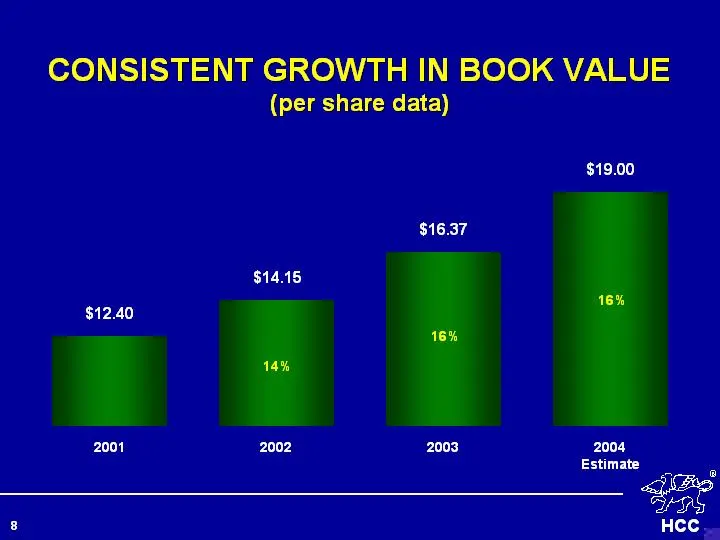
CONSISTENT GROWTH IN BOOK VALUE (per share data) 2001 $12.40 2002 $14.15 $16.37 2003 2004 Estimate $19.00 16% 16% 14%
Slide 9: Operations
OPERATIONS
Slide 10: Lines of Business
LINES OF BUSINESS Group Life & Health Diversified Financial Products Aviation London Market Operations Other Specialty Operations
Slide 11: Gross Written Premium
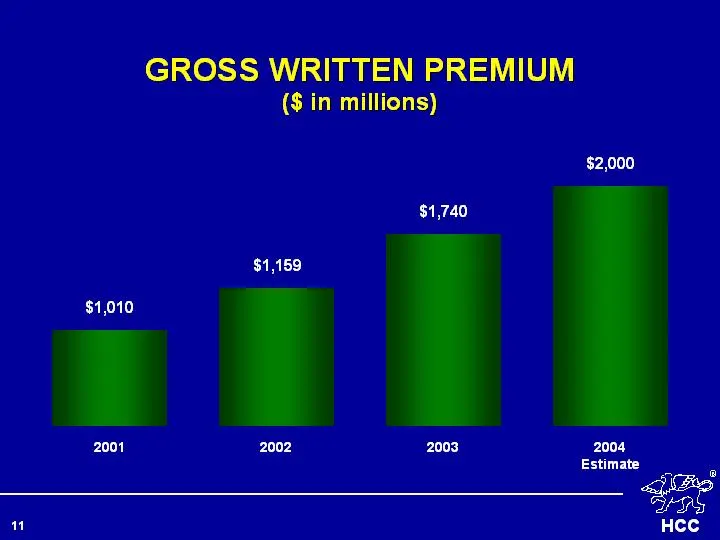
GROSS WRITTEN PREMIUM ($ in millions) 2001 $1,010 2002 $1,159 $1,740 2003 2004 Estimate $2,000
Slide 12: Net Written Premium
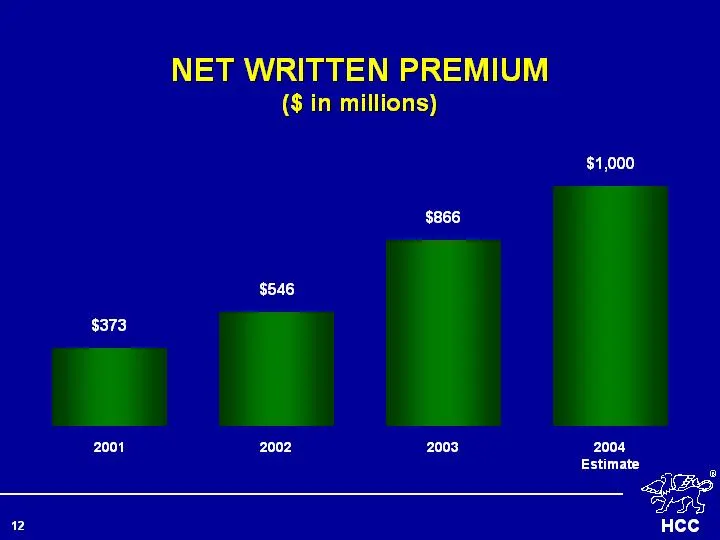
NET WRITTEN PREMIUM ($ in millions) 2001 $373 2002 $546 $866 2003 2004 Estimate $1,000

Slide 13: Financial
13 FINANCIAL
Slide 14: Strong Balance Sheet
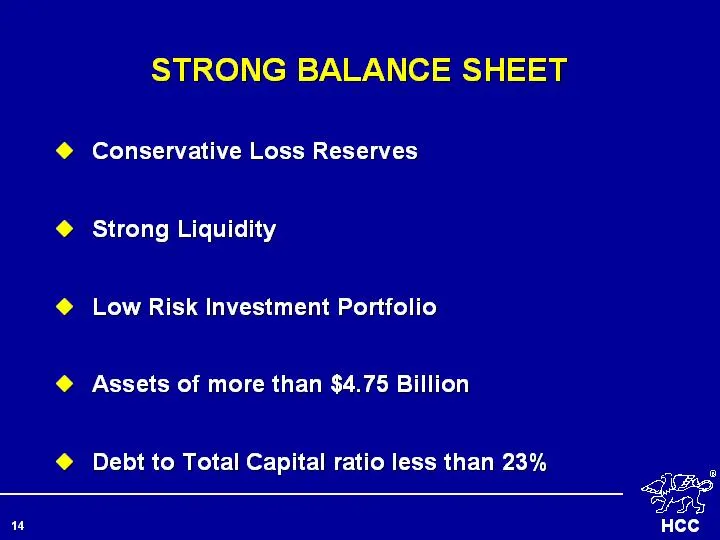
STRONG BALANCE SHEET Conservative Loss Reserves Strong Liquidity Low Risk Investment Portfolio Assets of more than $4.75 Billion Debt to Total Capital ratio less than 23%
Slide 15: Strong Growth in Investment Assets
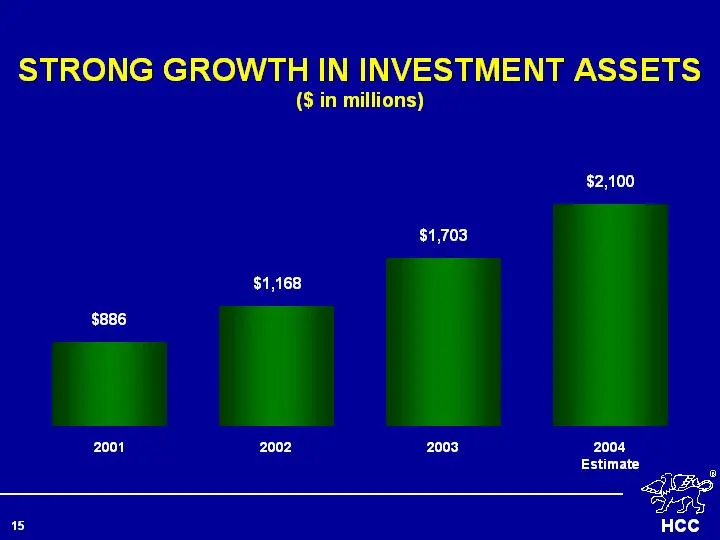
STRONG GROWTH IN INVESTMENT ASSETS ($ in millions) 2001 $886 2002 $1,168 $1,703 2003 2004 Estimate $2,100
Slide 16: Conservative Investment Portfolio
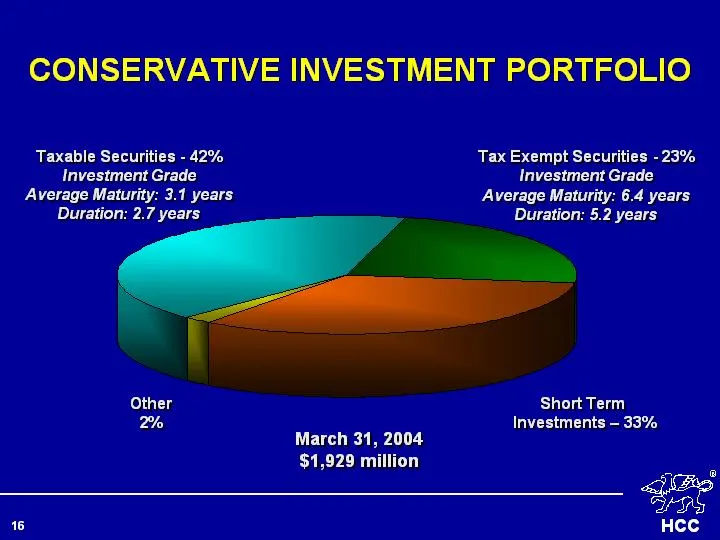
1st Qtr Tax Exempt Securities 23 Short Term Investments 33 Other 2 Taxable Securities 42 Taxable Securities - 42% Investment Grade Average Maturity: 3.1 years Duration: 2.7 years Tax Exempt Securities - 23% Investment Grade Average Maturity: 6.4 years Duration: 5.2 years Other 2% March 31, 2004 $1,9
Slide 17: Revenue: Net Earned Premium
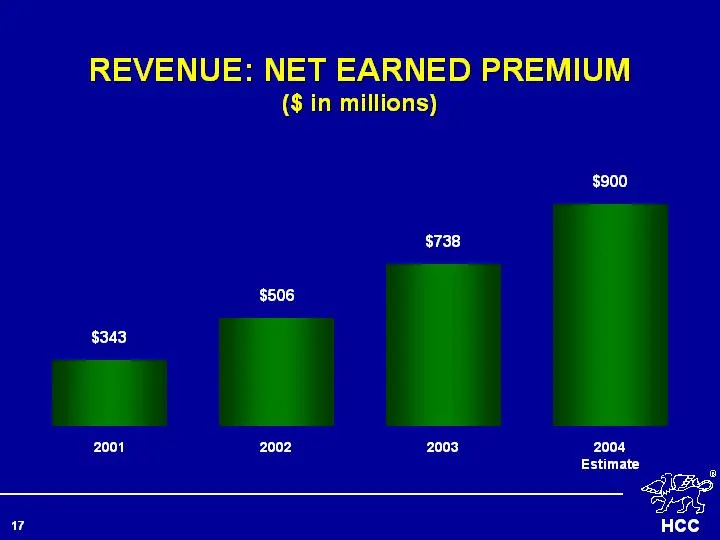
REVENUE: NET EARNED PREMIUM ($ in millions) 2001 $343 2002 $506 $738 2003 2004 Estimate $900
Slide 18: Revenue: Fee & Commission Income
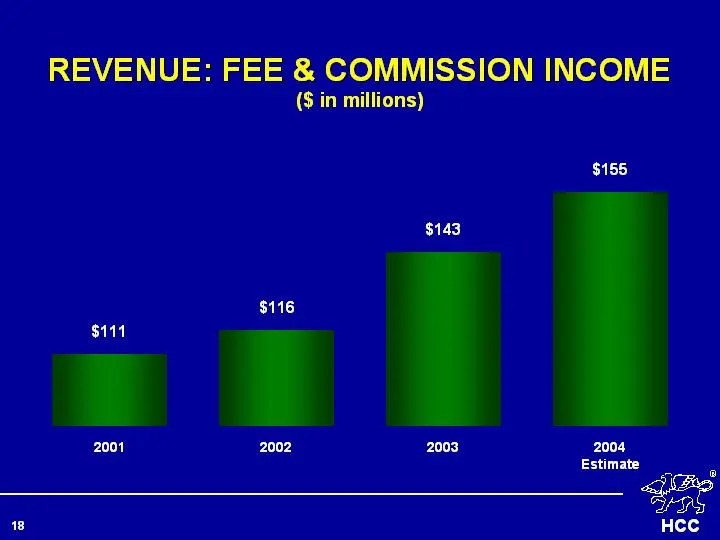
REVENUE: FEE & COMMISSION INCOME ($ in millions) 2001 $111 2002 $116 $143 2003 2004 Estimate $155
Slide 19: Revenue: Investment Income
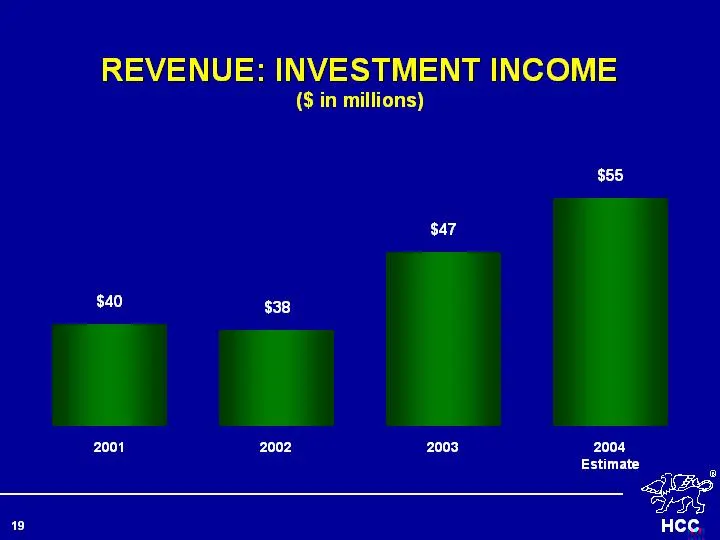
REVENUE: INVESTMENT INCOME ($ in millions) 2001 $40 2002 $38 $47 2003 2004 Estimate $55
Slide 20: Total Revenue
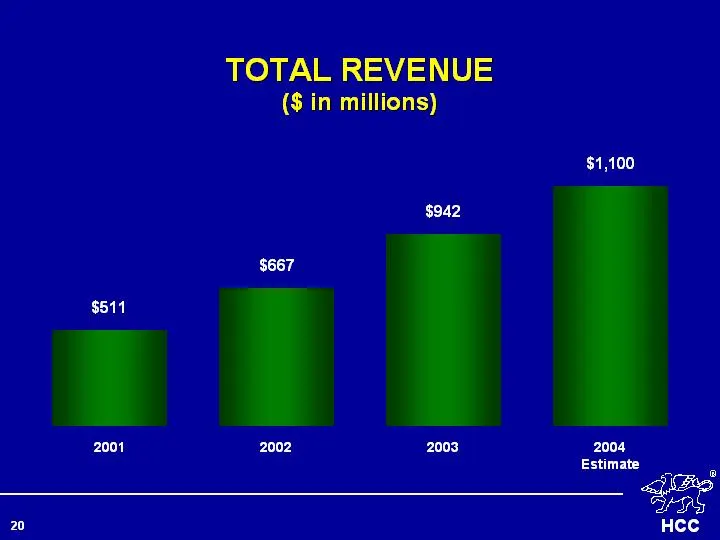
TOTAL REVENUE ($ in millions) 2001 $511 2002 $667 $942 2003 2004 Estimate $1,100
Slide 21: Performance
PERFORMANCE
Slide 22: Performance Last Years
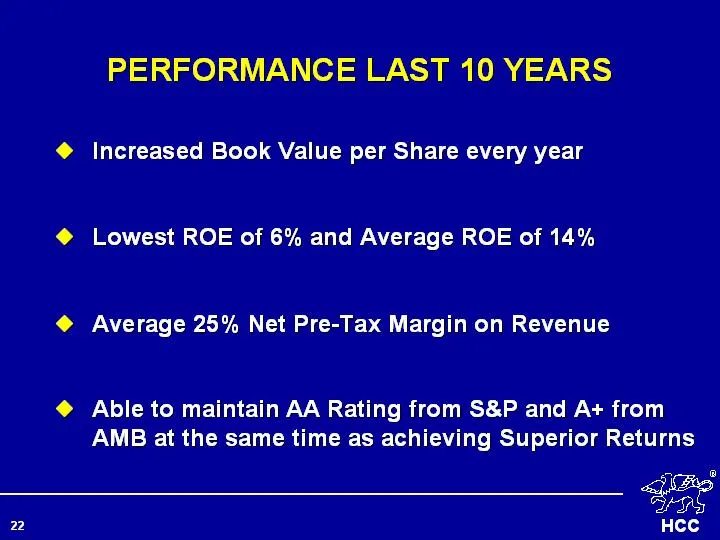
PERFORMANCE LAST 10 YEARS Increased Book Value per Share every year Lowest ROE of 6% and Average ROE of 14% Average 25% Net Pre-Tax Margin on Revenue Able to maintain AA Rating from S&P and A+ from AMB at the same time as achieving Superior Returns
Slide 23: Recent Performance
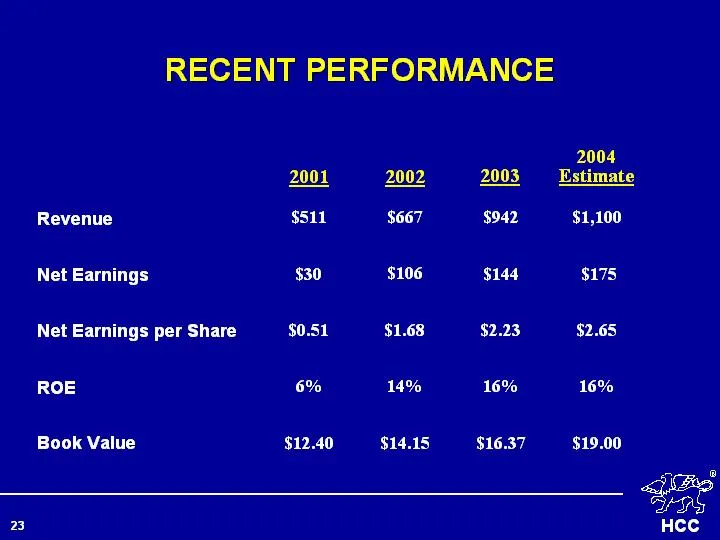
RECENT PERFORMANCE Revenue Net Earnings Net Earnings per Share ROE Book Value 2003 2002 2001 2004 Estimate $511 $30 $0.51 6% $12.40 $667 $106 $1.68 14% $14.15 $942 $144 $2.23 16% $16.37 $1,100 $175 $2.65 16% $19.00
Slide 24: Earnings Guidance
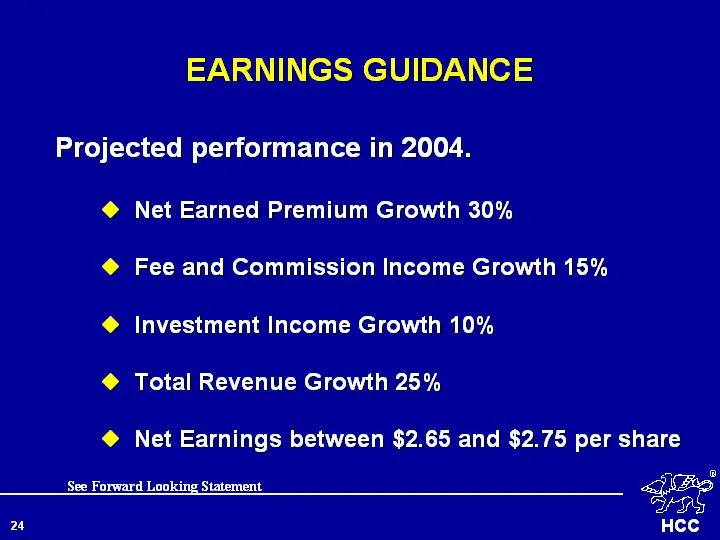
EARNINGS GUIDANCE Projected performance in 2004. Net Earned Premium Growth 30% Fee and Commission Income Growth 15% Investment Income Growth 10% Total Revenue Growth 25% Net Earnings between $2.65 and $2.75 per share See Forward Looking Statement
Slide 25: About Forward Looking Statements
ABOUT FORWARD LOOKING STATEMENTS This presentation contains certain "forward looking statements" within the meaning of Section 27A of the Securities Act of 1933, and Section 21E of the Securities Exchange Act of 1934, which are intended to be covered by the safe harbors created by those laws. These

Slide 26
Slide 27: INSCO Earned Premium by Line
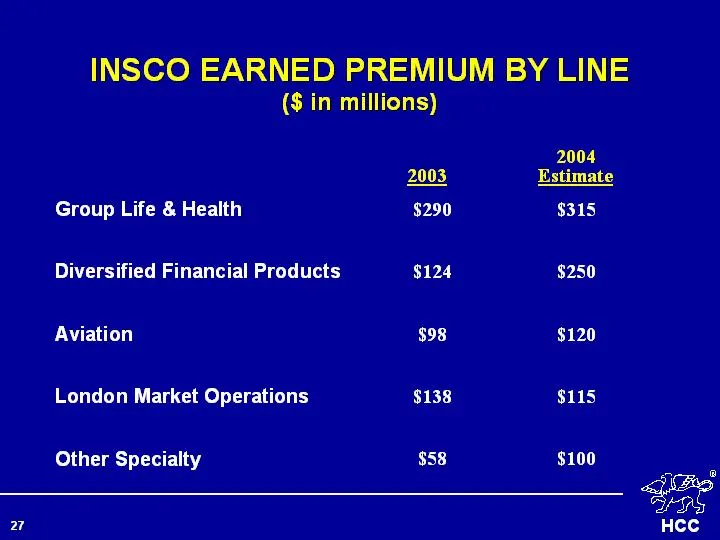
INSCO EARNED PREMIUM BY LINE ($ in millions) Group Life & Health Diversified Financial Products Aviation London Market Operations Other Specialty $290 $124 $98 $138 $58 2003 2004 Estimate $315 $250 $120 $115 $100
Source: SEC EDGAR · 8-K filed Jun 23, 2004
More decks from HCC Insurance Holdings Inc
 Q2 2015 Earnings Presentation31 slides · Aug 14, 2015
 Merger or Acquisition (June 2015)22 slides · Jun 23, 2015
 Merger or Acquisition (June 2015)10 slides · Jun 10, 2015
 Merger or Acquisition (June 2015)30 slides · Jun 10, 2015
 Q1 2015 Earnings Presentation35 slides · May 21, 2015
 36th Annual Raymond James Institutional Investors Conference (February 2015)36 slides · Feb 27, 2015