Bridge Investment Group Holdings Inc
Bridge Investment — Q2 2021 Earnings Presentation
38 slides from Bridge Investment's earnings presentation, Aug 10, 2021
Slide 1: 2nd Quarter Earnings Supplemental
AUGUST 11, 2021 2nd Quarter Earnings Supplemental Notes:
Slide 2: Disclaimer
DISCLAIMER Notes: The information contained herein does not constitute or form part of, and should not be construed as, an offer or invitation to subscribe for, underwrite or otherwise acquire, any securities of Bridge Investment Group Holdings Inc. (“Bridge” or the “Company”) or any affiliate of Br
Slide 3: Today's Speakers
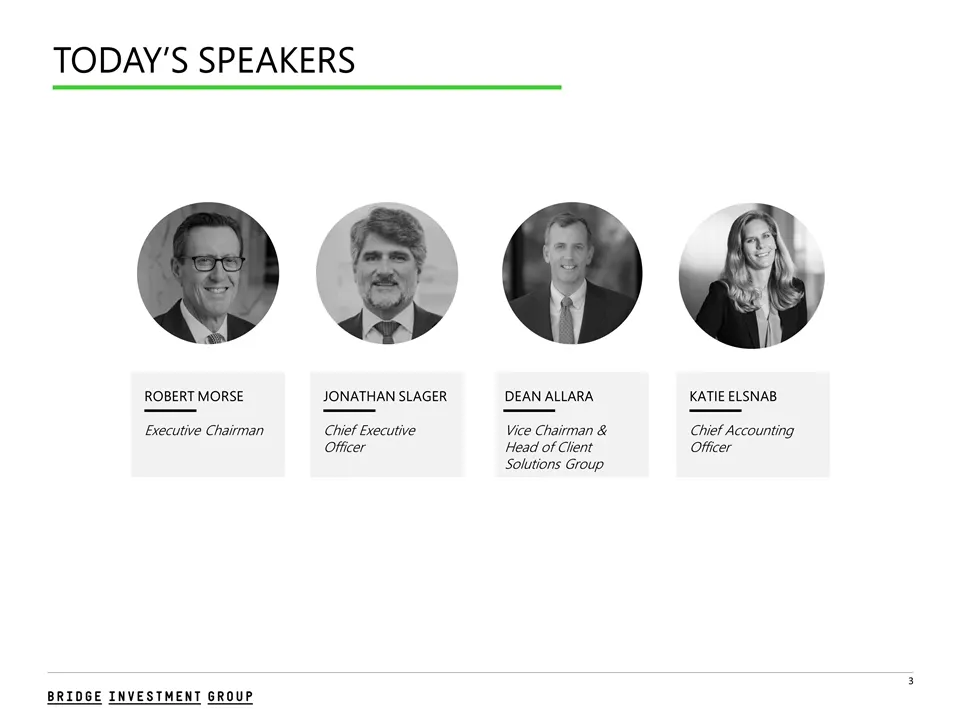
TODAY’S SPEAKERS 2 ROBERT MORSE Executive Chairman JONATHAN SLAGER Chief Executive Officer KATIE ELSNAB Chief Accounting Officer DEAN ALLARA Vice Chairman & Head of Client Solutions Group
Slide 4: Chairman Commentary
CHAIRMAN COMMENTARY BRIDGE NVESTMENT ROUP
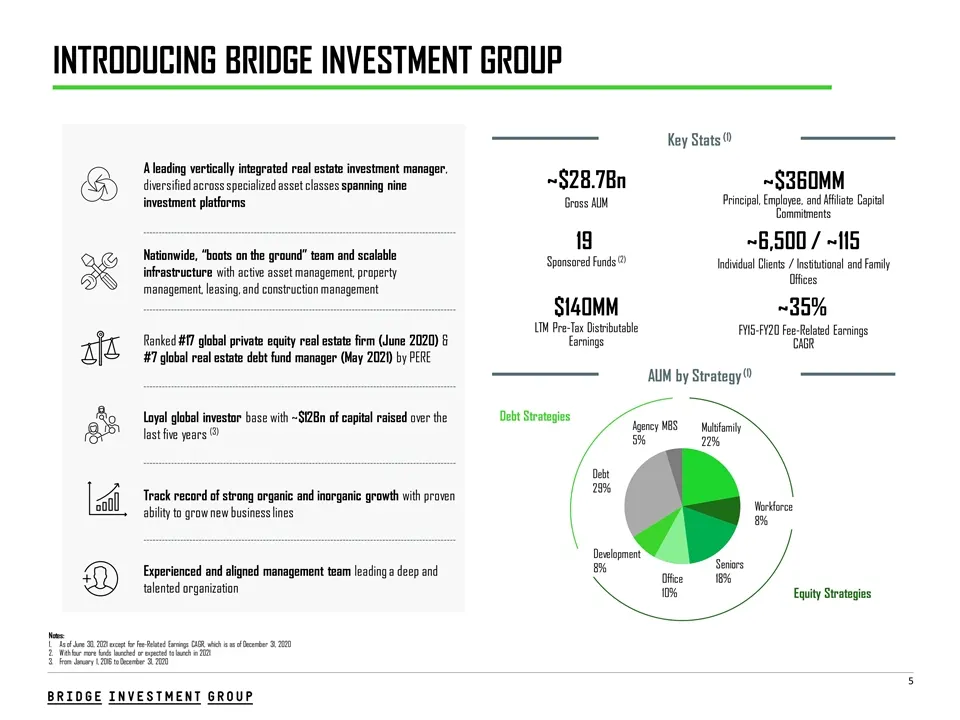
Slide 5: Introducing Bridge Investment Group
INTRODUCING BRIDGE INVESTMENT GROUP Notes: As of June 30, 2021 except for Fee-Related Earnings CAGR, which is as of December 31, 2020 With four more funds launched or expected to launch in 2021 From January 1, 2016 to December 31, 2020 4 A leading vertically integrated real estate investment manager
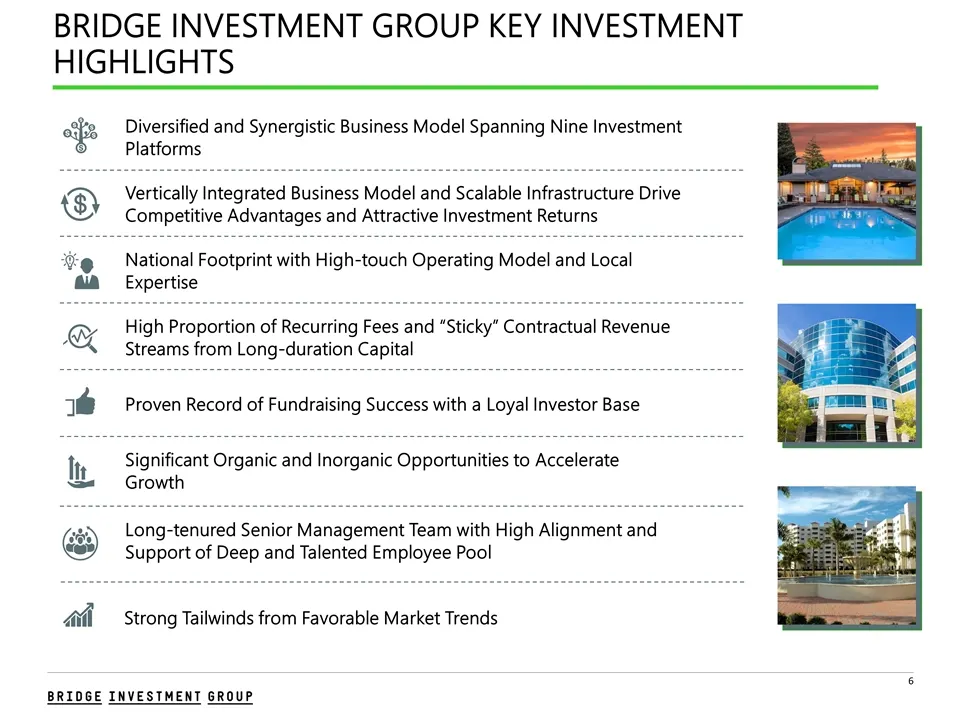
Slide 6: Bridge Investment Group Key Investment Highlights
14 Strong Tailwinds from Favorable Market Trends Diversified and Synergistic Business Model Spanning Nine Investment Platforms Vertically Integrated Business Model and Scalable Infrastructure Drive Competitive Advantages and Attractive Investment Returns National Footprint with High-touch Operating
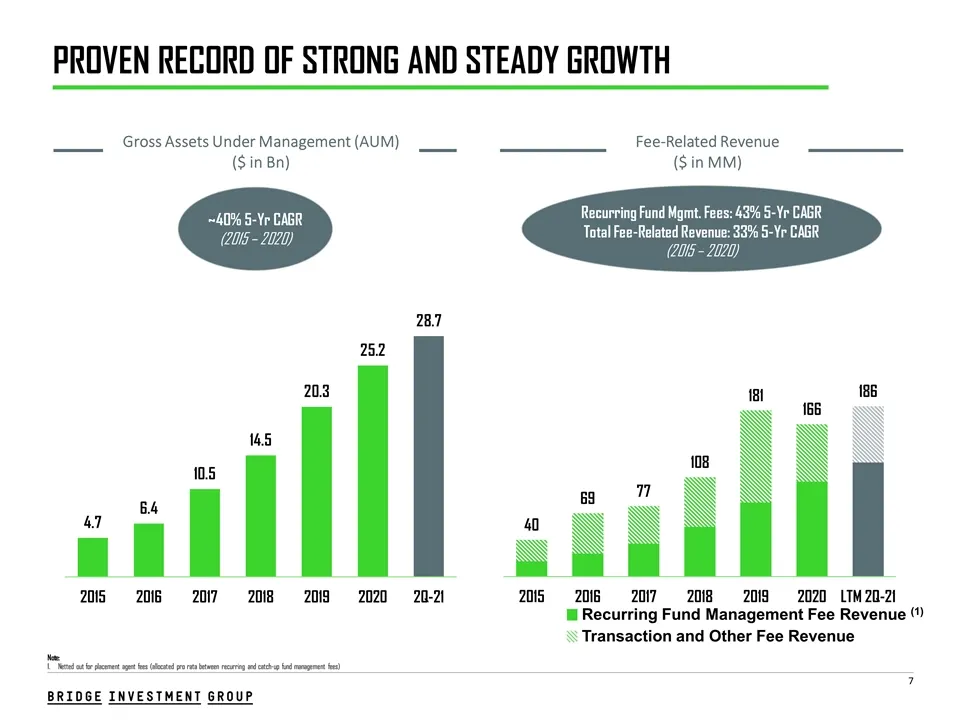
Slide 7: Proven Record of Strong and Steady Growth
10 Gross Assets Under Management (AUM) ($ in Bn) Fee-Related Revenue ($ in MM) PROVEN RECORD OF STRONG AND STEADY GROWTH Recurring Fund Management Fee Revenue (1) ~40% 5-Yr CAGR (2015 – 2020) Recurring Fund Mgmt. Fees: 43% 5-Yr CAGR Total Fee-Related Revenue: 33% 5-Yr CAGR (2015 – 2020) Note: Netted
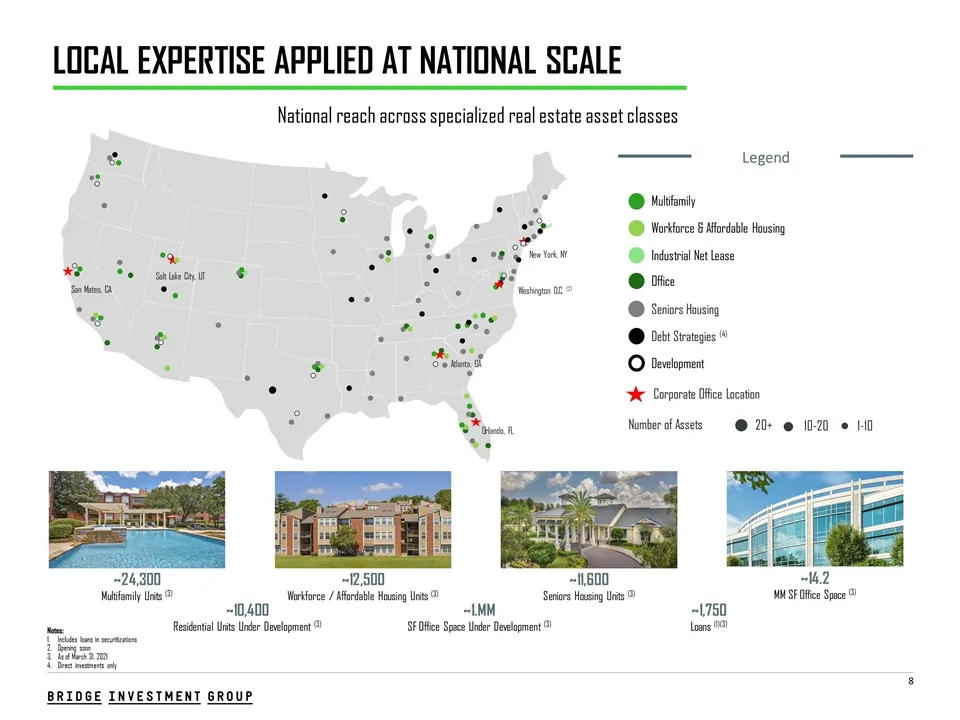
Slide 8: Local Expertise Applied at National Scale
Multifamily 3 Corporate Office Location Number of Assets 20+ 10-20 1-10 New York, NY Orlando, FL Atlanta, GA San Mateo, CA Salt Lake City, UT Legend ~24,300 Multifamily Units (3) Industrial Net Lease Development Office Debt Strategies (4) Seniors Housing Workforce & Affordable Housing ~12,500 Workfo
Slide 9: Fund performance by platform
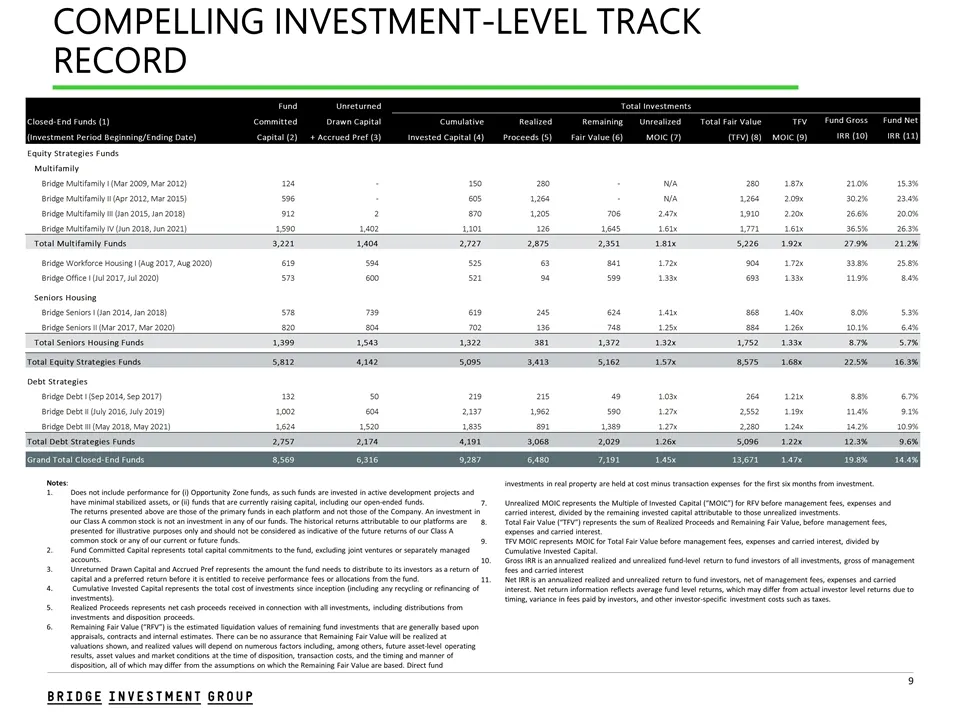
13 Notes: Does not include performance for (i) Opportunity Zone funds, as such funds are invested in active development projects and have minimal stabilized assets, or (ii) funds that are currently raising capital, including our open-ended funds. The returns presented above are those of the primary
Slide 10: Significant Investment Expertise
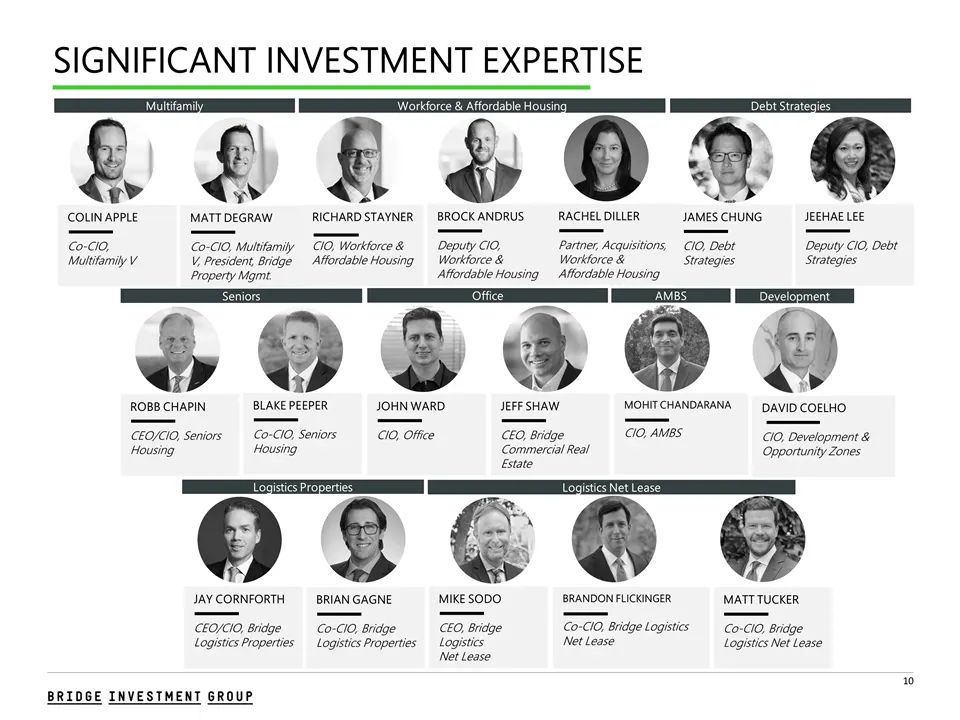
SIGNIFICANT INVESTMENT EXPERTISE COLIN APPLE Co-CIO, Multifamily V Multifamily Workforce & Affordable Housing Office Debt Strategies Development AMBS Seniors Logistics Properties Logistics Net Lease ROBB CHAPIN CEO/CIO, Seniors Housing RICHARD STAYNER CIO, Workforce & Affordable Housing BROCK ANDRUS
Slide 11: ESG Initiatives Are Core to Our Culture
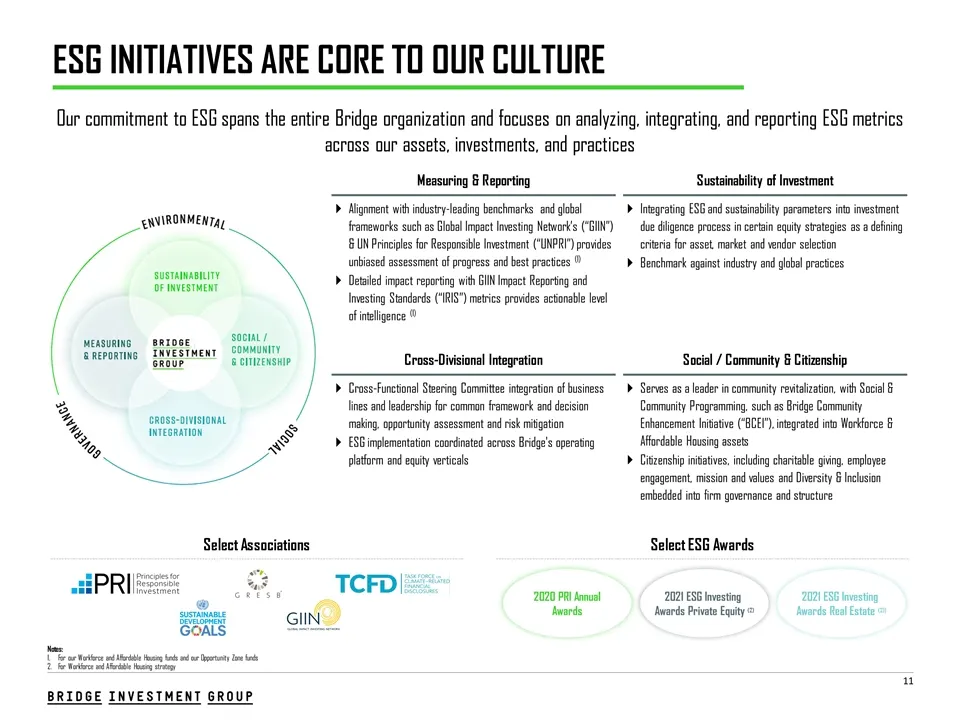
Notes: Alignment with industry-leading benchmarks and global frameworks such as Global Impact Investing Network’s (“GIIN”) & UN Principles for Responsible Investment (“UNPRI”) provides unbiased assessment of progress and best practices (1) Detailed impact reporting with GIIN Impact Reporting and Inv
Slide 12: 2nd Quarter Investment Highlights
2nd Quarter Investment Highlights
Slide 13: 2nd Quarter – Summary Highlights
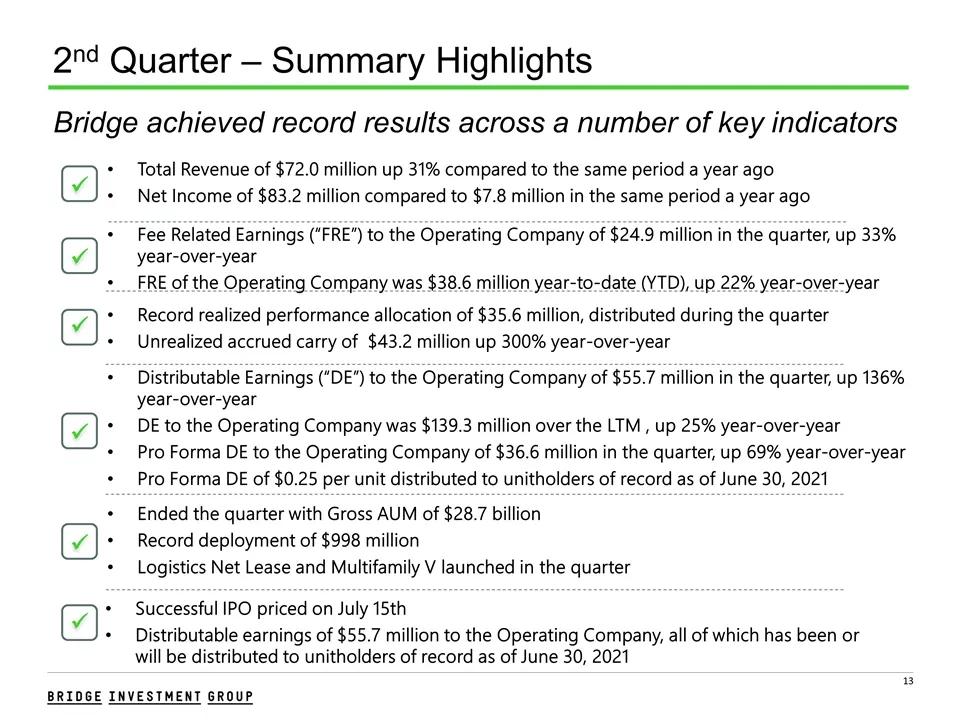
2nd Quarter – Summary Highlights Fee Related Earnings (“FRE”) to the Operating Company of $24.9 million in the quarter, up 33% year-over-year FRE of the Operating Company was $38.6 million year-to-date (YTD), up 22% year-over-year ü Record realized performance allocation of $35.6 million, distribute
Slide 14: 2nd Quarter – Historical Summary Results
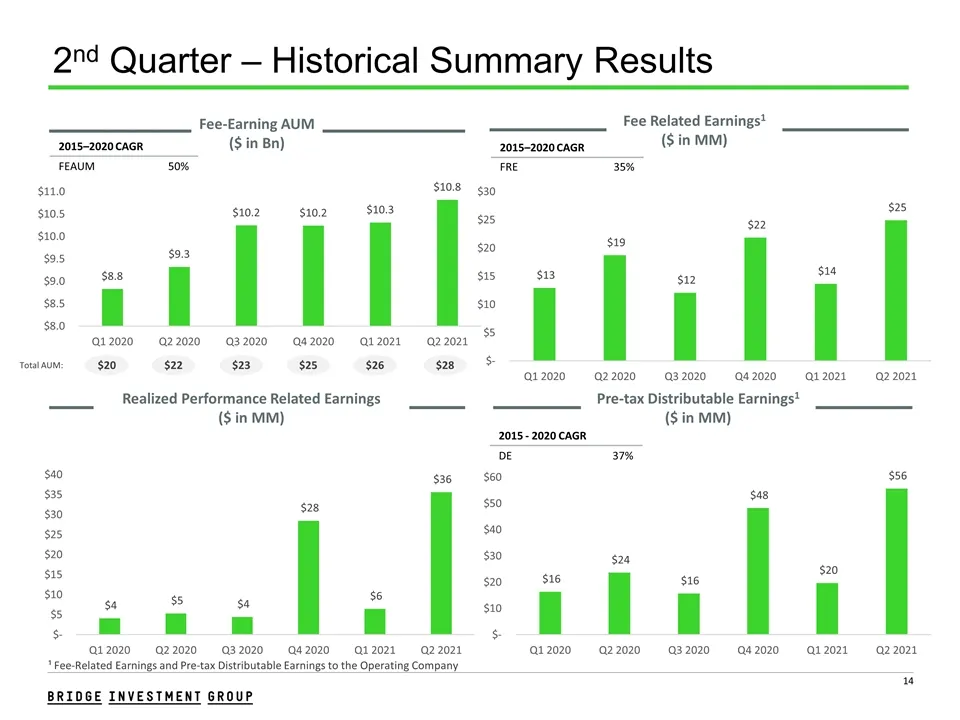
Fee-Earning AUM ($ in Bn) 2015–2020 CAGR FEAUM 50% Fee Related Earnings1 ($ in MM) 2015–2020 CAGR FRE 35% Pre-tax Distributable Earnings1 ($ in MM) 2015 - 2020 CAGR DE 37% Realized Performance Related Earnings ($ in MM) 2nd Quarter – Historical Summary Results Total AUM: $20 $22 $23 $25 $26 $28 ¹ Fe
Slide 15: Vertically Integrated Business Model Drives Competitive Advantages
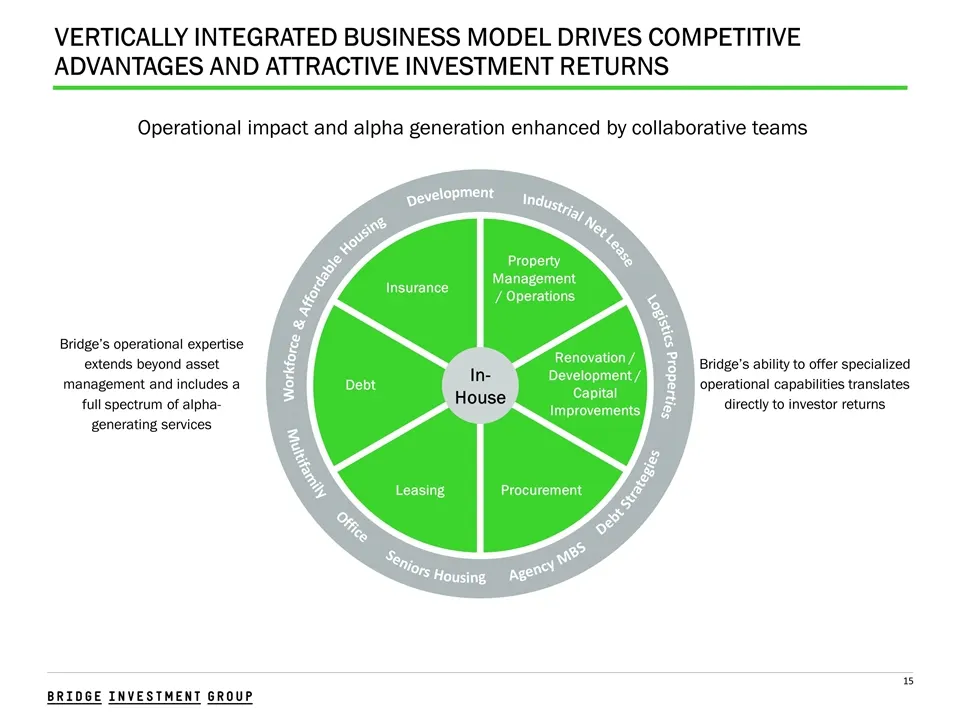
VERTICALLY INTEGRATED BUSINESS MODEL DRIVES COMPETITIVE ADVANTAGES AND ATTRACTIVE INVESTMENT RETURNS Operational impact and alpha generation enhanced by collaborative teams Bridge’s operational expertise extends beyond asset management and includes a full spectrum of alpha-generating services Bridge
Slide 16: Differentiated Data-Driven Investment Strategy
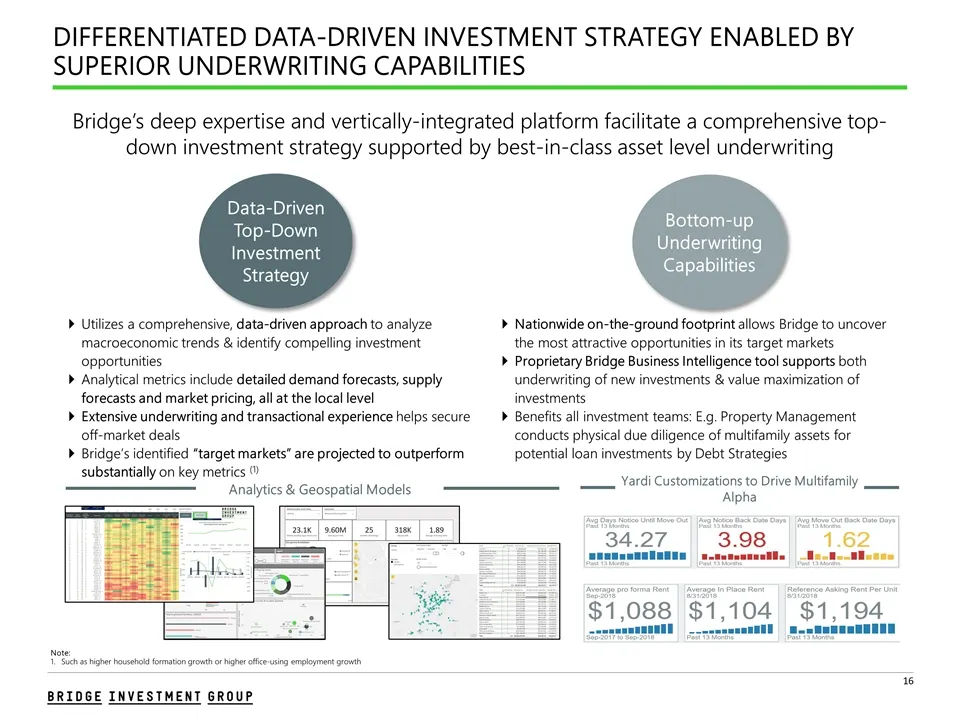
DIFFERENTIATED DATA-DRIVEN INVESTMENT STRATEGY ENABLED BY SUPERIOR UNDERWRITING CAPABILITIES 9 Bridge’s deep expertise and vertically-integrated platform facilitate a comprehensive top-down investment strategy supported by best-in-class asset level underwriting Data-Driven Top-Down Investment Strate
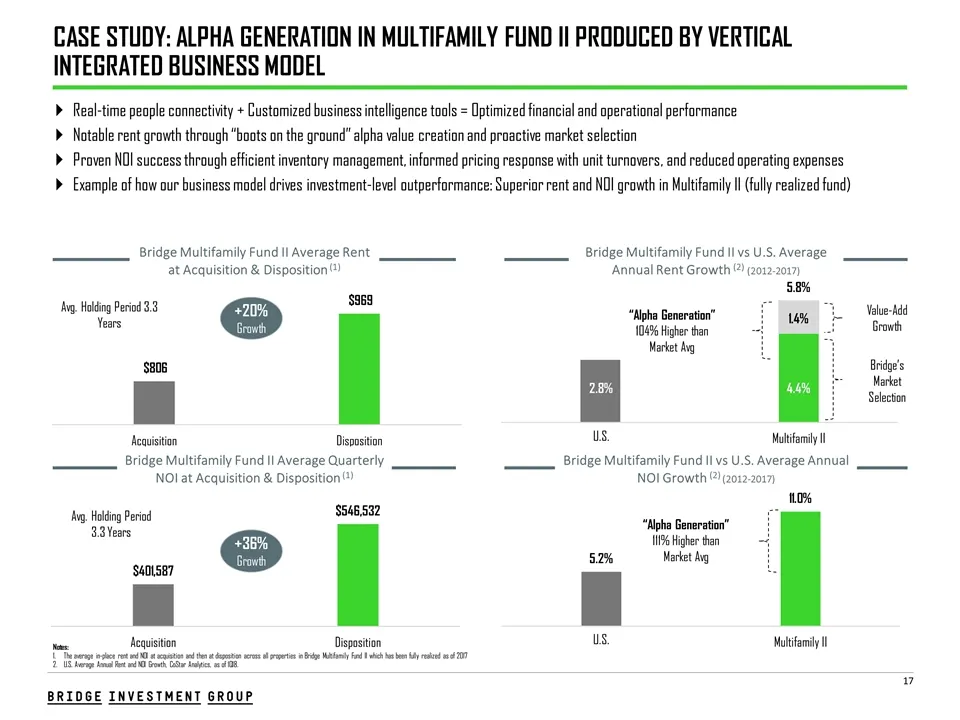
Slide 17: Case Study: Alpha Generation in Multifamily Fund II
Notes: The average in-place rent and NOI at acquisition and then at disposition across all properties in Bridge Multifamily Fund II which has been fully realized as of 2017 U.S. Average Annual Rent and NOI Growth, CoStar Analytics, as of 1Q18. Bridge Multifamily Fund II vs U.S. Average Annual Rent G
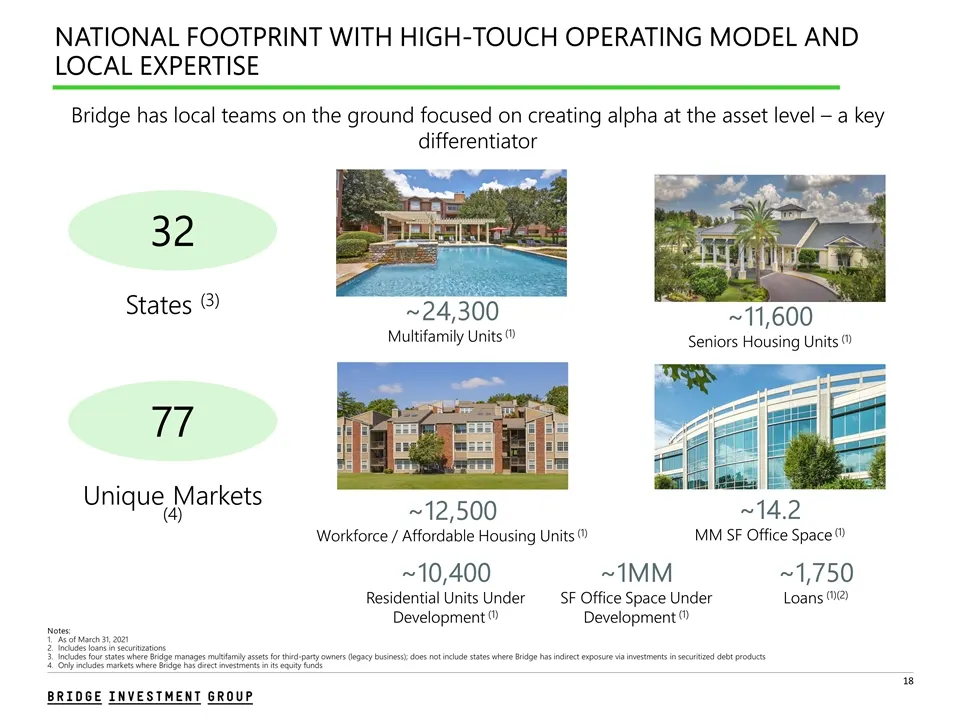
Slide 18: National Footprint with High-Touch Operating Model
19 Notes: As of March 31, 2021 Includes loans in securitizations Includes four states where Bridge manages multifamily assets for third-party owners (legacy business); does not include states where Bridge has indirect exposure via investments in securitized debt products Only includes markets where
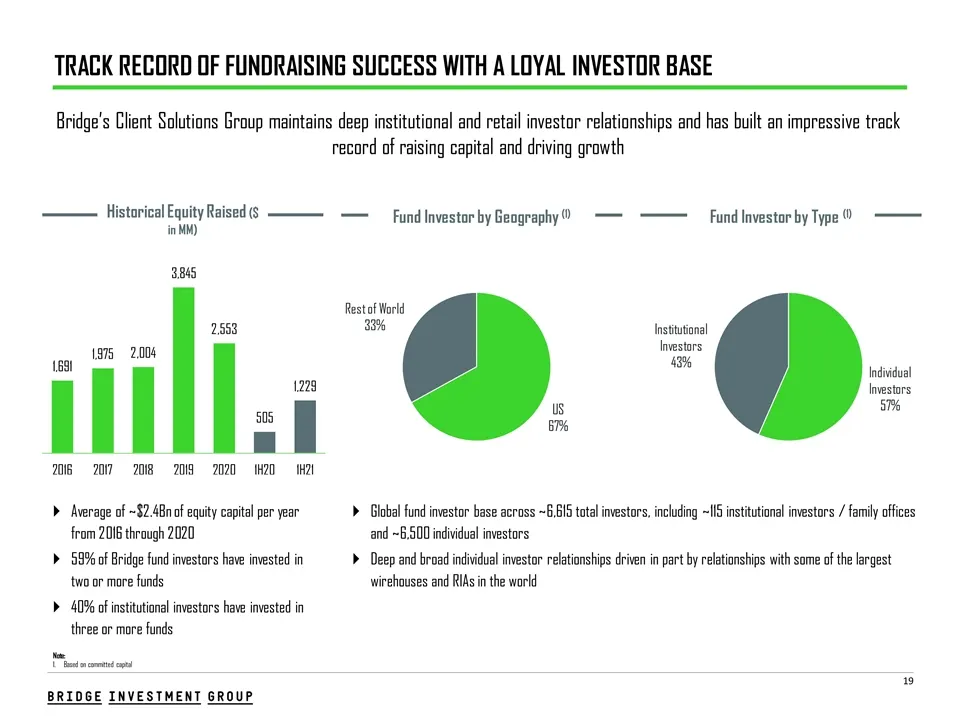
Slide 19: Track Record of Fundraising Success with a Loyal Investor Base
21 TRACK RECORD OF FUNDRAISING SUCCESS WITH A LOYAL INVESTOR BASE Average of ~$2.4Bn of equity capital per year from 2016 through 2020 59% of Bridge fund investors have invested in two or more funds 40% of institutional investors have invested in three or more funds Global fund investor base across
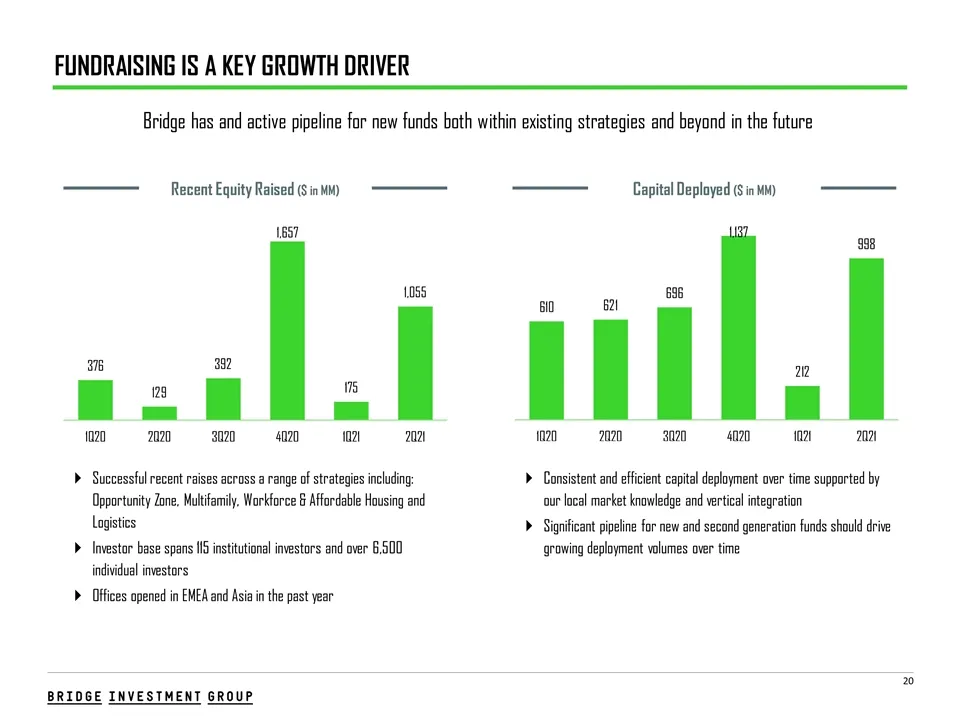
Slide 20: Fundraising Is a Key Growth Driver
21 FUNDRAISING IS A KEY GROWTH DRIVER Successful recent raises across a range of strategies including: Opportunity Zone, Multifamily, Workforce & Affordable Housing and Logistics Investor base spans 115 institutional investors and over 6,500 individual investors Offices opened in EMEA and Asia in th
Slide 21: Significant Organic & Inorganic Opportunity to Accelerate Growth
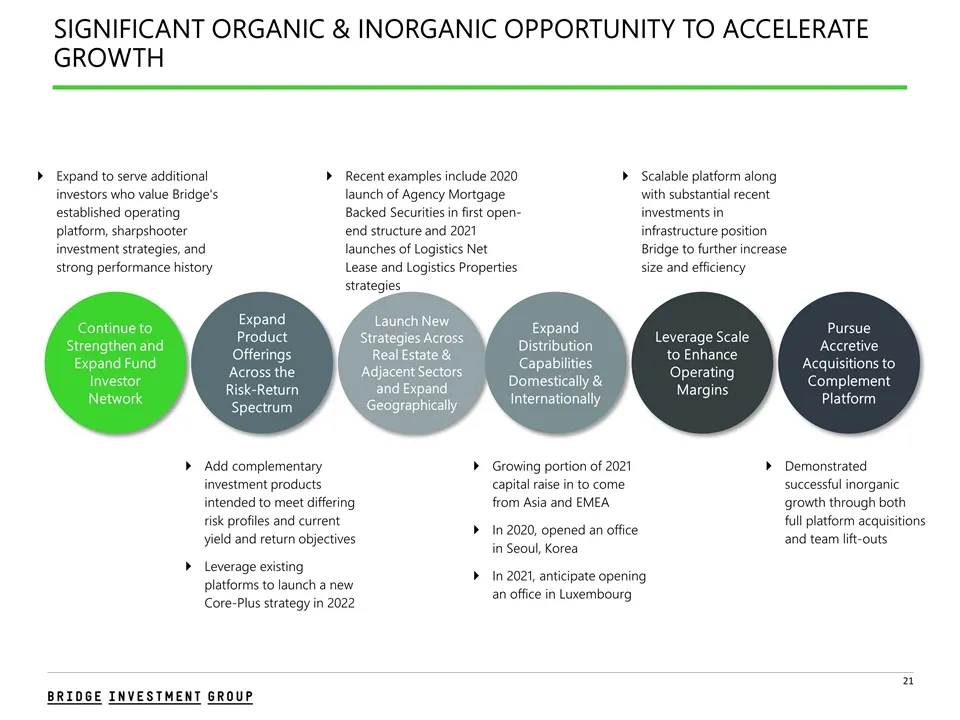
23 SIGNIFICANT ORGANIC & INORGANIC OPPORTUNITY TO ACCELERATE GROWTH Continue to Strengthen and Expand Fund Investor Network Expand Product Offerings Across the Risk-Return Spectrum Launch New Strategies Across Real Estate & Adjacent Sectors and Expand Geographically Leverage Scale to Enhance Operati
Slide 22: 2nd Quarter Financial Review
2nd Quarter Financial Review
Slide 23: GAAP Income Statement
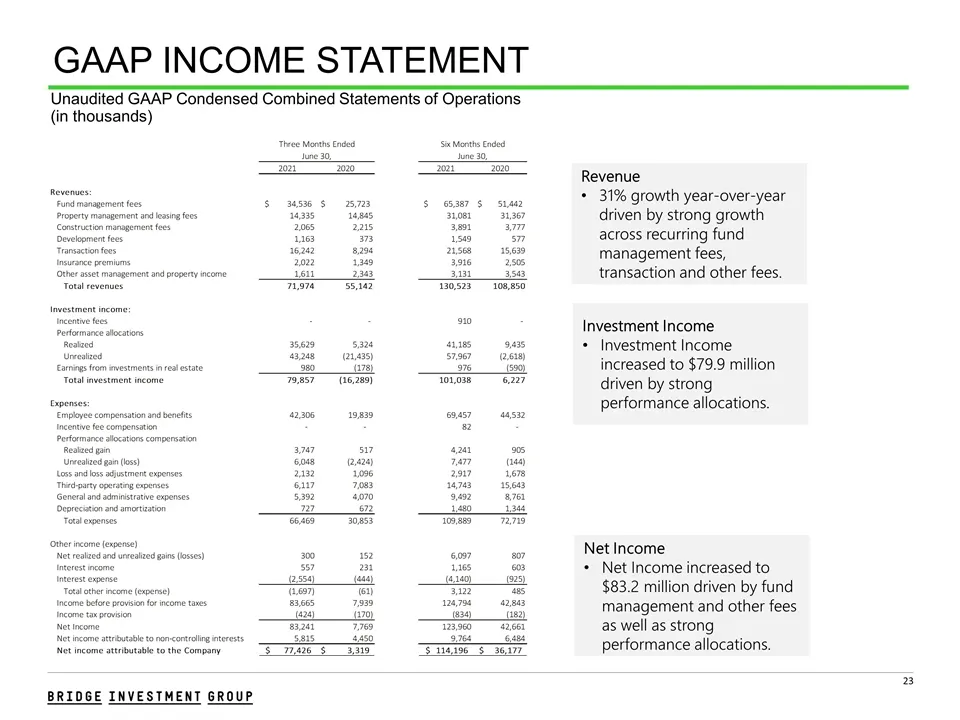
GAAP INCOME STATEMENT Unaudited GAAP Condensed Combined Statements of Operations (in thousands) Revenue 31% growth year-over-year driven by strong growth across recurring fund management fees, transaction and other fees. Investment Income Investment Income increased to $79.9 million driven by strong
Slide 24: Non GAAP Income Statement Summary
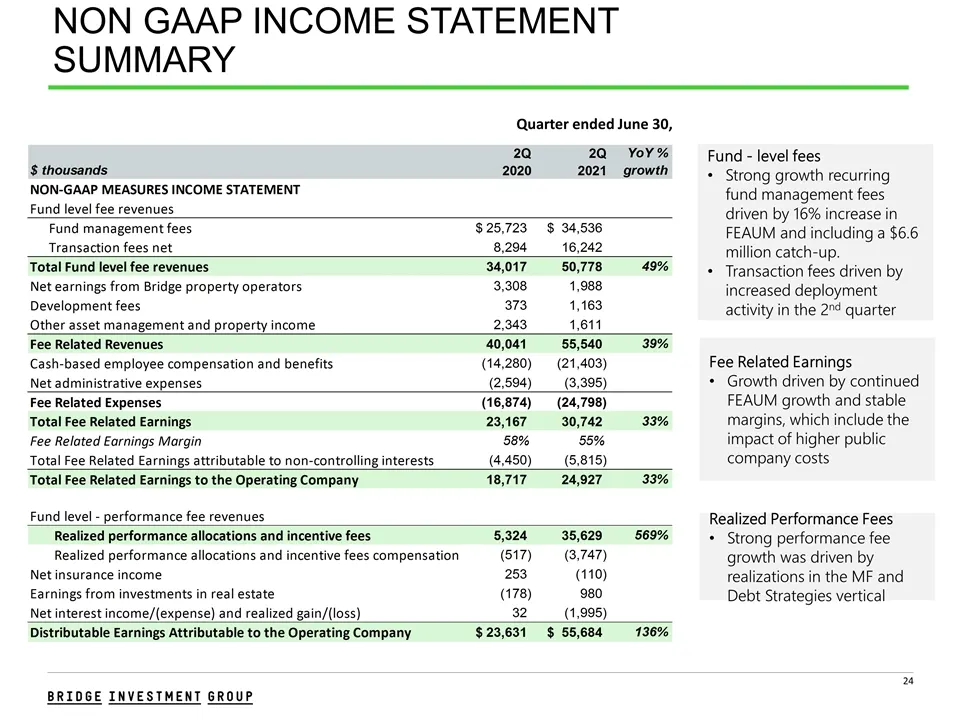
NON GAAP INCOME STATEMENT SUMMARY 1 Quarter ended June 30, Fee Related Earnings Growth driven by continued FEAUM growth and stable margins, which include the impact of higher public company costs Fund - level fees Strong growth recurring fund management fees driven by 16% increase in FEAUM and inclu
Slide 25: FEAUM and Fee Related Revenue Summary
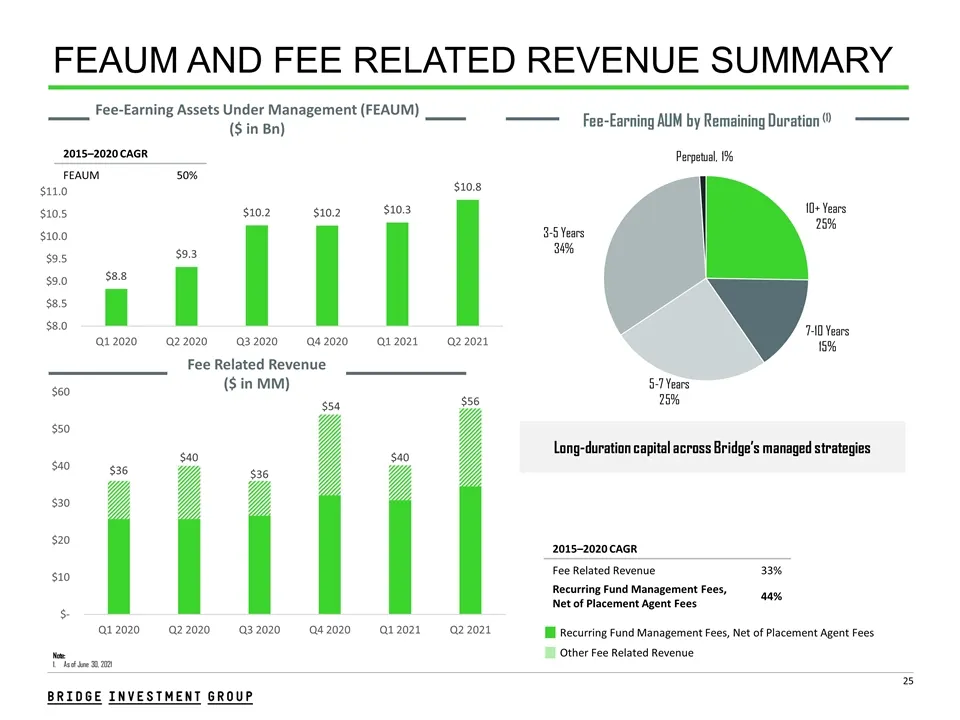
10 FEAUM AND FEE RELATED REVENUE SUMMARY Recurring Fund Management Fees, Net of Placement Agent Fees Fee-Earning Assets Under Management (FEAUM) ($ in Bn) Fee Related Revenue ($ in MM) Other Fee Related Revenue 2015–2020 CAGR FEAUM 50% 2015–2020 CAGR Fee Related Revenue 33% Recurring Fund Management
Slide 26: Performance Fees Summary
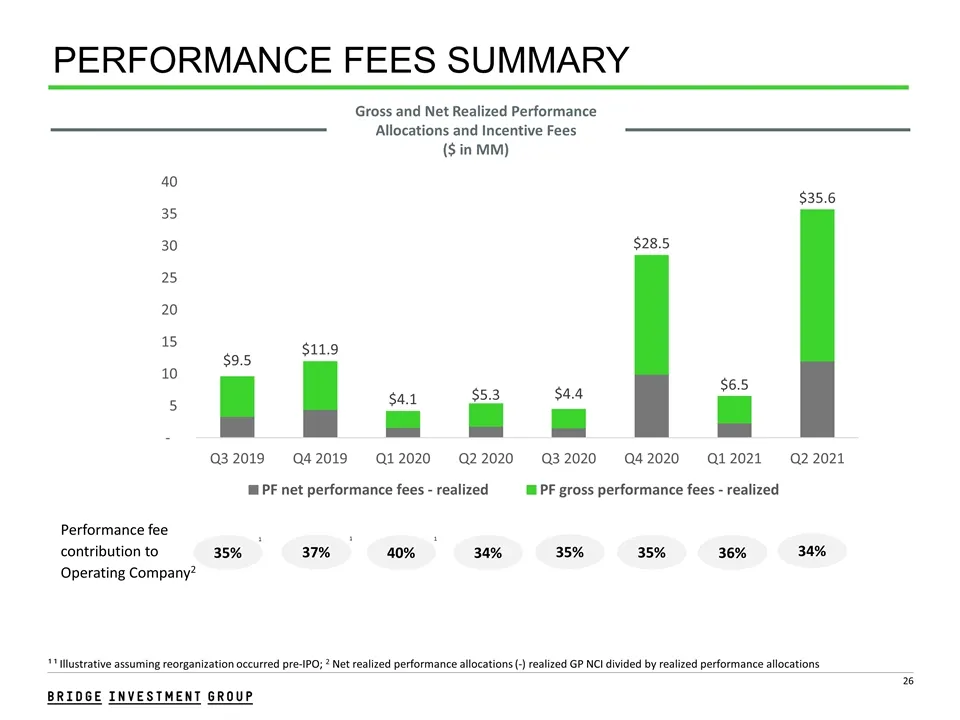
PERFORMANCE FEES SUMMARY 1 Gross and Net Realized Performance Allocations and Incentive Fees ($ in MM) Performance fee contribution to Operating Company2 35% ¹ ¹ Illustrative assuming reorganization occurred pre-IPO; 2 Net realized performance allocations (-) realized GP NCI divided by realized perf
Slide 27: Non-Controlling Interests
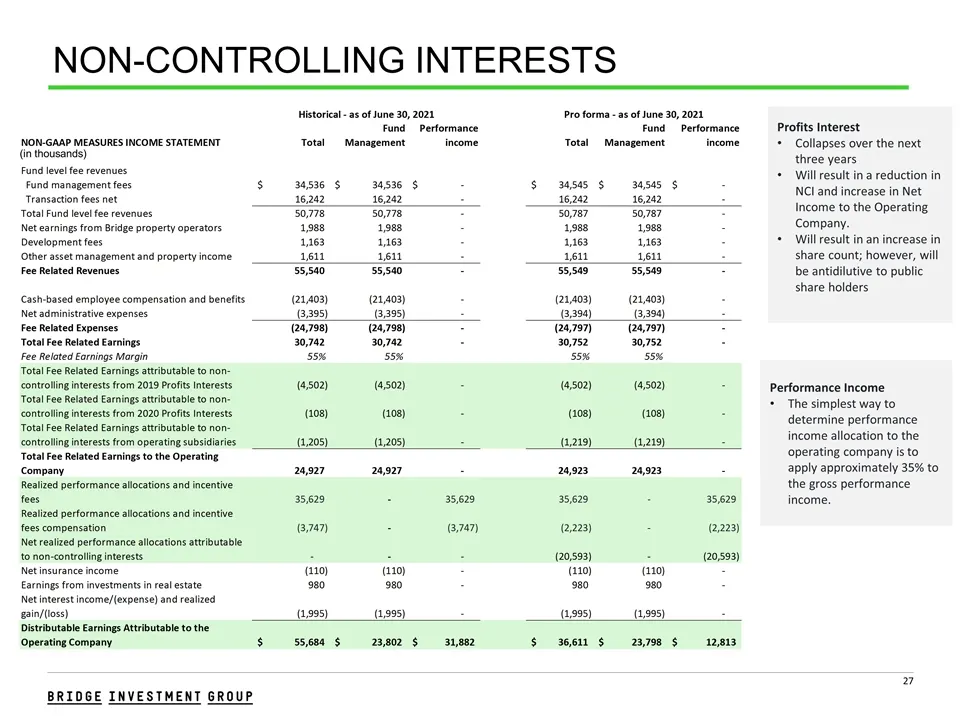
NON-CONTROLLING INTERESTS 1 Performance Income The simplest way to determine performance income allocation to the operating company is to apply approximately 35% to the gross performance income. Profits Interest Collapses over the next three years Will result in a reduction in NCI and increase in Ne
Slide 28: Distributable Earnings and Capitalization
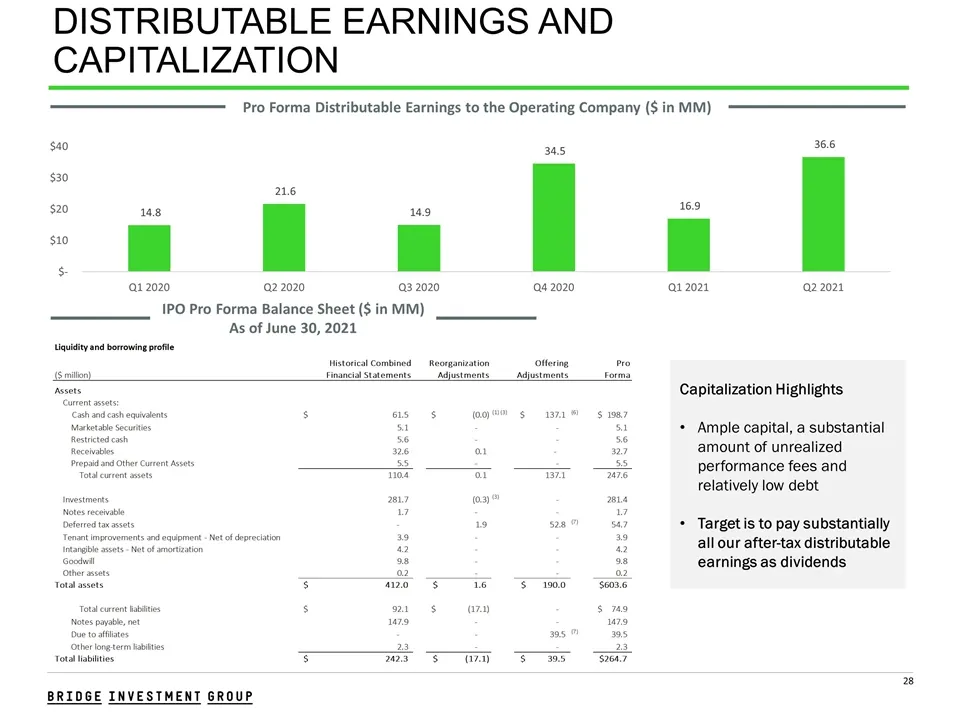
DISTRIBUTABLE EARNINGS AND CAPITALIZATION 1 IPO Pro Forma Balance Sheet ($ in MM) As of June 30, 2021 Pro Forma Distributable Earnings to the Operating Company ($ in MM) Capitalization Highlights Ample capital, a substantial amount of unrealized performance fees and relatively low debt Target is to
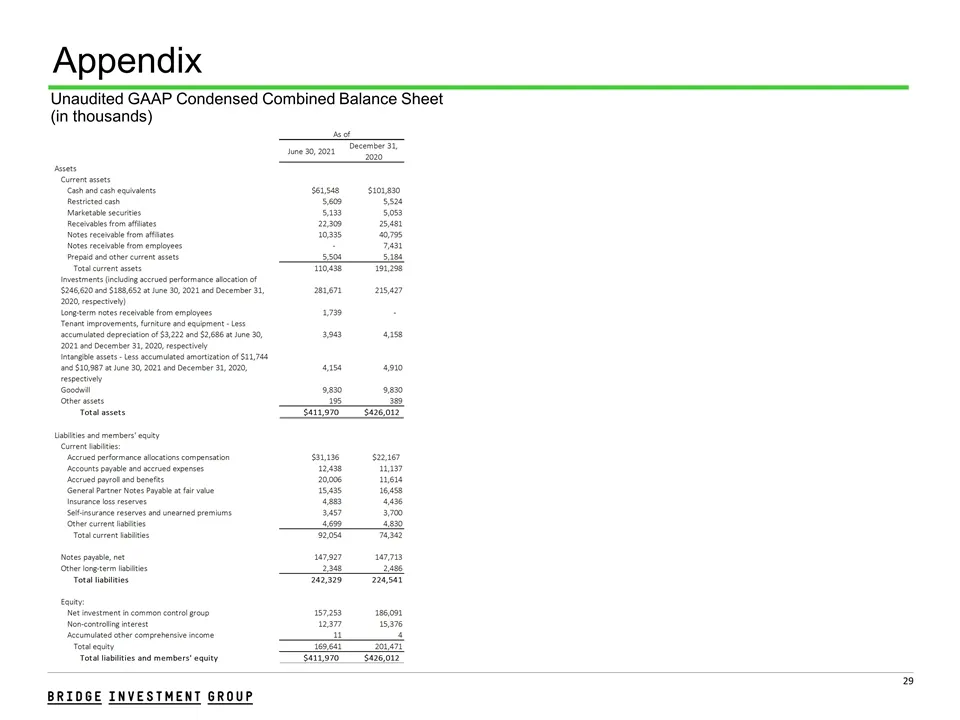
Slide 29: Unaudited GAAP Condensed Combined Balance Sheet
Appendix Unaudited GAAP Condensed Combined Balance Sheet (in thousands)
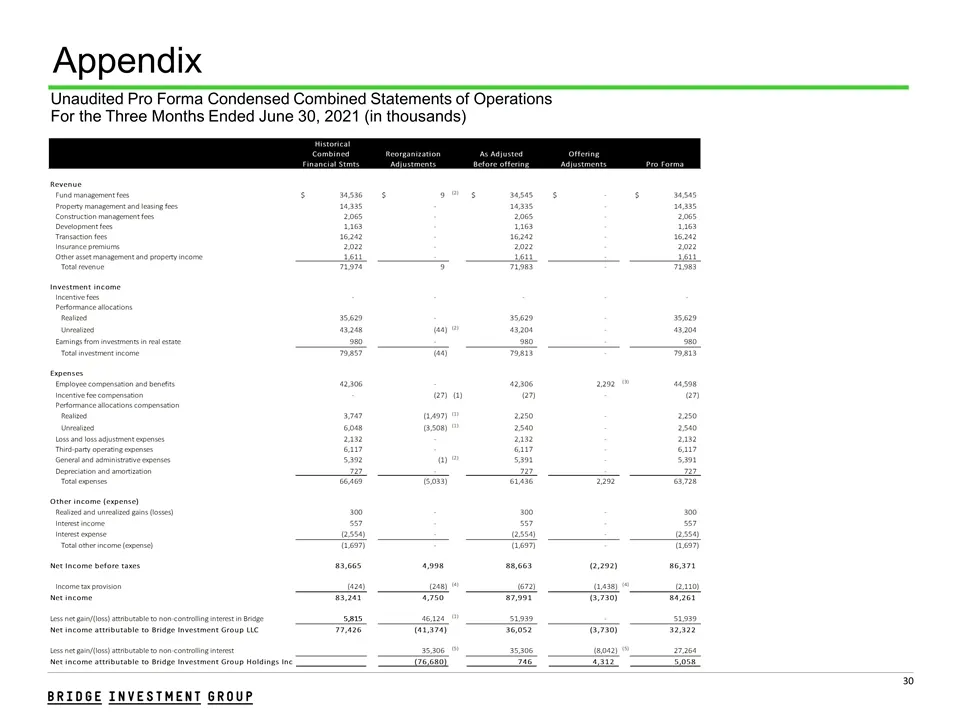
Slide 30: Unaudited Pro Forma Condensed Combined Statements of Operations
Appendix Unaudited Pro Forma Condensed Combined Statements of Operations For the Three Months Ended June 30, 2021 (in thousands)
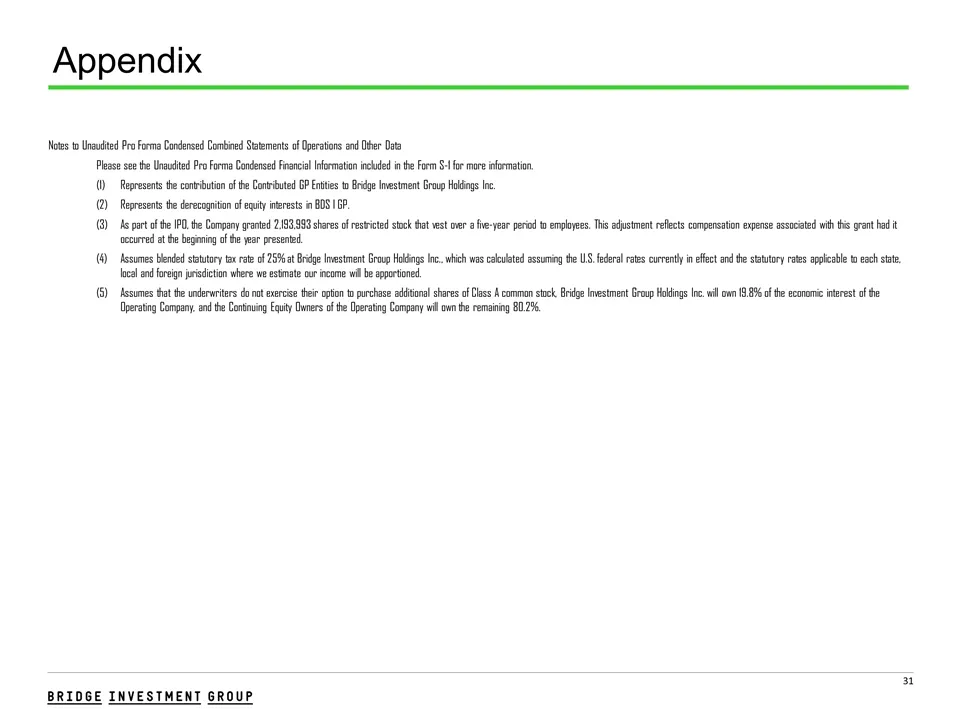
Slide 31: Notes to Unaudited Pro Forma Condensed Combined Statements of Operations
Appendix Notes to Unaudited Pro Forma Condensed Combined Statements of Operations and Other Data Please see the Unaudited Pro Forma Condensed Financial Information included in the Form S-1 for more information. Represents the contribution of the Contributed GP Entities to Bridge Investment Group Hol
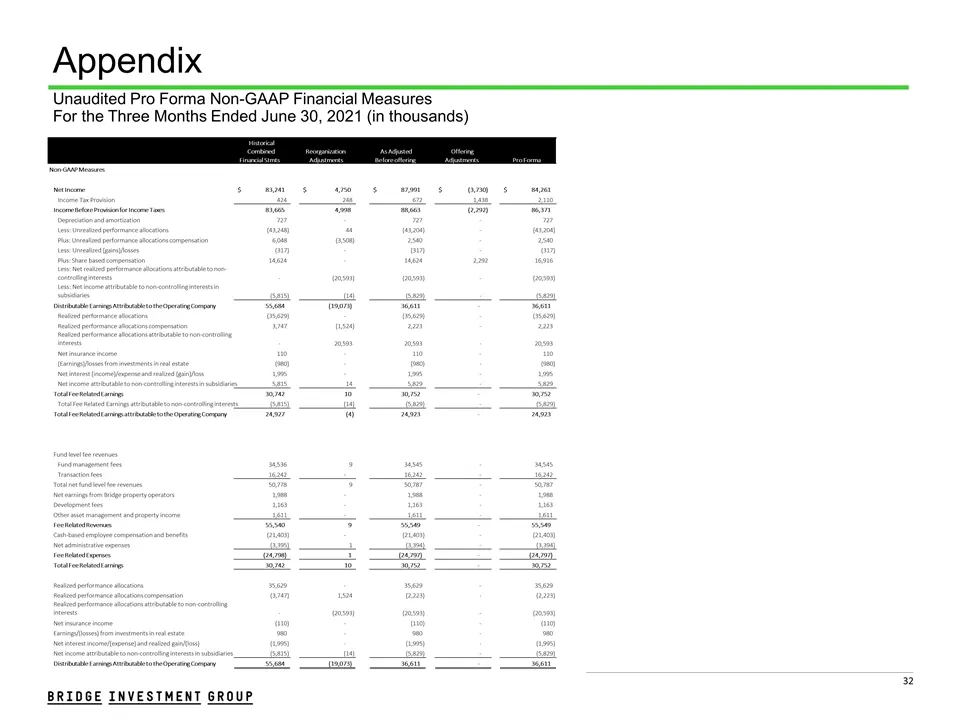
Slide 32: Unaudited Pro Forma Non-GAAP Financial Measures
Appendix Unaudited Pro Forma Non-GAAP Financial Measures For the Three Months Ended June 30, 2021 (in thousands) Historical Combined Financial Stmts Reorganization Adjustments As Adjusted Before offering Offering Adjustments Pro Forma Non-GAAP Measures Net Income 83,241 $ 4,750 $ 87,991 $ (3,730) $
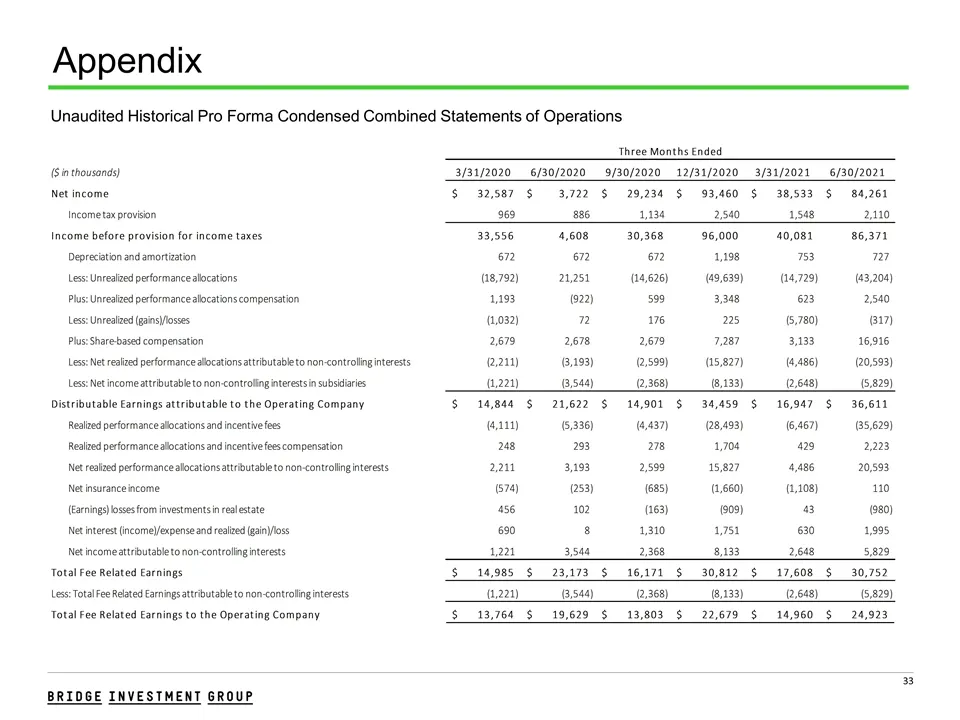
Slide 33: Unaudited Historical Pro Forma Condensed Combined Statements of Operations
Appendix Unaudited Historical Pro Forma Condensed Combined Statements of Operations
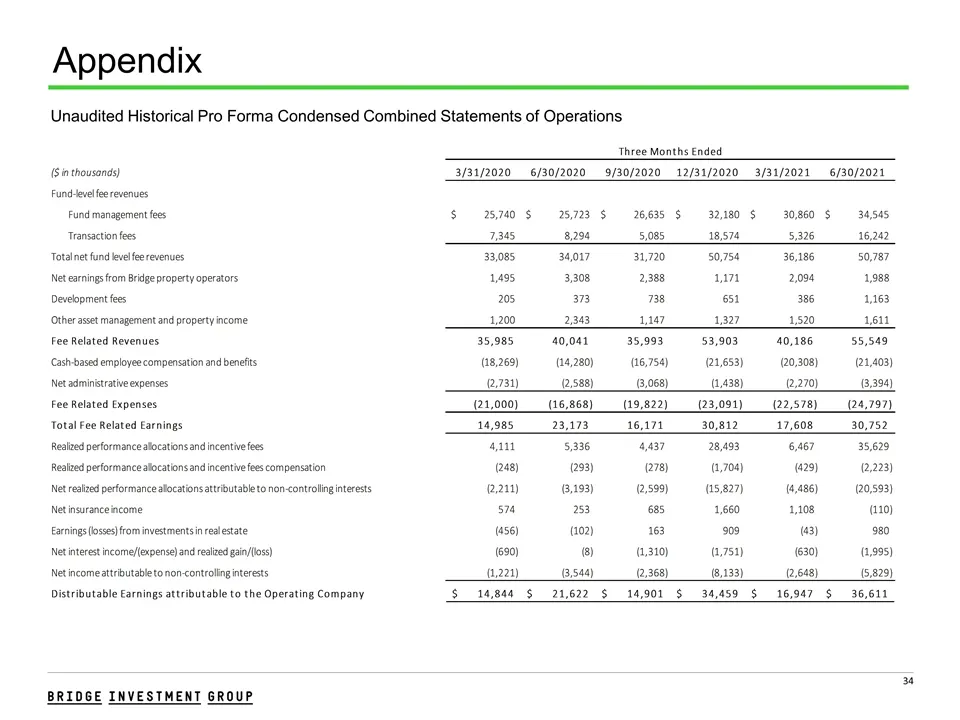
Slide 34: Unaudited Historical Pro Forma Condensed Combined Statements of Operations
Appendix Unaudited Historical Pro Forma Condensed Combined Statements of Operations
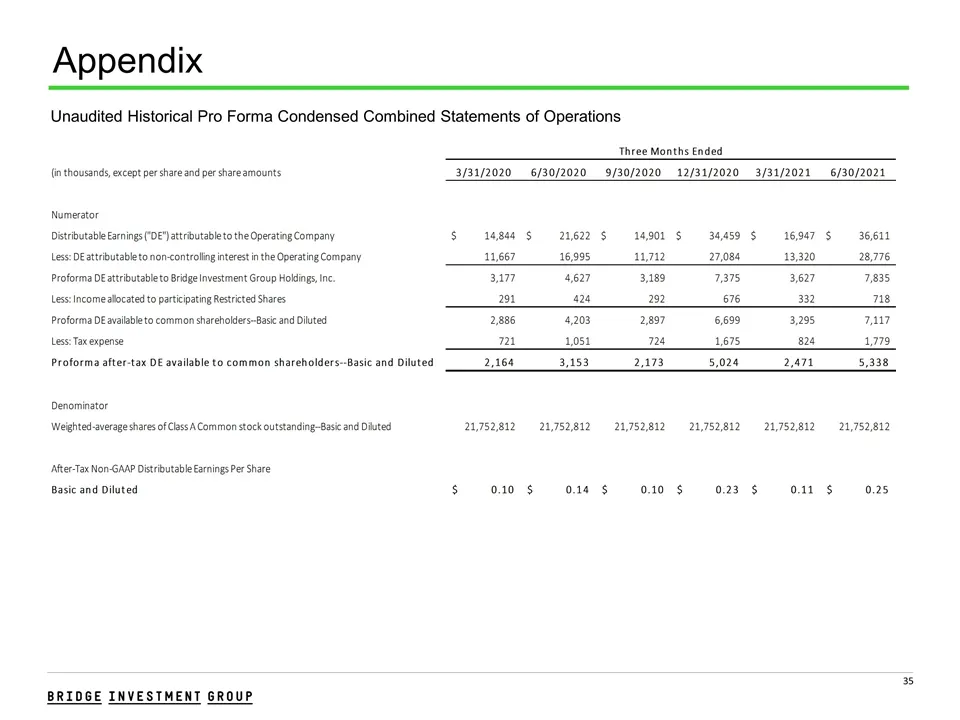
Slide 35: Unaudited Historical Pro Forma Condensed Combined Statements of Operations
Appendix Unaudited Historical Pro Forma Condensed Combined Statements of Operations
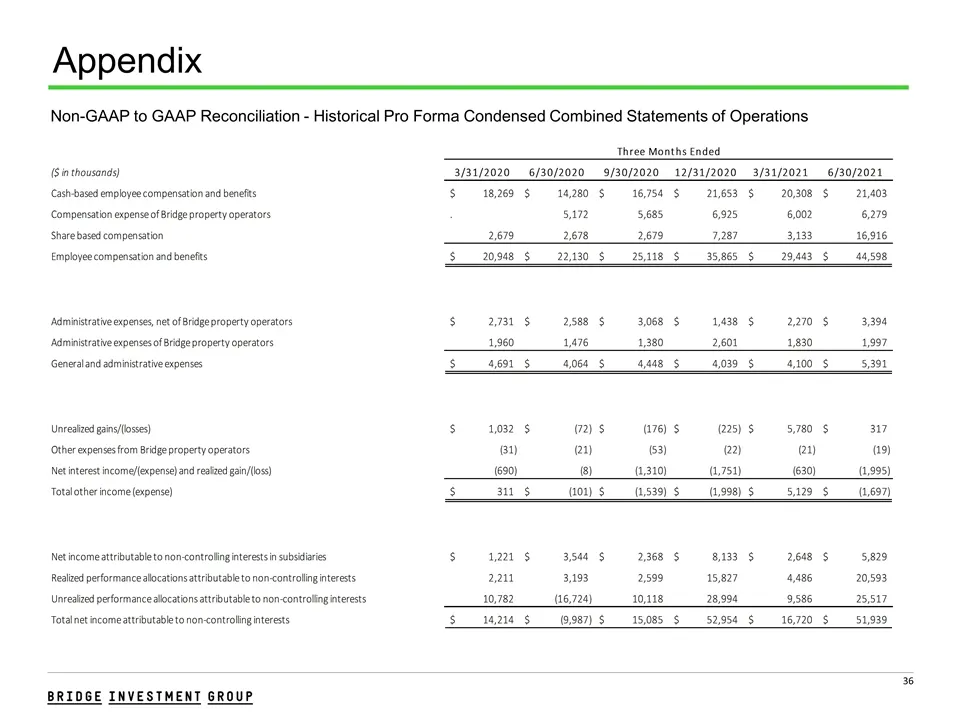
Slide 36: Non-GAAP to GAAP Reconciliation - Historical Pro Forma Statements
Appendix Non-GAAP to GAAP Reconciliation - Historical Pro Forma Condensed Combined Statements of Operations
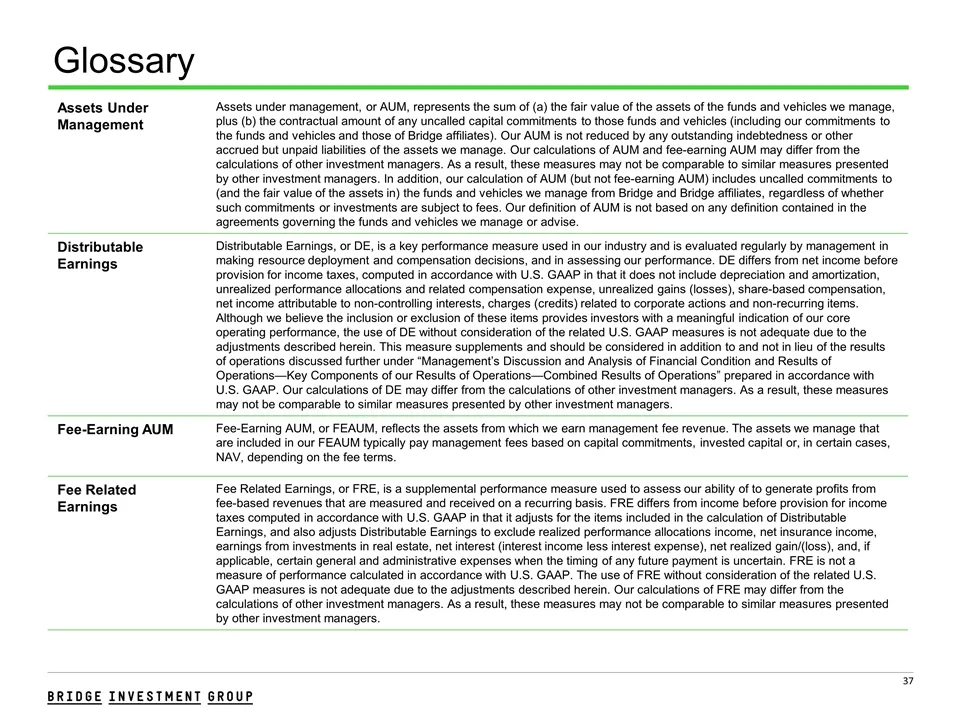
Slide 37: Glossary
Glossary Assets Under Management Assets under management, or AUM, represents the sum of (a) the fair value of the assets of the funds and vehicles we manage, plus (b) the contractual amount of any uncalled capital commitments to those funds and vehicles (including our commitments to the funds and ve
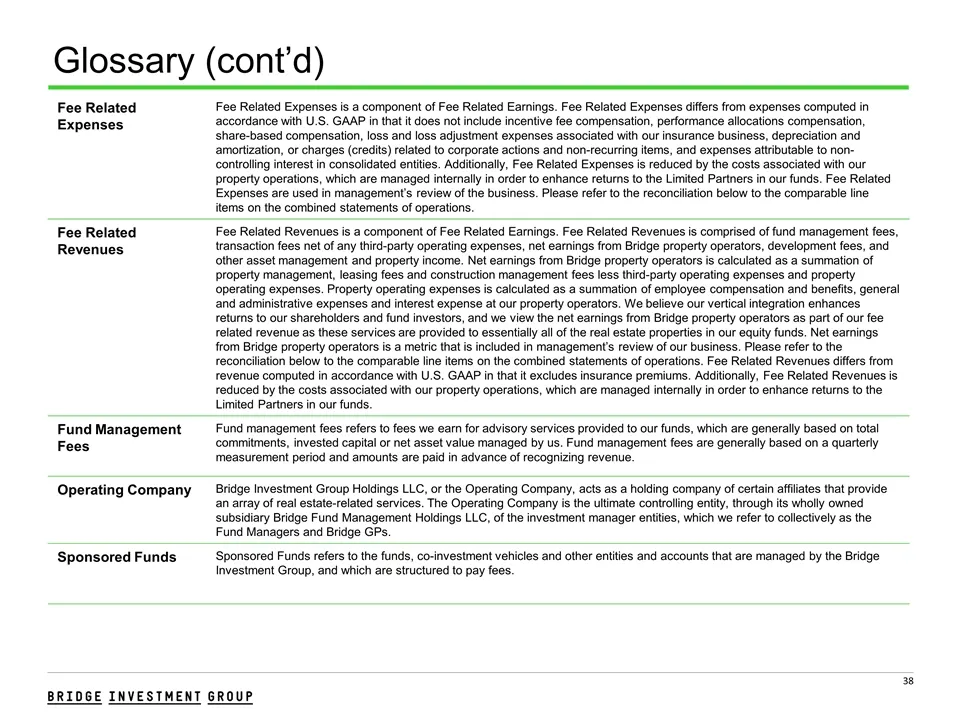
Slide 38: Glossary (cont'd)
Glossary (cont’d) Fee Related Expenses Fee Related Expenses is a component of Fee Related Earnings. Fee Related Expenses differs from expenses computed in accordance with U.S. GAAP in that it does not include incentive fee compensation, performance allocations compensation, share-based compensation,
Source: SEC EDGAR · 8-K filed Aug 10, 2021
More decks from Bridge Investment Group Holdings Inc
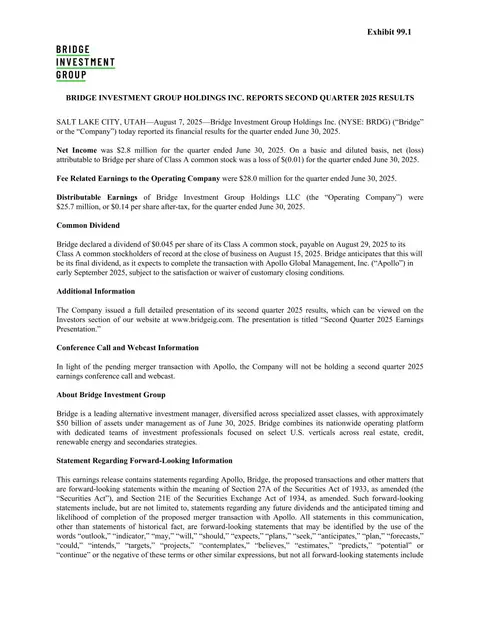 Q2 2025 Earnings Presentation40 slides · Aug 7, 2025
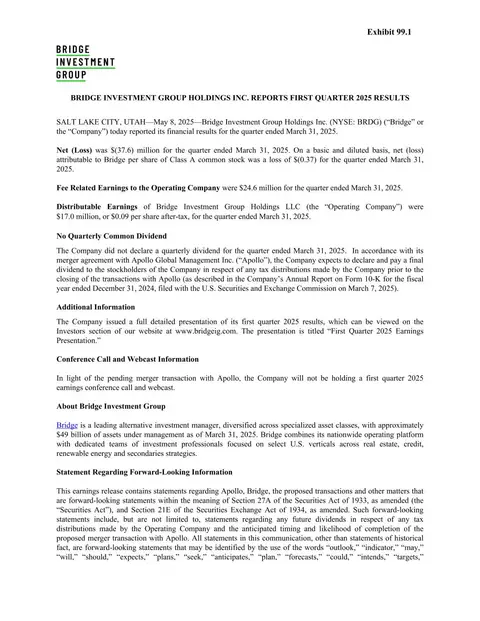 Q1 2025 Earnings Presentation41 slides · May 8, 2025
 Q4 2024 Earnings Presentation34 slides · Feb 24, 2025
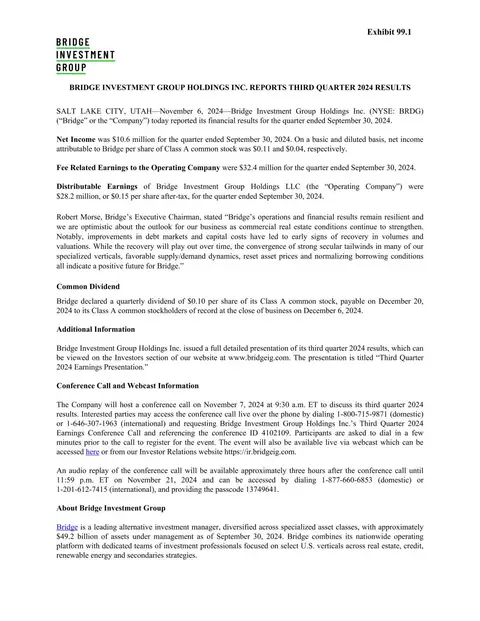 Q3 2024 Earnings Presentation36 slides · Nov 6, 2024
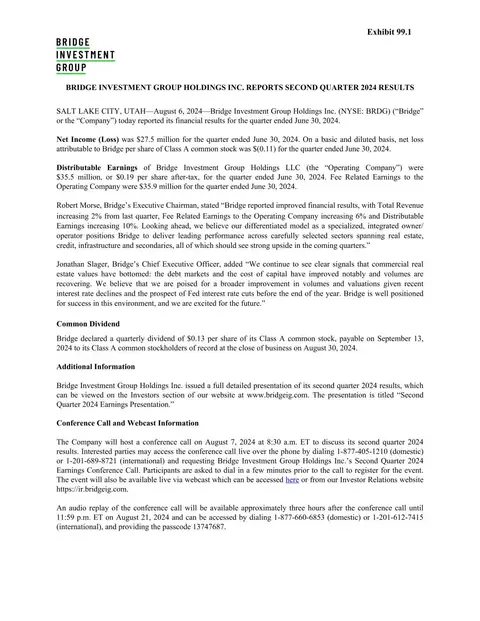 Q2 2024 Earnings Presentation38 slides · Aug 6, 2024
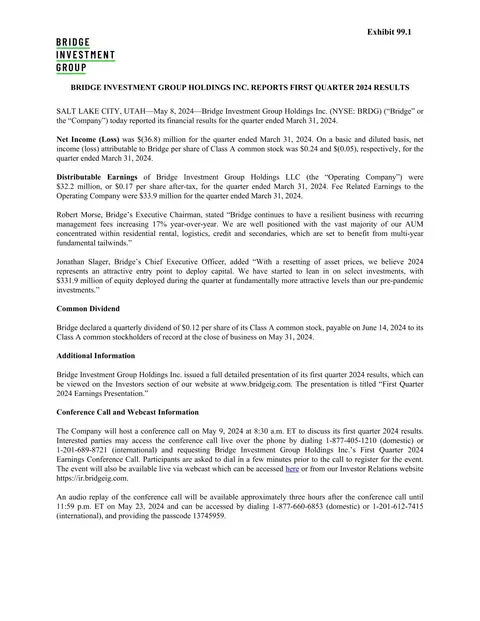 Q1 2024 Earnings Presentation38 slides · May 8, 2024