Kingfisher PLC · LSE:KGF
Kingfisher — H1 2002/03 Earnings Presentation
55 slides from Kingfisher's earnings presentation, 2002

Slide 1: Leading in international home retail
Leading in international home retail

Slide 2: Geoff Mulcahy, Chief Executive
Geoff Mulcahy Chief Executive
Slide 3: Agenda
Agenda • Financials • Future plans • Transformation update
Slide 4: Delivered 26% profit growth
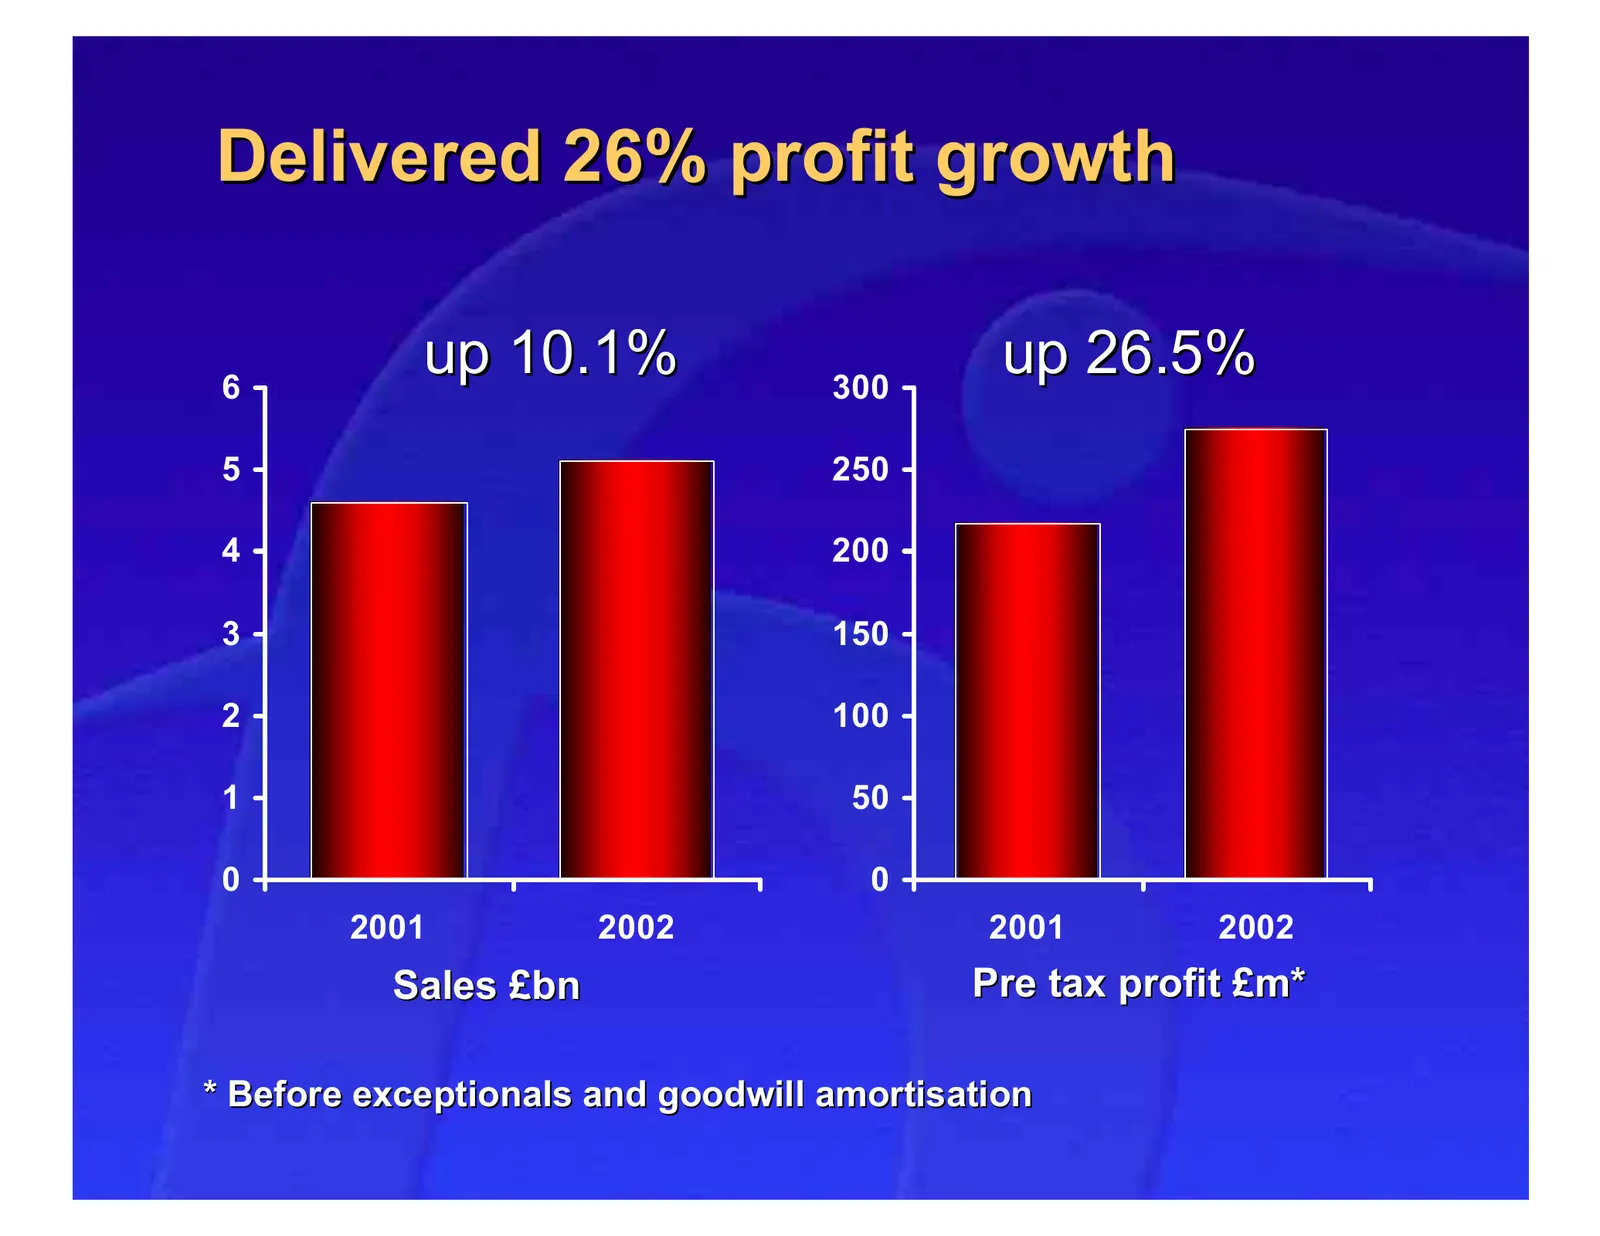
Delivered 26% profit growth 6 up 10.1% 300 up 26.5% 5 250 4 200 3 150 2 100 1 50 0 0 2001 2002 2001 2002 Sales £bn Pre tax profit £m* * Before exceptionals and goodwill amortisation
Slide 5: Two strong businesses
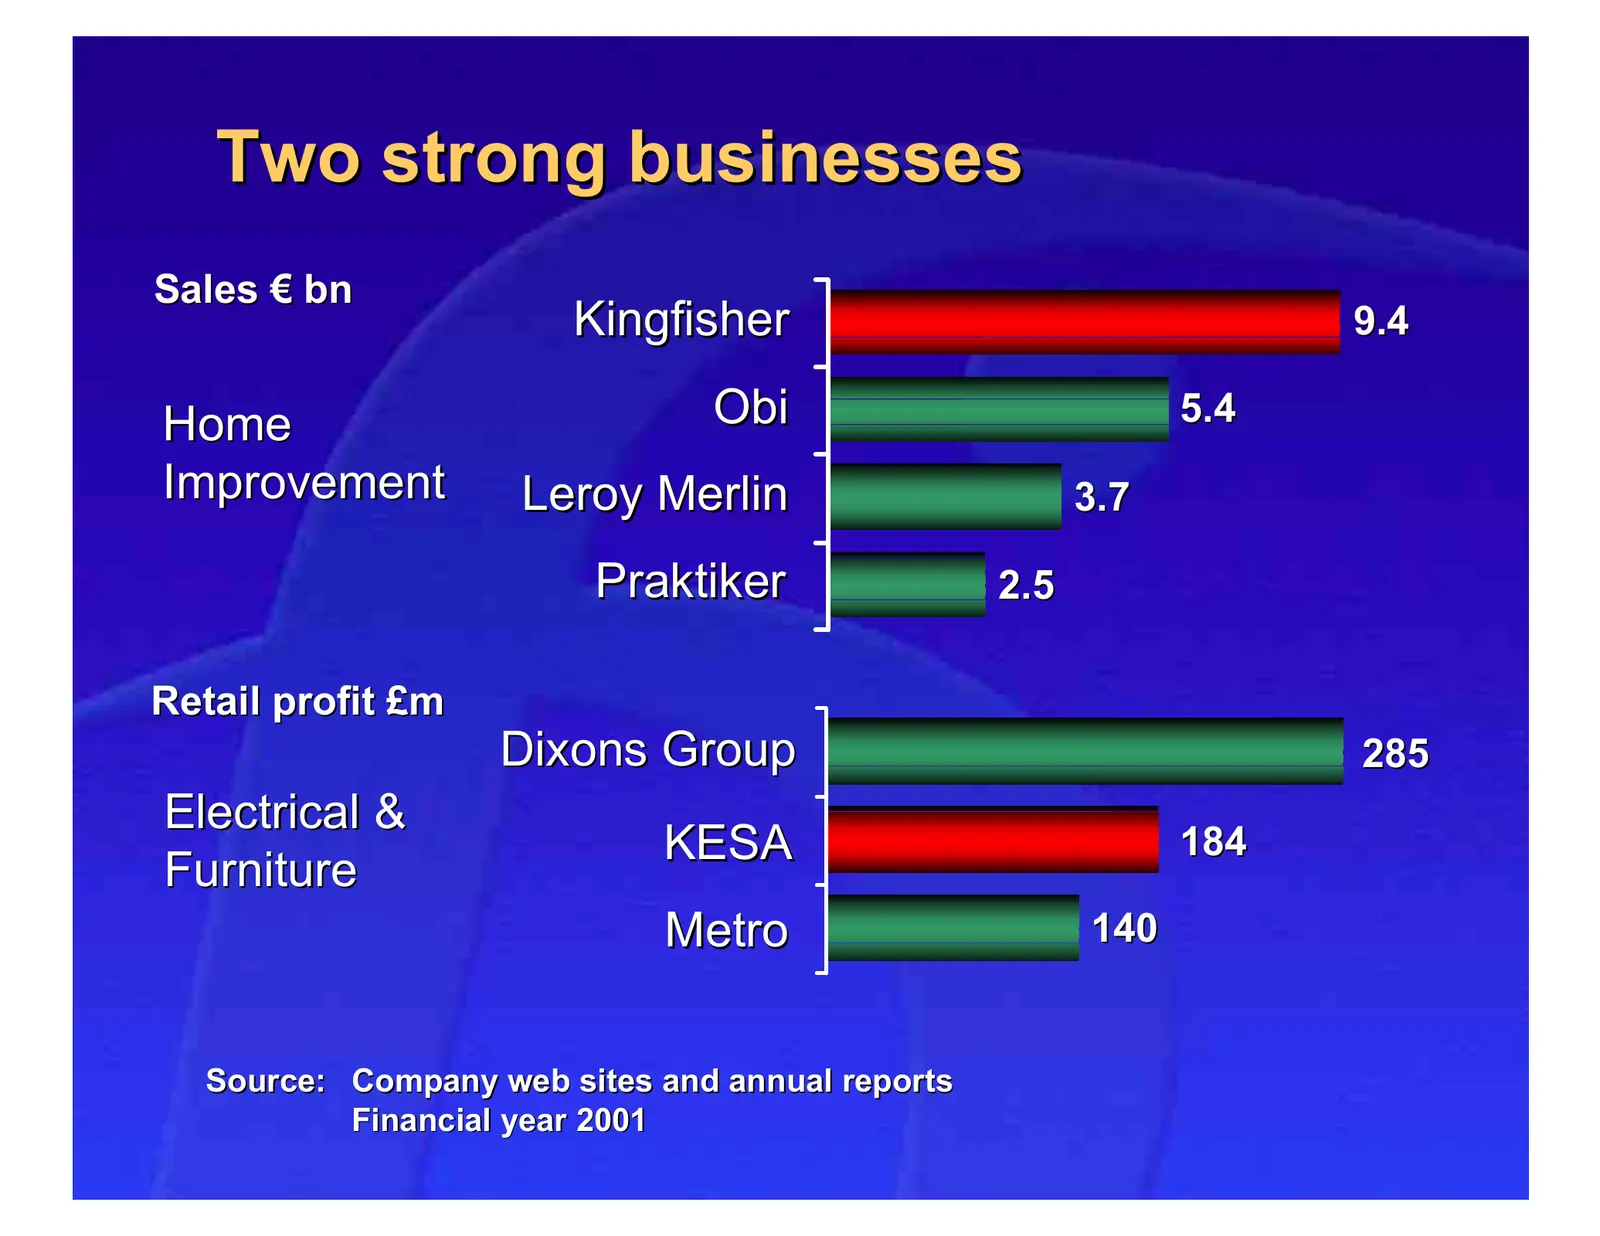
Two strong businesses Sales € bn Kingfisher 9.4 Home Obi 5.4 Improvement Leroy Merlin 3.7 Praktiker 2.5 Retail profit £m Dixons Group 285 Electrical & KESA 184 Furniture Metro 140 Source: Company web sites and annual reports Financial year 2001
Slide 6: Our plans for the future
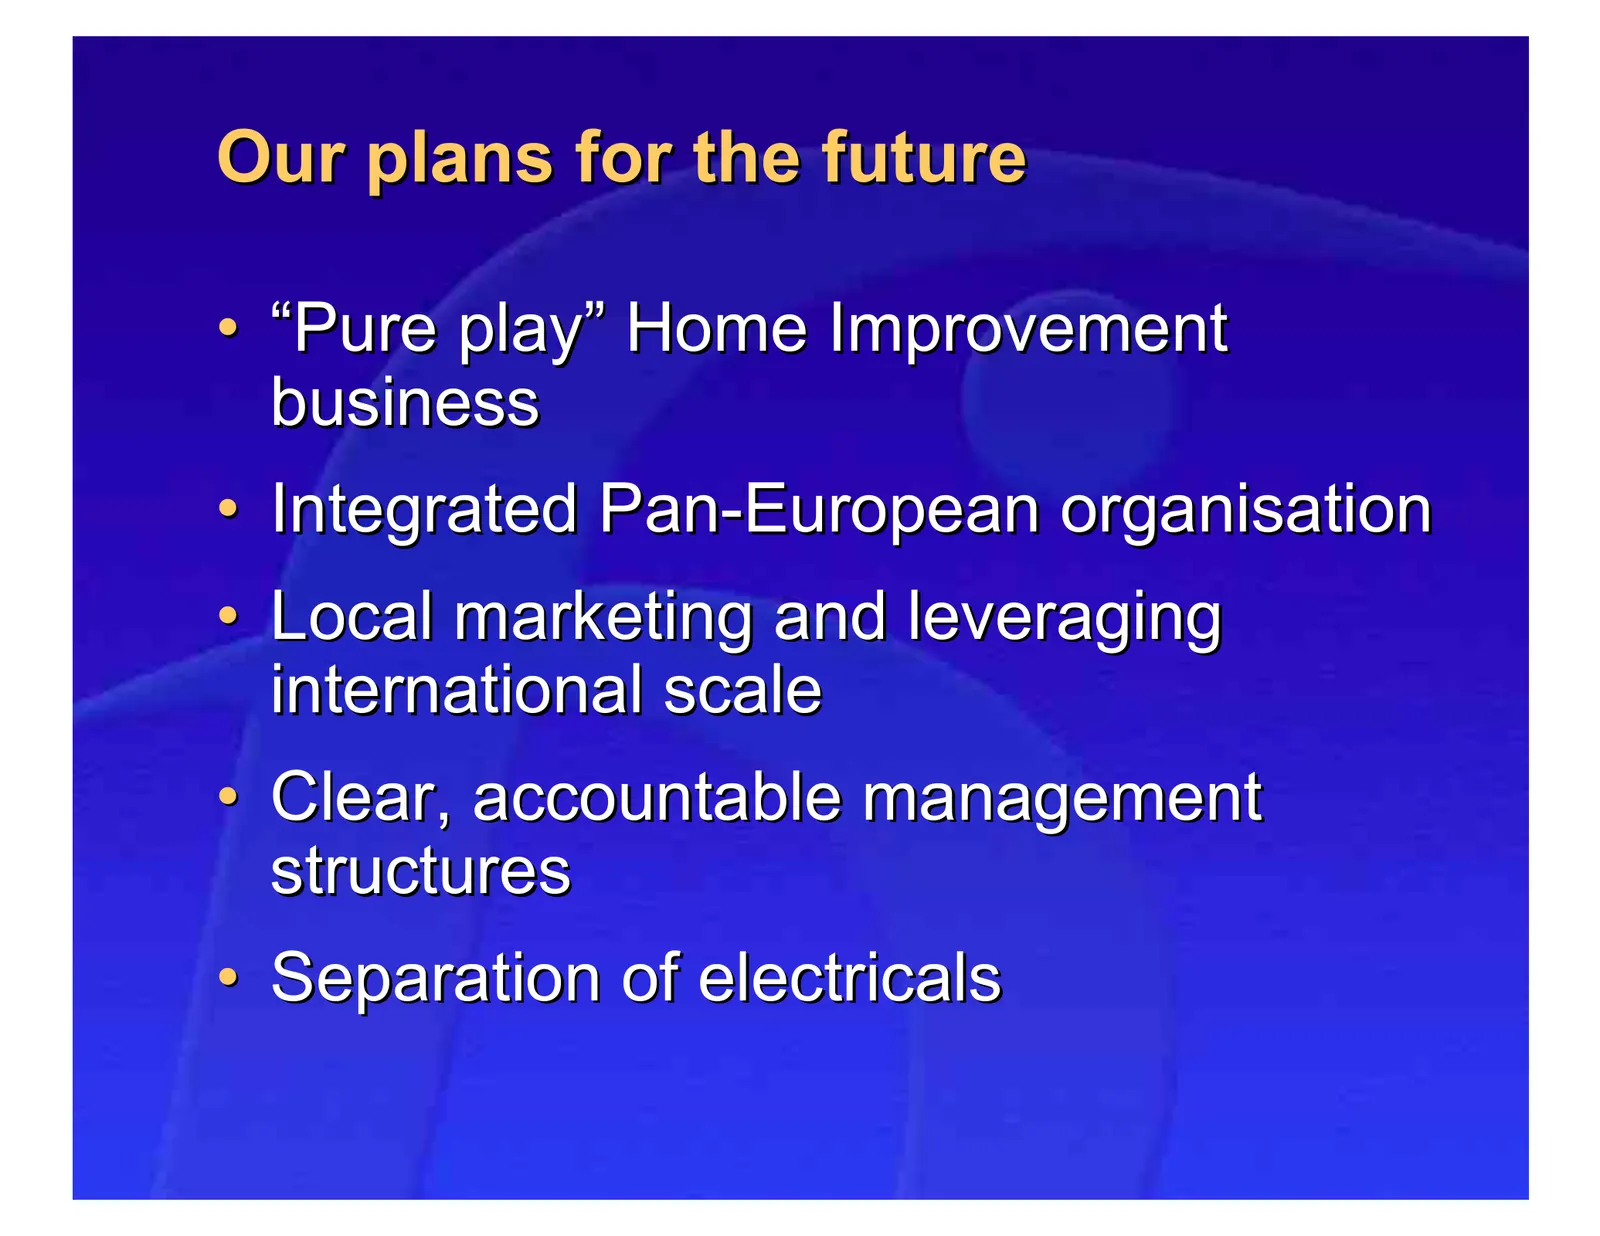
Our plans for the future • “Pure play” Home Improvement business • Integrated Pan-European organisation • Local marketing and leveraging international scale • Clear, accountable management structures • Separation of electricals
Slide 7: Management control achieved
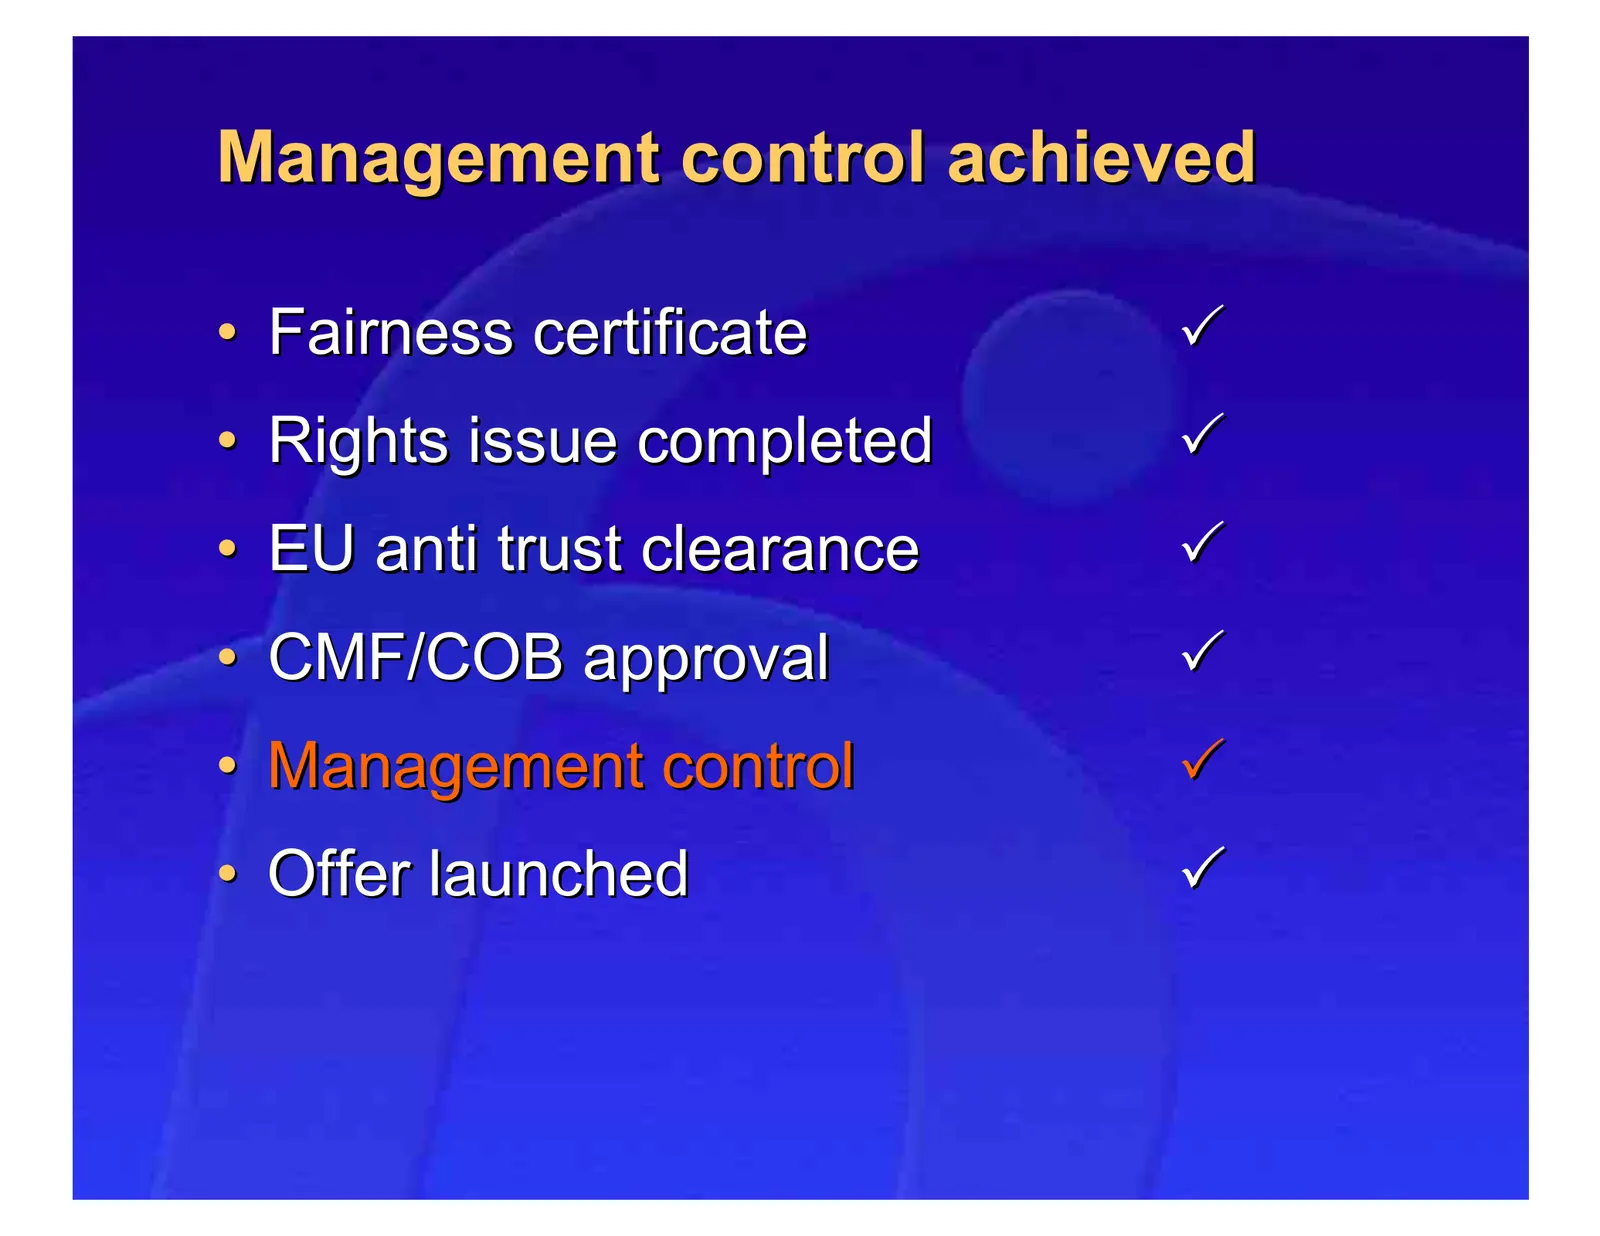
Management control achieved • Fairness certificate 3 • Rights issue completed 3 • EU anti trust clearance 3 • CMF/COB approval 3 • Management control 3 • Offer launched 3
Slide 8: Key milestones remaining
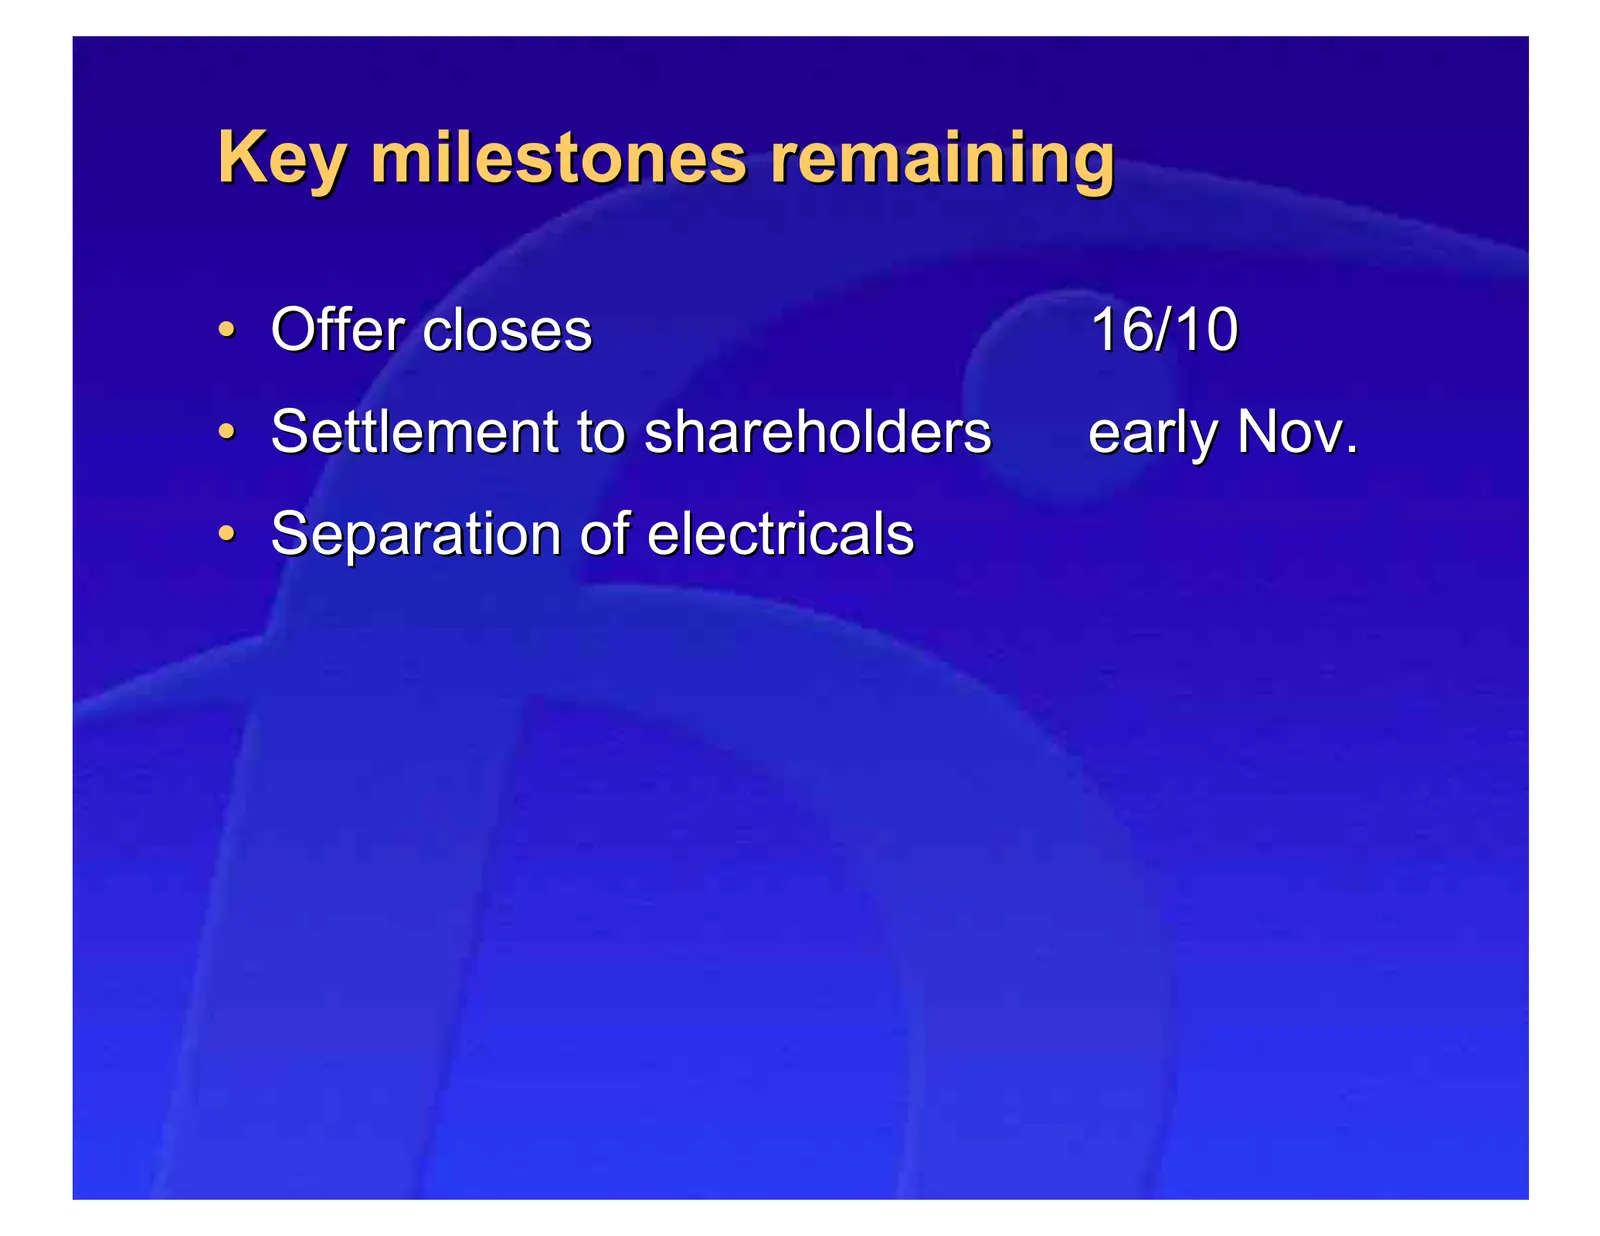
Key milestones remaining • Offer closes 16/10 • Settlement to shareholders early Nov. • Separation of electricals

Slide 9: Helen Weir, Finance Director
Helen Weir Finance Director
Slide 10: Financial Performance
Financial Performance • Overview • Performance Update • Financial results

Slide 11: Summary Financials
Summary Financials
Slide 12: Strong sales and retail profit growth
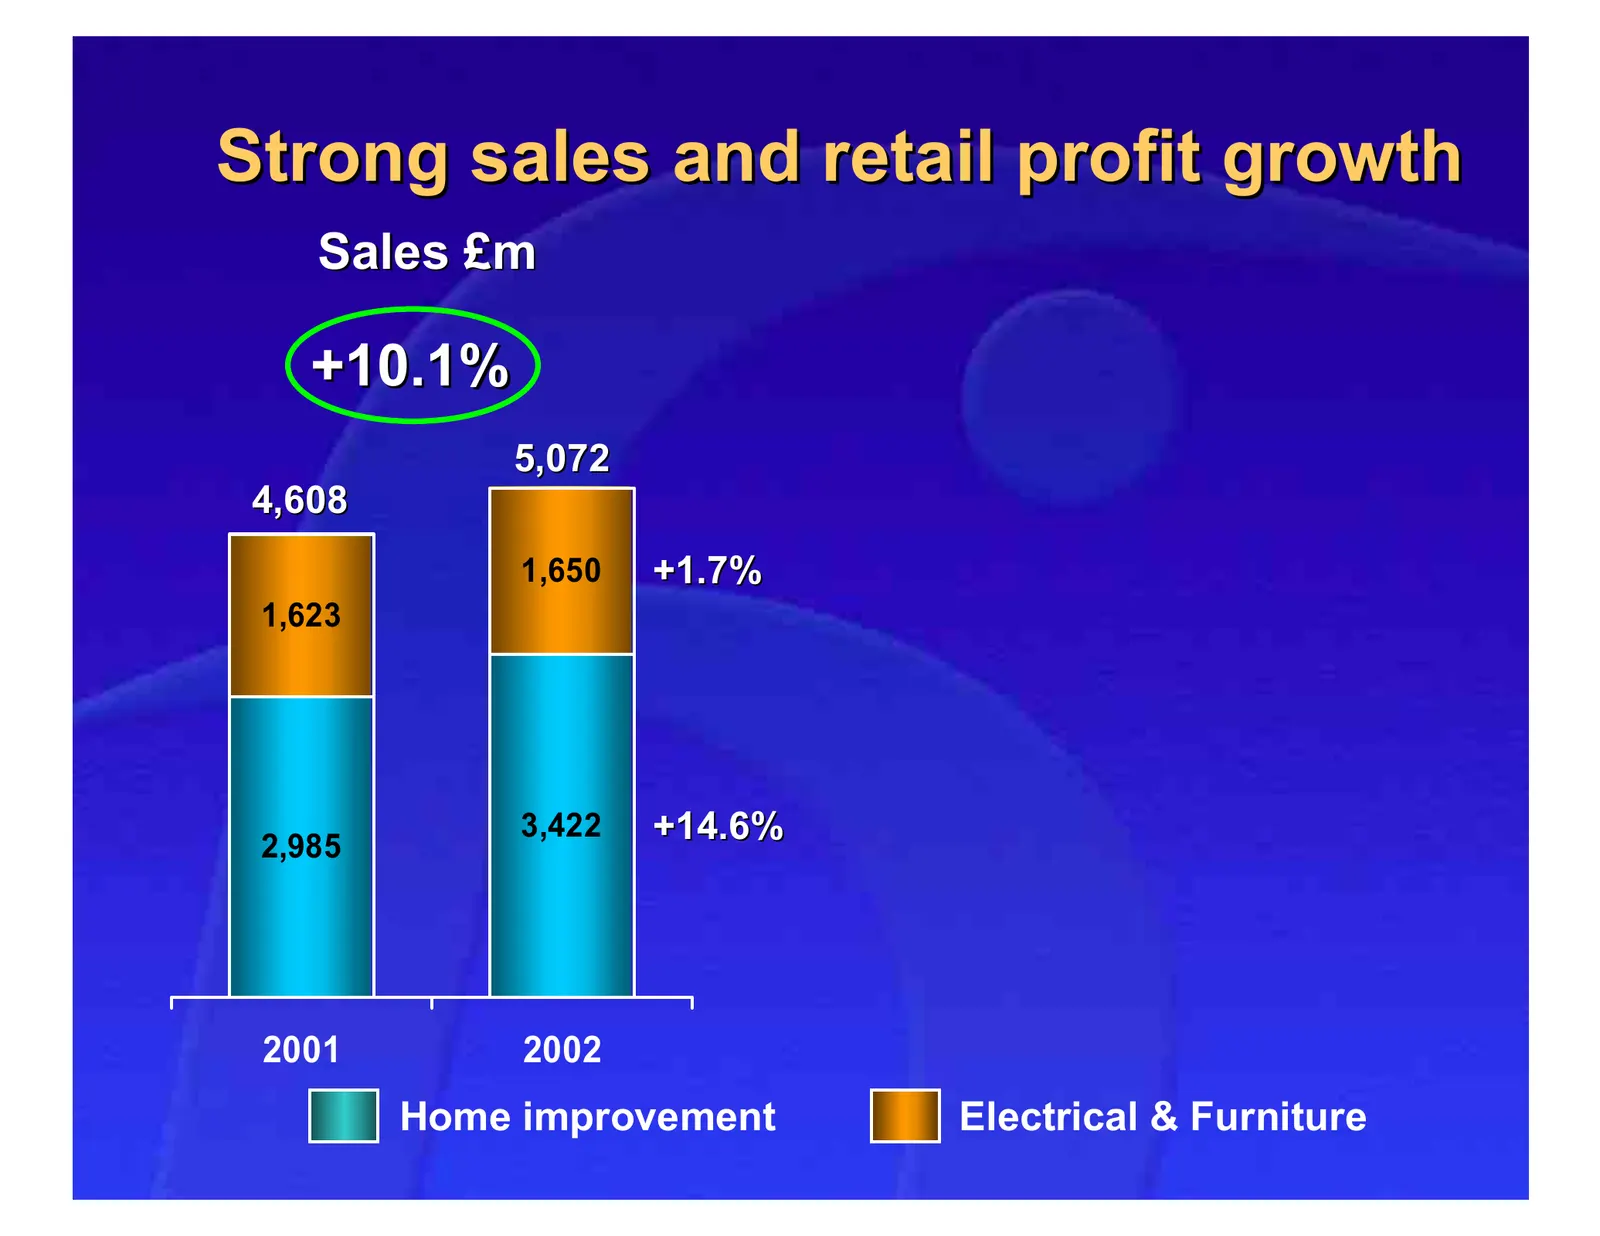
Strong sales and retail profit growth Sales £m +10.1% 5,072 4,608 1,650 +1.7% 1,623 2,985 3,422 +14.6% 2001 2002 Home improvement Electrical & Furniture
Slide 13: Strong sales and retail profit growth
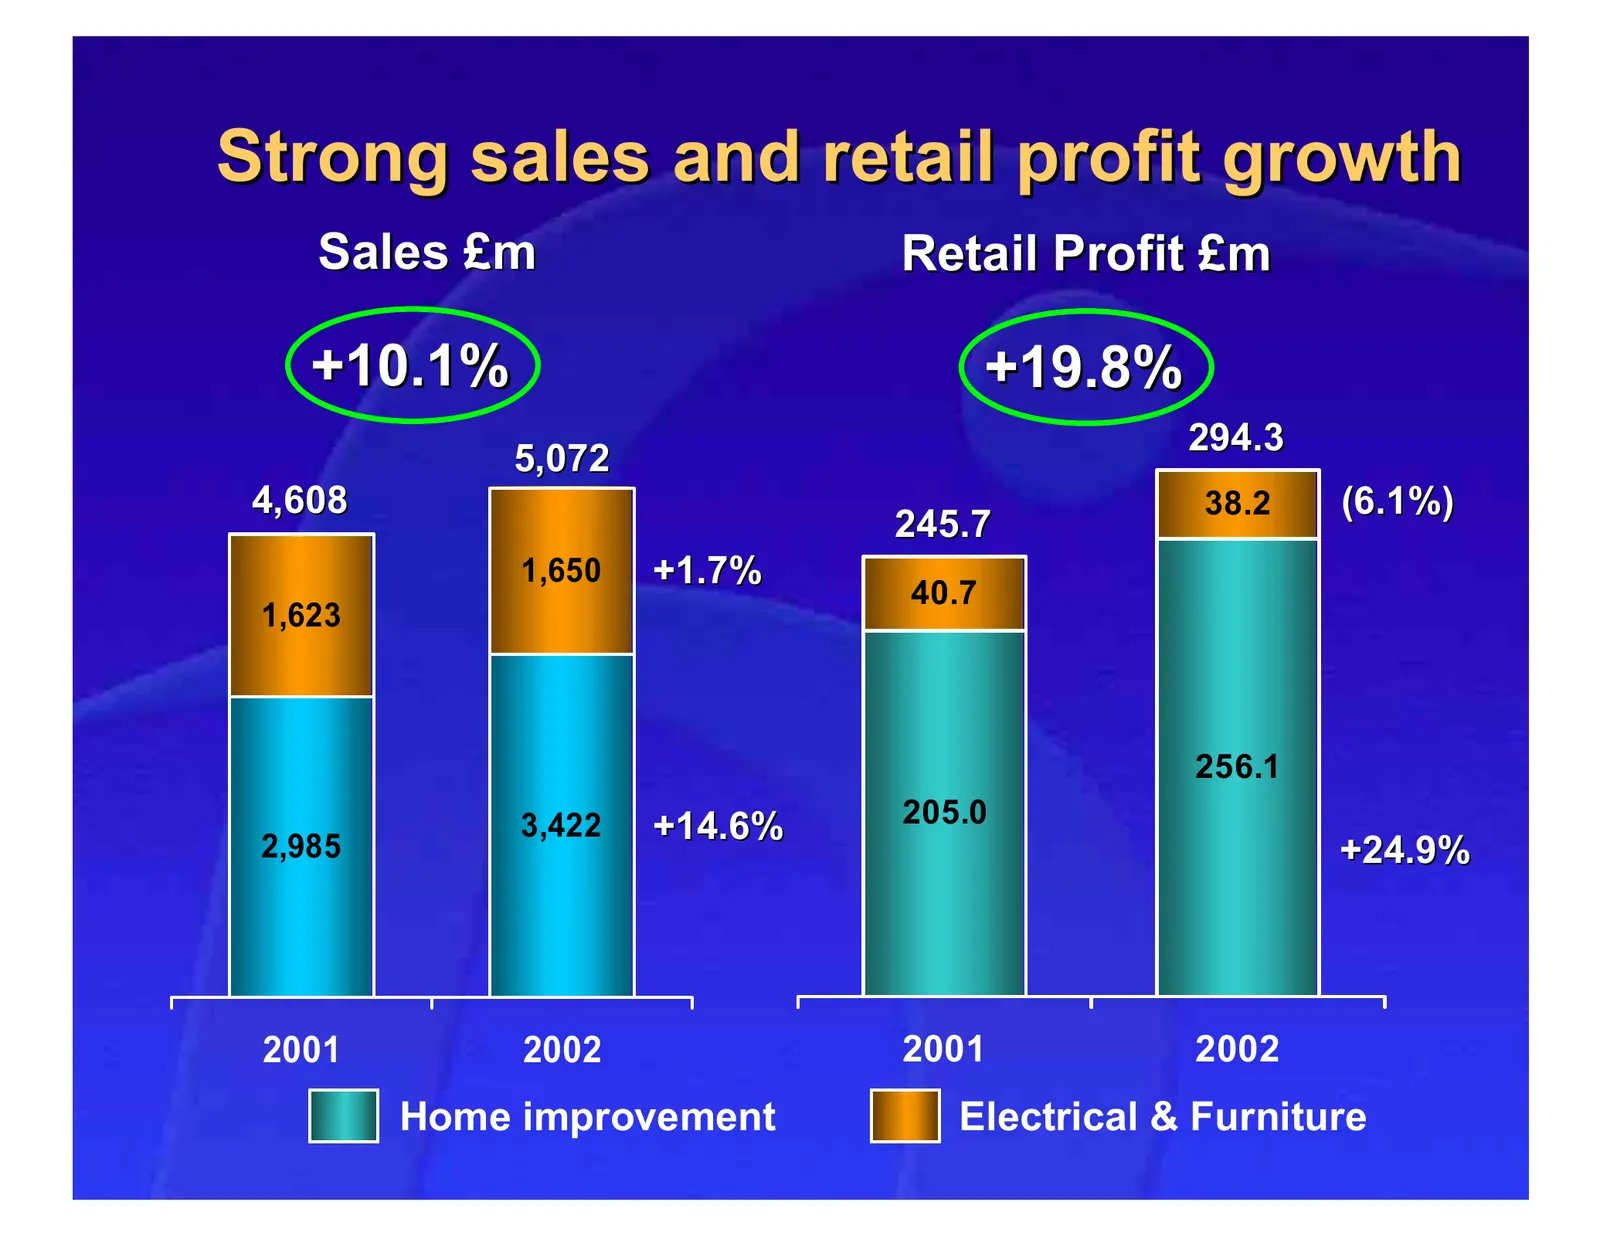
Strong sales and retail profit growth Sales £m Retail Profit £m +10.1% +19.8% 294.3 5,072 4,608 38.2 (6.1%) 245.7 1,650 +1.7% 40.7 1,623 256.1 3,422 +14.6% 205.0 2,985 +24.9% 2001 2002 2001 2002 Home improvement Electrical & Furniture
Slide 14: Profit before tax strongly ahead
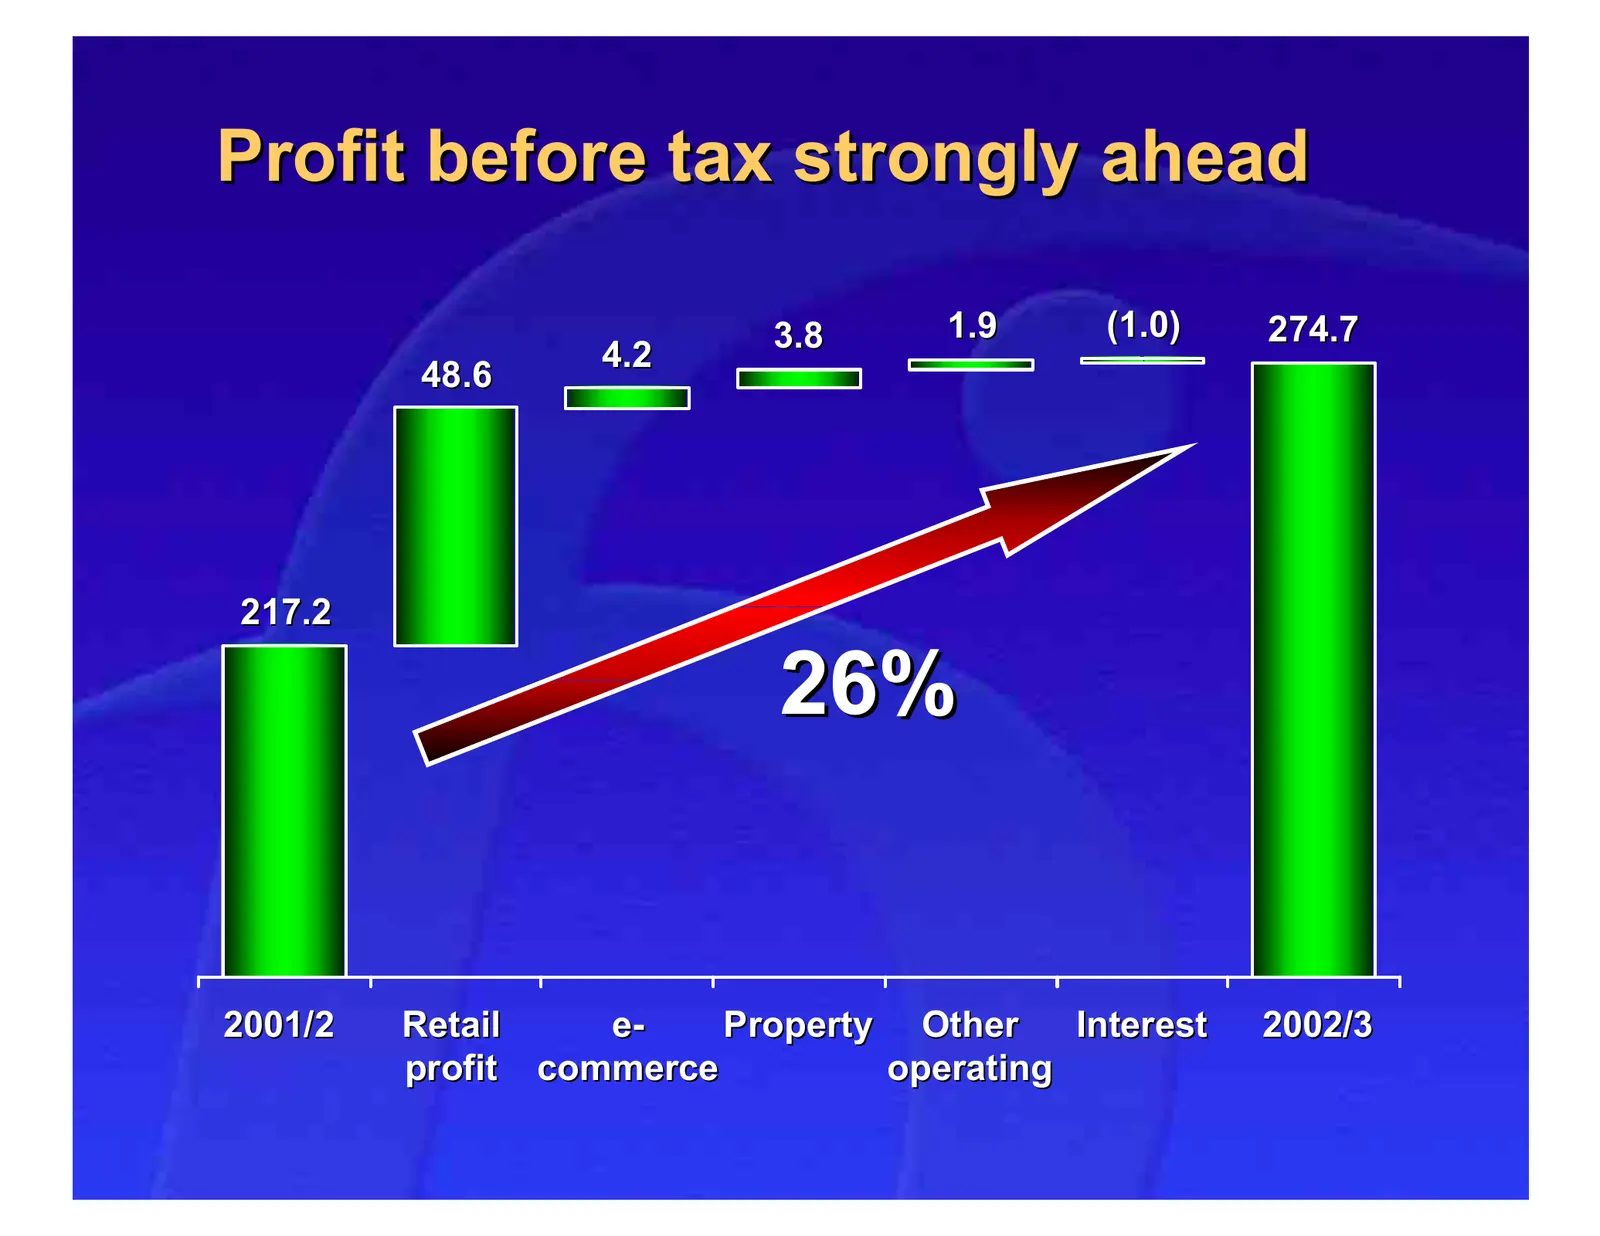
Profit before tax strongly ahead 3.8 1.9 (1.0) 274.7 4.2 48.6 217.2 26% 2001/2 Retail e- Property Other Interest 2002/3 profit commerce operating

Slide 15: Performance Update
Performance Update
Slide 16: Period of relatively lower market growth
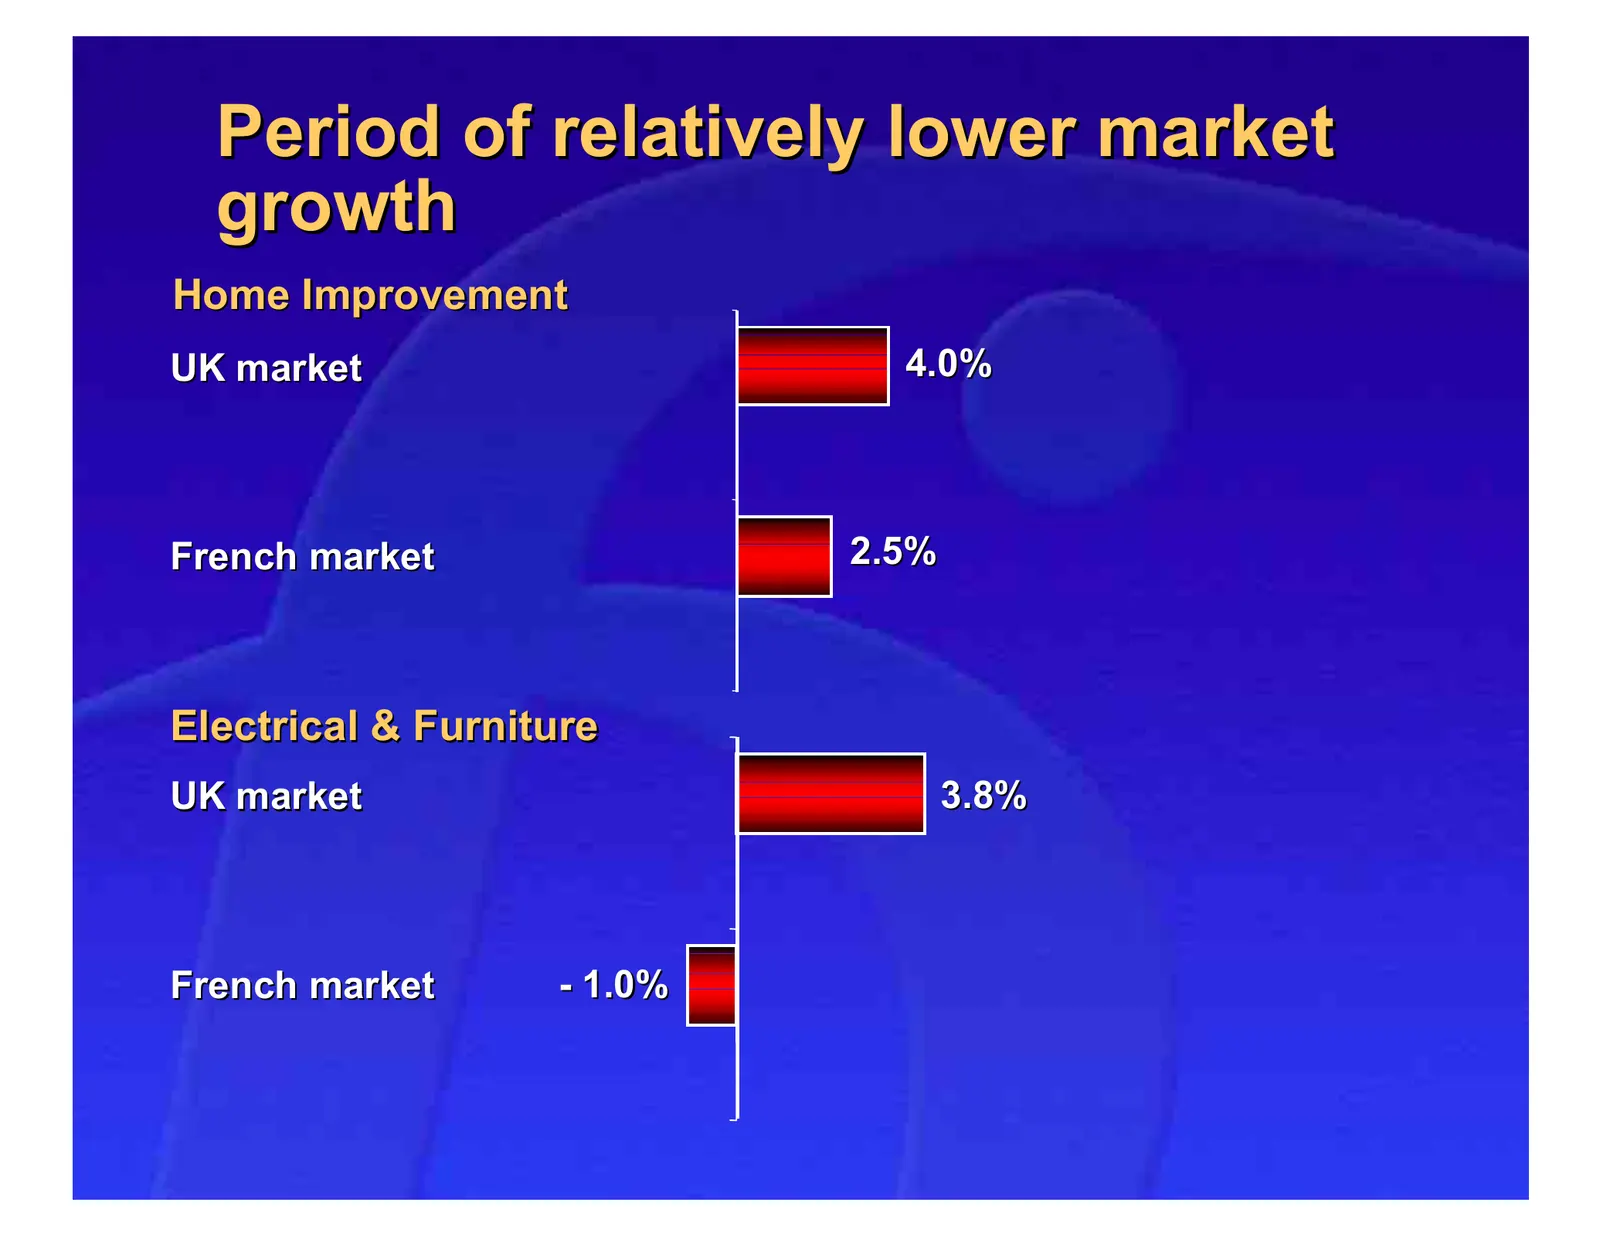
Period of relatively lower market growth Home Improvement UK market 4.0% French market 2.5% Electrical & Furniture UK market 3.8% French market - 1.0%
Slide 17: Powerful brands grew faster than the market
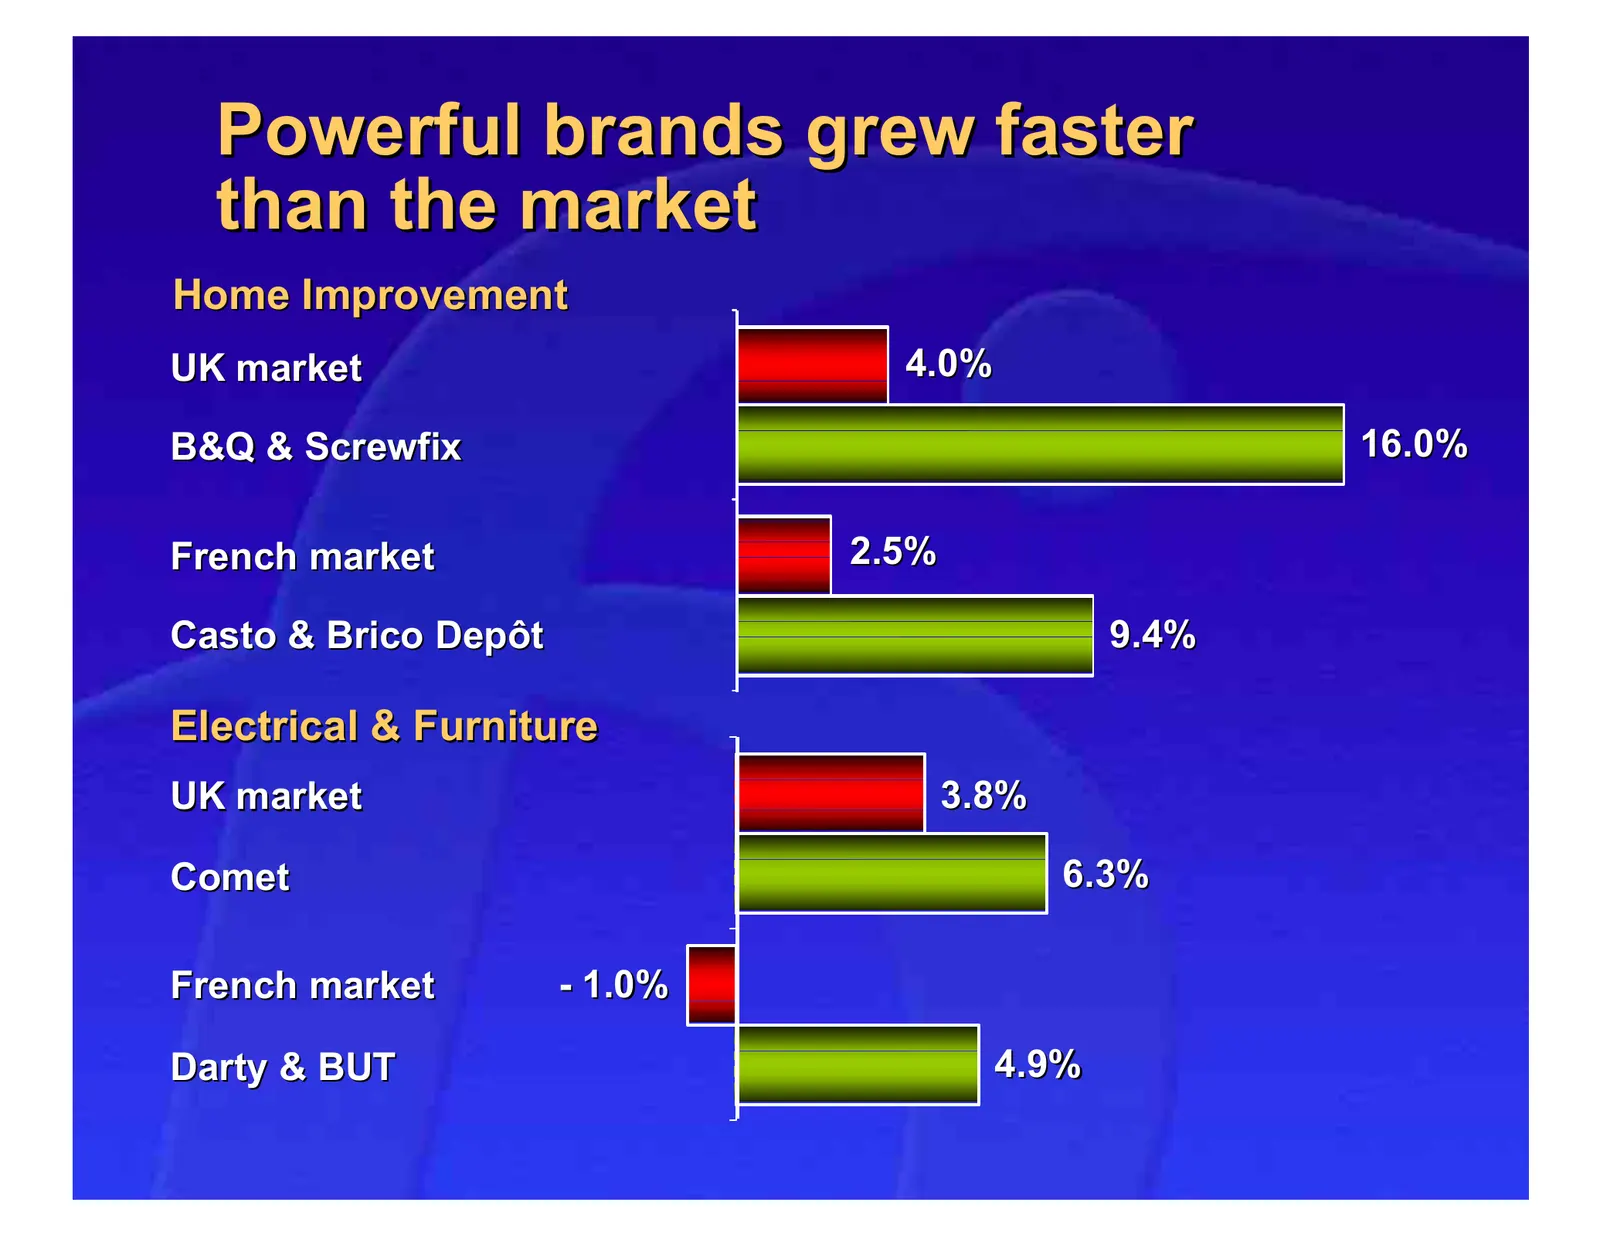
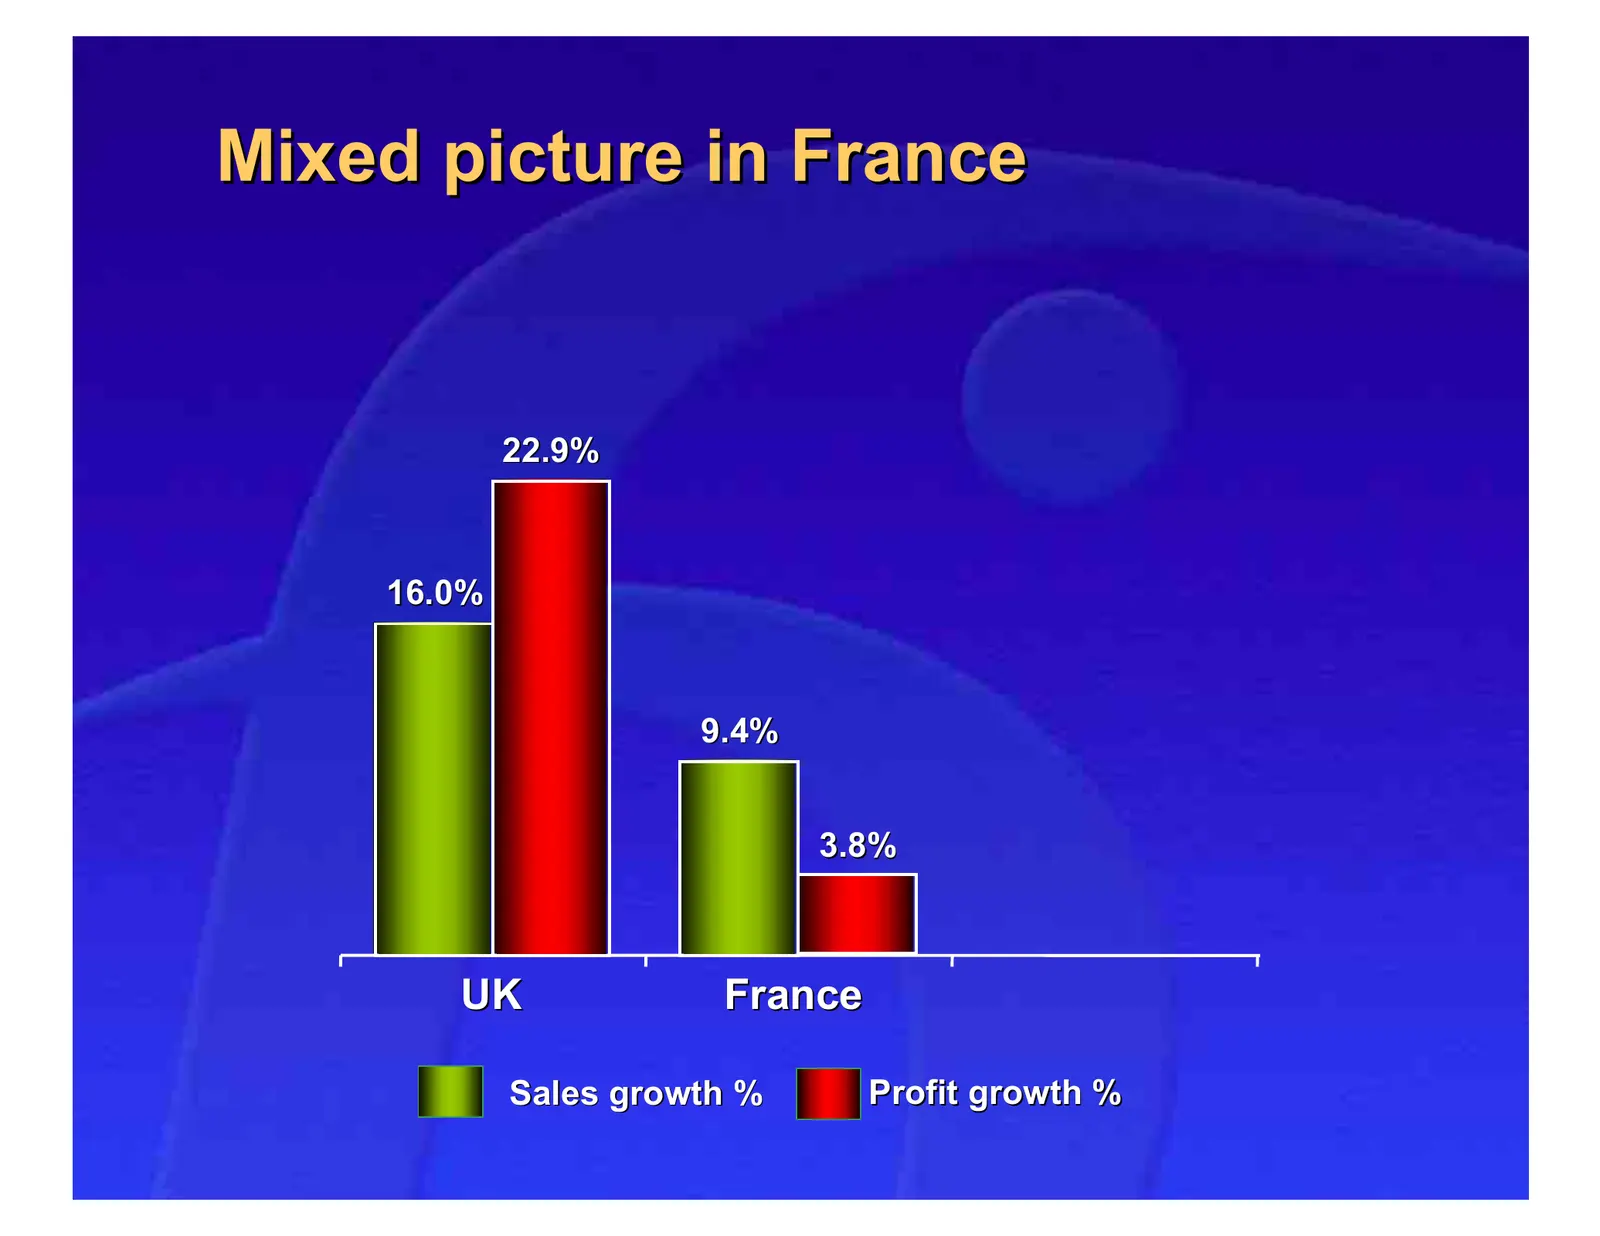
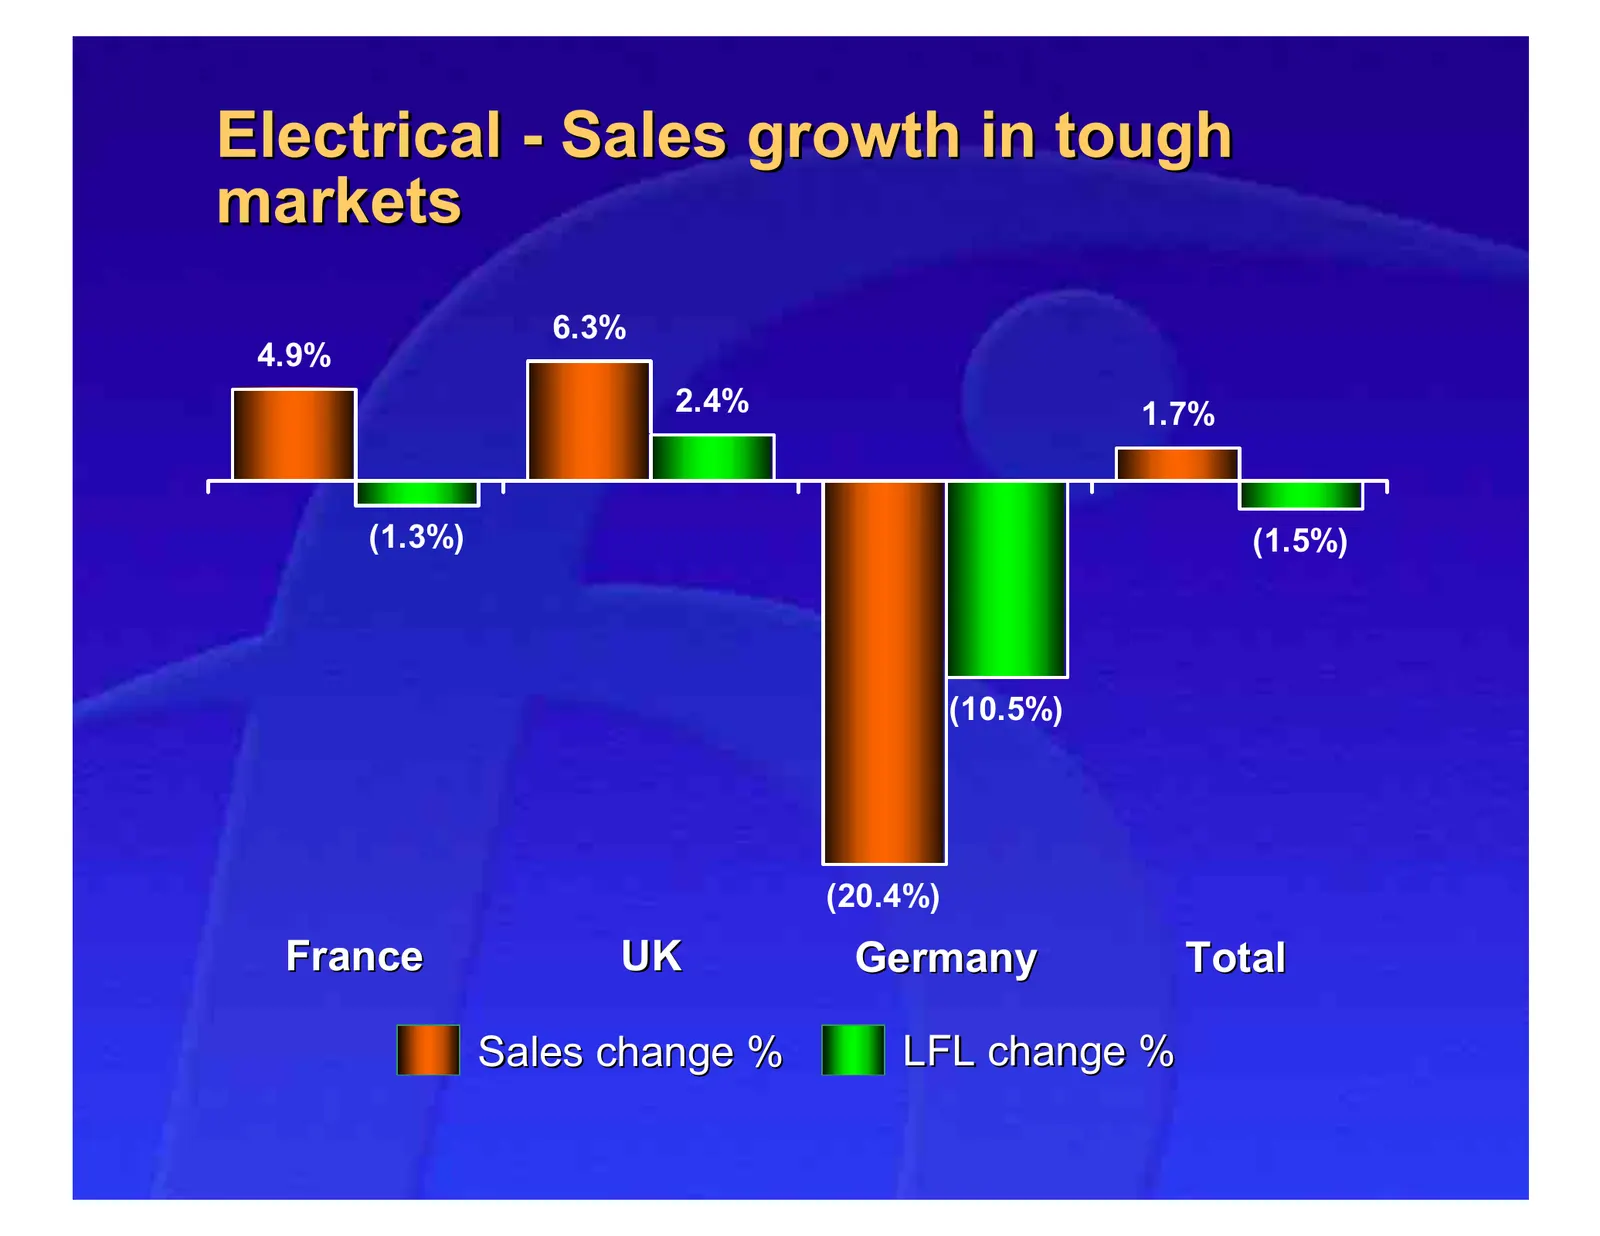
Powerful brands grew faster than the market Home Improvement UK market 4.0% B&Q & Screwfix 16.0% French market 2.5% Casto & Brico Depôt 9.4% Electrical & Furniture UK market 3.8% Comet 6.3% French market - 1.0% Darty & BUT 4.9%
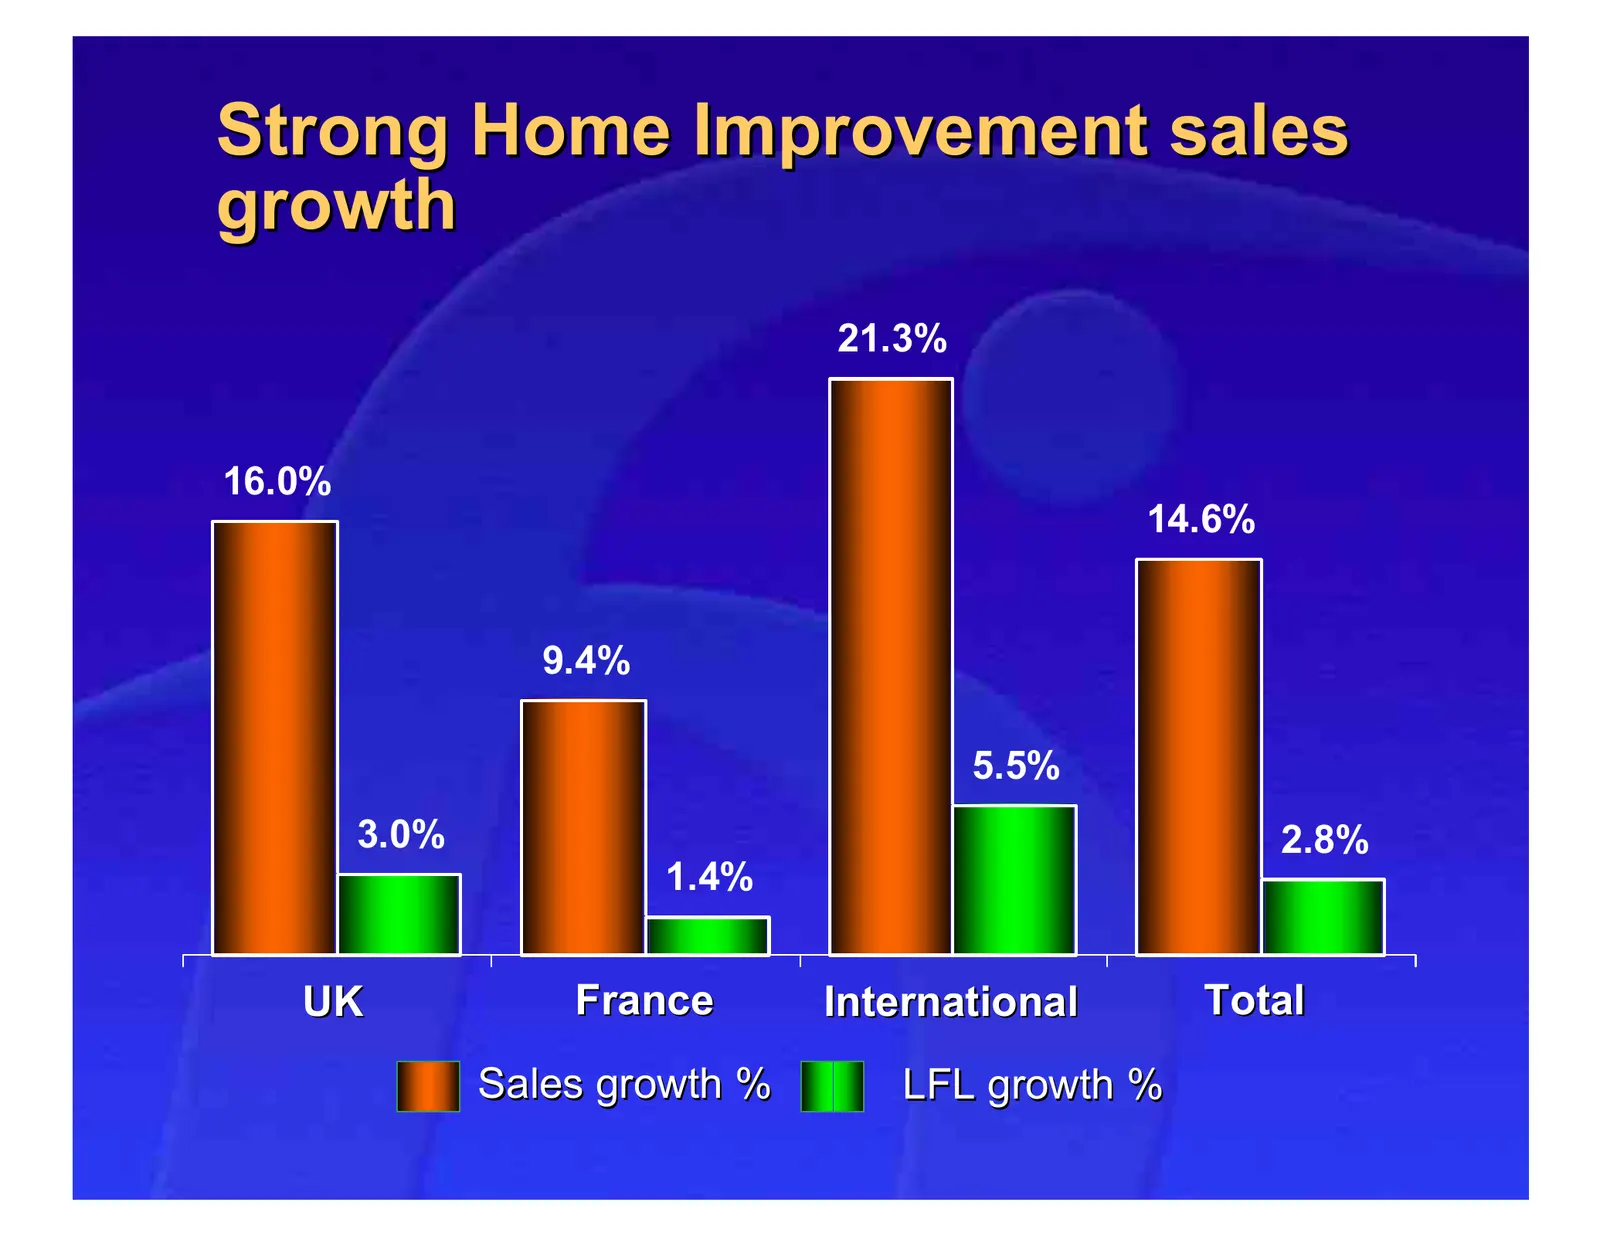
Slide 18: Strong Home Improvement sales growth
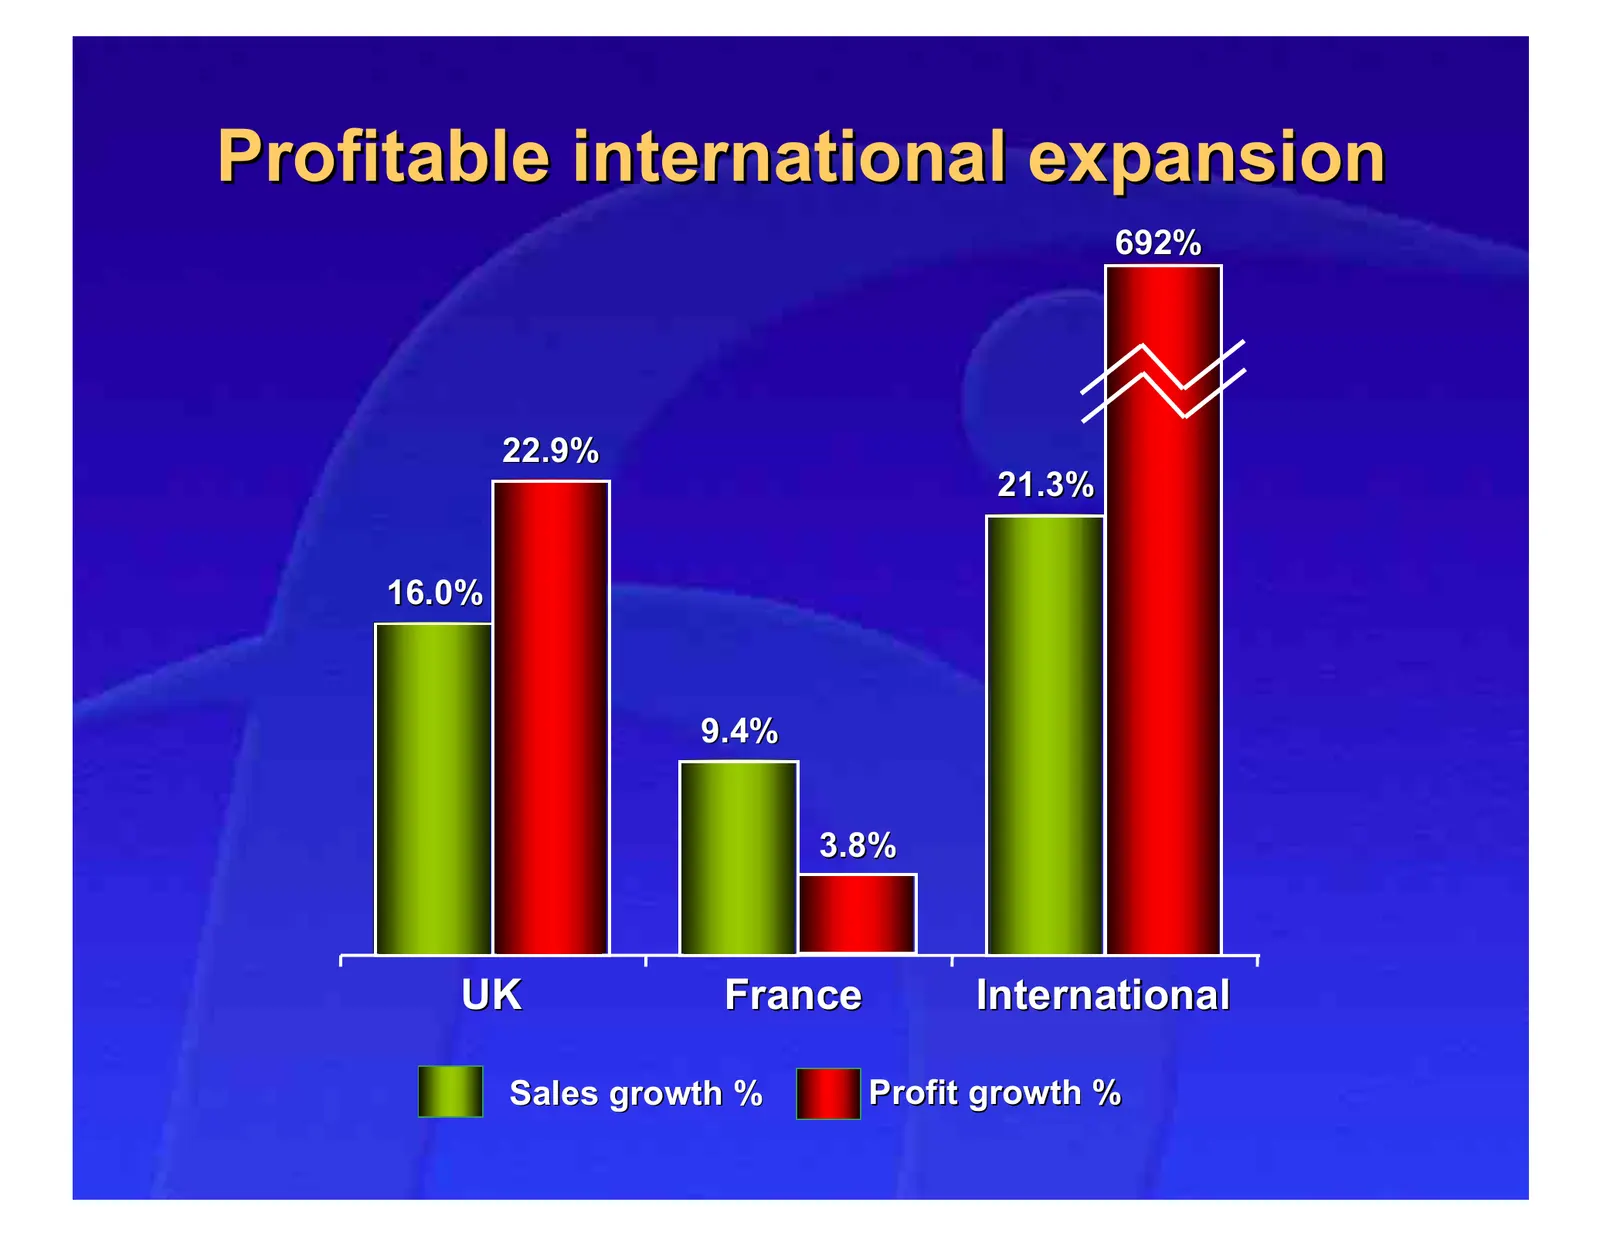
Strong Home Improvement sales growth 21.3% 16.0% 14.6% 9.4% 5.5% 3.0% 2.8% 1.4% UK France International Total Sales growth % LFL growth %
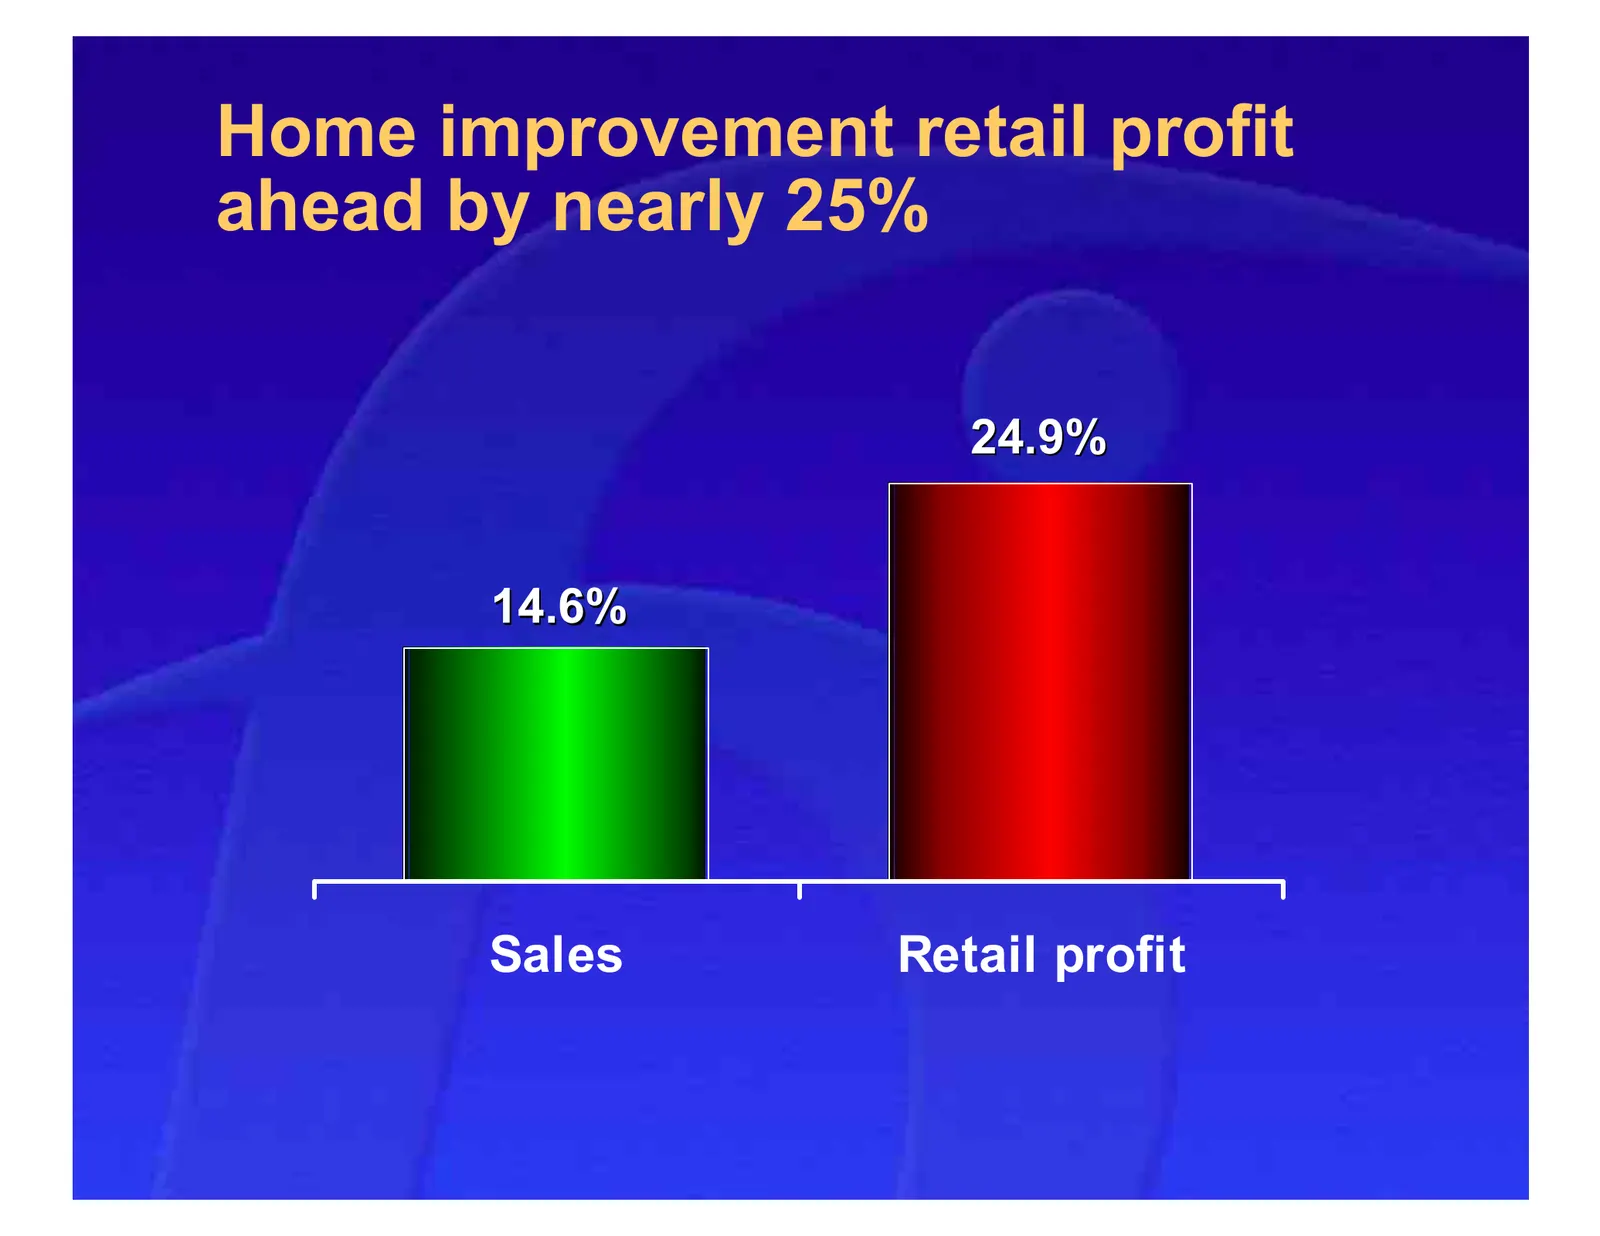
Slide 19: Home improvement retail profit ahead by nearly 25%
Home improvement retail profit ahead by nearly 25% 24.9% 14.6% Sales Retail profit
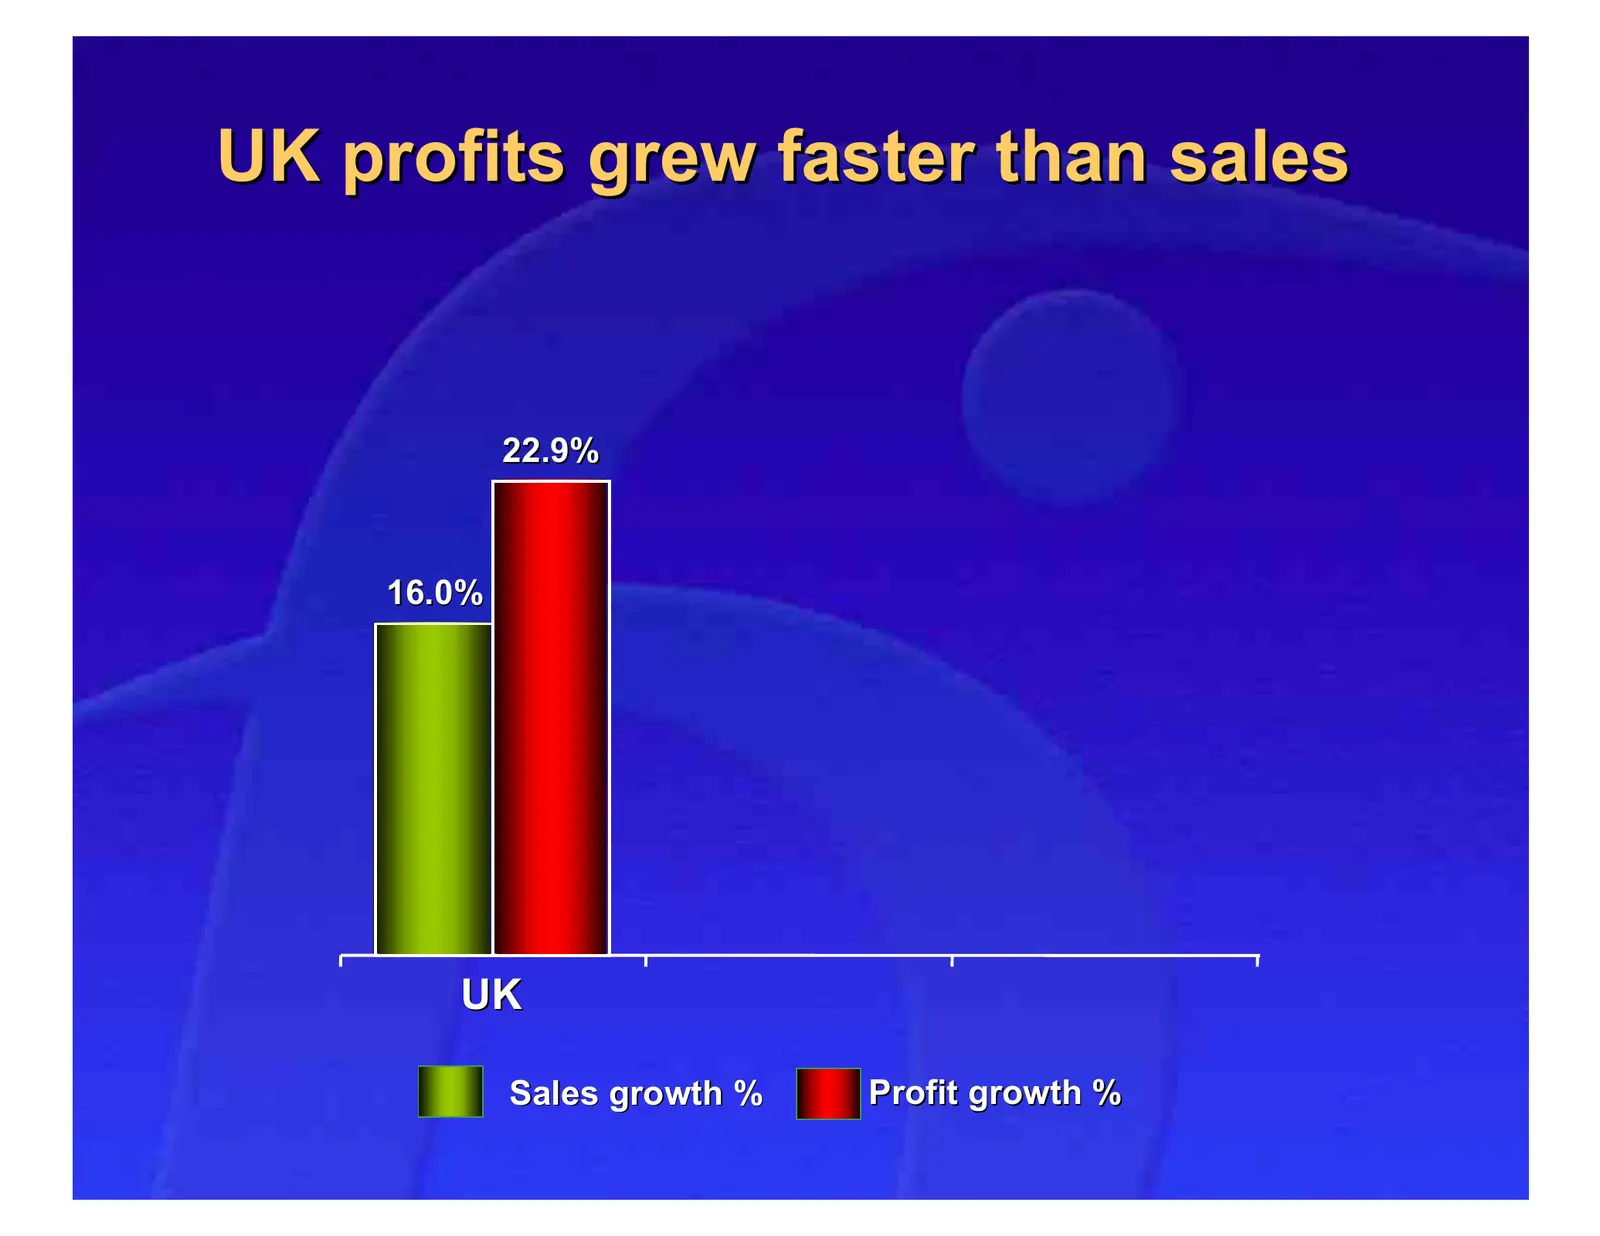
Slide 20: UK profits grew faster than sales
UK profits grew faster than sales 22.9% 16.0% UK Sales growth % Profit growth %
Slide 21
Slide 22: Mixed picture in France
Mixed picture in France 22.9% 16.0% 9.4% 3.8% UK France Sales growth % Profit growth %
Slide 23: Profitable international expansion
Profitable international expansion 692% 22.9% 21.3% 16.0% 9.4% 3.8% UK France International Sales growth % Profit growth %
Slide 24: Electrical - Sales growth in tough markets
Electrical - Sales growth in tough markets 6.3% 4.9% 2.4% 1.7% (1.3%) (1.5%) (10.5%) (20.4%) France UK Germany Total Sales change % LFL change %
Slide 25: Small retail profit decline in France
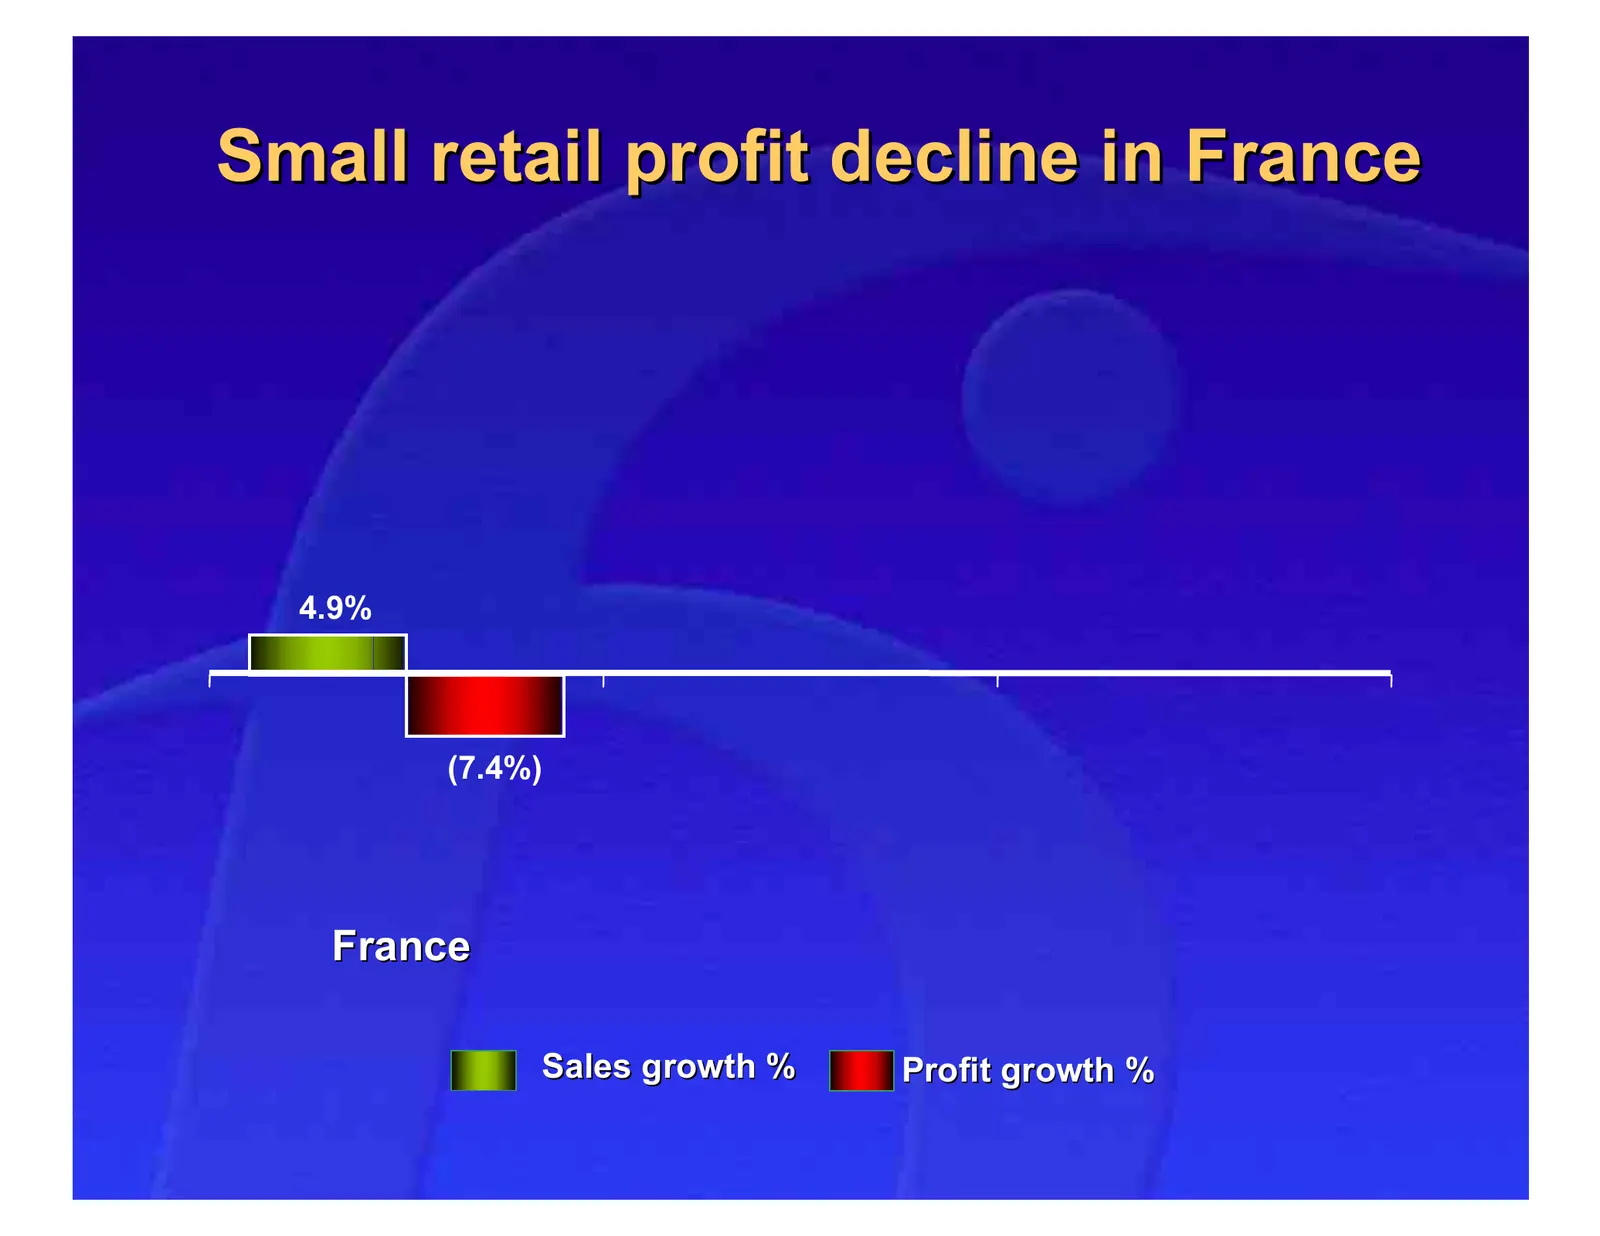
Small retail profit decline in France 4.9% (7.4%) France Sales growth % Profit growth %
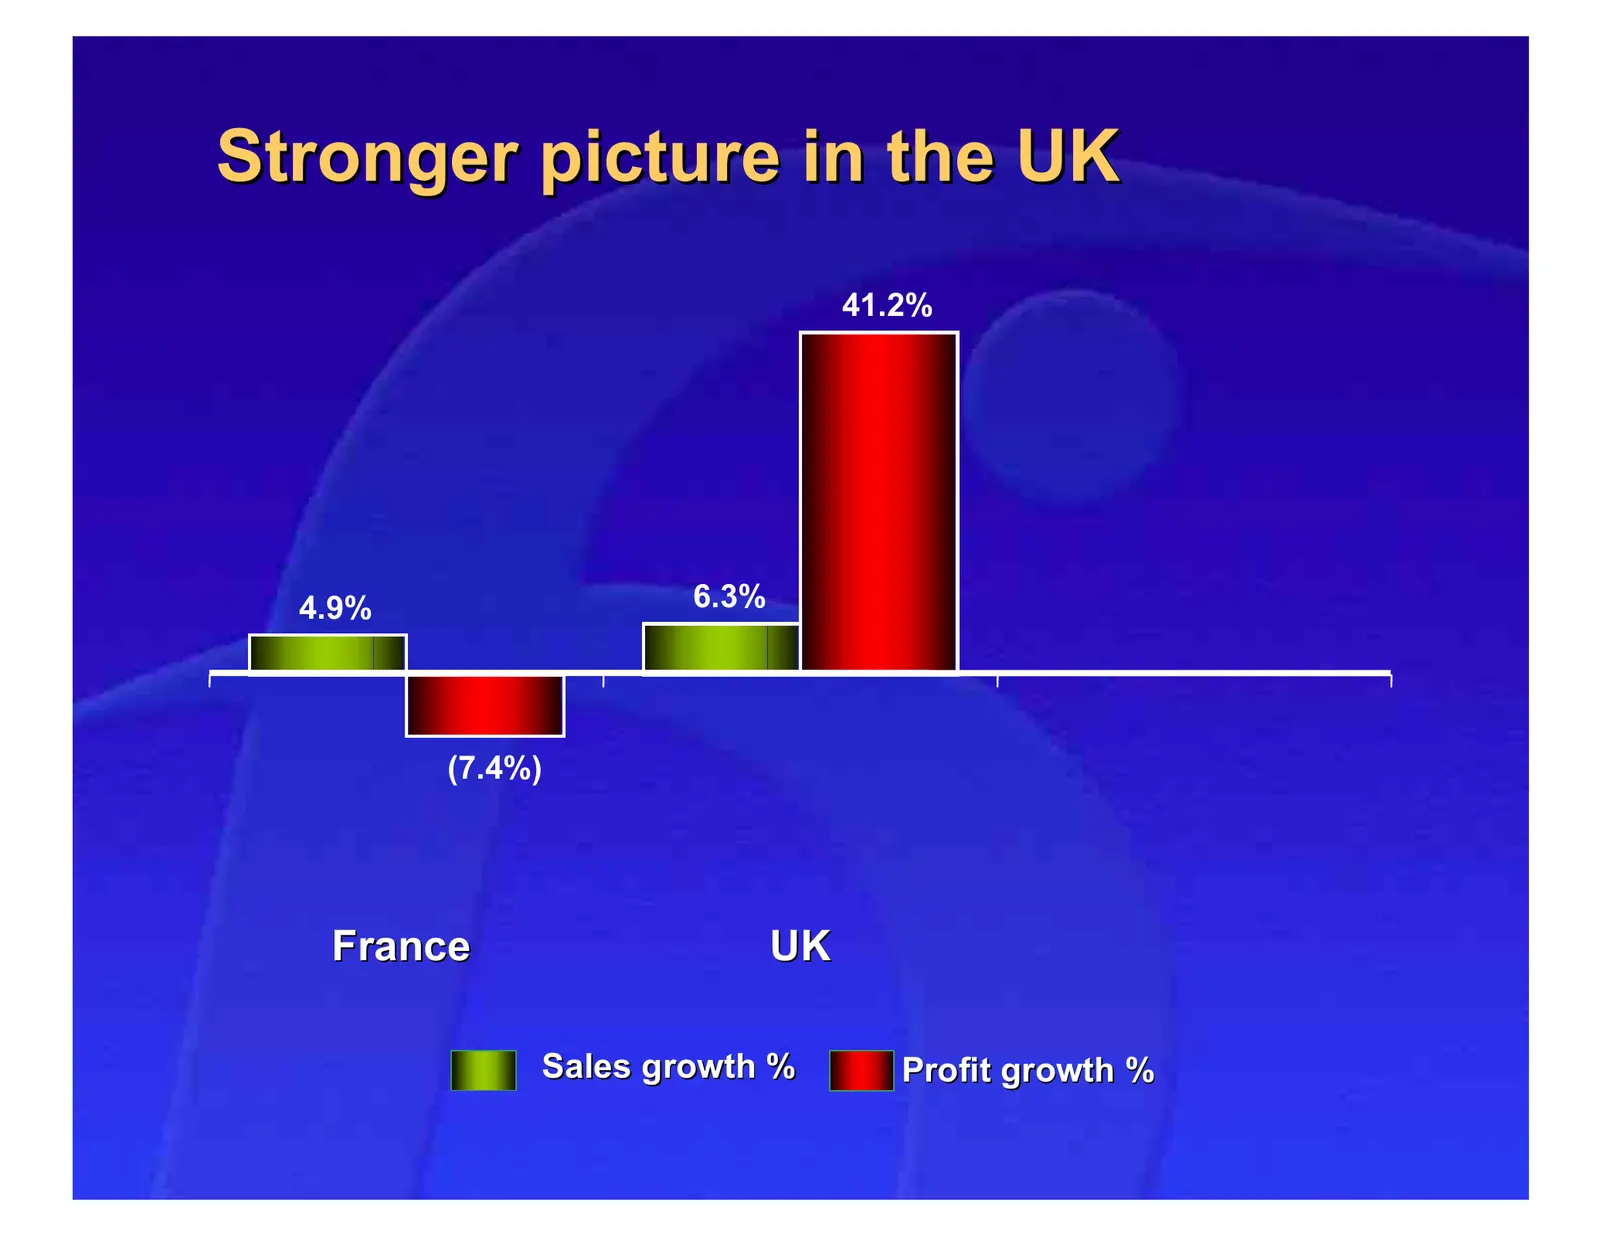
Slide 26: Stronger picture in the UK
Stronger picture in the UK 41.2% 4.9% 6.3% (7.4%) France UK Sales growth % Profit growth %
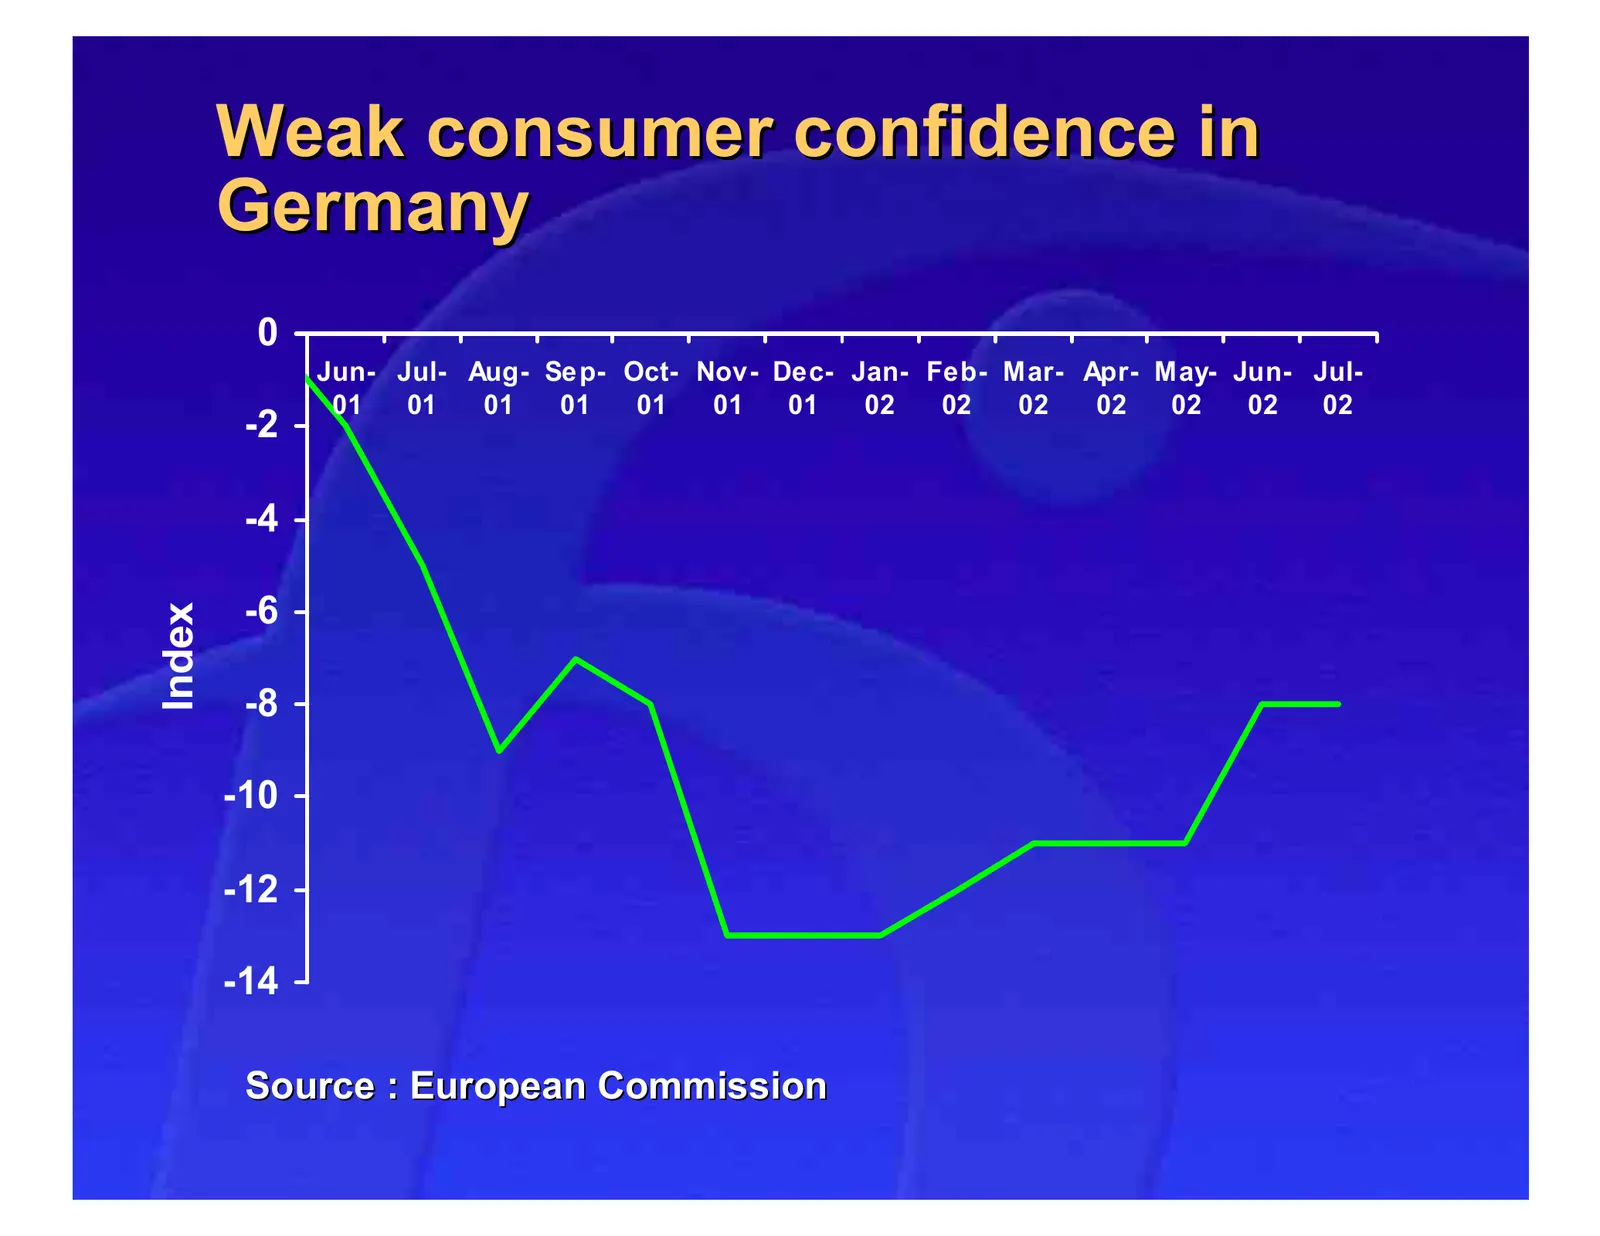
Slide 27: Weak consumer confidence in Germany
Weak consumer confidence in Germany 0 Jun- Jul- Aug- Sep- Oct- Nov- Dec- Jan- Feb- Mar- Apr- May- Jun- Jul- 01 01 01 01 01 01 01 02 02 02 02 02 02 02 -2 -4 -6 Index -8 -10 -12 -14 Source : European Commission
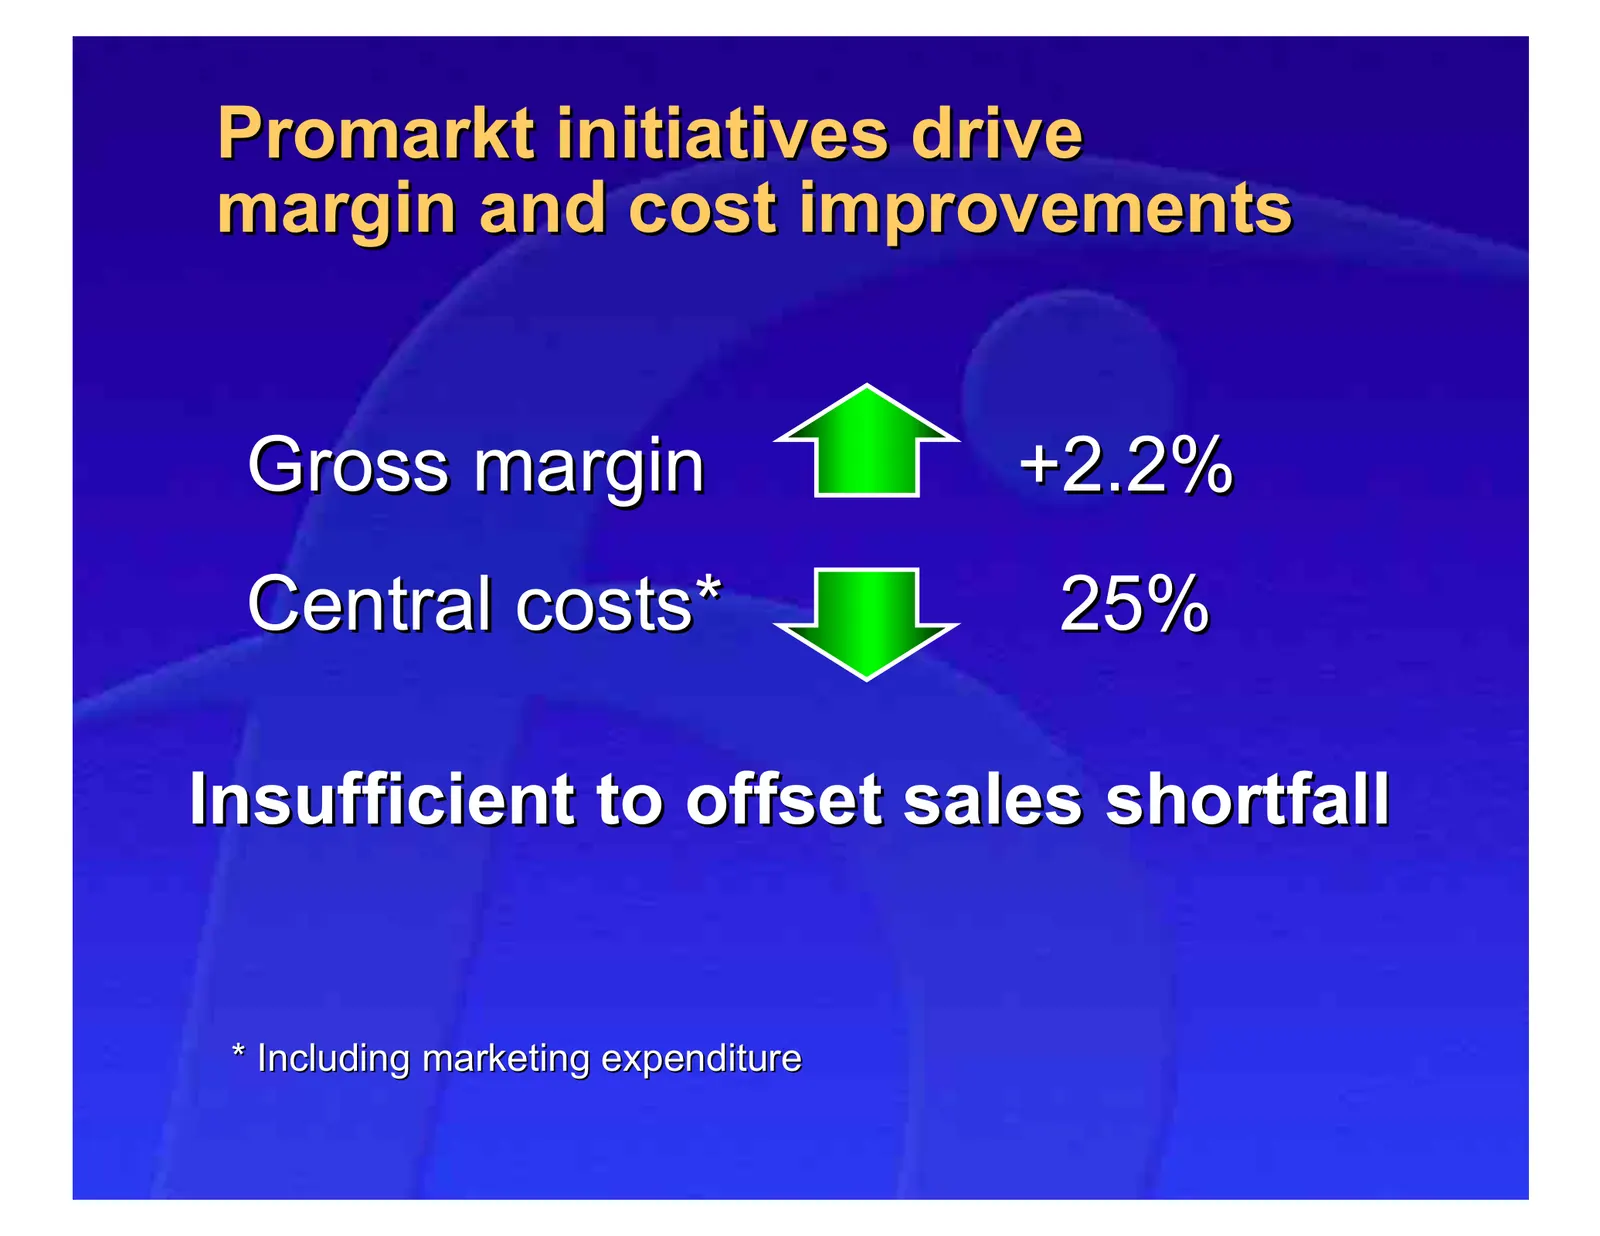
Slide 28: Promarkt initiatives drive margin and cost improvements
Promarkt initiatives drive margin and cost improvements Gross margin +2.2% Central costs* 25% Insufficient to offset sales shortfall * Including marketing expenditure
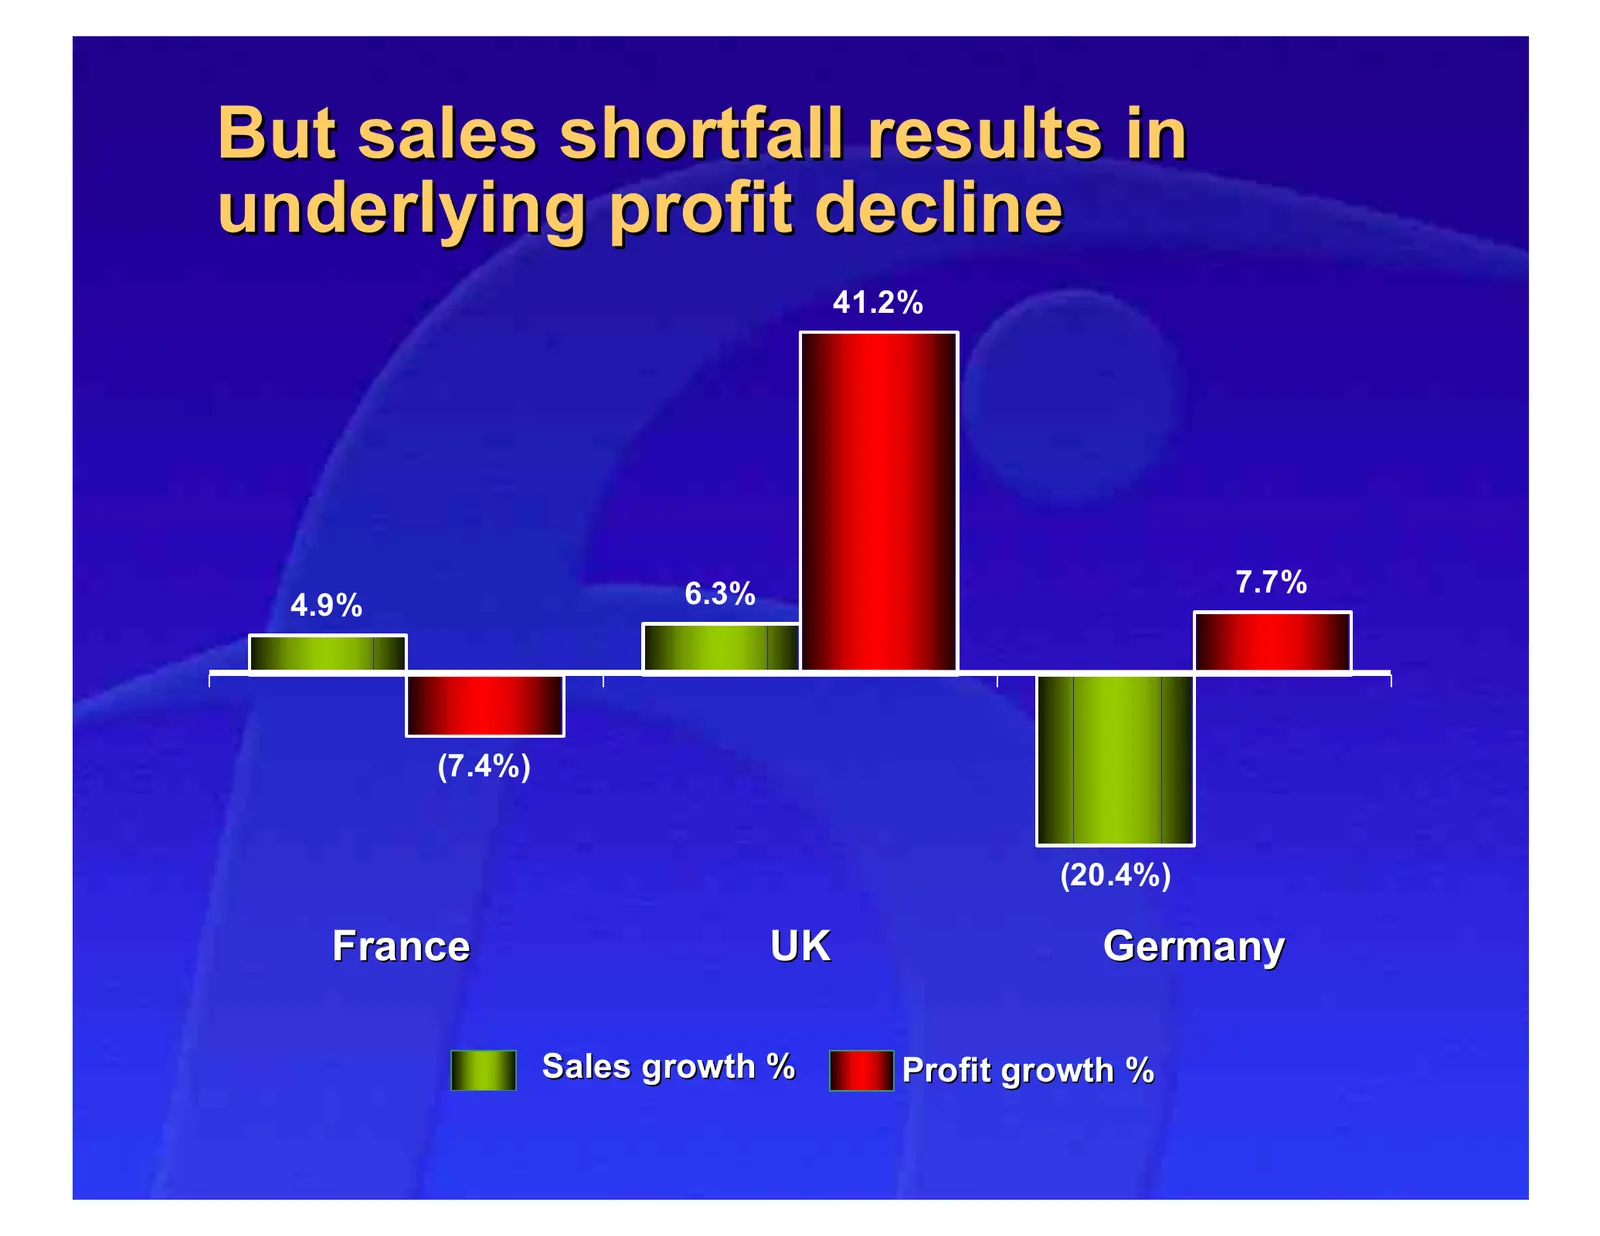
Slide 29: But sales shortfall results in underlying profit decline
But sales shortfall results in underlying profit decline 41.2% 6.3% 7.7% 4.9% (7.4%) (20.4%) France UK Germany Sales growth % Profit growth %
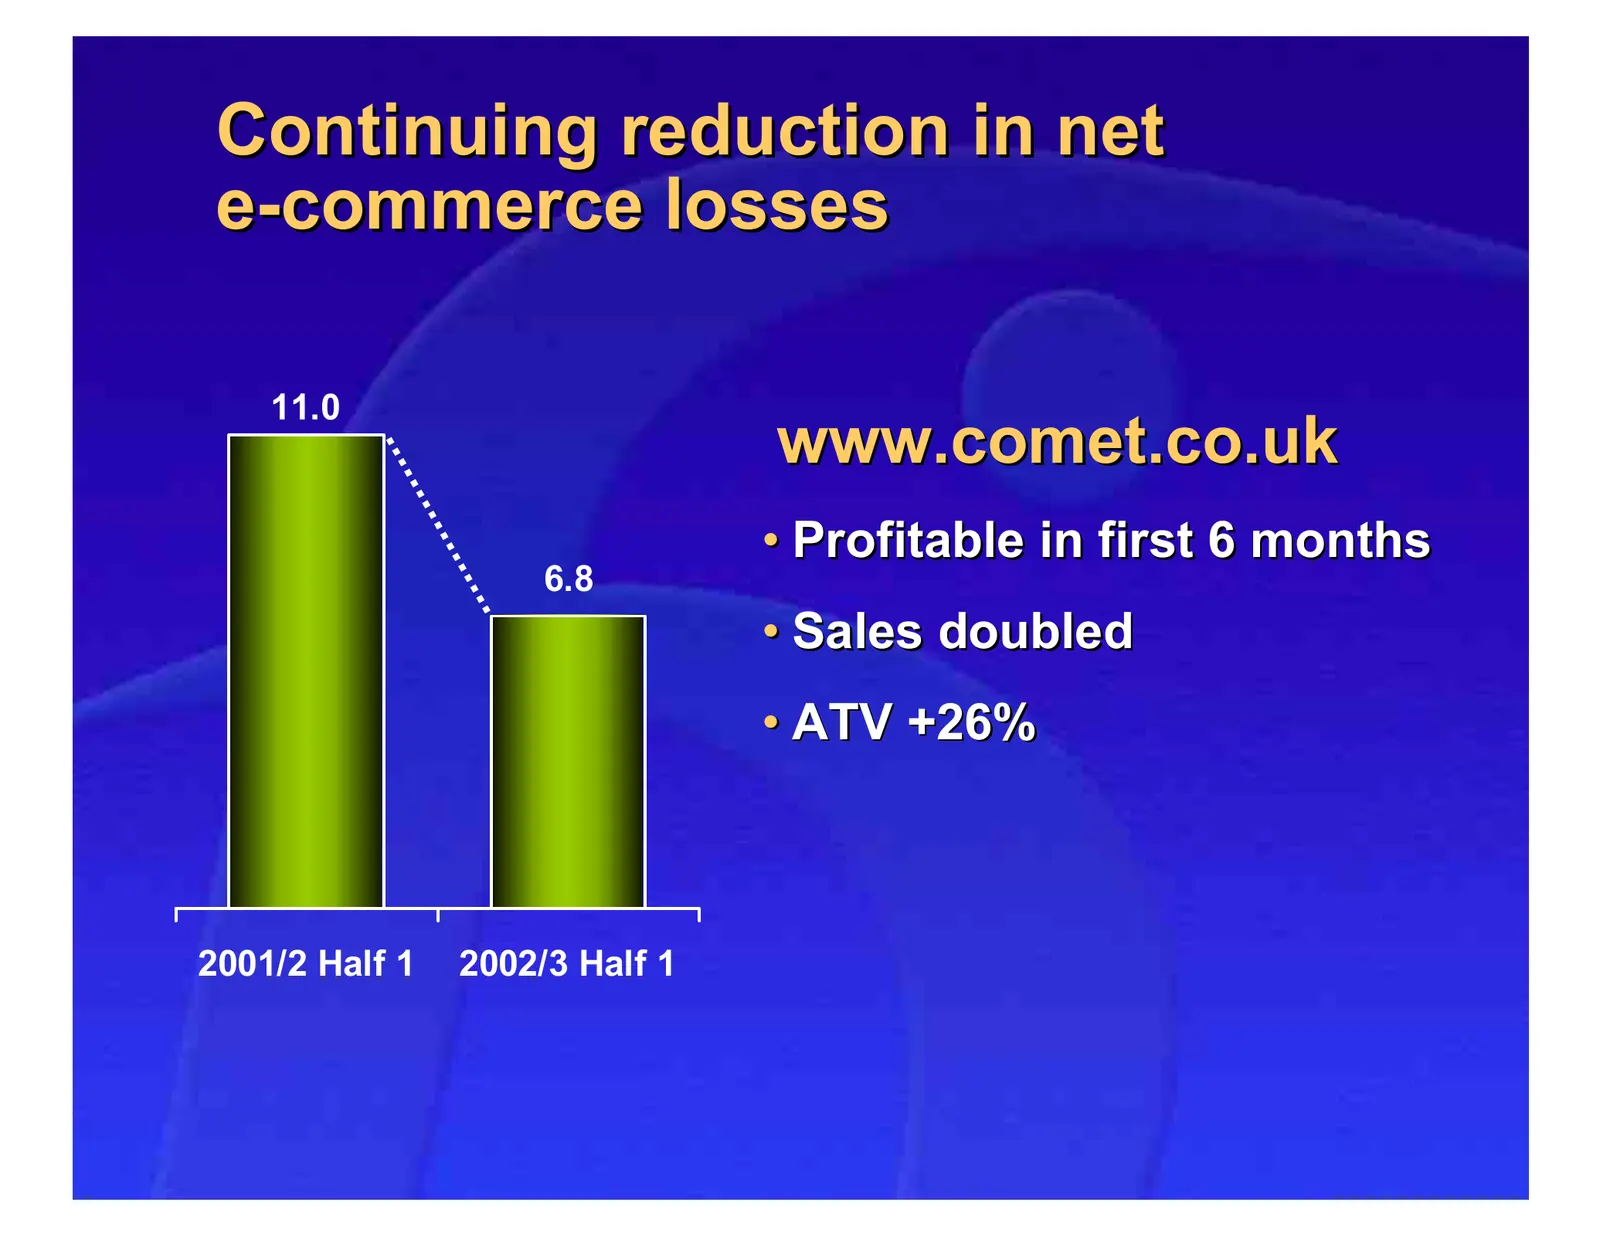
Slide 30: Continuing reduction in net e-commerce losses
Continuing reduction in net e-commerce losses 11.0 www.comet.co.uk • Profitable in first 6 months 6.8 • Sales doubled • ATV +26% 2001/2 Half 1 2002/3 Half 1

Slide 31: Summary Financials
Summary Financials
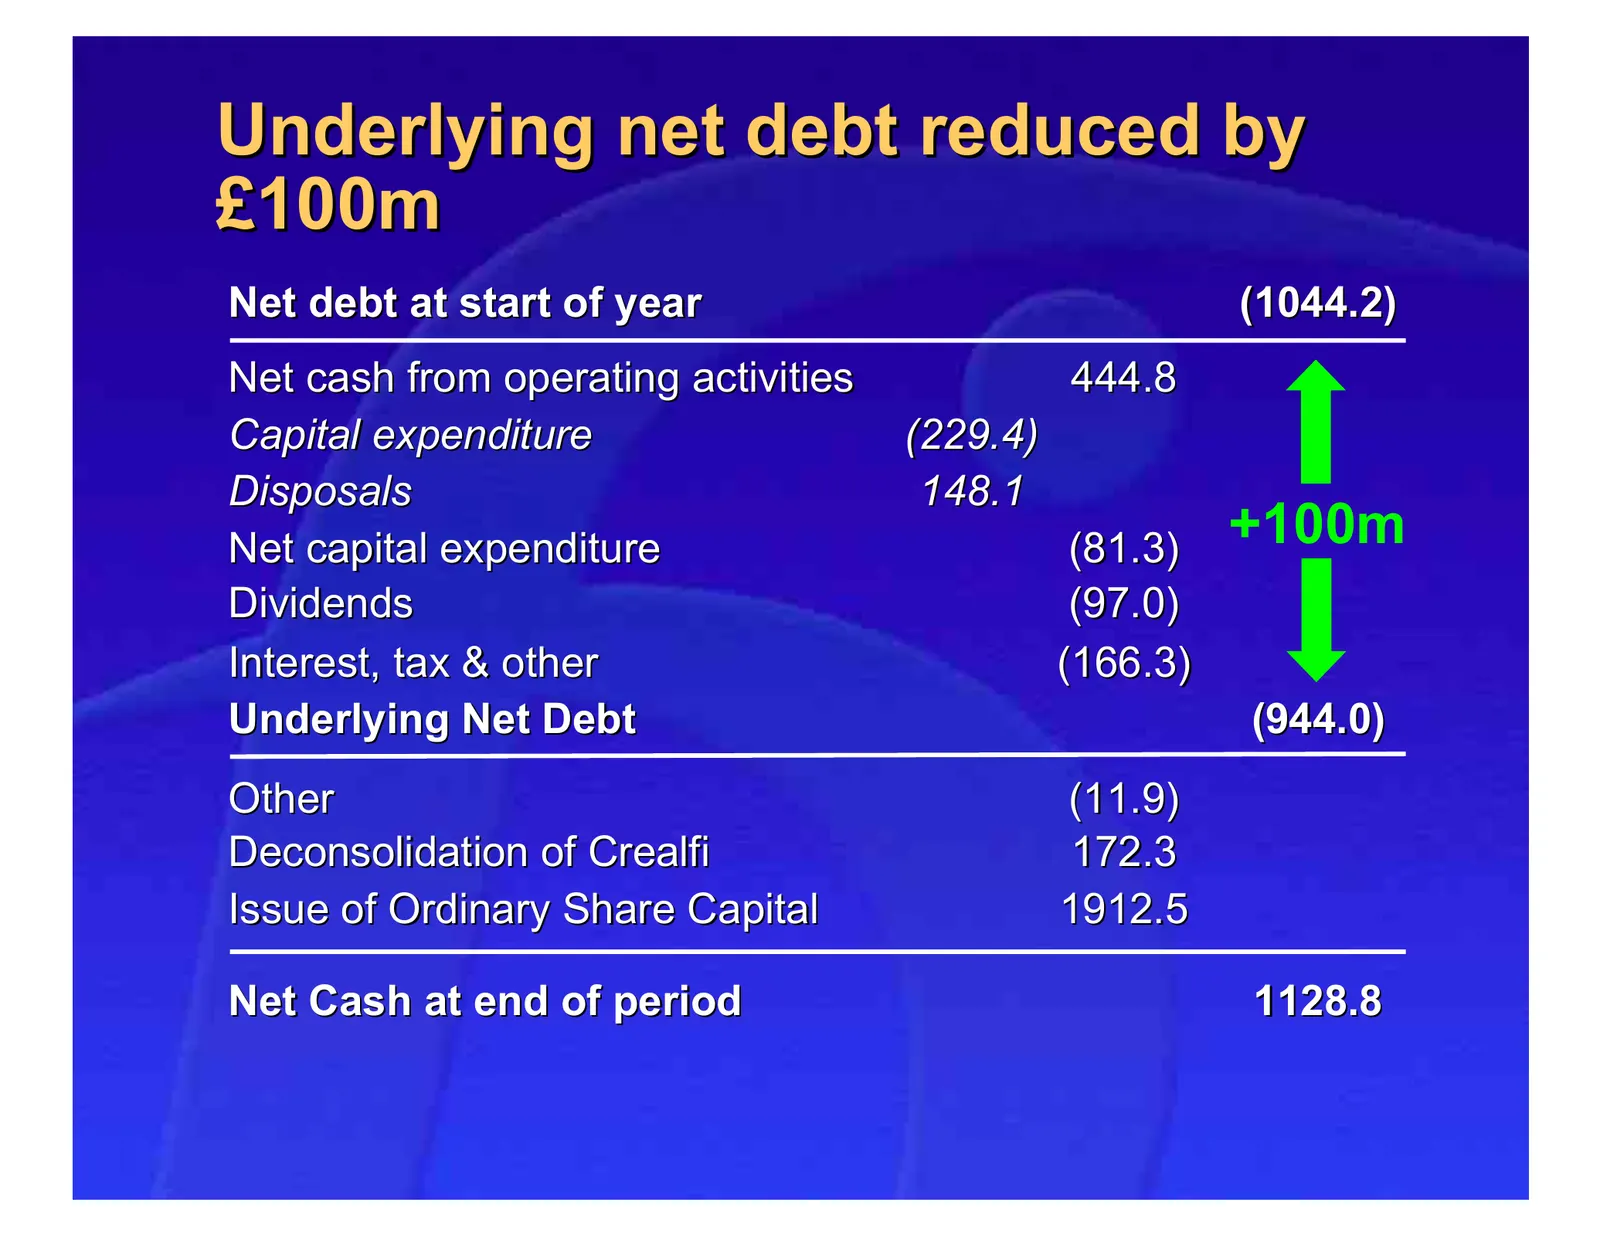
Slide 32: Underlying net debt reduced by £100m
Underlying net debt reduced by £100m Net debt at start of year (1044.2) Net cash from operating activities 444.8 Capital expenditure (229.4) Disposals 148.1 Net capital expenditure (81.3) +100m Dividends (97.0) Interest, tax & other (166.3) Underlying Net Debt (944.0) Other (11.9) Deconsolidation of
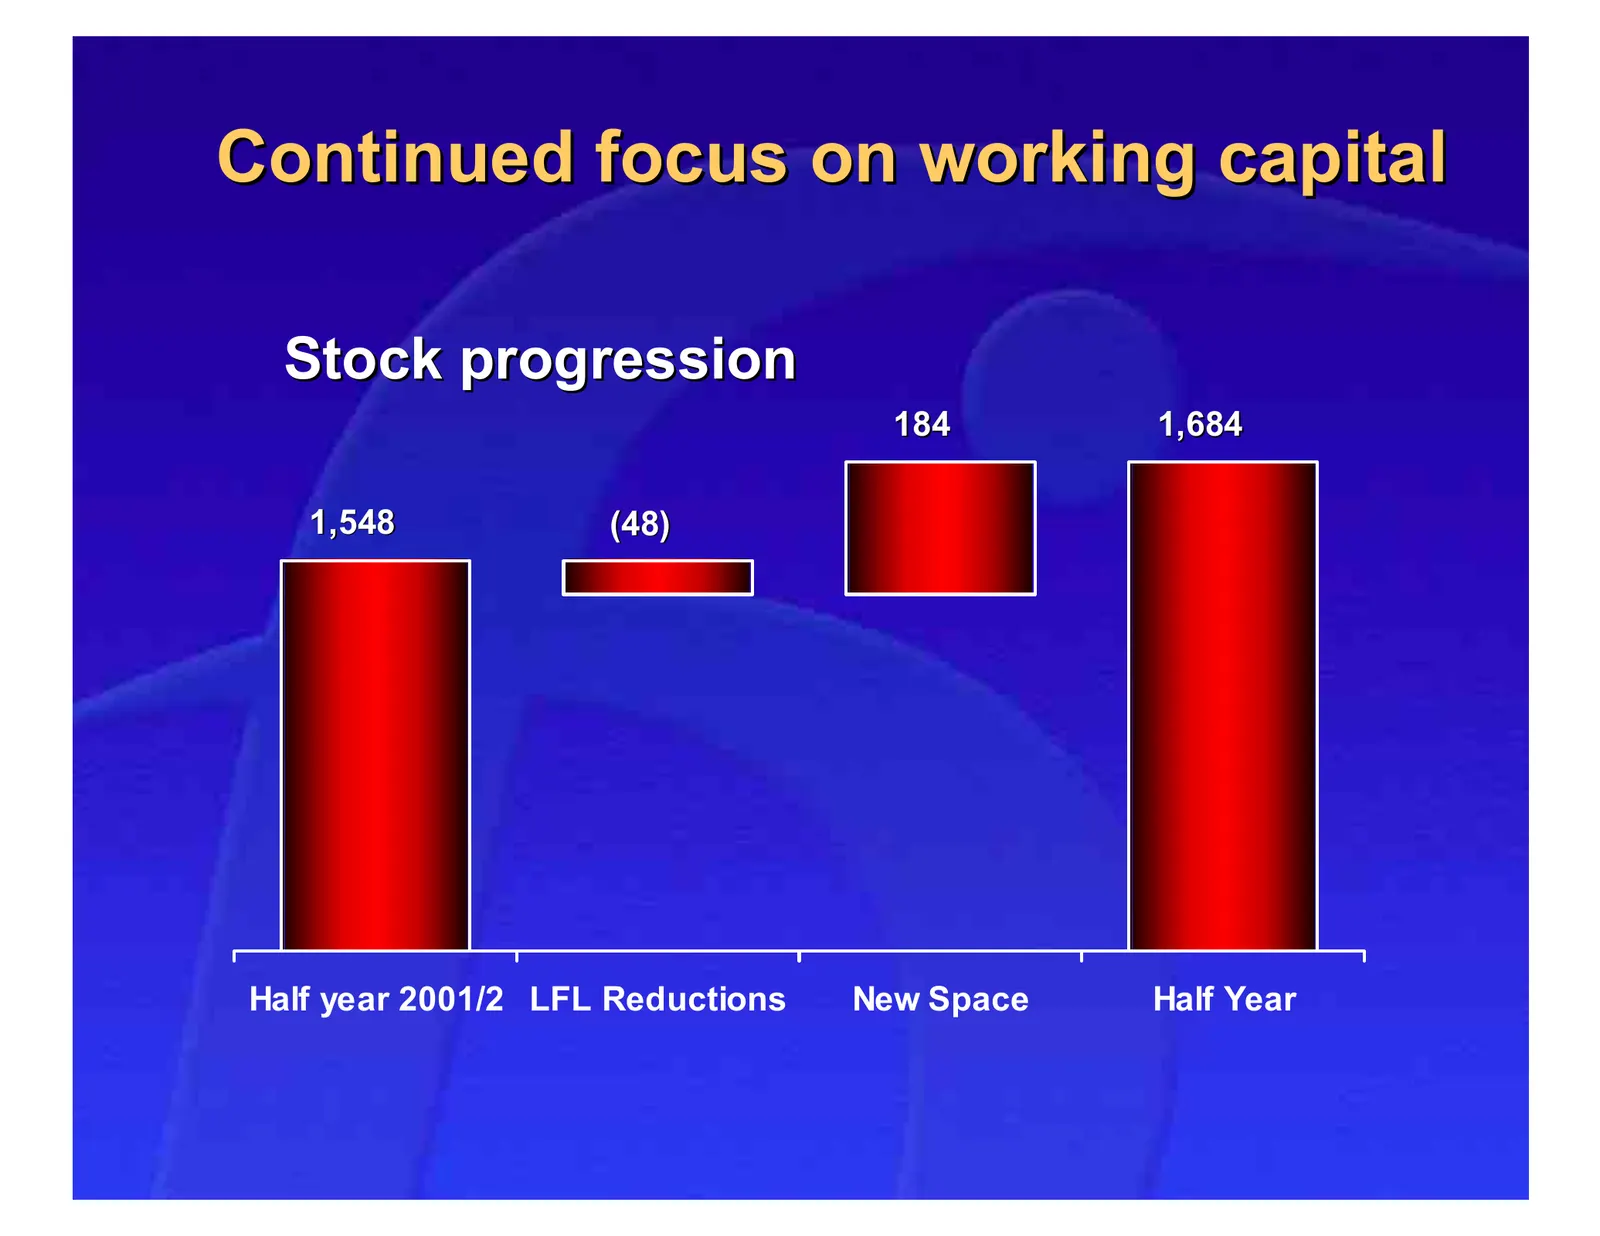
Slide 33: Continued focus on working capital
Continued focus on working capital Stock progression 184 1,684 1,548 (48) Half year 2001/2 LFL Reductions New Space Half Year
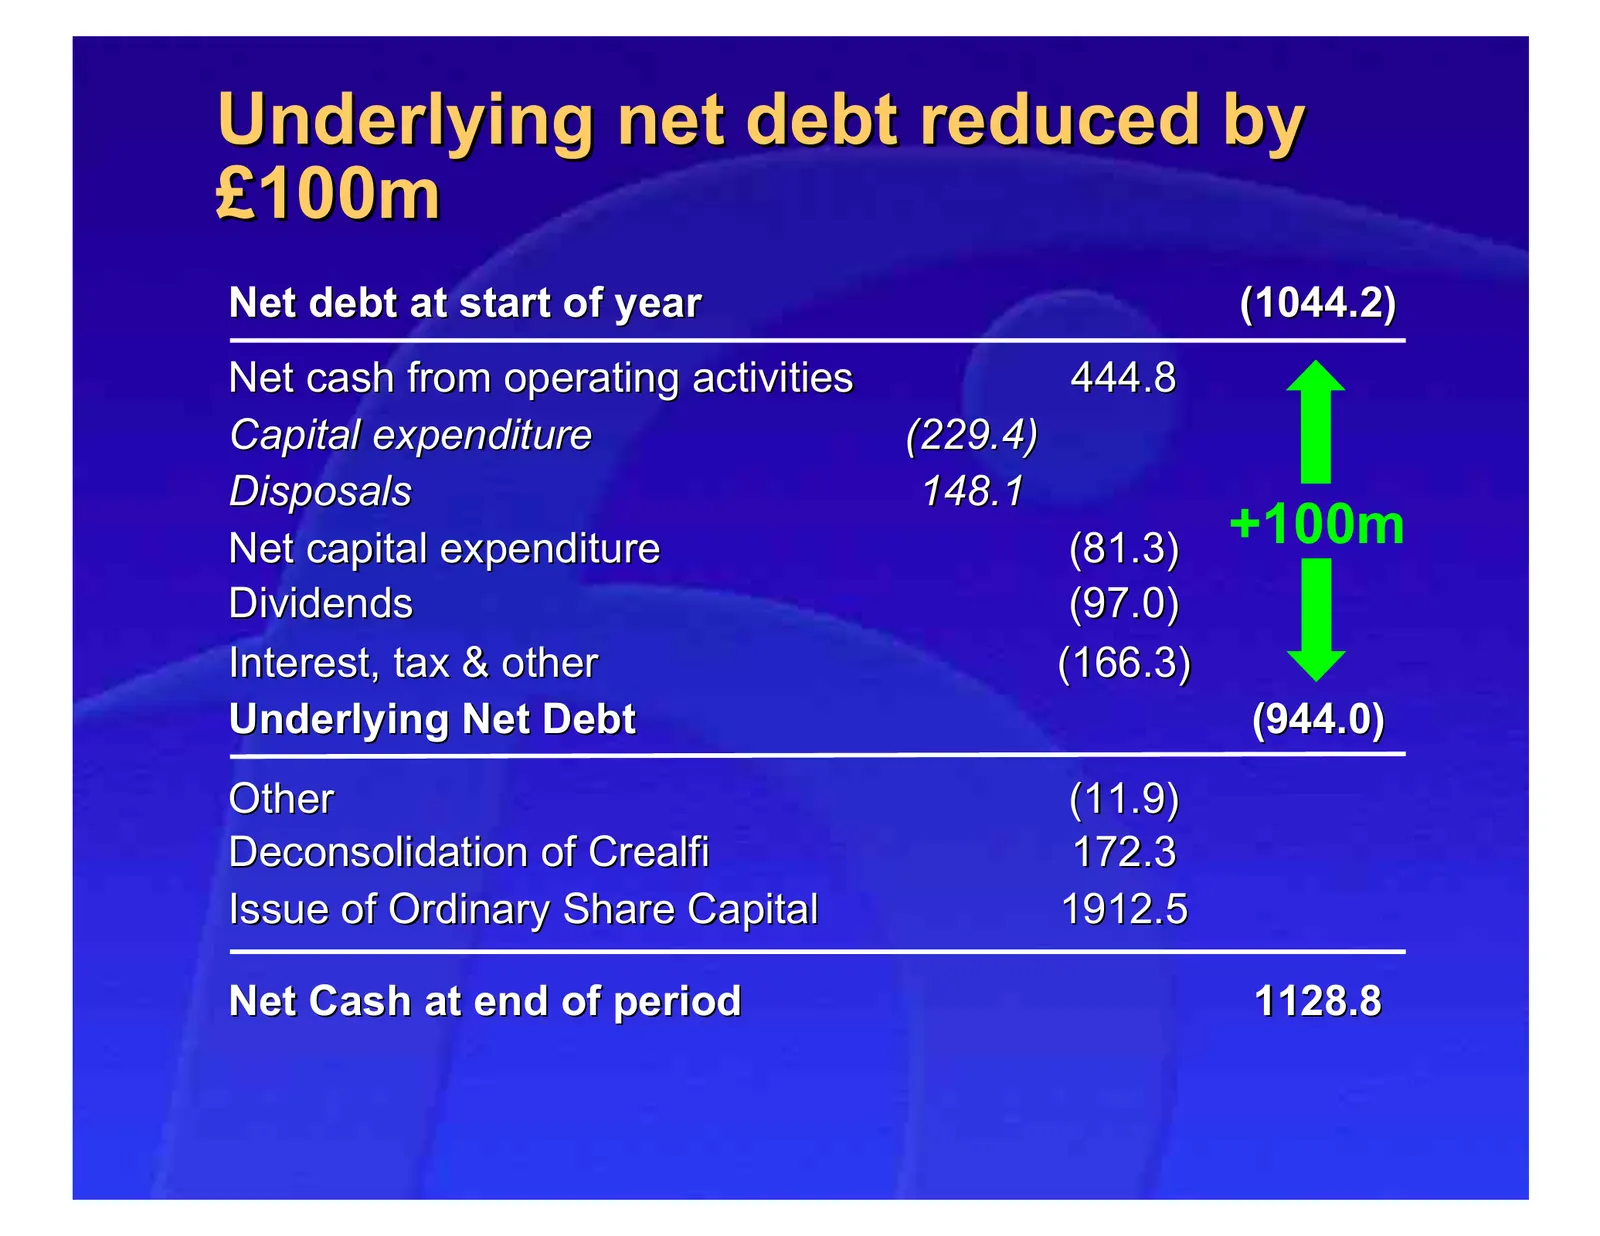
Slide 34: Underlying net debt reduced by £100m
Underlying net debt reduced by £100m Net debt at start of year (1044.2) Net cash from operating activities 444.8 Capital expenditure (229.4) Disposals 148.1 Net capital expenditure (81.3) +100m Dividends (97.0) Interest, tax & other (166.3) Underlying Net Debt (944.0) Other (11.9) Deconsolidation of
Slide 35: Earnings per share ahead by 24.6%
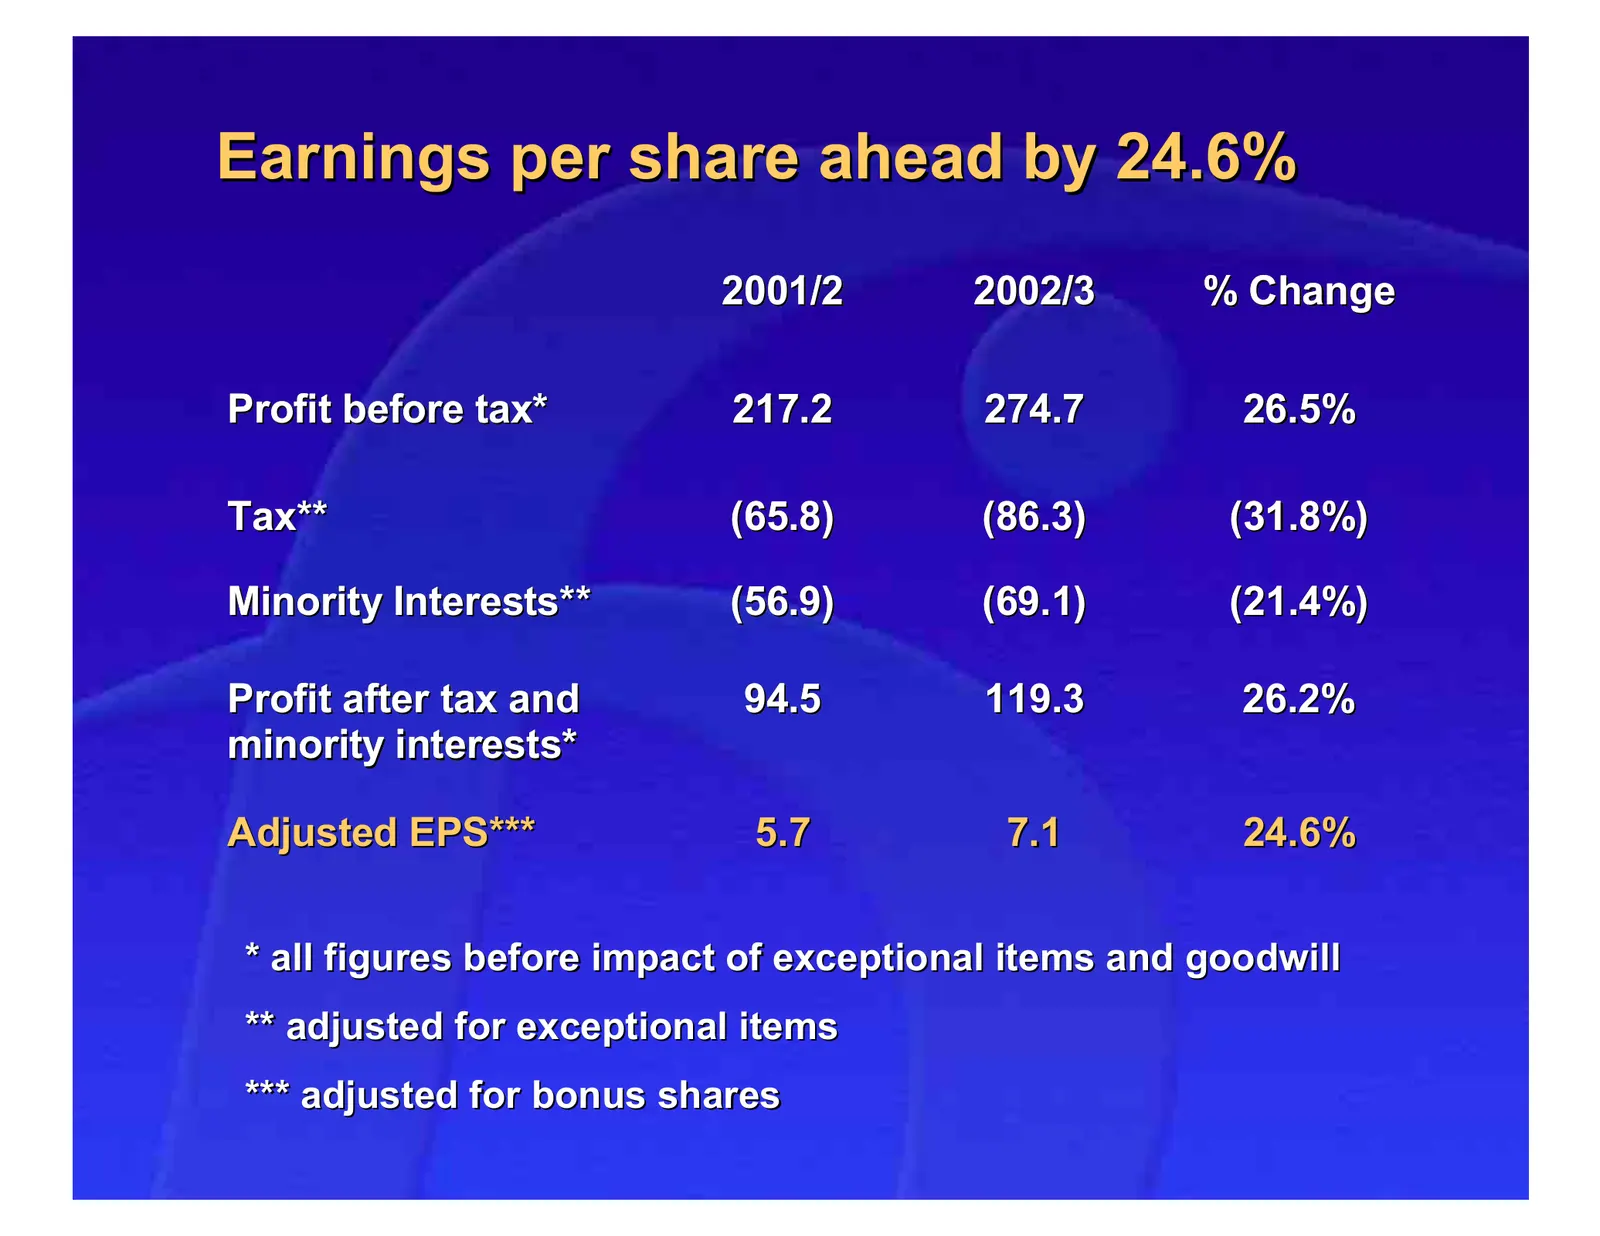
Earnings per share ahead by 24.6% 2001/2 2002/3 % Change Profit before tax* 217.2 274.7 26.5% Tax** x ** (65.8) (86.3) (31.8%) Minority Interests** s ** (56.9) (69.1) (21.4%) Profit after tax and 94.5 119.3 26.2% minority interests* Adjusted EPS*** 5.7 7.1 24.6% * all figures before impact of except
Slide 36: Dividends
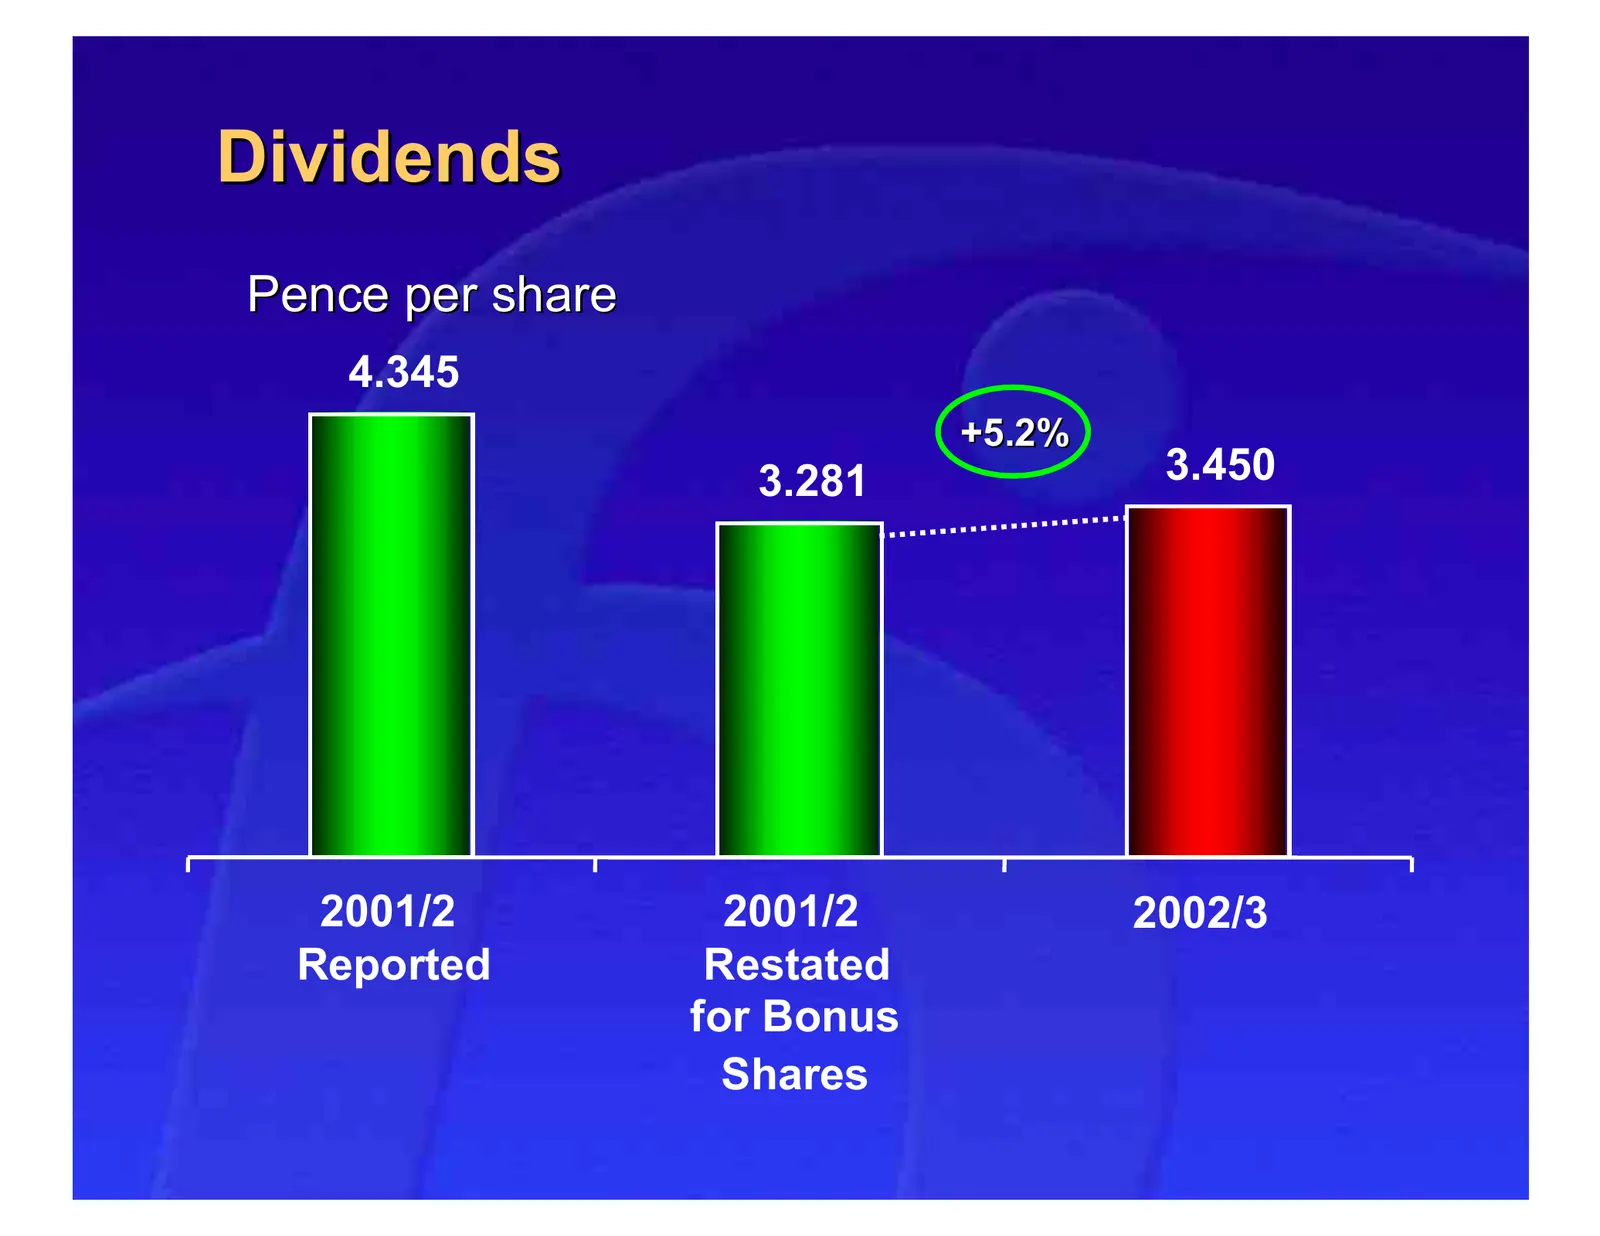
Dividends Pence per share 4.345 +5.2% 3.281 3.450 2001/2 2001/2 2002/3 Reported Restated for Bonus Shares
Slide 37: Dividends received by shareholders up over 50%
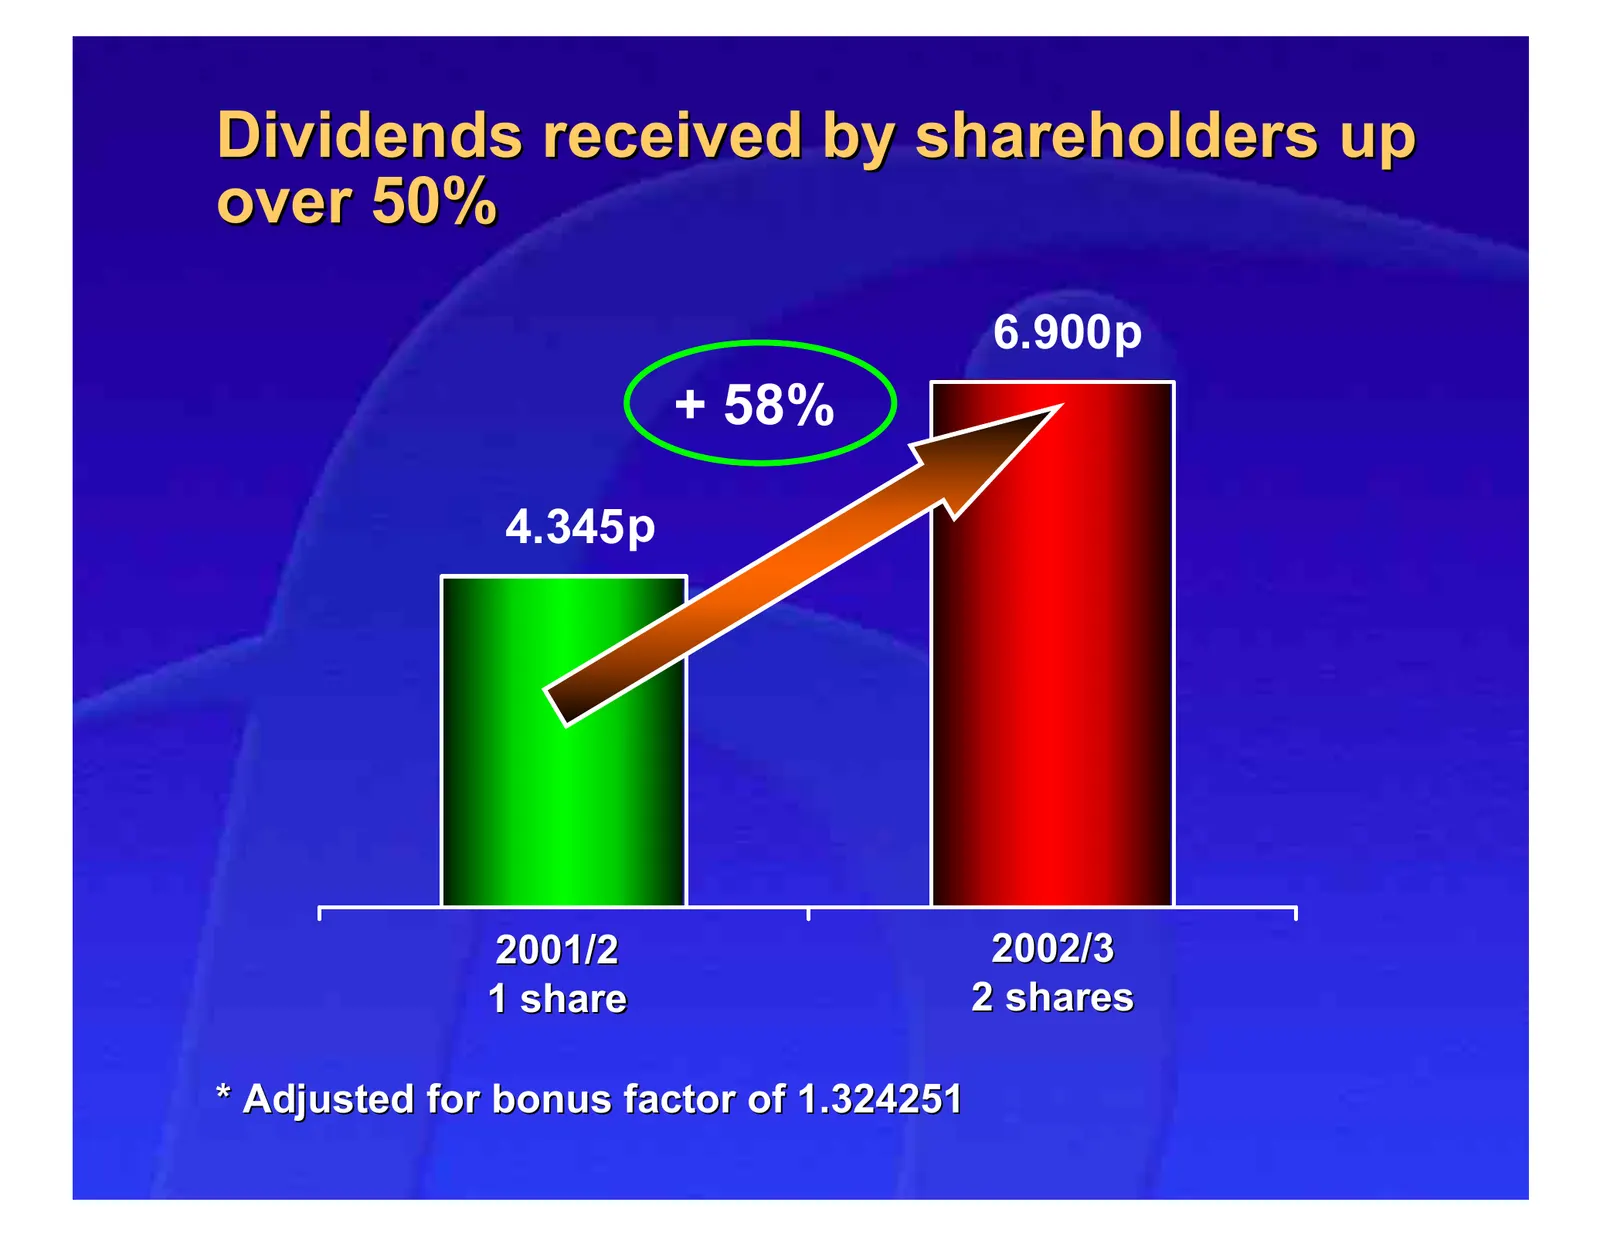
Dividends received by shareholders up over 50% 6.900p + 58% 4.345 p 2001/2 2002/3 1 share 2 shares * Adjusted for bonus factor of 1.324251
Slide 38: Summary: A period of delivery
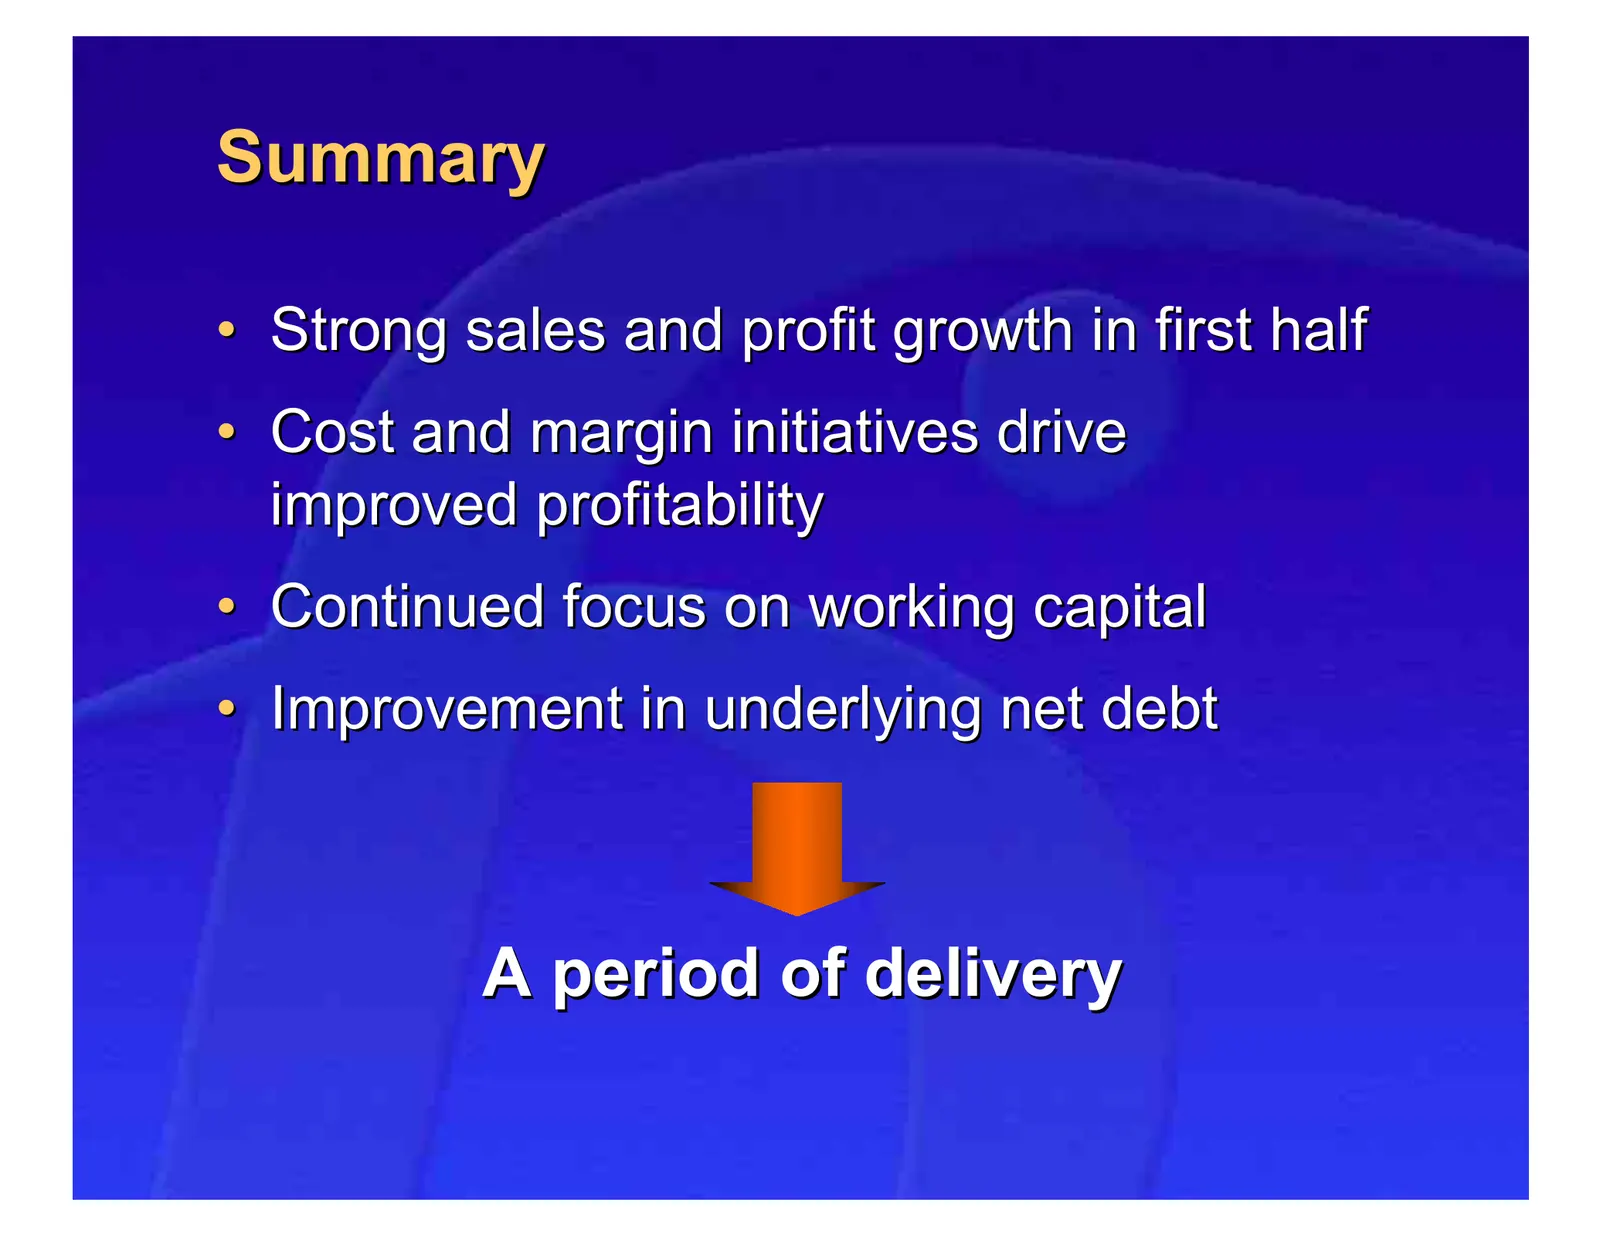
Summary • Strong sales and profit growth in first half • Cost and margin initiatives drive improved profitability • Continued focus on working capital • Improvement in underlying net debt A period of delivery

Slide 39: Geoff Mulcahy, Chief Executive
Geoff Mulcahy Chief Executive
Slide 40: Strong Electrical & Furniture business
Strong Electrical & Furniture business • European No.3 by sales • European No.2 by profits • Leading white goods retailer • Strong cash flow
Slide 41: Electrical & Furniture agenda
Electrical & Furniture agenda • France – Good profitability – Maximising sales • New space • Faster growth categories • UK – High sales growth – Improve return on sales • Germany – Difficult market – More work to be done
Slide 42: Kingfisher – a future pure play Home Improvement business
Kingfisher – a future “pure play” Home Improvement business No. 1 in UK No. 1 in France No. 1 big box operator in Germany Strategic alliance Successful in Poland, Taiwan, China, Italy and Canada
Slide 43: Our vision
Our vision • “Pure play” Home Improvement business • Local marketing and leveraging international scale • Integrated Pan-European organisation
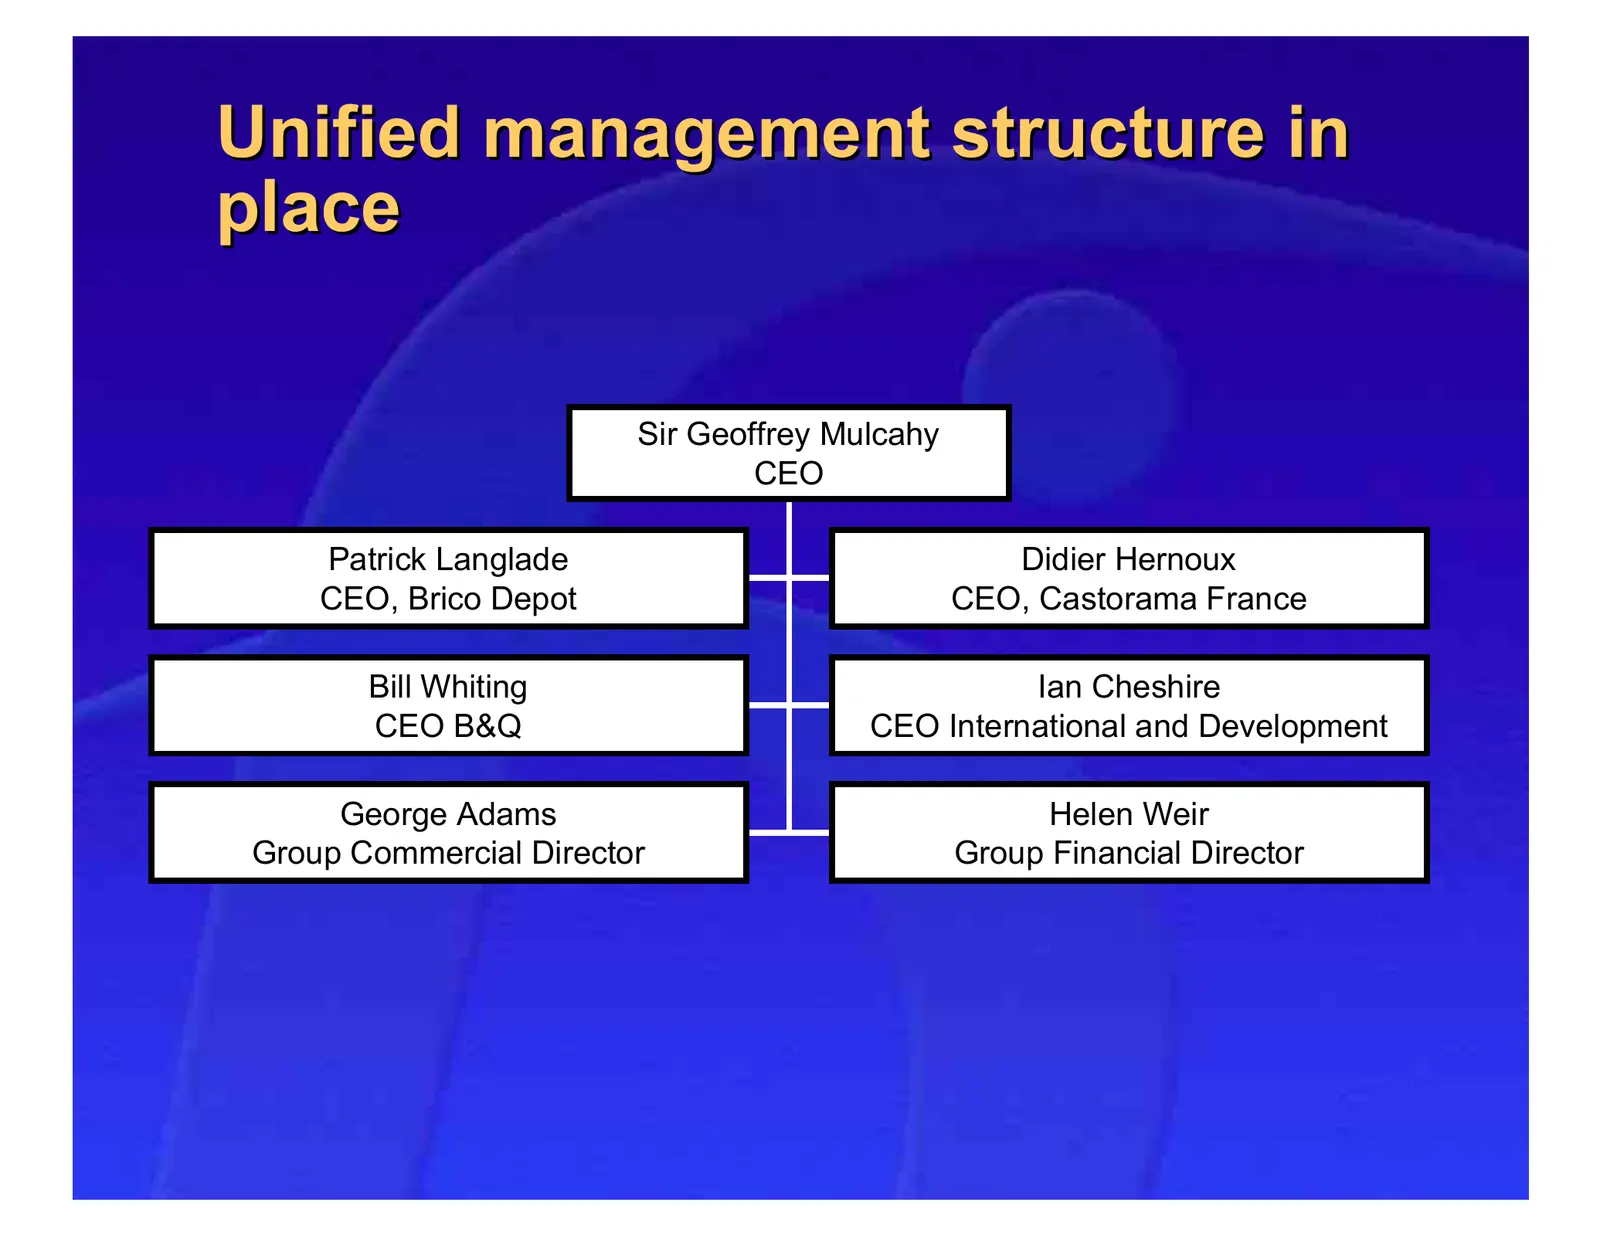
Slide 44: Unified management structure in place
Unified management structure in place Sir Geoffrey Mulcahy CEO Patrick Langlade Didier Hernoux CEO, Brico Depot CEO, Castorama France Bill Whiting Ian Cheshire CEO B&Q CEO International and Development George Adams Helen Weir Group Commercial Director Group Financial Director
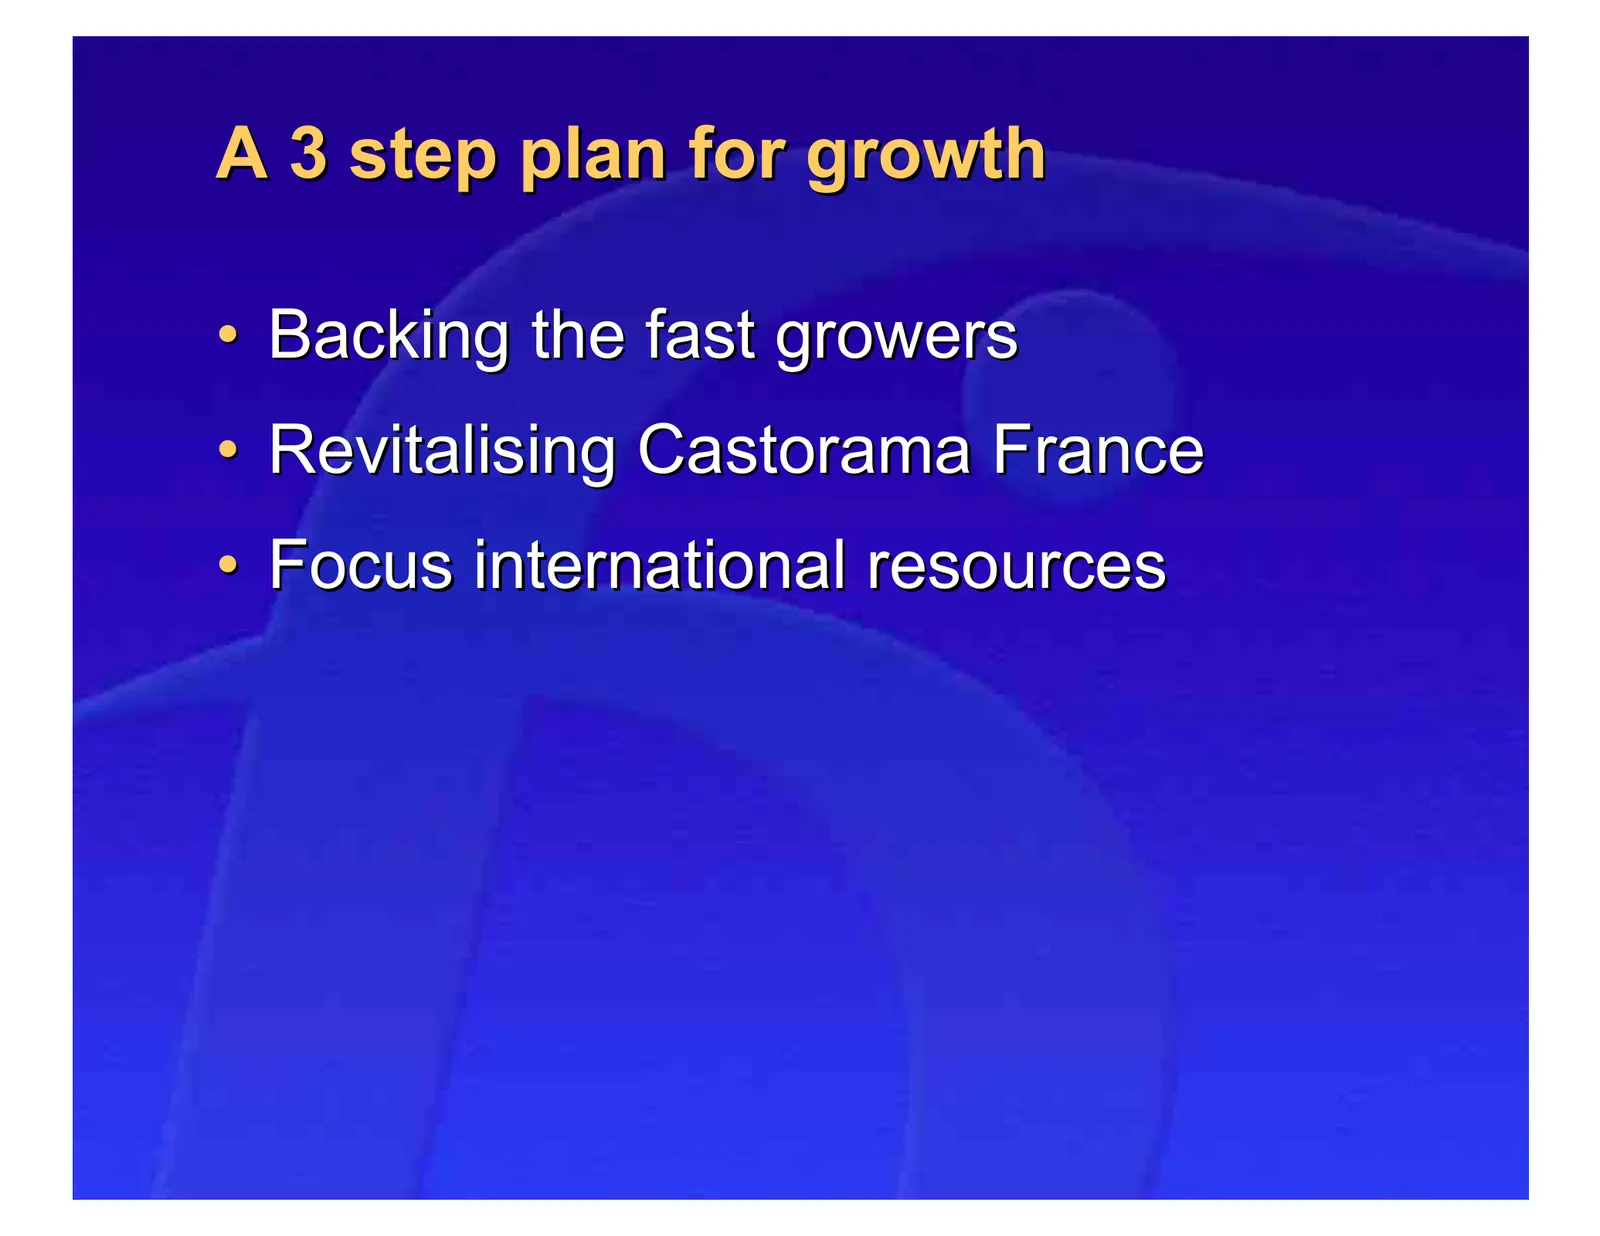
Slide 45: A 3 step plan for growth
A 3 step plan for growth • Backing the fast growers • Revitalising Castorama France • Focus international resources
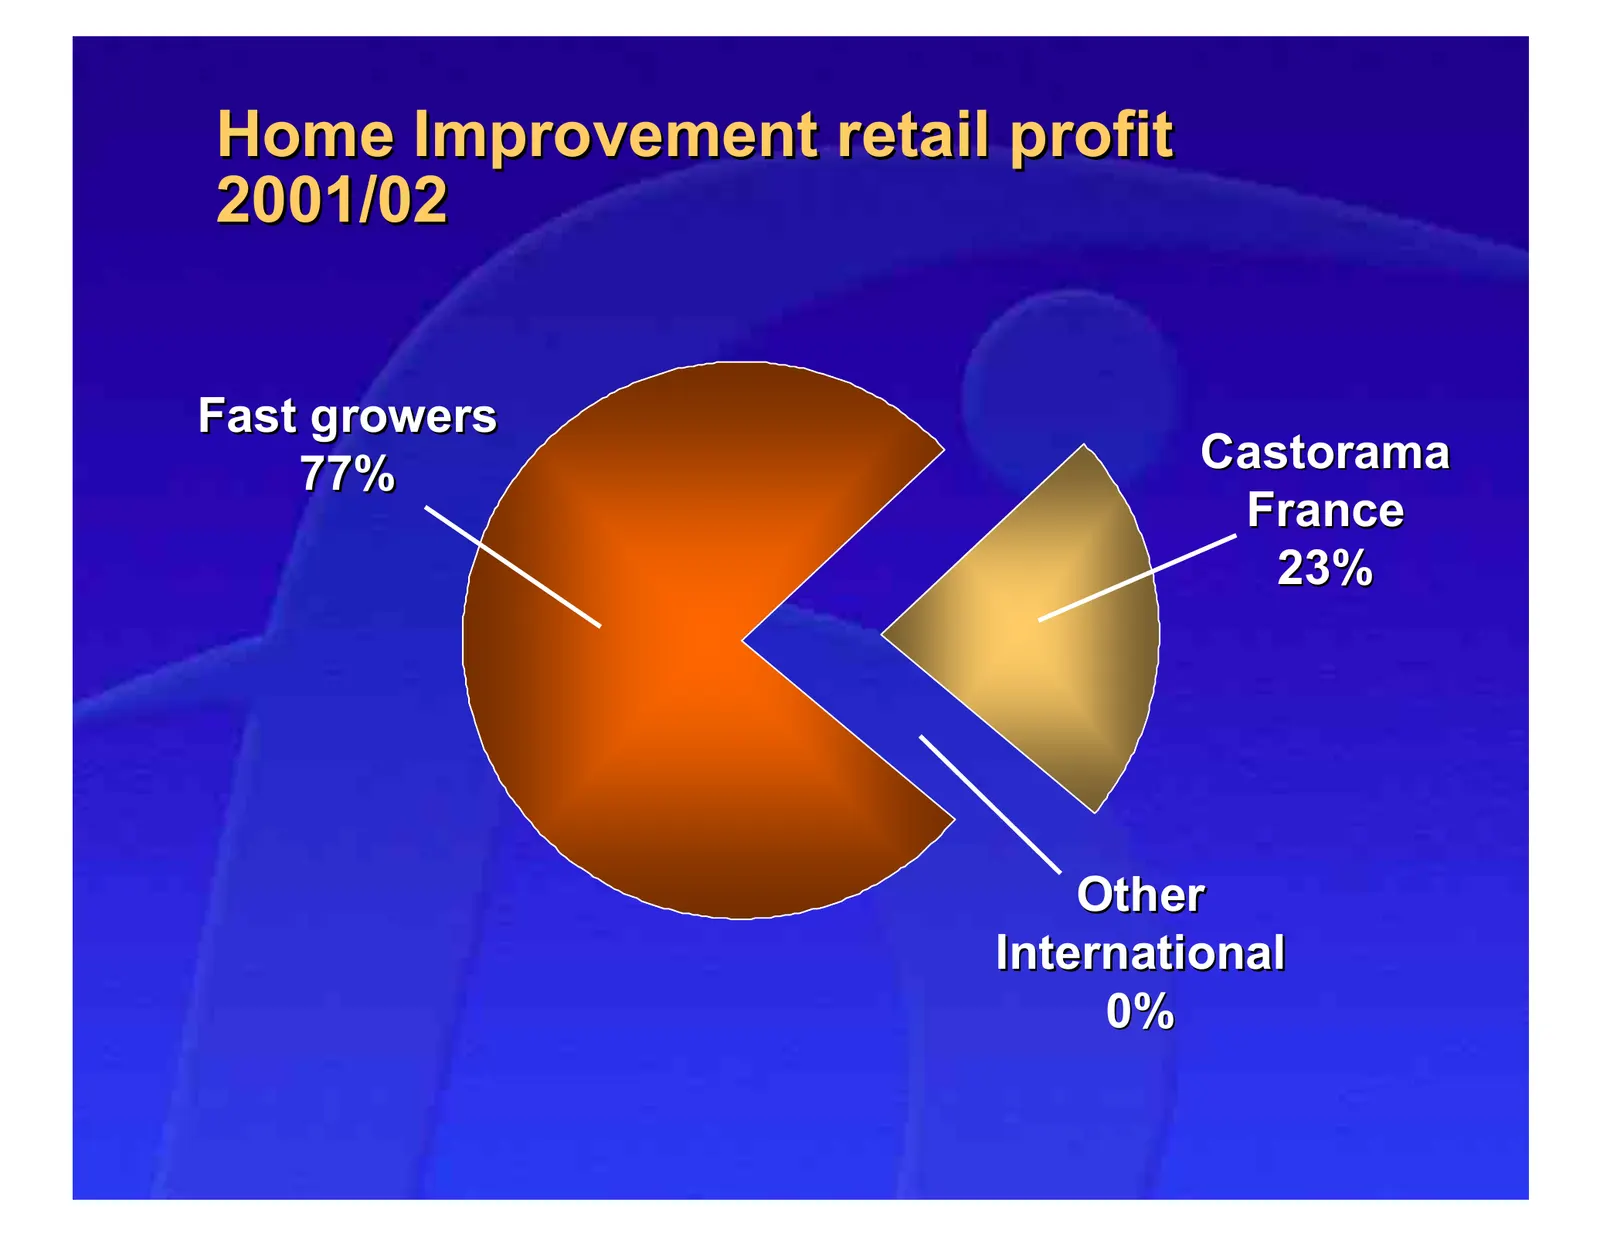
Slide 46: Home Improvement retail profit
Home Improvement retail profit 2001/02 Fast growers 77% Castorama France 23% Other International 0%
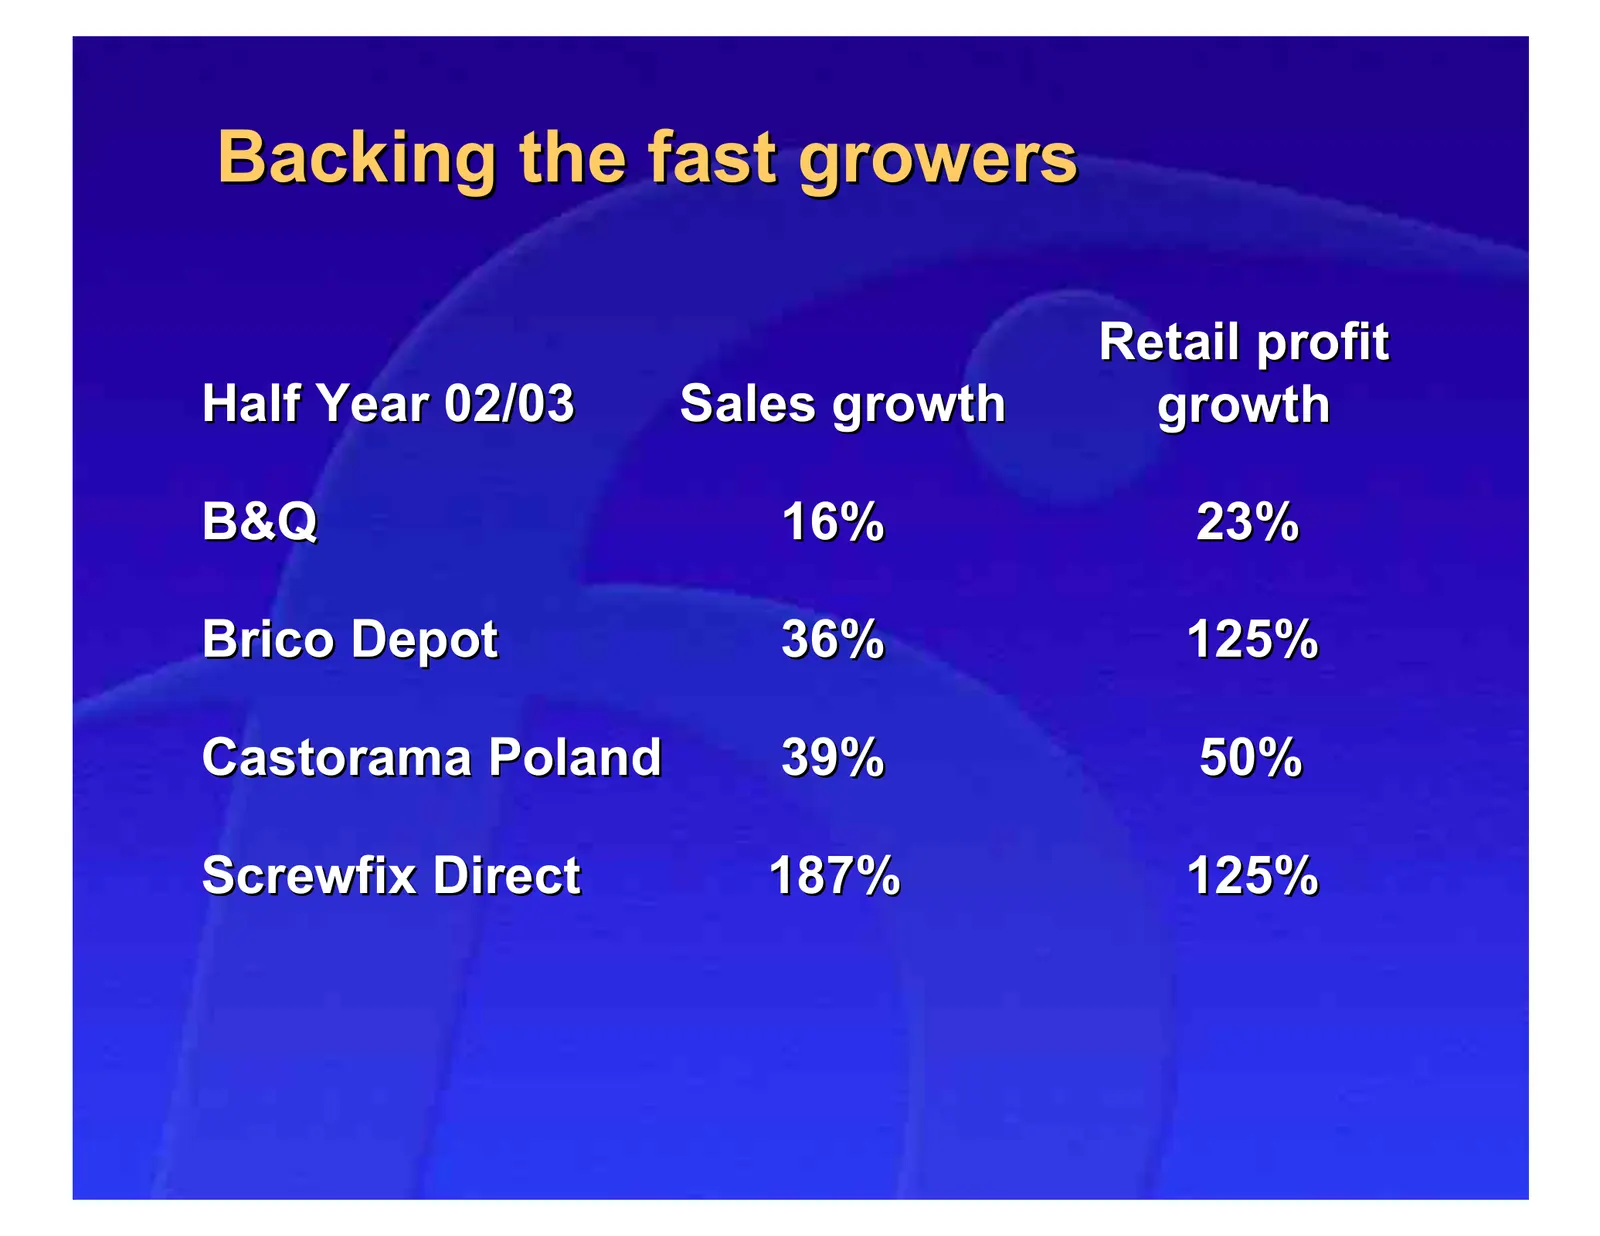
Slide 47: Backing the fast growers
Backing the fast growers Retail profit Half Year 02/03 Sales growth growth B&Q 16% 23% Brico Depot 36% 125% Castorama Poland 39% 50% Screwfix Direct 187% 125%
Slide 48: Backing the fast growers
Backing the fast growers • Space expansion • Driving LFL sales – better ranges – better service – better prices • Cost efficiencies
Slide 49
Slide 50: Current programme
Current programme September - communication - mobilisation - already talked with over 500 colleagues October - Pre-implementation diagnostics - Store format renewal - CPR introduction - Head office integration - International review
Slide 51: Unlocking the potential
Unlocking the potential • Unified Group with clear vision • Sharing: – Skills, knowledge – experience, best practice • Capitalising on scale – up to 50% common European ranges – pan -European own label development pan-European

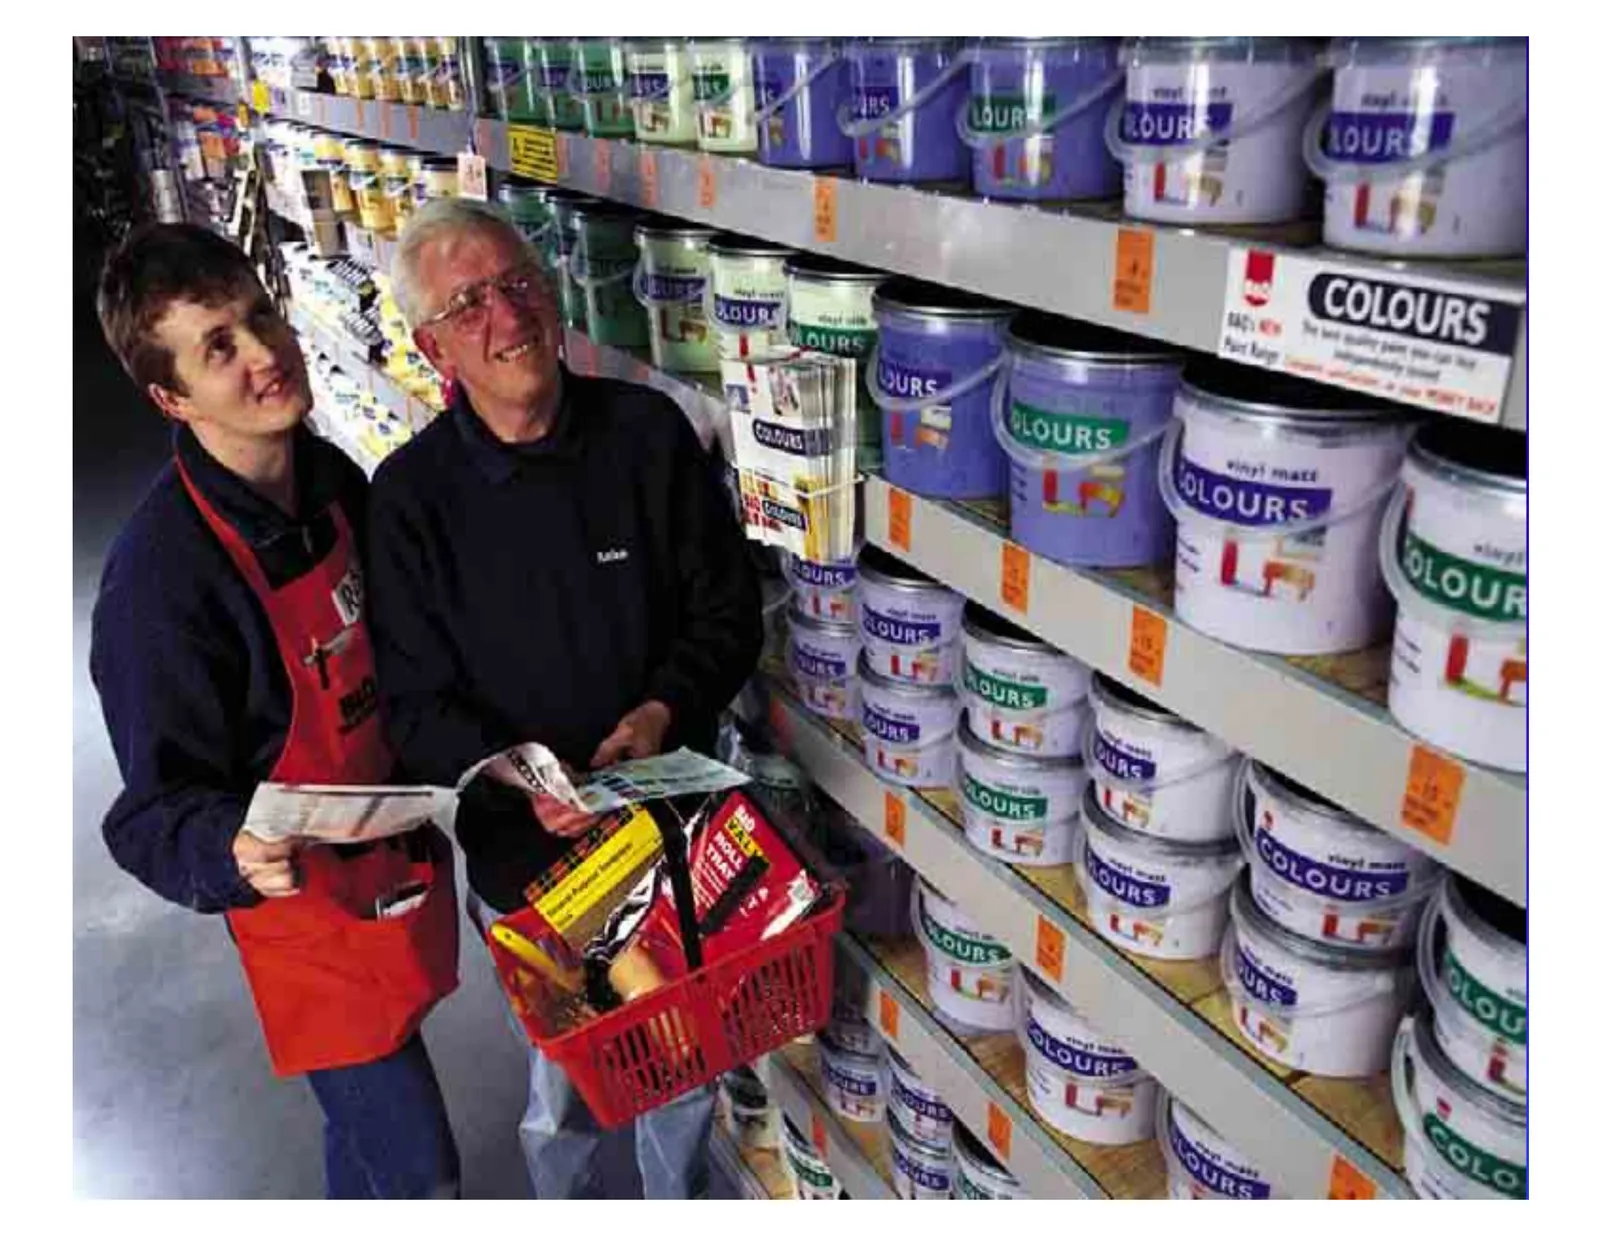
Slide 52: B&Q Value and Casto label
• B&Q Value and Casto label pic
Slide 53
Slide 54: Conclusion
Conclusion • Delivered strong first half results • Delivered operational growth agenda • Delivering on our transformation plan And separation of the Electrical and Furniture will create:- • Strong No 1 in Europe • The only truly international home improvement retailer in the world

Slide 55: Leading in international home retail
Leading in international home retail
Source: Internet Archive copy of kingfisher.com
More decks from Kingfisher PLC
 H1 2026/27 Earnings Presentation33 slides · Sep 22, 2026
 FY2025/26 Earnings Presentation39 slides · Mar 24, 2026
 H1 2025/26 Earnings Presentation38 slides · Sep 23, 2025
 H1 2025/26 Earnings Presentation6 slides · September 2025
 FY2024/25 Earnings Presentation35 slides · Apr 8, 2025
 FY2024/25 Earnings Presentation40 slides · Mar 25, 2025