Arlington Asset Investment Corp
Arlington Asset Investment — Q4 2015 Earnings Presentation
19 slides from Arlington Asset Investment's earnings presentation, Feb 3, 2016
Slide 1: Investor Presentation – Fourth Quarter 2015
Investor Presentation – Fourth Quarter 2015 February 2, 2016
Slide 2: Information Related to Forward-Looking Statements
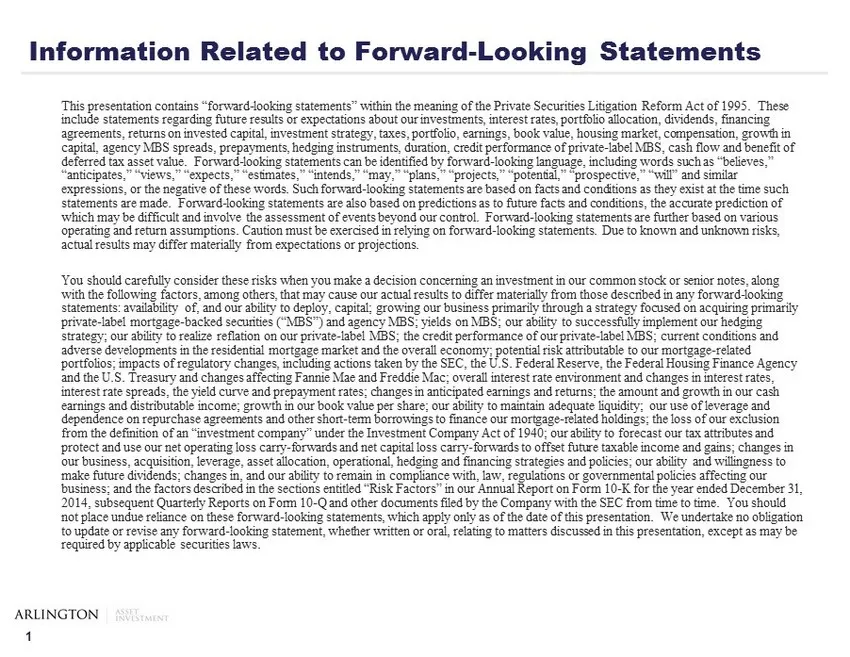
1 Information Related to Forward - Looking Statements This presentation contains “forward - looking statements” within the meaning of the Private Securities Litigation Reform Act of 19 95. These include statements regarding future results or expectations about our investments, interest rates, portfo
Slide 3: Company Overview
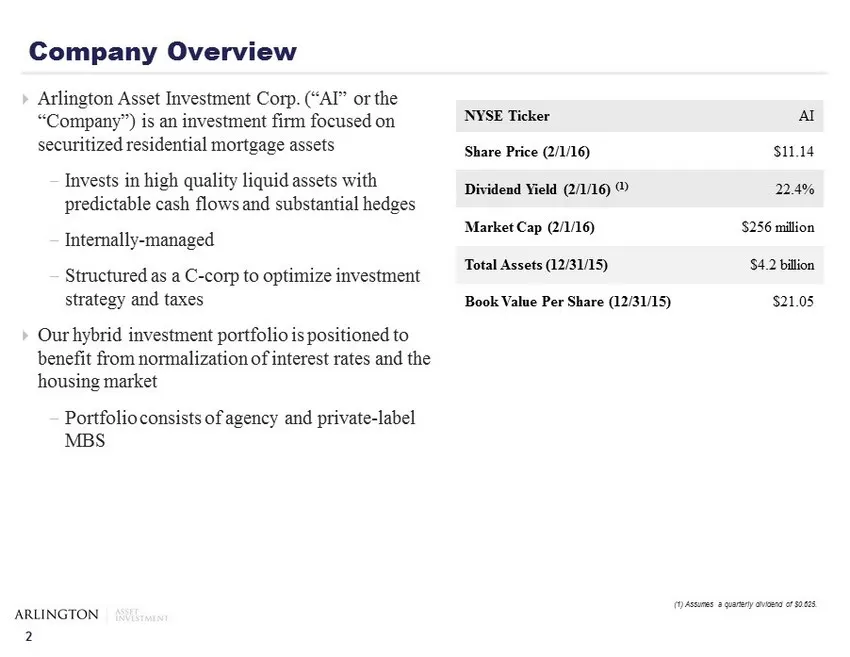
2 Company Overview ; Arlington Asset Investment Corp. (“AI” or the “Company”) is an investment firm focused on securitized residential mortgage assets - Invests in high quality liquid assets with predictable cash flows and substantial hedges - Internally - managed - Structured as a C - corp to optim
Slide 4: MBS Investment Portfolio Overview
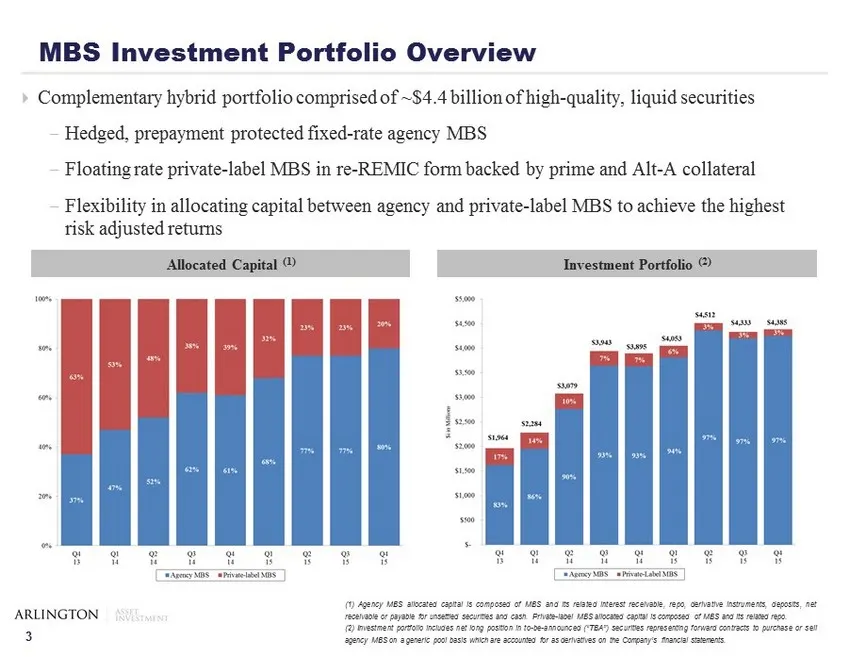
3 ; Complementary hybrid portfolio comprised of ~$4.4 billion of high - quality, liquid securities - Hedged, prepayment protected fixed - rate agency MBS - Floating rate private - label MBS in re - REMIC form backed by prime and Alt - A collateral - Flexibility in allocating capital between agency a
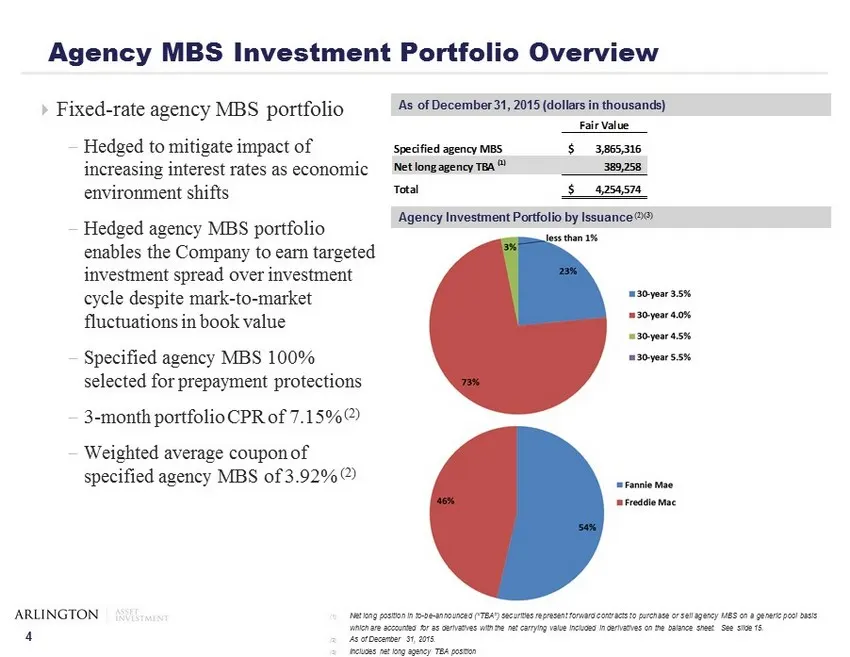
Slide 5: Agency MBS Investment Portfolio Overview
4 ; Fixed - rate agency MBS portfolio - Hedged to mitigate impact of increasing interest rates as economic environment shifts - Hedged agency MBS portfolio enables the Company to earn targeted investment spread over investment cycle despite mark - to - market fluctuations in book value - Specified a
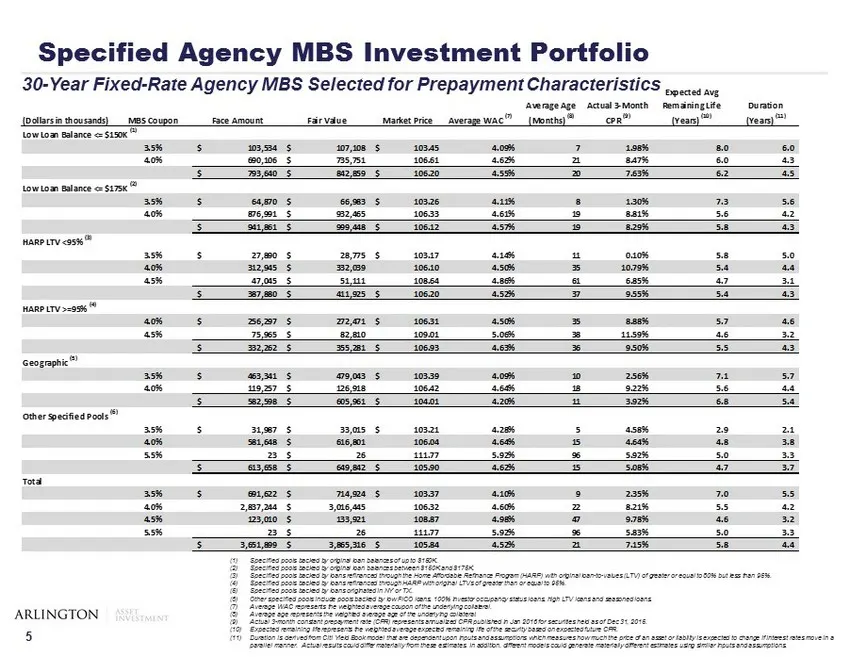
Slide 6: Specified Agency MBS Investment Portfolio
5 Specified Agency MBS Investment Portfolio (1) Specified pools backed by original loan balances of up to $150K. (2) Specified pools backed by original loan balances between $150K and $175K. (3) Specified pools backed by loans refinanced through the Home Affordable Refinance Program (HARP) with orig
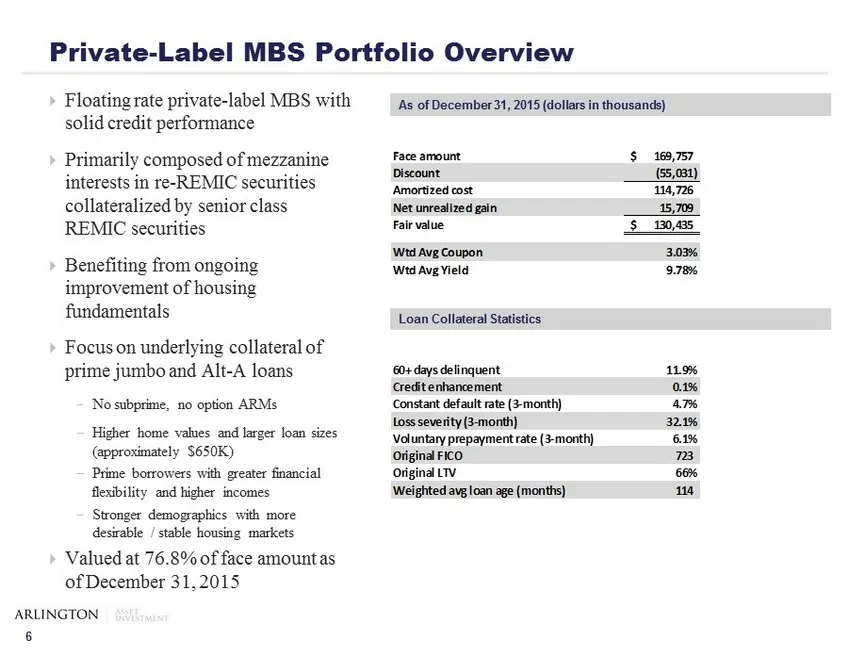
Slide 7: Private-Label MBS Portfolio Overview
6 ; Floating rate private - label MBS with solid credit performance ; Primarily composed of mezzanine interests in re - REMIC securities collateralized by senior class REMIC securities ; Benefiting from ongoing improvement of housing fundamentals ; Focus on underlying collateral of prime jumbo and A
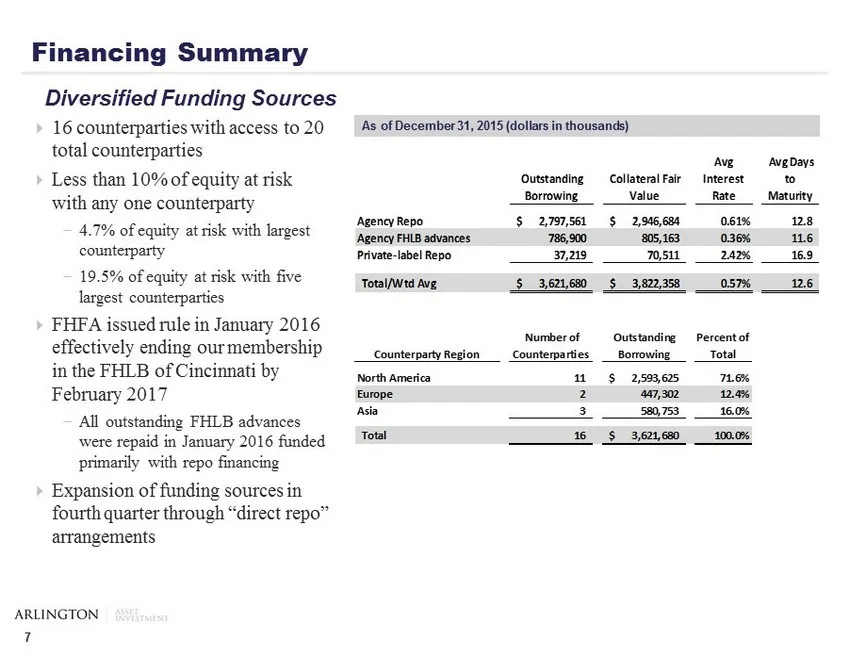
Slide 8: Financing Summary
7 Financing Summary ; 16 counterparties with access to 20 total counterparties ; Less than 10% of equity at risk with any one counterparty - 4.7% of equity at risk with largest counterparty - 19.5% of equity at risk with five largest counterparties ; FHFA issued rule in January 2016 effectively endi
Slide 9: Hedging Summary
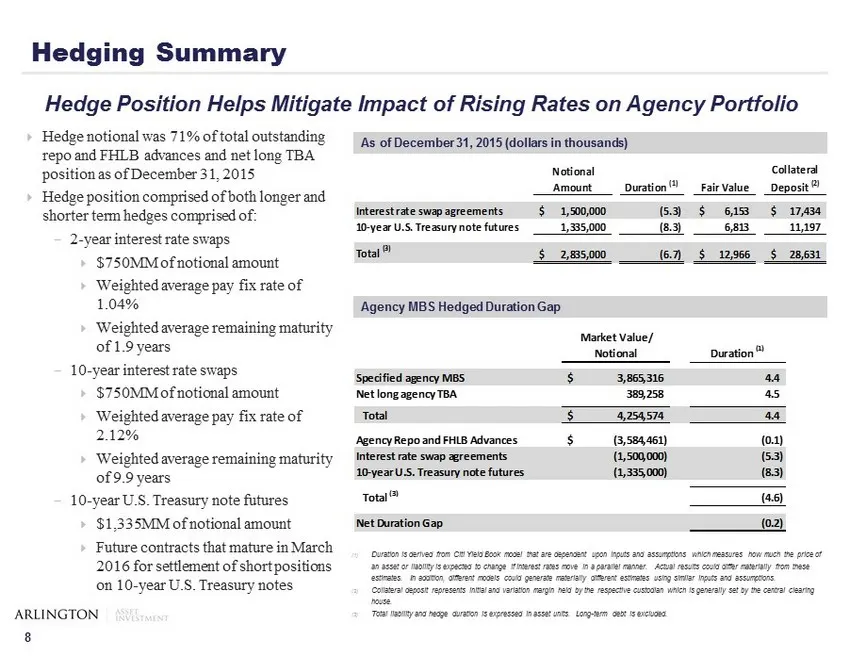
8 ; Hedge notional was 71% of total outstanding repo and FHLB advances and net long TBA position as of December 31, 2015 ; Hedge position comprised of both longer and shorter term hedges comprised of: - 2 - year interest rate swaps ; $750MM of notional amount ; Weighted average pay fix rate of 1.04%
Slide 10: C-corp structure provides tax-advantaged dividend
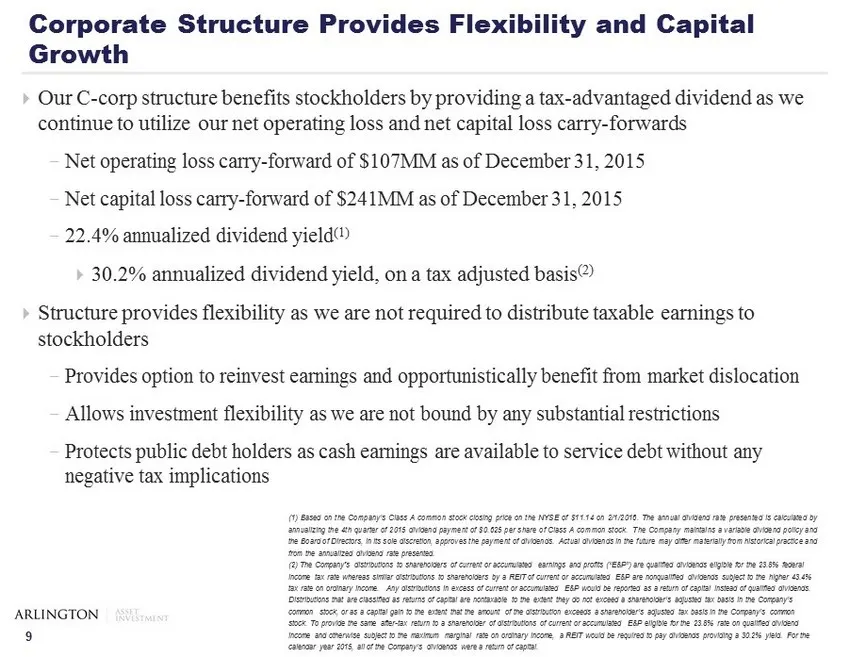
9 ; Our C - corp structure benefits stockholders by providing a tax - advantaged dividend as we continue to utilize our net operating loss and net capital loss carry - forwards - Net operating loss carry - forward of $107MM as of December 31, 2015 - Net capital loss carry - forward of $241MM as of D
Slide 11: Efficient Internally Managed Structure
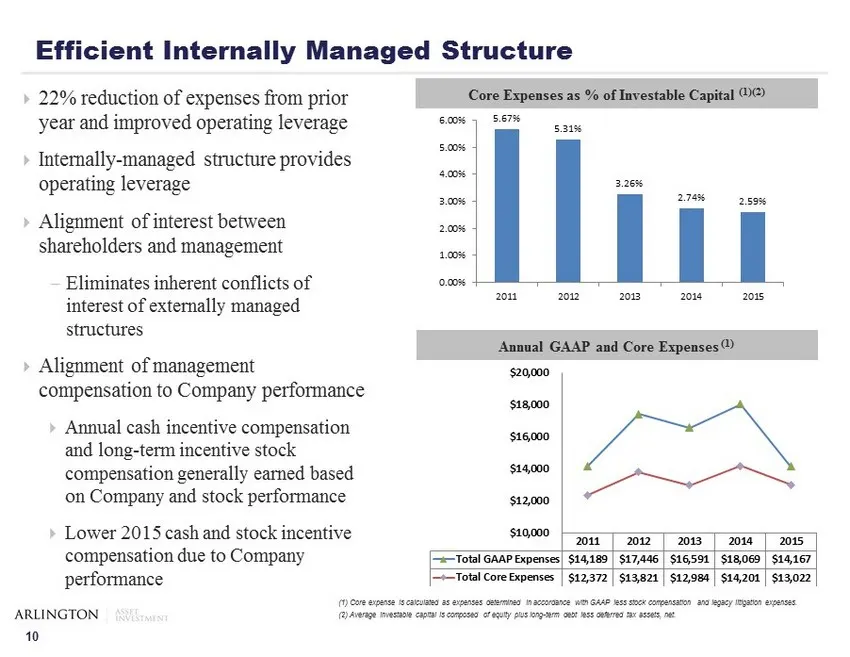
10 ; 22% reduction of expenses from prior year and improved operating leverage ; Internally - managed structure provides operating leverage ; Alignment of interest between shareholders and management - Eliminates inherent conflicts of interest of externally managed structures ; Alignment of manageme

Slide 12: Appendix
11 Appendix
Slide 13: Balance Sheet
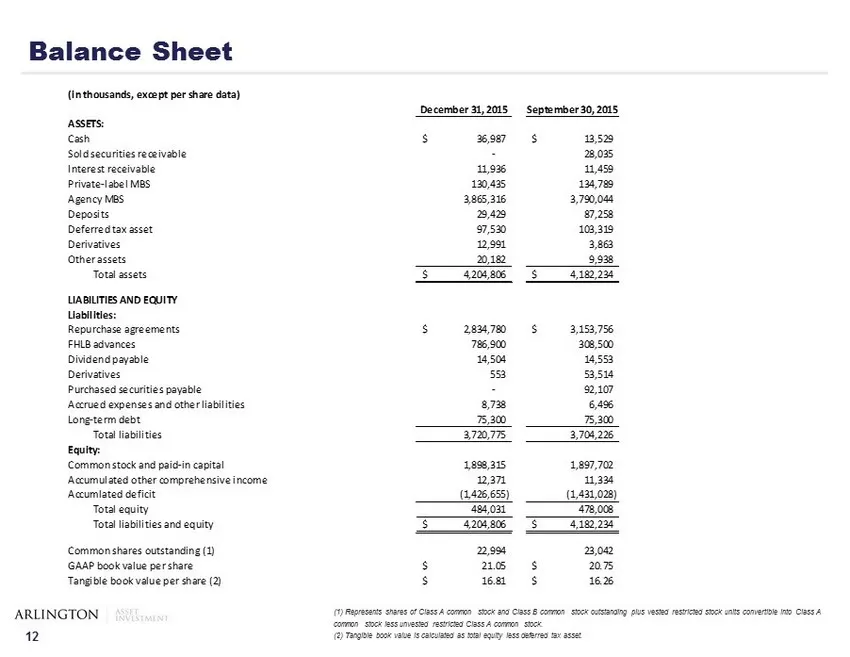
12 Balance Sheet (1) Represents shares of Class A common stock and Class B common stock outstanding plus vested restricted stock units convertible into Class A common stock less unvested restricted Class A common stock. (2) Tangible book value is calculated as total equity less deferred tax asset. (
Slide 14: Statement of Comprehensive Income
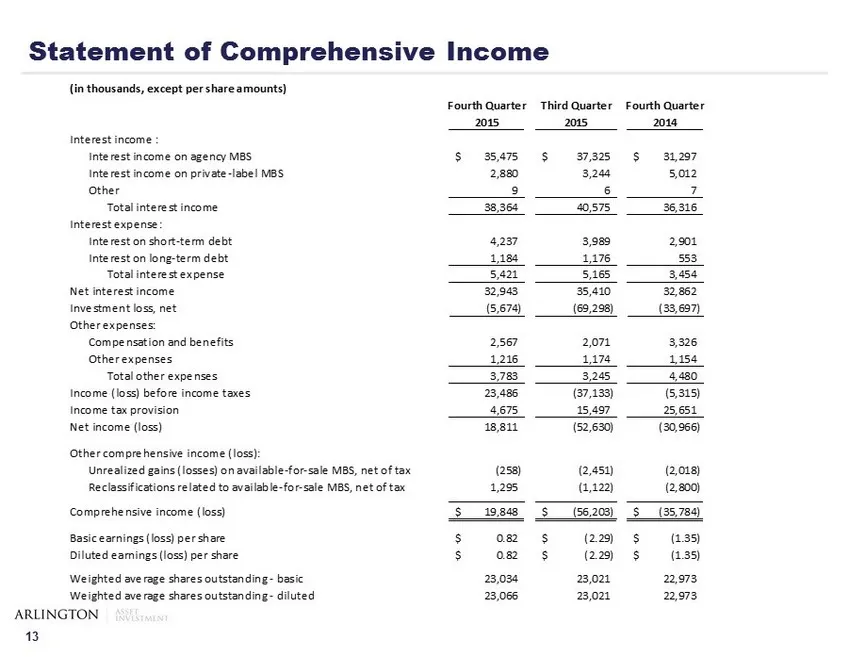
13 Statement of Comprehensive Income (in thousands, except per share amounts) Fourth Quarter Third Quarter Fourth Quarter 2015 2015 2014 Interest income : Interest income on agency MBS 35,475$ 37,325$ 31,297$ Interest income on private-label MBS 2,880 3,244 5,012 Other 9 6 7 Total interest income 38
Slide 15: Core Operating Income
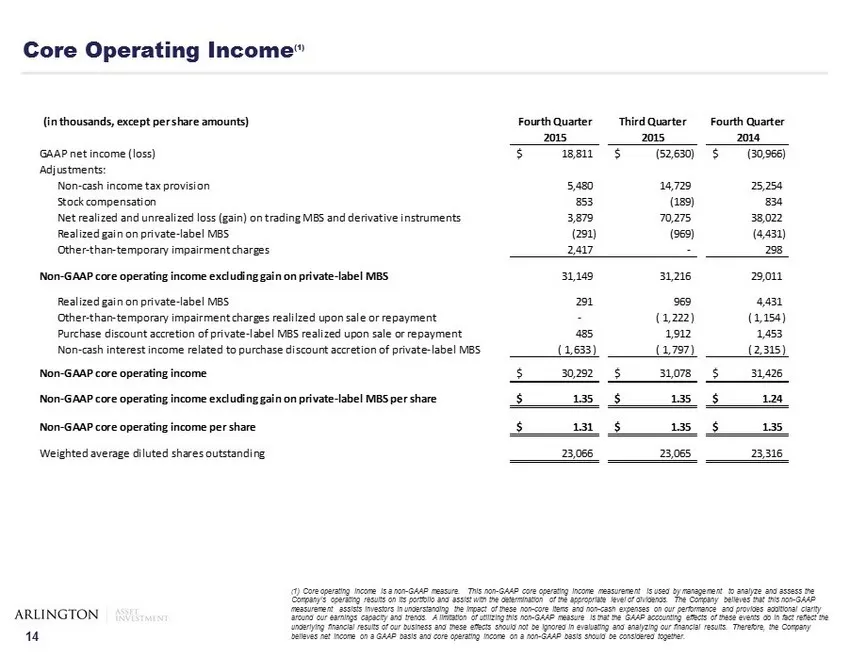
14 Core Operating Income (1 ) ( 1) Core operating income is a non - GAAP measure. This non - GAAP core operating income measurement is used by management to analyz e and assess the Company’s operating results on its portfolio and assist with the determination of the appropriate level of dividends. T
Slide 16: TBA Agency Investment Portfolio
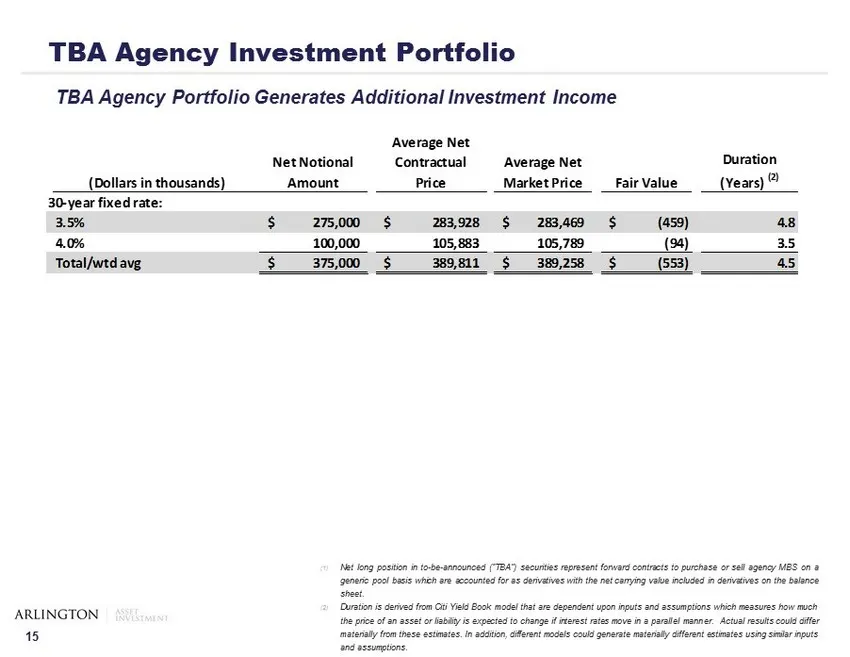
15 TBA Agency Investment Portfolio (1) Net long position in to - be - announced (“TBA”) securities represent forward contracts to purchase or sell agency MBS on a generic pool basis which are accounted for as derivatives with the net carrying value included in derivatives on the balance sheet . (2)
Slide 17: Disclaimer
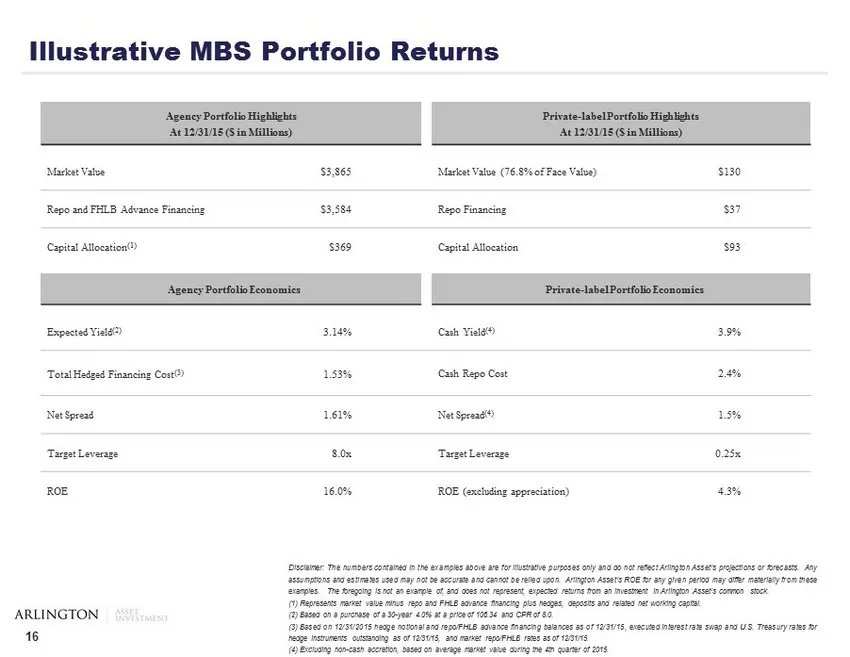
16 Disclaimer : The numbers contained in the examples above are for illustrative purposes only and do not reflect Arlington Asset’s projections or forecasts . Any assumptions and estimates used may not be accurate and cannot be relied upon . Arlington Asset’s ROE for any given period may differ mate
Slide 18: Historical Performance
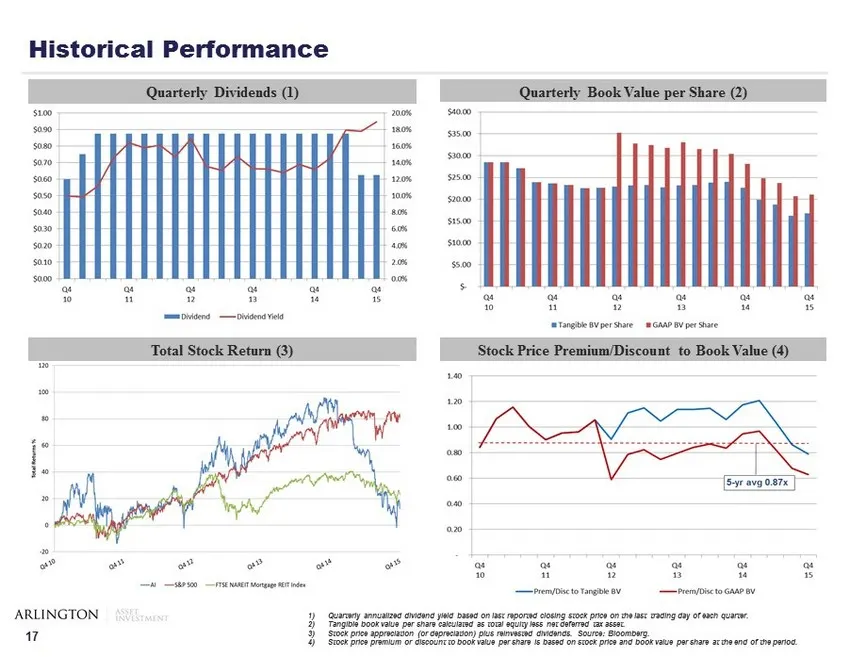
17 Historical Performance Quarterly Dividends (1) Quarterly Book Value per Share (2) Stock Price Premium/Discount to Book Value (4) 1) Quarterly annualized dividend yield based on last reported closing stock price on the last trading day of each quarter . 2) Tangible book value per share calculated
Slide 19: Management Team
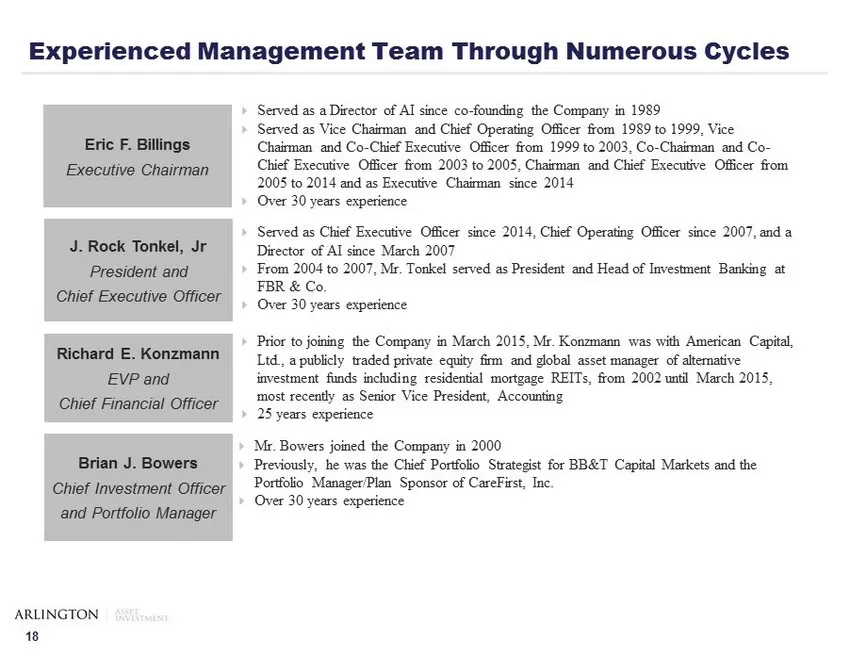
18 ; Served as a Director of AI since co - founding the Company in 1989 ; Served as Vice Chairman and Chief Operating Officer from 1989 to 1999, Vice Chairman and Co - Chief Executive Officer from 1999 to 2003, Co - Chairman and Co - Chief Executive Officer from 2003 to 2005, Chairman and Chief Exec
Source: SEC EDGAR · 8-K filed Feb 3, 2016
More decks from Arlington Asset Investment Corp
 Q3 2023 Earnings Presentation12 slides · Nov 13, 2023
 Q2 2023 Earnings Presentation12 slides · Aug 14, 2023
 Q1 2023 Earnings Presentation16 slides · May 15, 2023
 Q4 2022 Earnings Presentation20 slides · Mar 31, 2023
 Q3 2022 Earnings Presentation29 slides · Nov 15, 2022
 Q2 2022 Earnings Presentation31 slides · Aug 10, 2022