Rocket Pharmaceuticals, Inc. · NASDAQ:RCKT
Rocket Pharmaceuticals — Investor Presentation (September 2018)
34 slides from Rocket Pharmaceuticals's investor presentation, September 2018

Slide 1: September 2018
September 2018
Slide 2: Important Information
Important Information Cautionary Statement Regarding Forward-Looking Statements Various statements in this release concerning Rocket’s future expectations, plans and prospects, including without limitation, Rocket’s expectations regarding the safety, effectiveness and timing of product candidates th
Slide 3: About Rocket Pharma
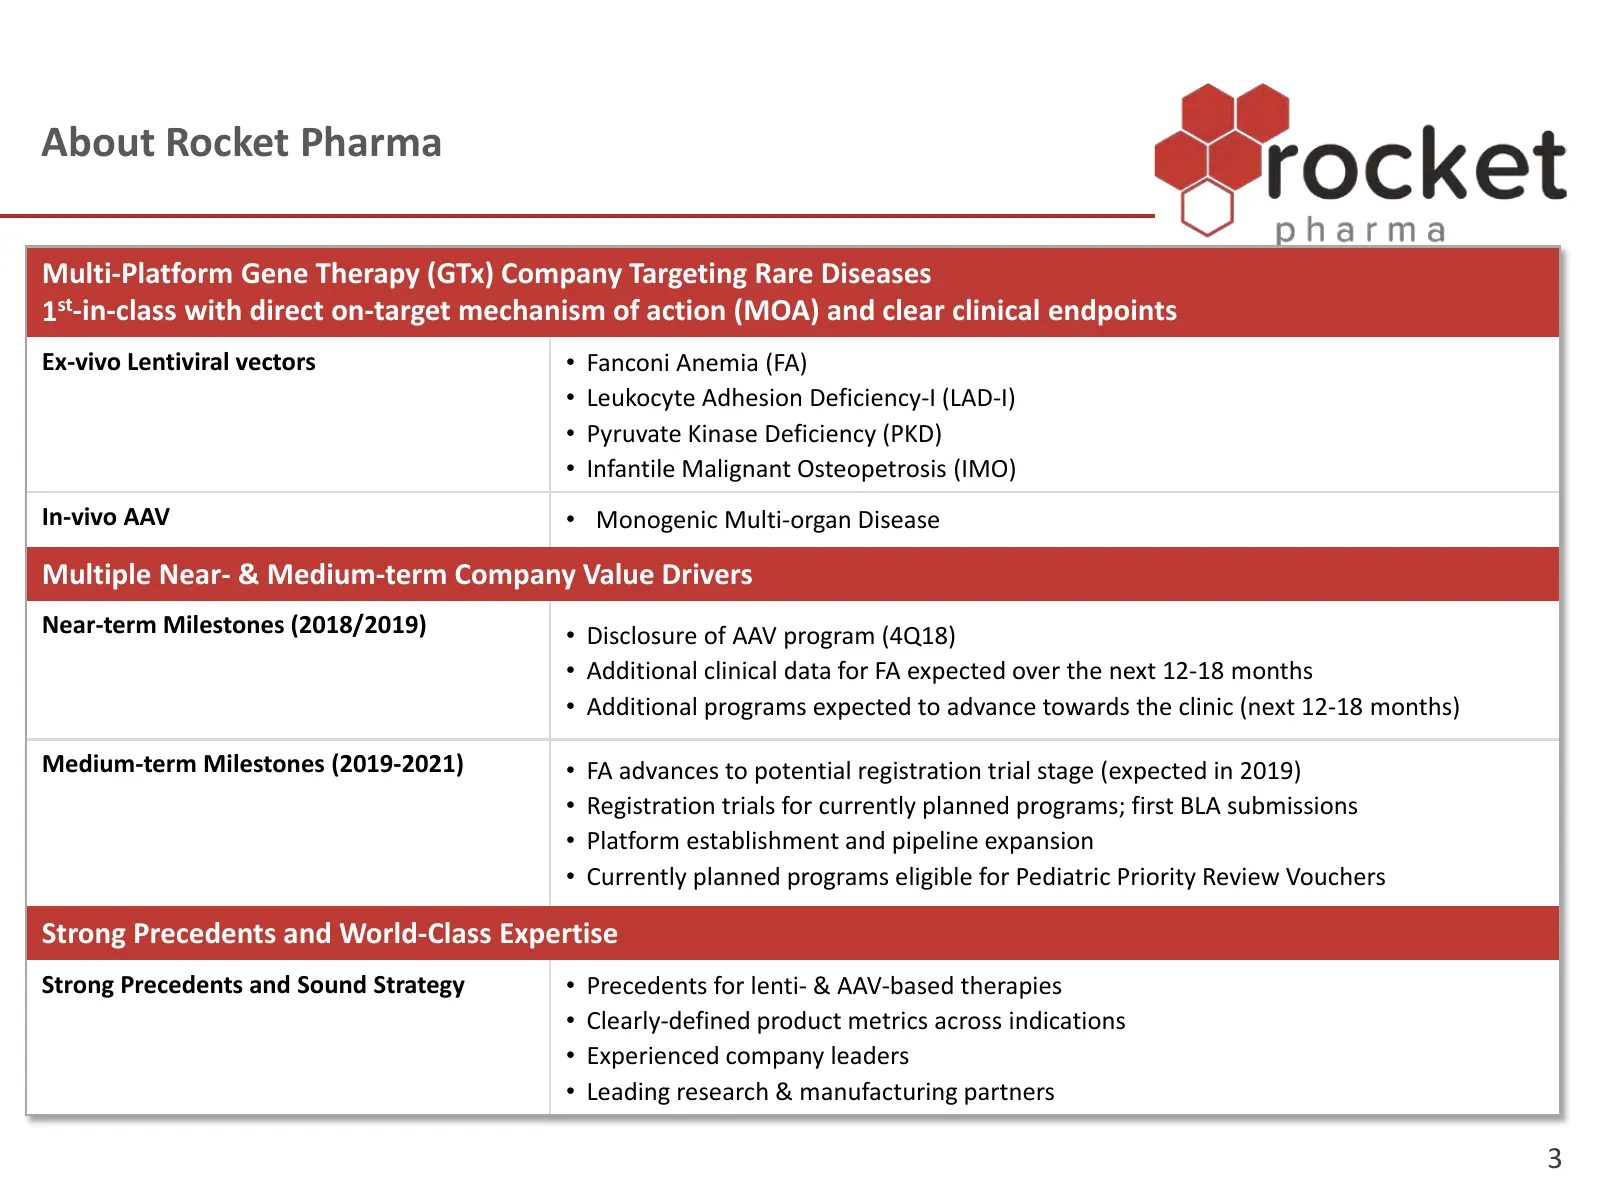
About Rocket Pharma Multi-Platform Gene Therapy (GTx) Company Targeting Rare Diseases 1st-in-class with direct on-target mechanism of action (MOA) and clear clinical endpoints Ex-vivo Lentiviral vectors • Fanconi Anemia (FA) • Leukocyte Adhesion Deficiency-I (LAD-I) • Pyruvate Kinase Deficiency (PKD
Slide 4: Leadership Team - Expertise in GTx & Rare Diseases
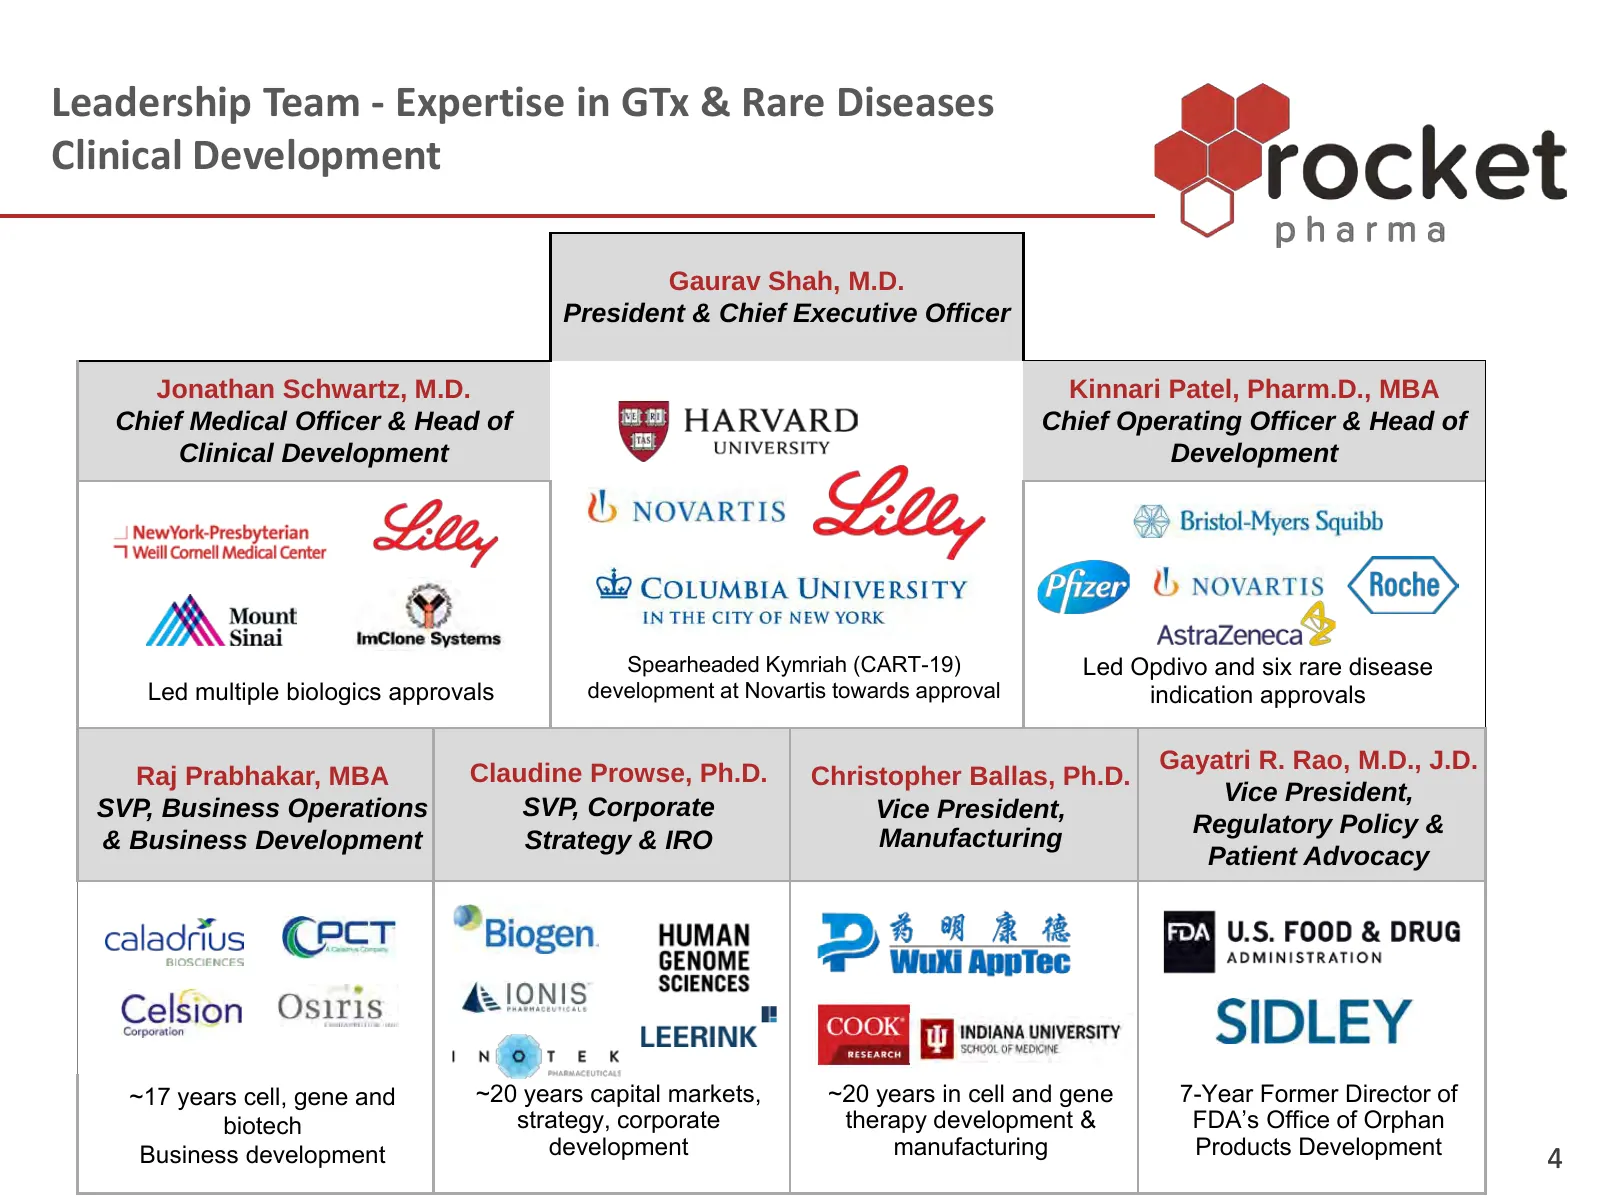
Leadership Team - Expertise in GTx & Rare Diseases Clinical Development Gaurav Shah, M.D. President & Chief Executive Officer Jonathan Schwartz, M.D. Kinnari Patel, Pharm.D., MBA Chief Medical Officer & Head of Chief Operating Officer & Head of Clinical Development Development Spearheaded Kymriah (C
Slide 5: Pipeline
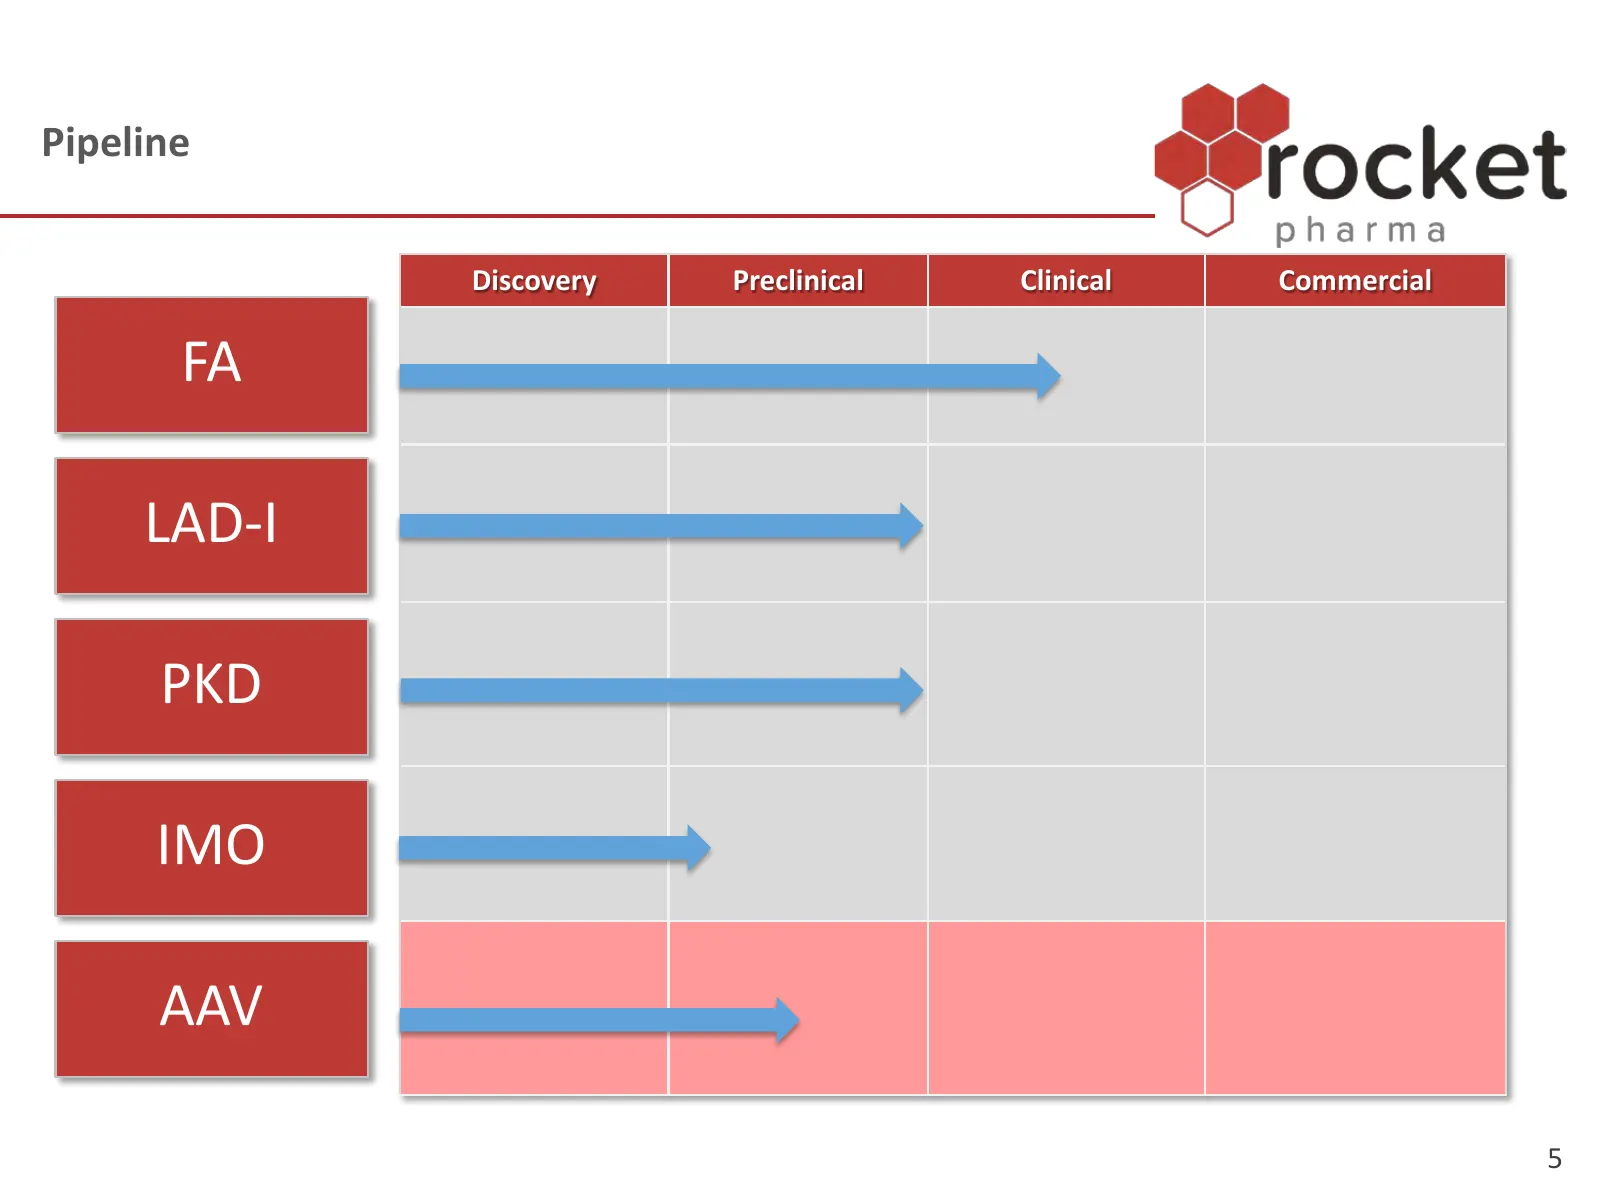
Pipeline Discovery Preclinical Clinical Commercial FA LAD-I PKD IMO AAV 5
Slide 6: Leveraging the Full Spectrum of GTx Platforms
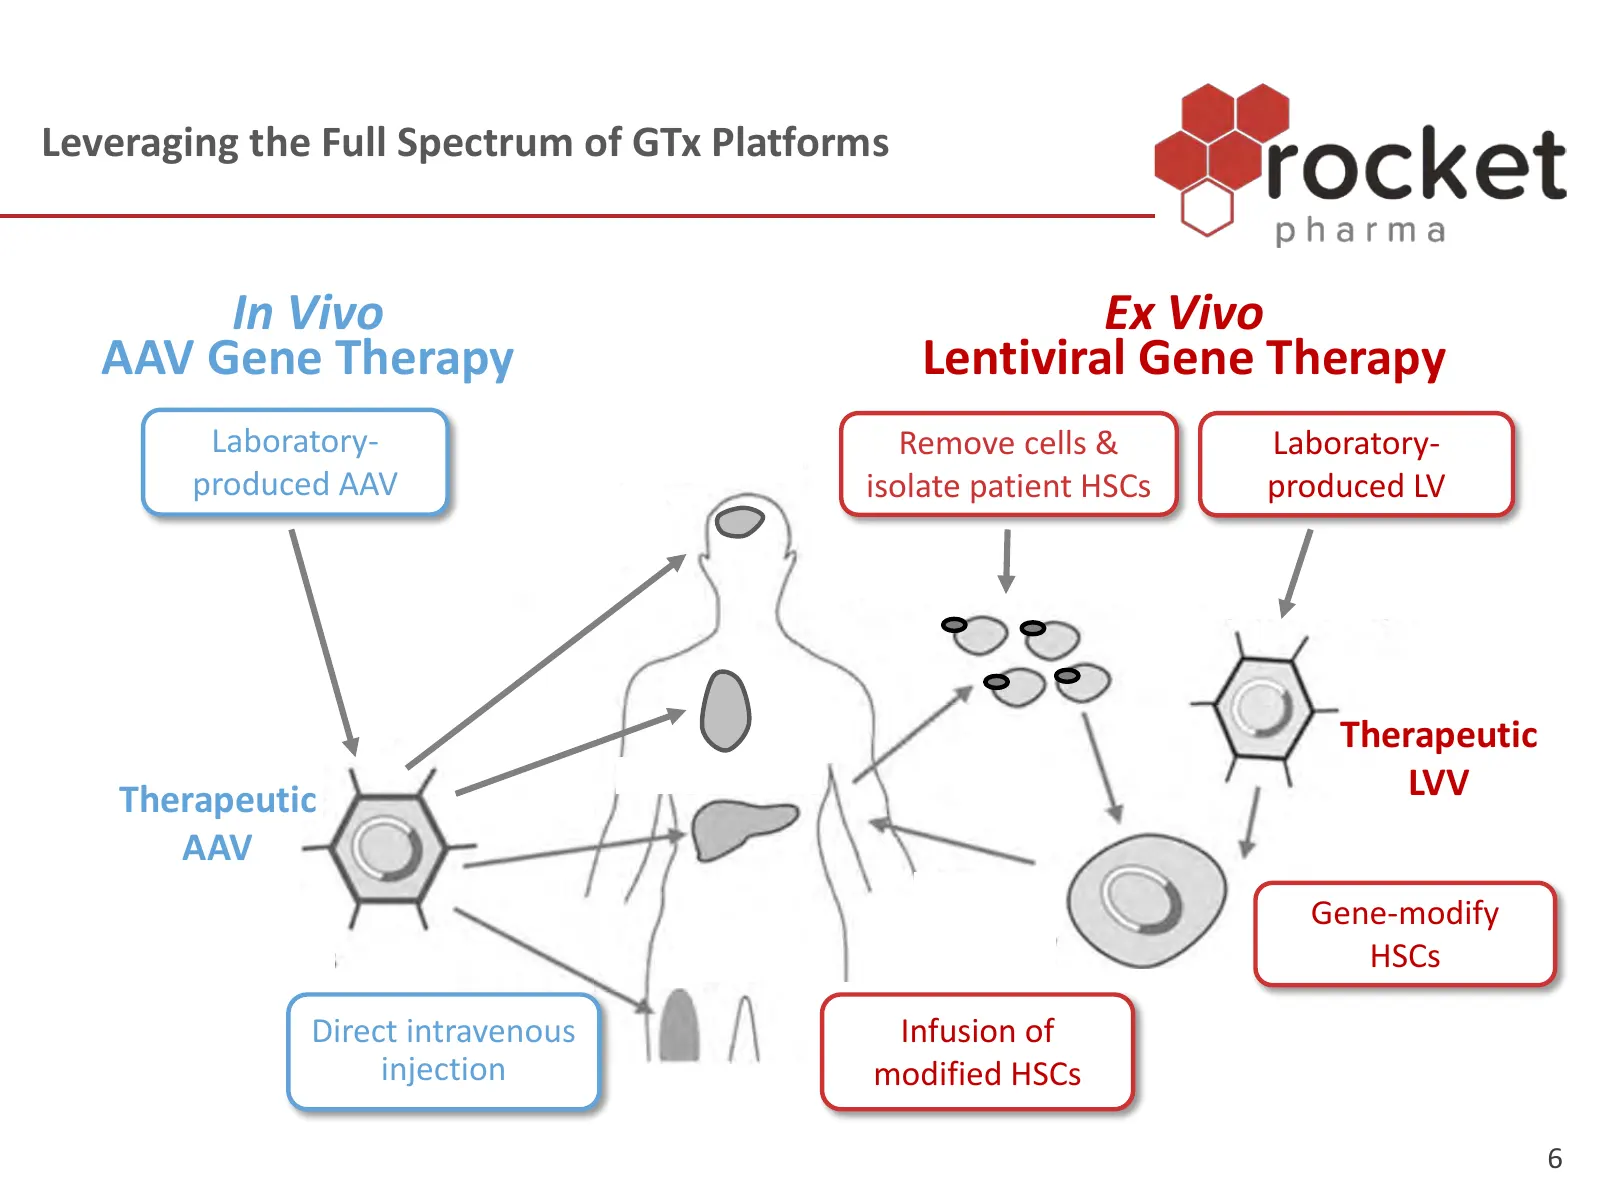
Leveraging the Full Spectrum of GTx Platforms In Vivo Ex Vivo AAV Gene Therapy Lentiviral Gene Therapy Laboratory- Remove cells & Laboratory- produced AAV isolate patient HSCs produced LV Therapeutic Therapeutic LVV AAV Gene-modify HSCs Direct intravenous Infusion of injection modified HSCs 6
Slide 7: Fanconi Anemia (FA)
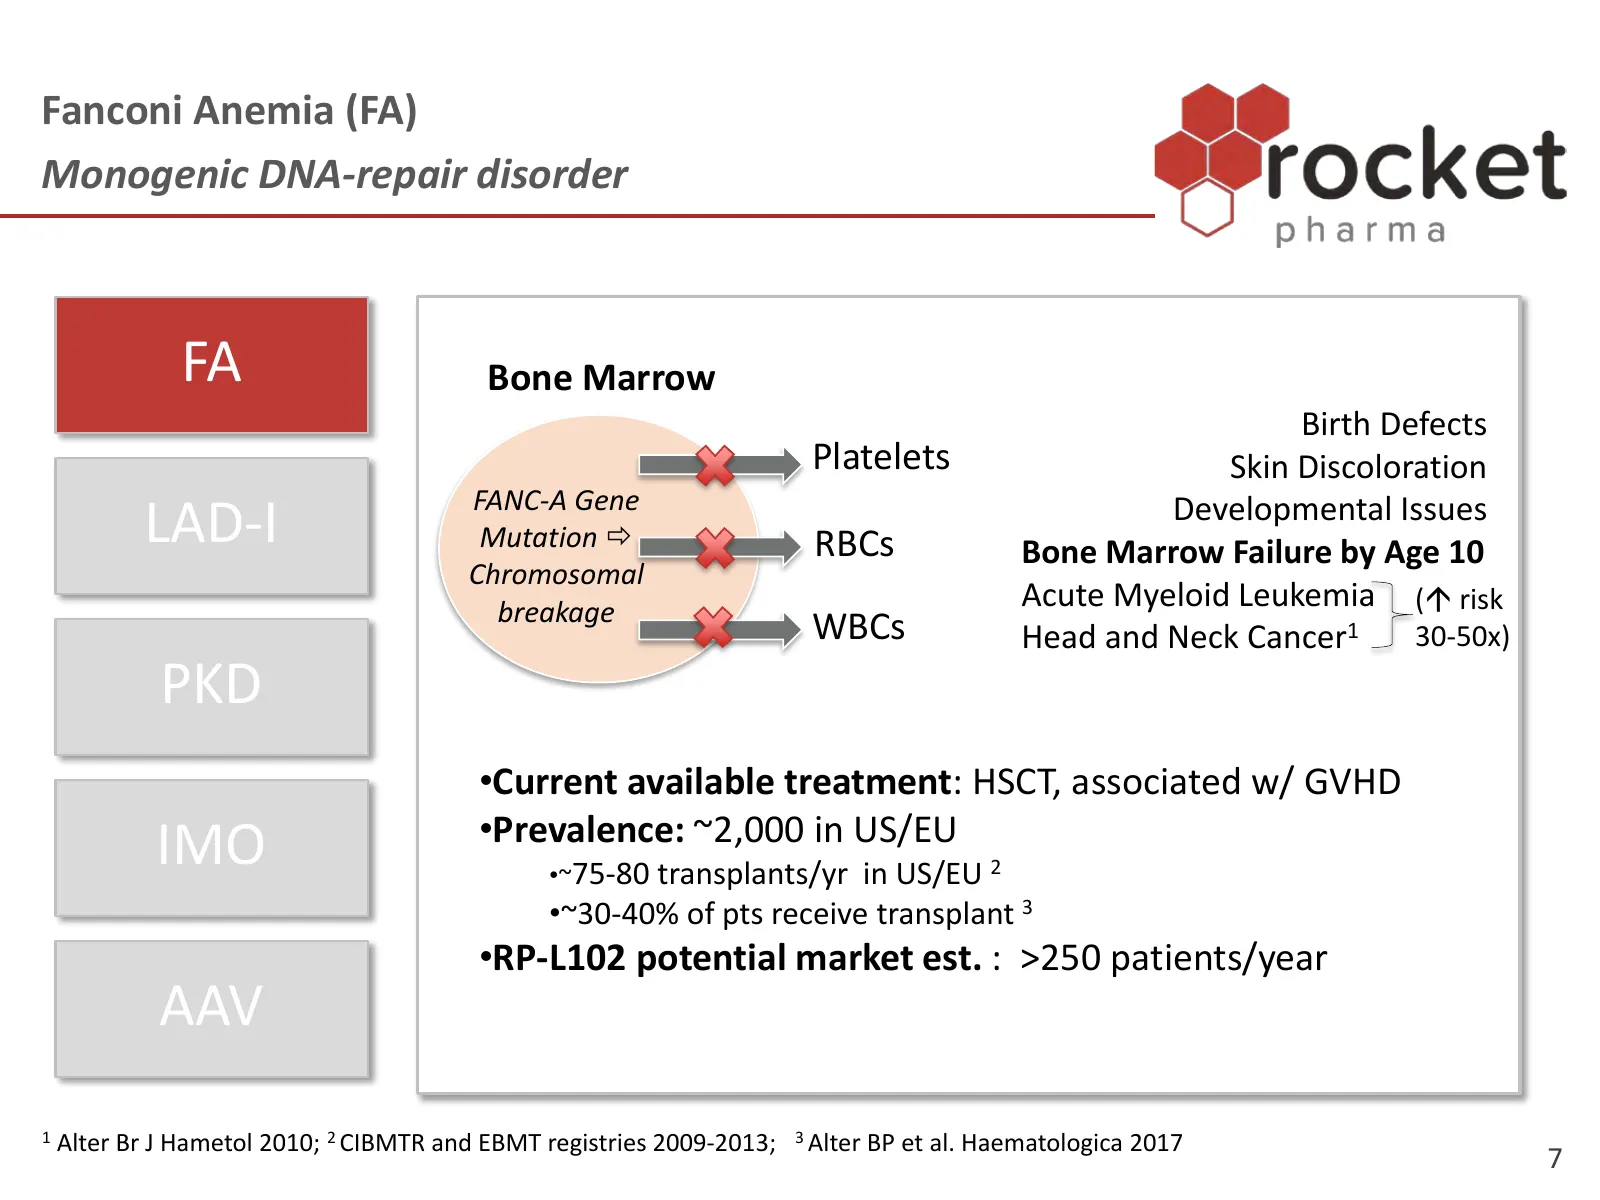
Fanconi Anemia (FA) Monogenic DNA-repair disorder FA Bone Marrow Birth Defects Platelets Skin Discoloration FANC-A Gene LAD-I Mutation RBCs Developmental Issues Bone Marrow Failure by Age 10 Chromosomal breakage Acute Myeloid Leukemia ( risk WBCs Head and Neck Cancer1 30-50x) PKD •Current availab
Slide 8: Rationale for Gene Therapy in FA: Somatic Mosaicism
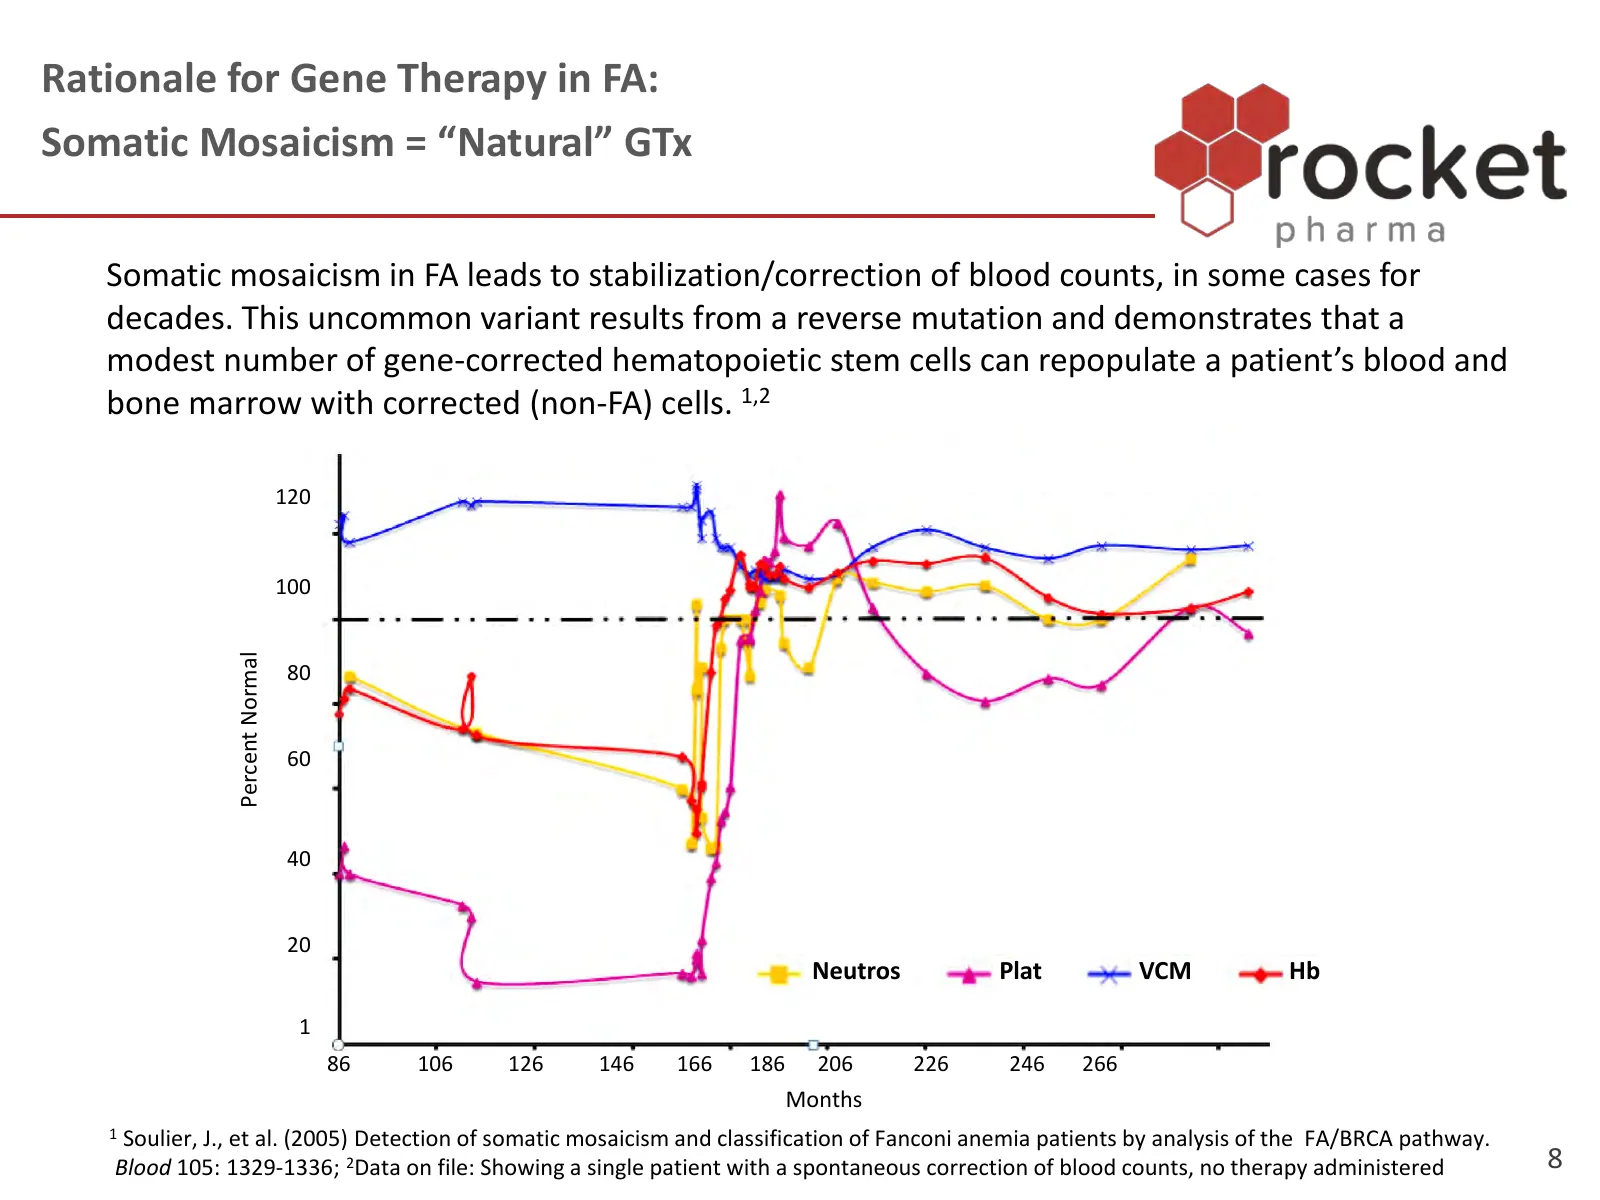
Rationale for Gene Therapy in FA: Somatic Mosaicism = “Natural” GTx Somatic mosaicism in FA leads to stabilization/correction of blood counts, in some cases for decades. This uncommon variant results from a reverse mutation and demonstrates that a modest number of gene-corrected hematopoietic stem c
Slide 9: Gene Therapy Value Proposition: Early, Low-toxicity Intervention
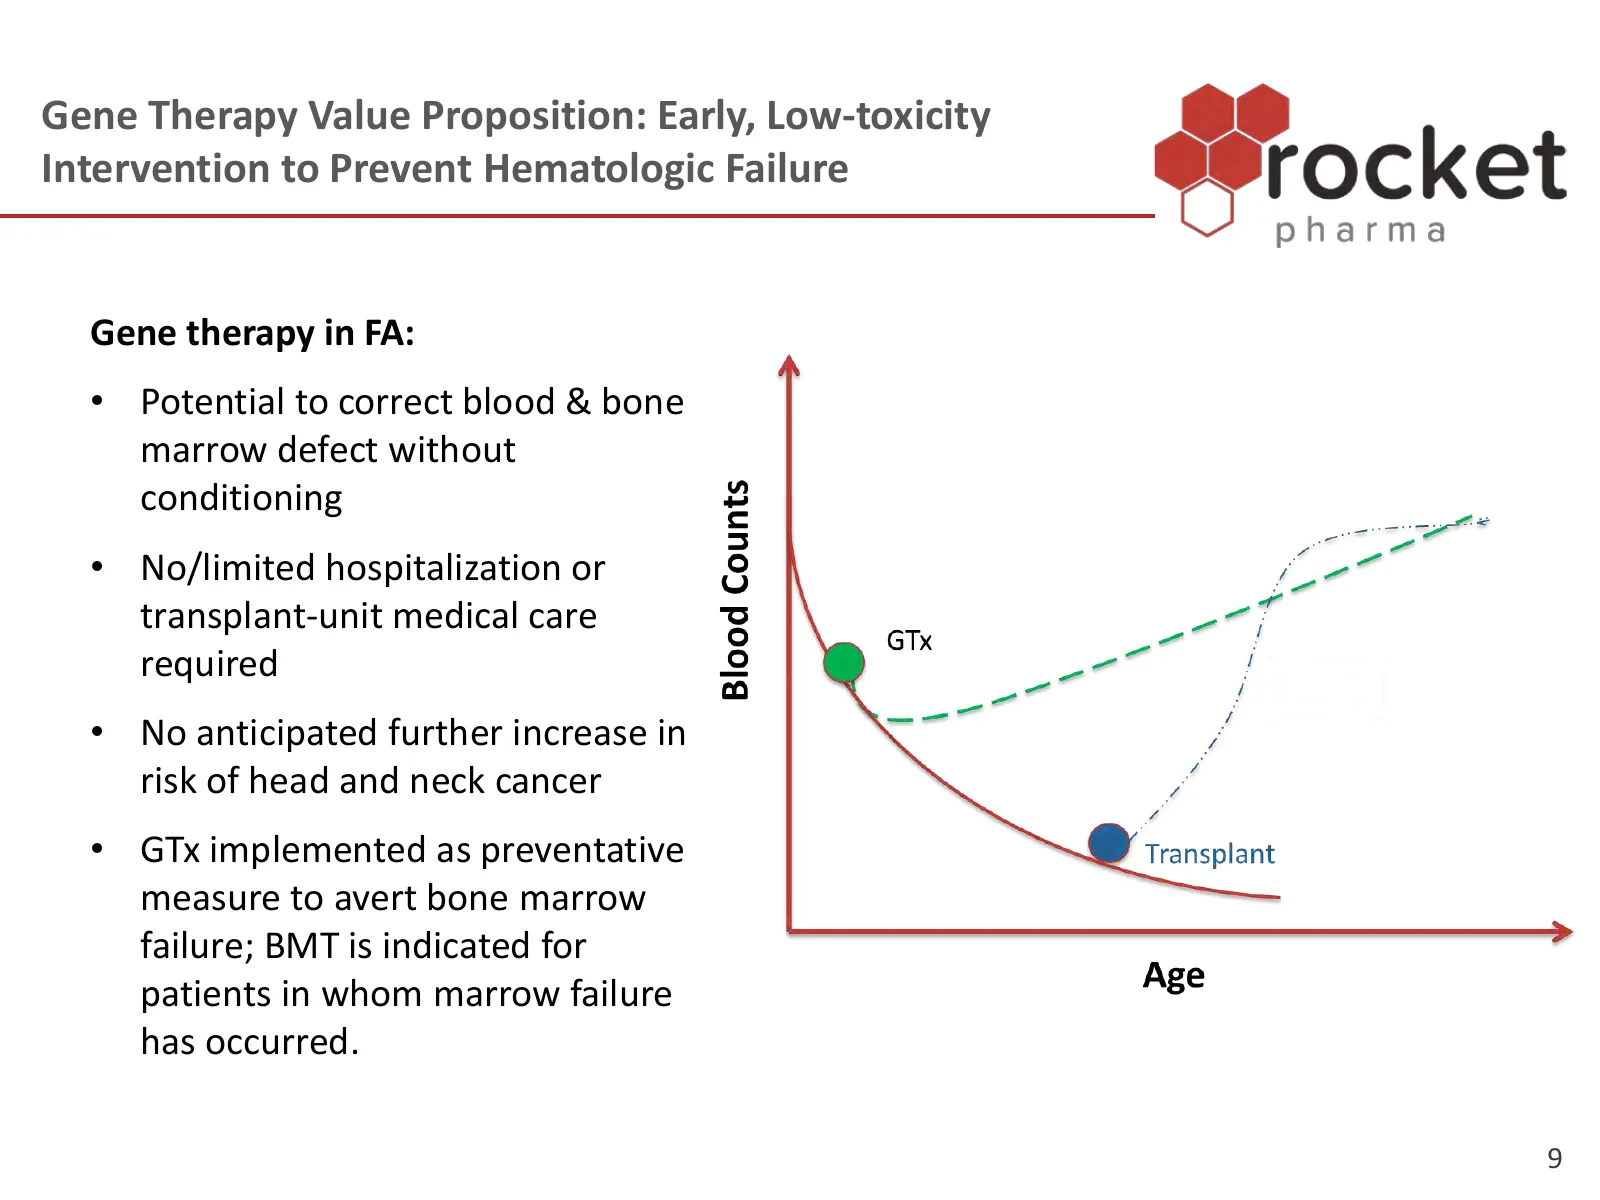
Gene Therapy Value Proposition: Early, Low-toxicity Intervention to Prevent Hematologic Failure Gene therapy in FA: • Potential to correct blood & bone marrow defect without conditioning • No/limited hospitalization or transplant-unit medical care required • No anticipated further increase in risk o
Slide 10: Updated Data from Phase 1/2 Gene Therapy Trial of RP-L102 in FA
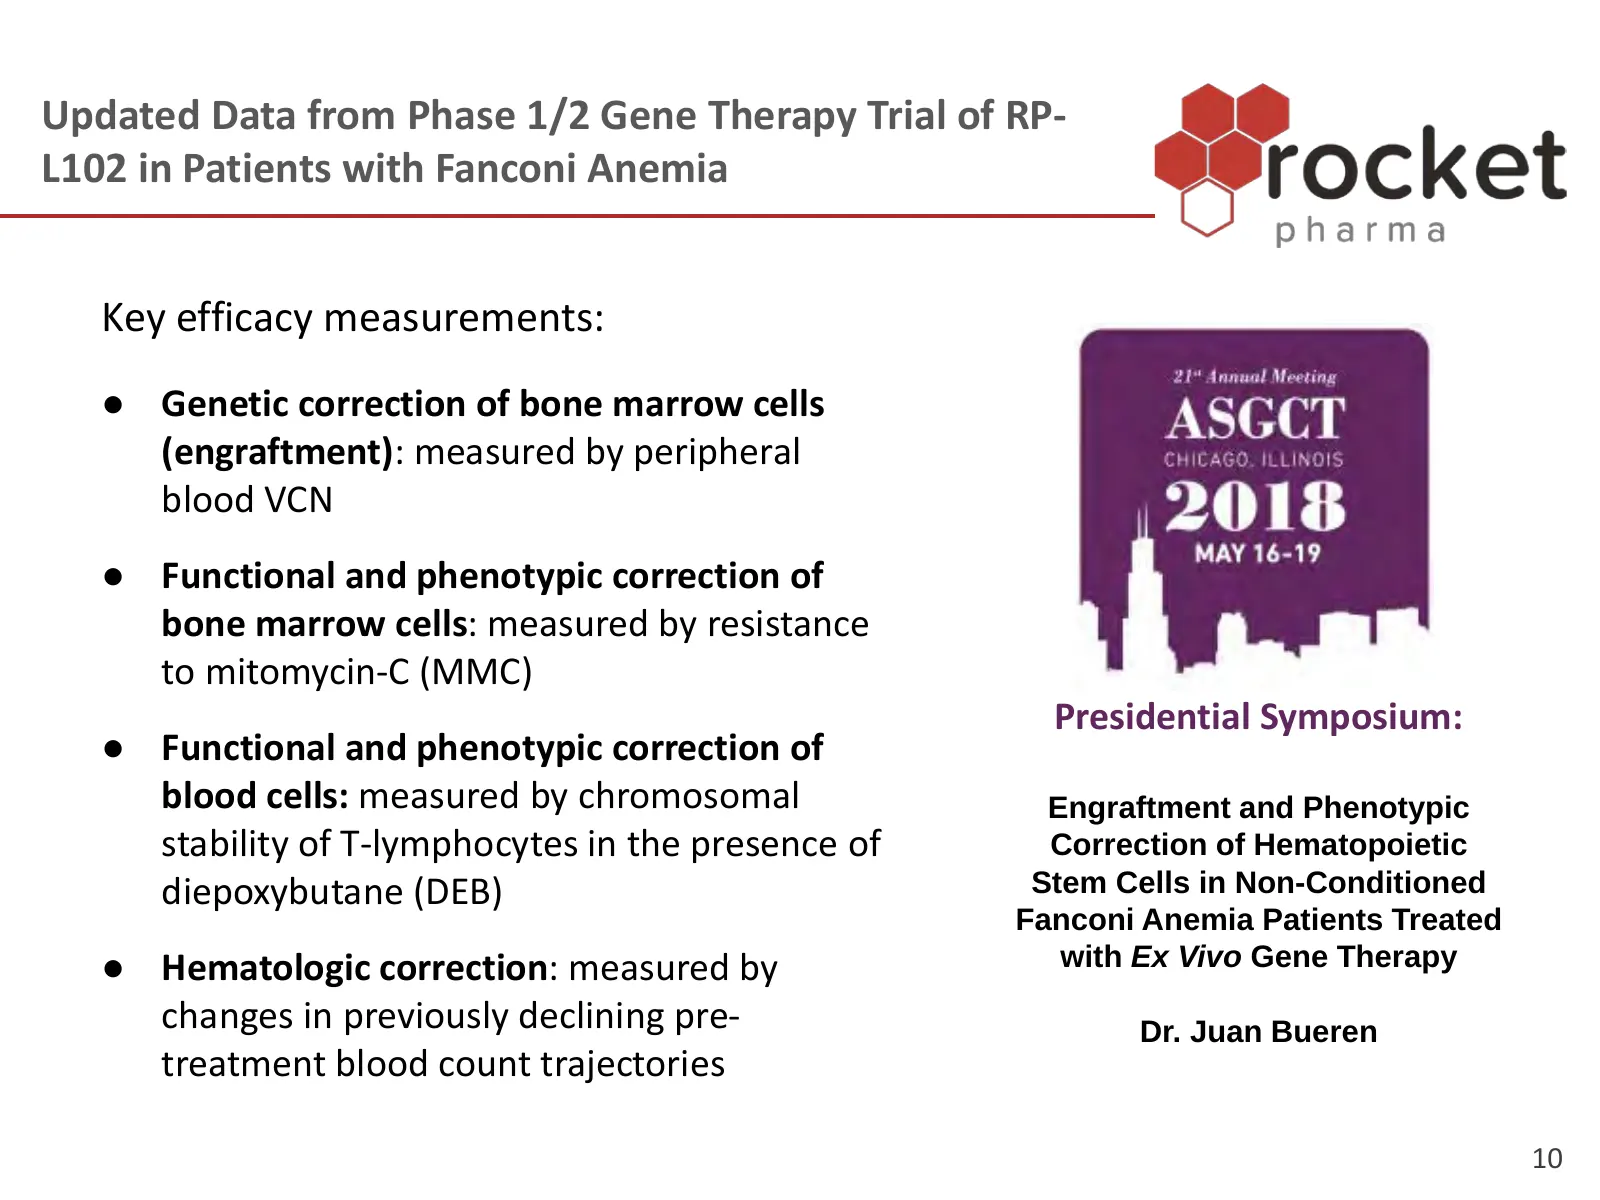
Updated Data from Phase 1/2 Gene Therapy Trial of RP- L102 in Patients with Fanconi Anemia Key efficacy measurements: ● Genetic correction of bone marrow cells (engraftment): measured by peripheral blood VCN ● Functional and phenotypic correction of bone marrow cells: measured by resistance to mitom
Slide 11: Bone Marrow Engraftment: Increasing Levels Confirm Survival Advantage
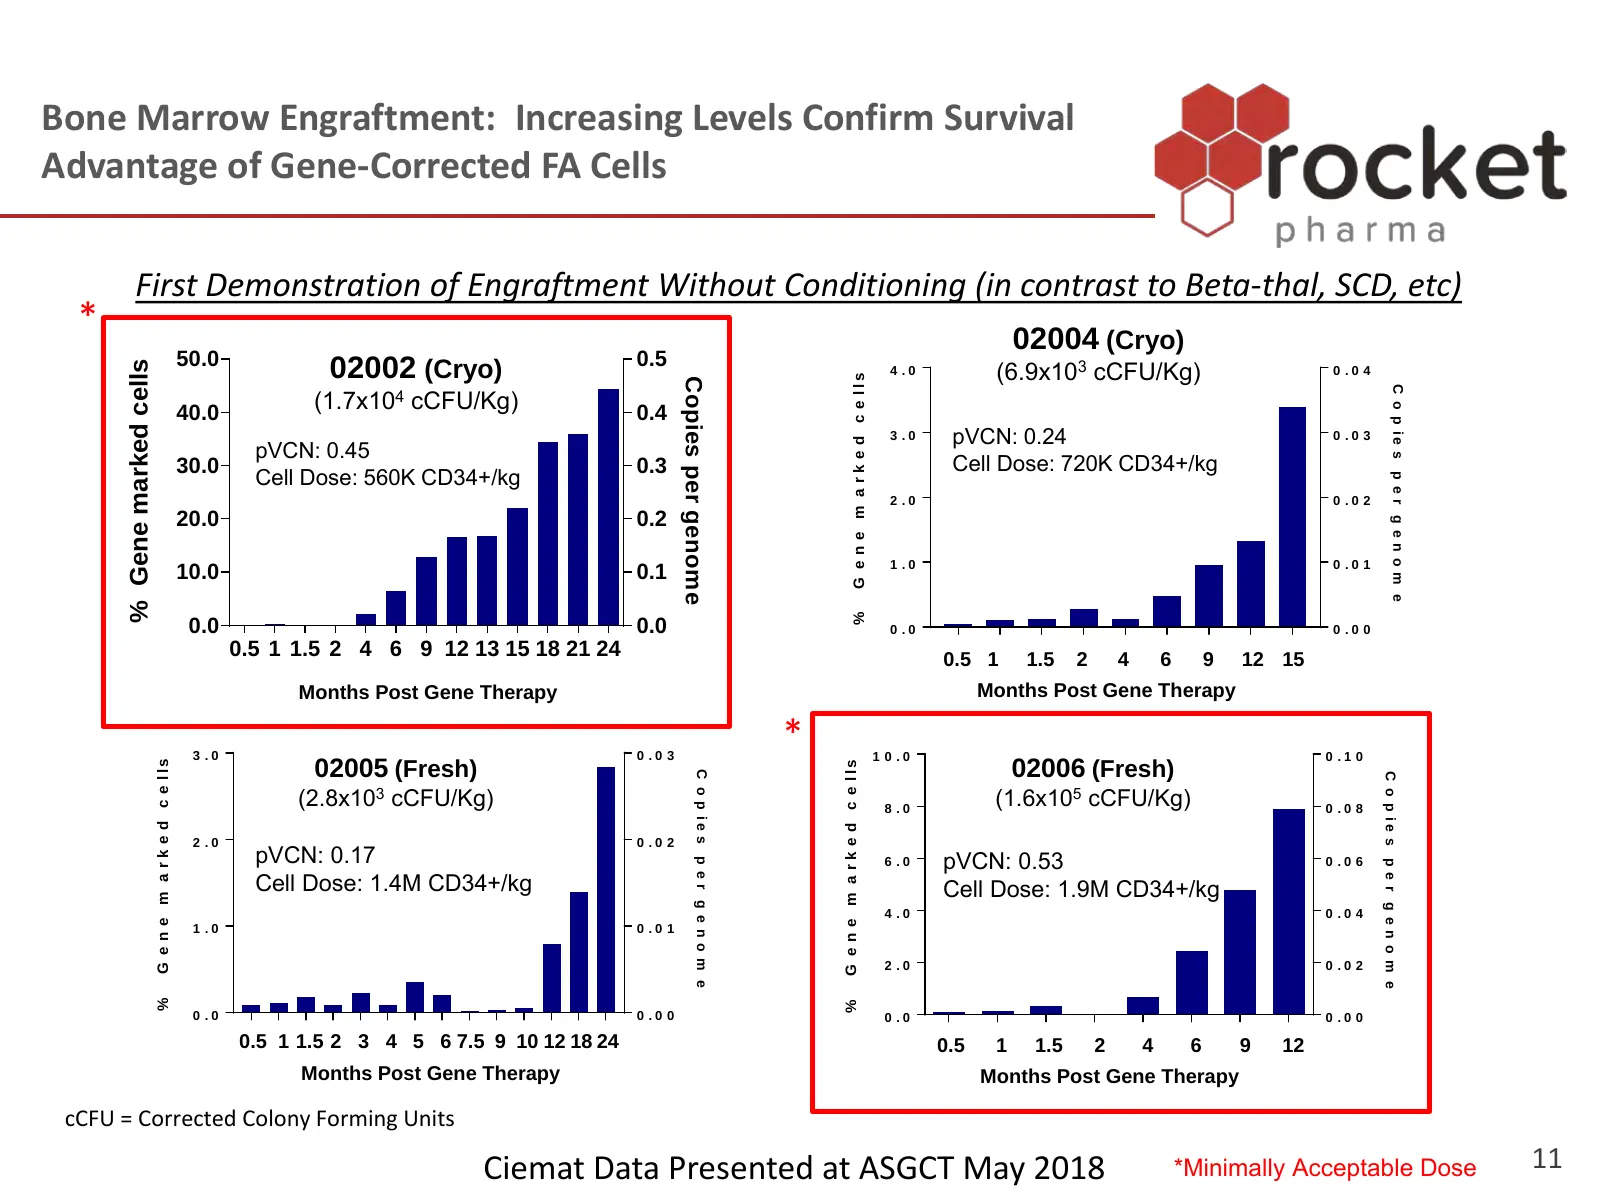
Bone Marrow Engraftment: Increasing Levels Confirm Survival Advantage of Gene-Corrected FA Cells First Demonstration of Engraftment Without Conditioning (in contrast to Beta-thal, SCD, etc) * 02004 (Cryo) 50.0 0.5 02002 (Cryo) (6.9x10³ cCFU/Kg) % Gene marked cells 4 .0 0 .0 4 G e n e m a r k e d c e
Slide 12: Functional Correction of Bone Marrow
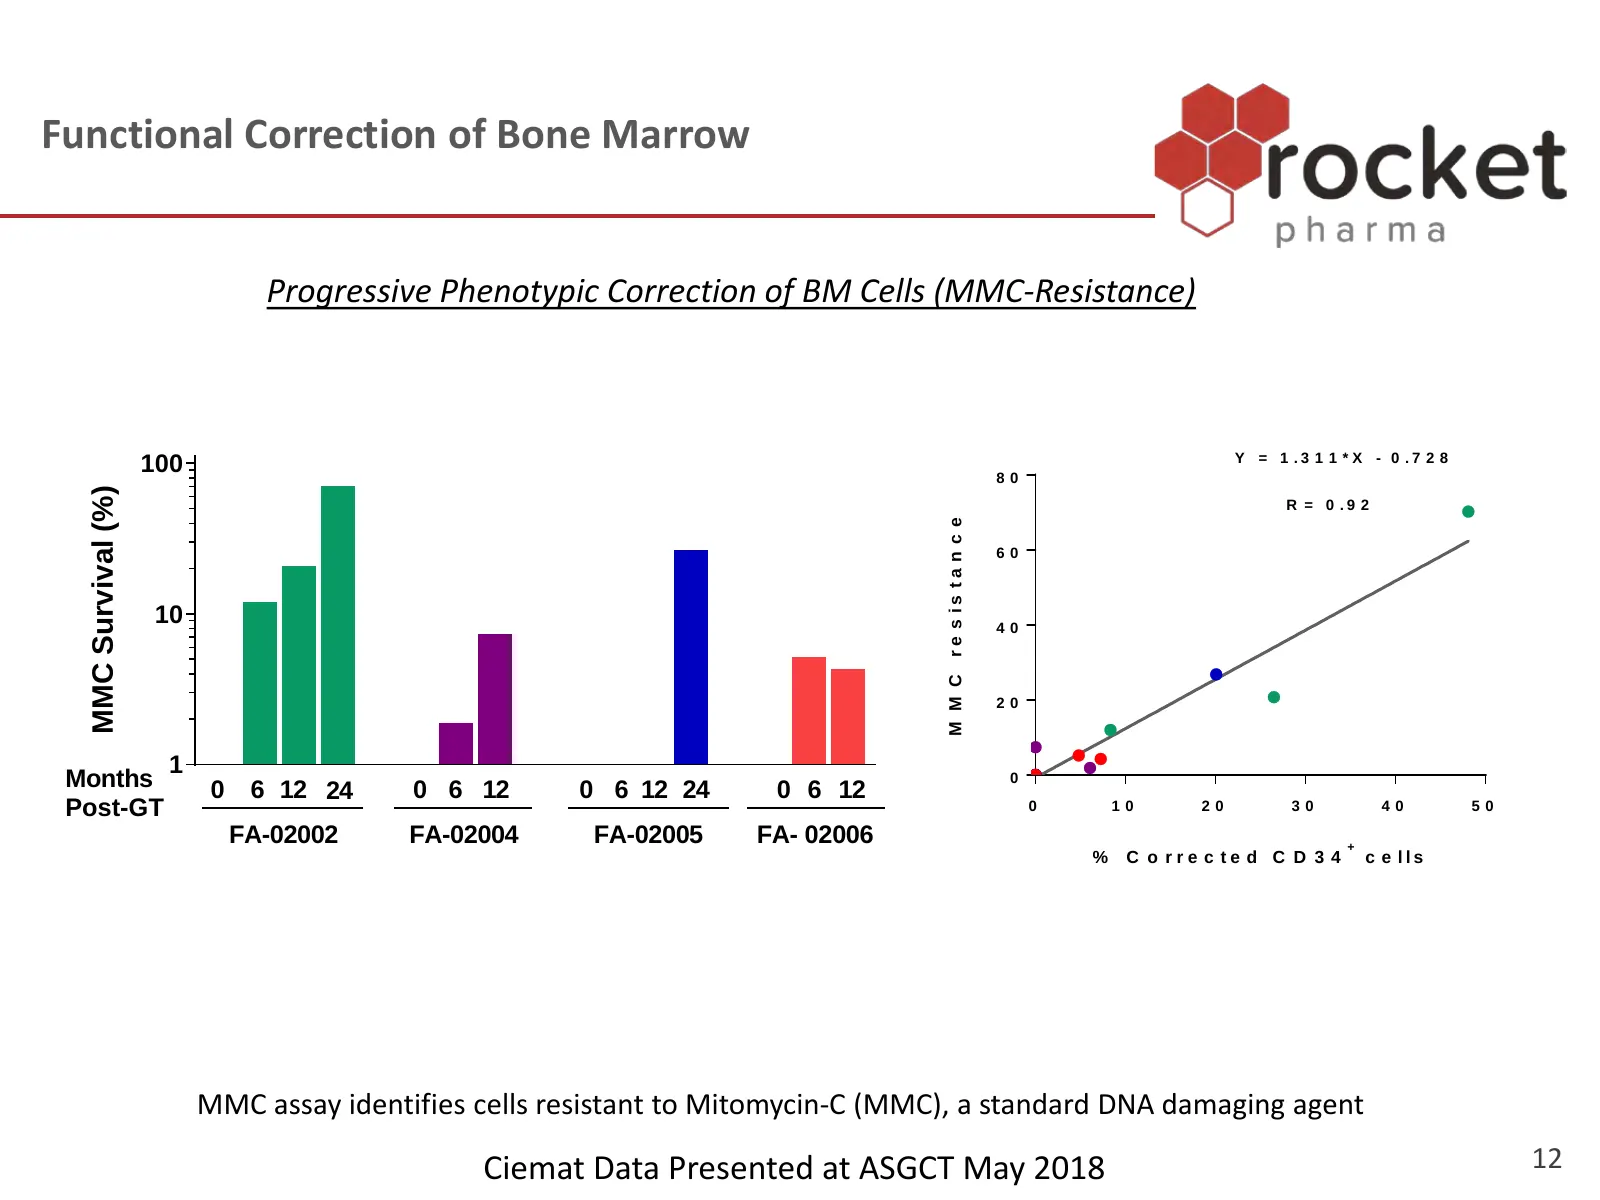
Functional Correction of Bone Marrow Progressive Phenotypic Correction of BM Cells (MMC-Resistance) Y = 1 .3 1 1 * X - 0 .7 2 8 100 80 MMC Survival (%) R = 0 .9 2 M M C r e s is ta n c e 60 10 40 20 1 Months 0 6 12 24 0 6 12 0 6 12 24 0 6 12 0 Post-GT 0 10 20 30 40 50 FA-02002 FA-02004 FA-02005 FA-
Slide 13: Gene Correction of Bone Marrow Stem Cells Across Lineages
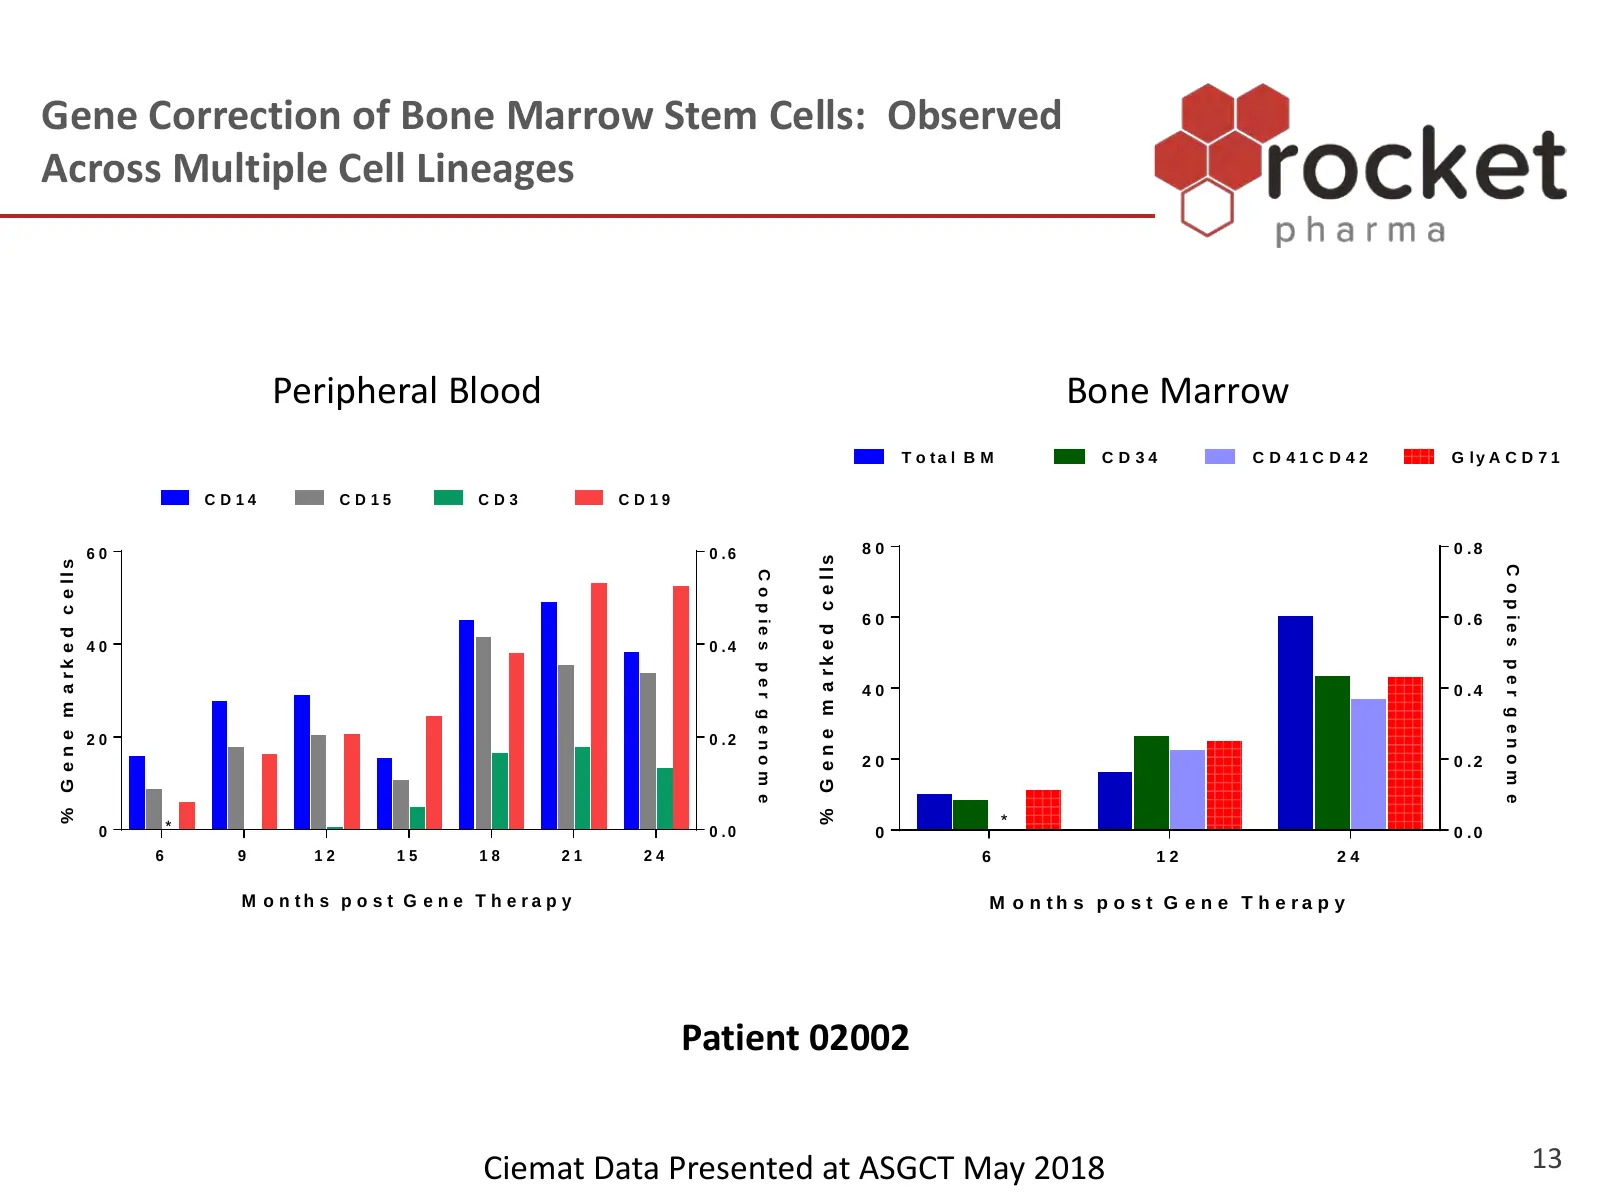
Gene Correction of Bone Marrow Stem Cells: Observed Across Multiple Cell Lineages Peripheral Blood Bone Marrow T o ta l B M C D 34 CD41CD42 G ly A C D 7 1 C D 14 C D 15 CD3 C D 19 60 0 .6 80 0 .8 % G e n e m a r k e d c e lls % G e n e m a r k e d c e lls C o p ie s p e r g e n o m e C o p ie s p e
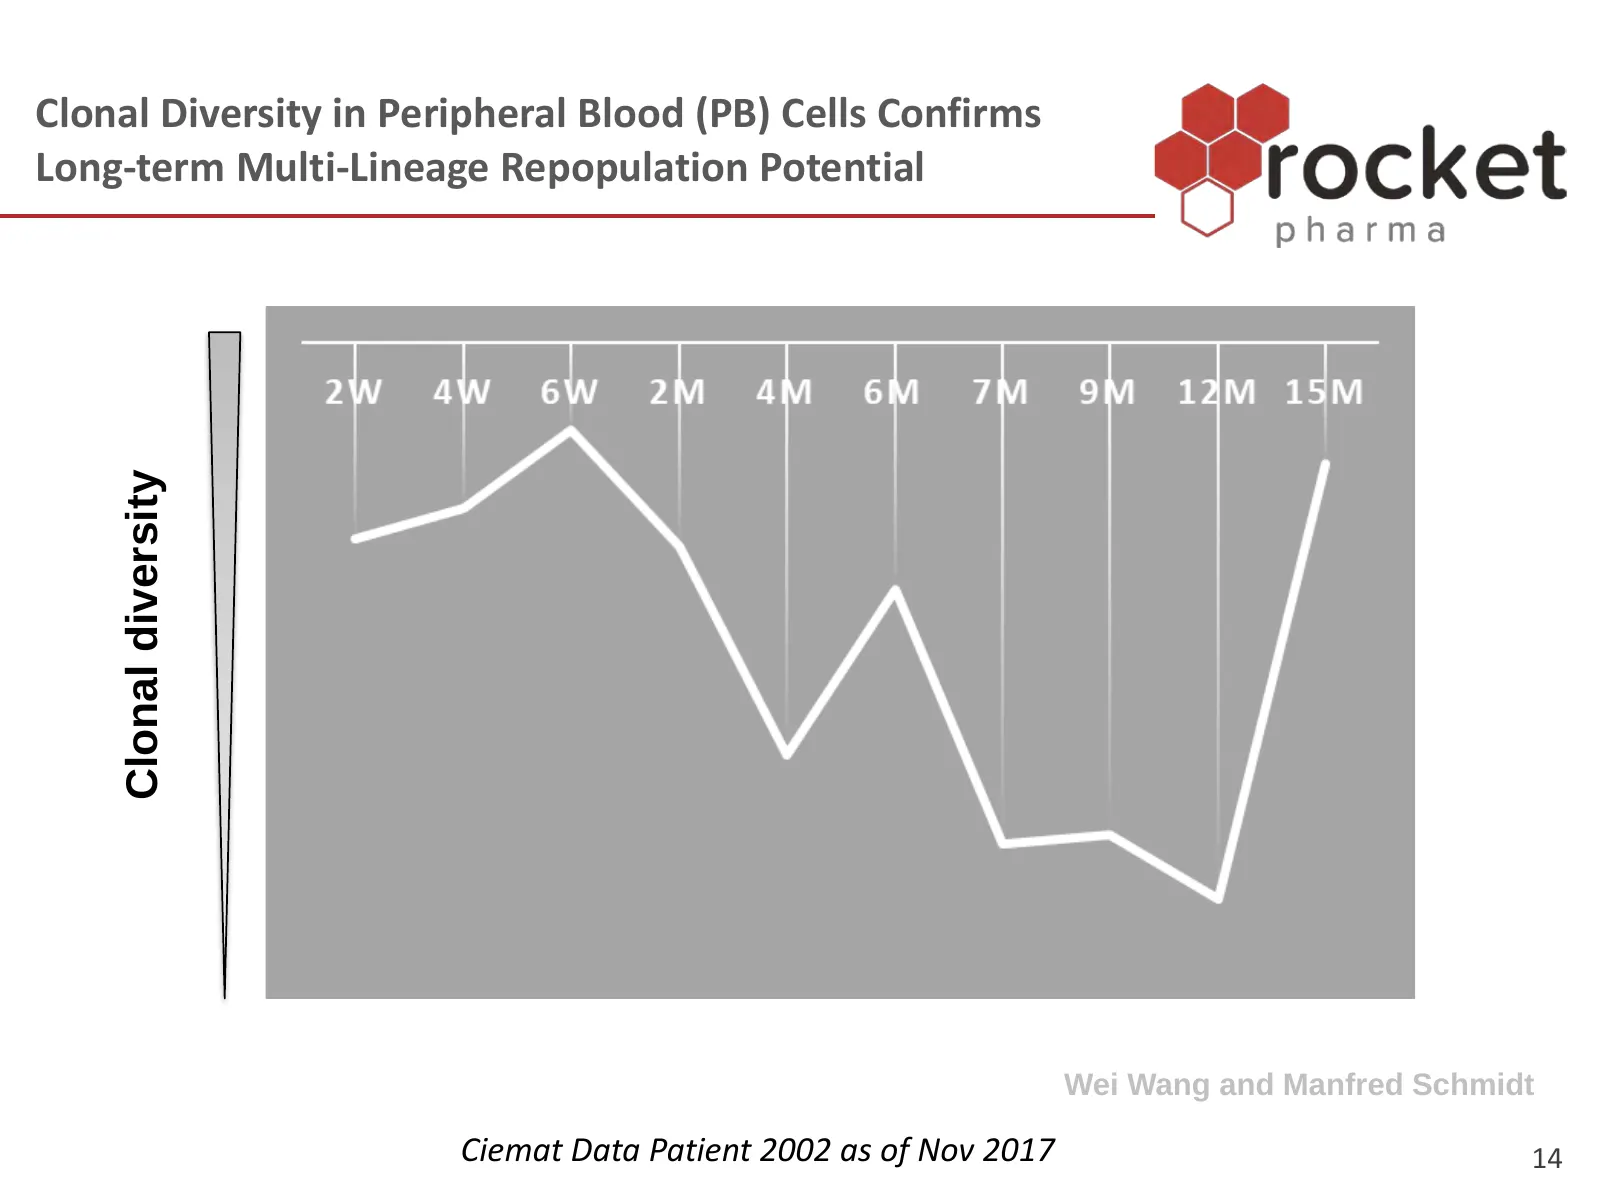
Slide 14: Clonal Diversity Confirms Long-term Multi-Lineage Repopulation
Clonal Diversity in Peripheral Blood (PB) Cells Confirms Long-term Multi-Lineage Repopulation Potential Clonal diversity Wei Wang and Manfred Schmidt Ciemat Data Patient 2002 as of Nov 2017 14
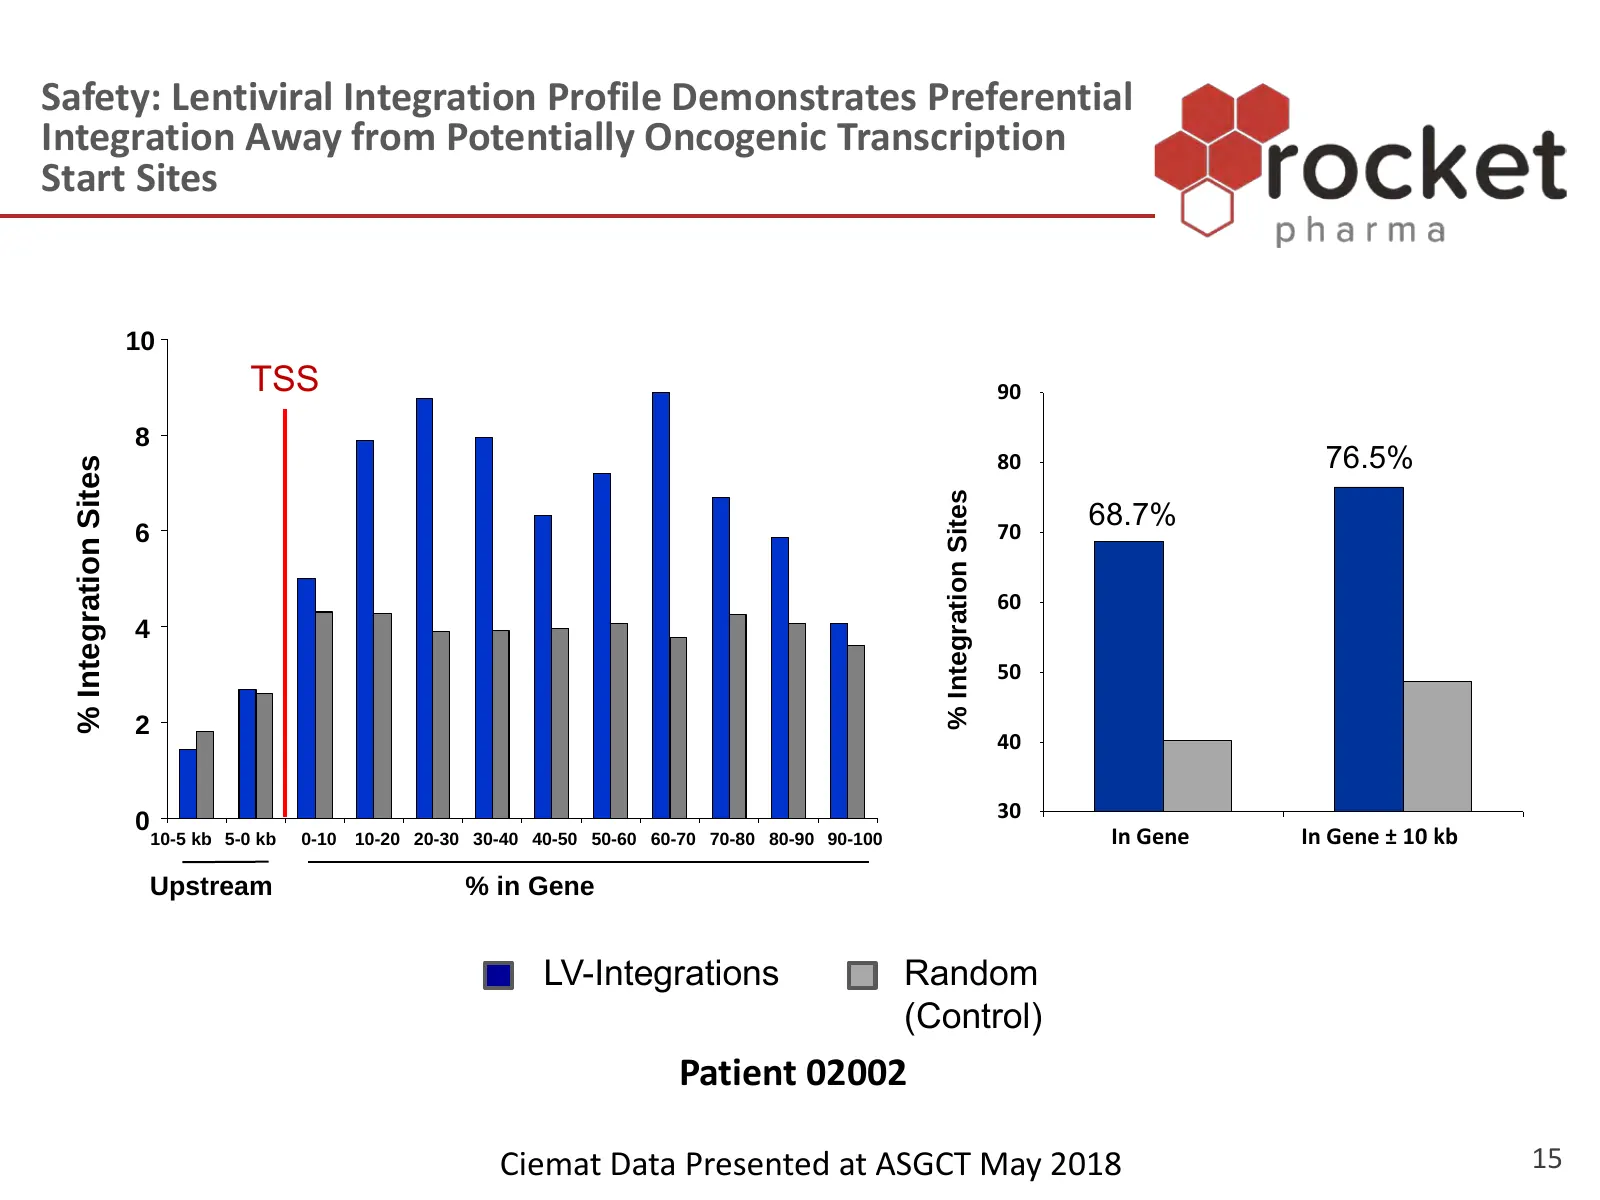
Slide 15: Safety: Lentiviral Integration Profile
Safety: Lentiviral Integration Profile Demonstrates Preferential Integration Away from Potentially Oncogenic Transcription Start Sites 10 TSS 90 8 80 76.5% % Integration Sites % Integration Sites 70 68.7% 6 60 4 50 2 40 0 30 10-5 kb 5-0 kb 0-10 10-20 20-30 30-40 40-50 50-60 60-70 70-80 80-90 90-100
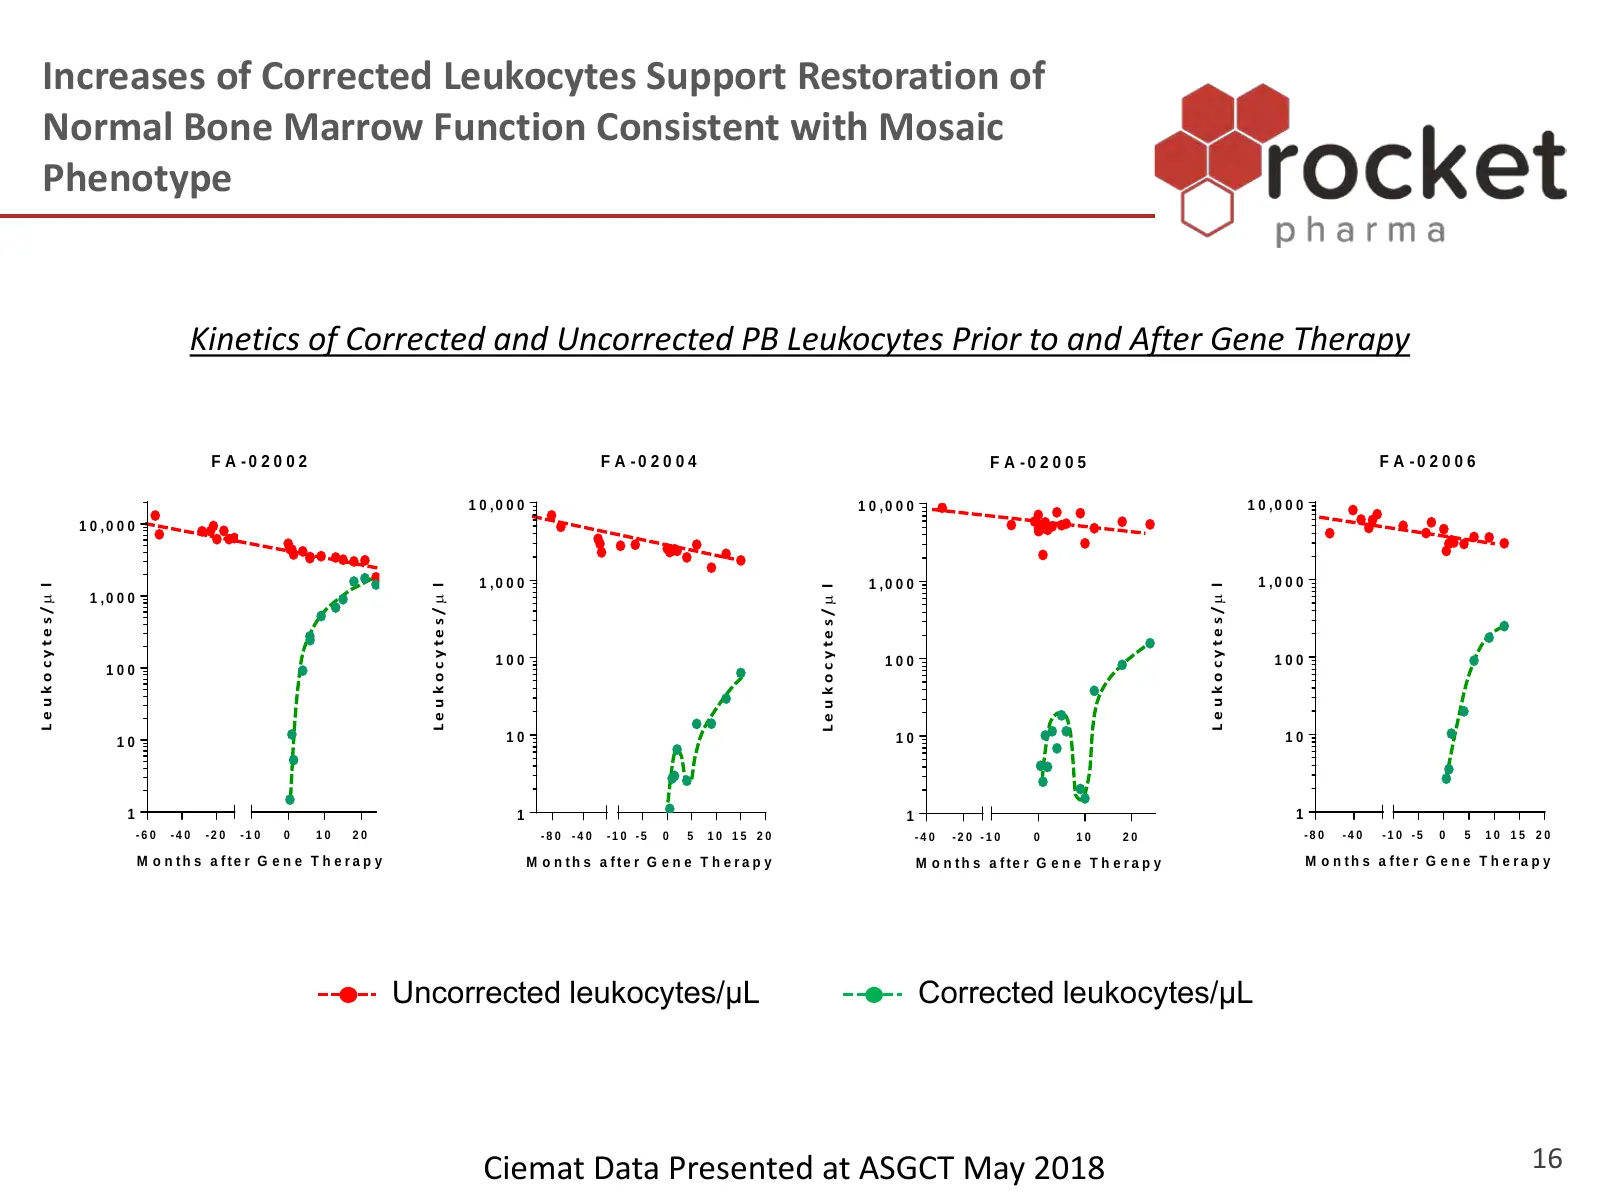
Slide 16: Increases of Corrected Leukocytes Support Restoration of Bone Marrow Function
Increases of Corrected Leukocytes Support Restoration of Normal Bone Marrow Function Consistent with Mosaic Phenotype Kinetics of Corrected and Uncorrected PB Leukocytes Prior to and After Gene Therapy F A -0 2 0 0 2 F A -0 2 0 0 4 F A -0 2 0 0 5 F A -0 2 0 0 6 1 0 ,0 0 0 1 0 ,0 0 0 1 0 ,0 0 0 1 0 ,
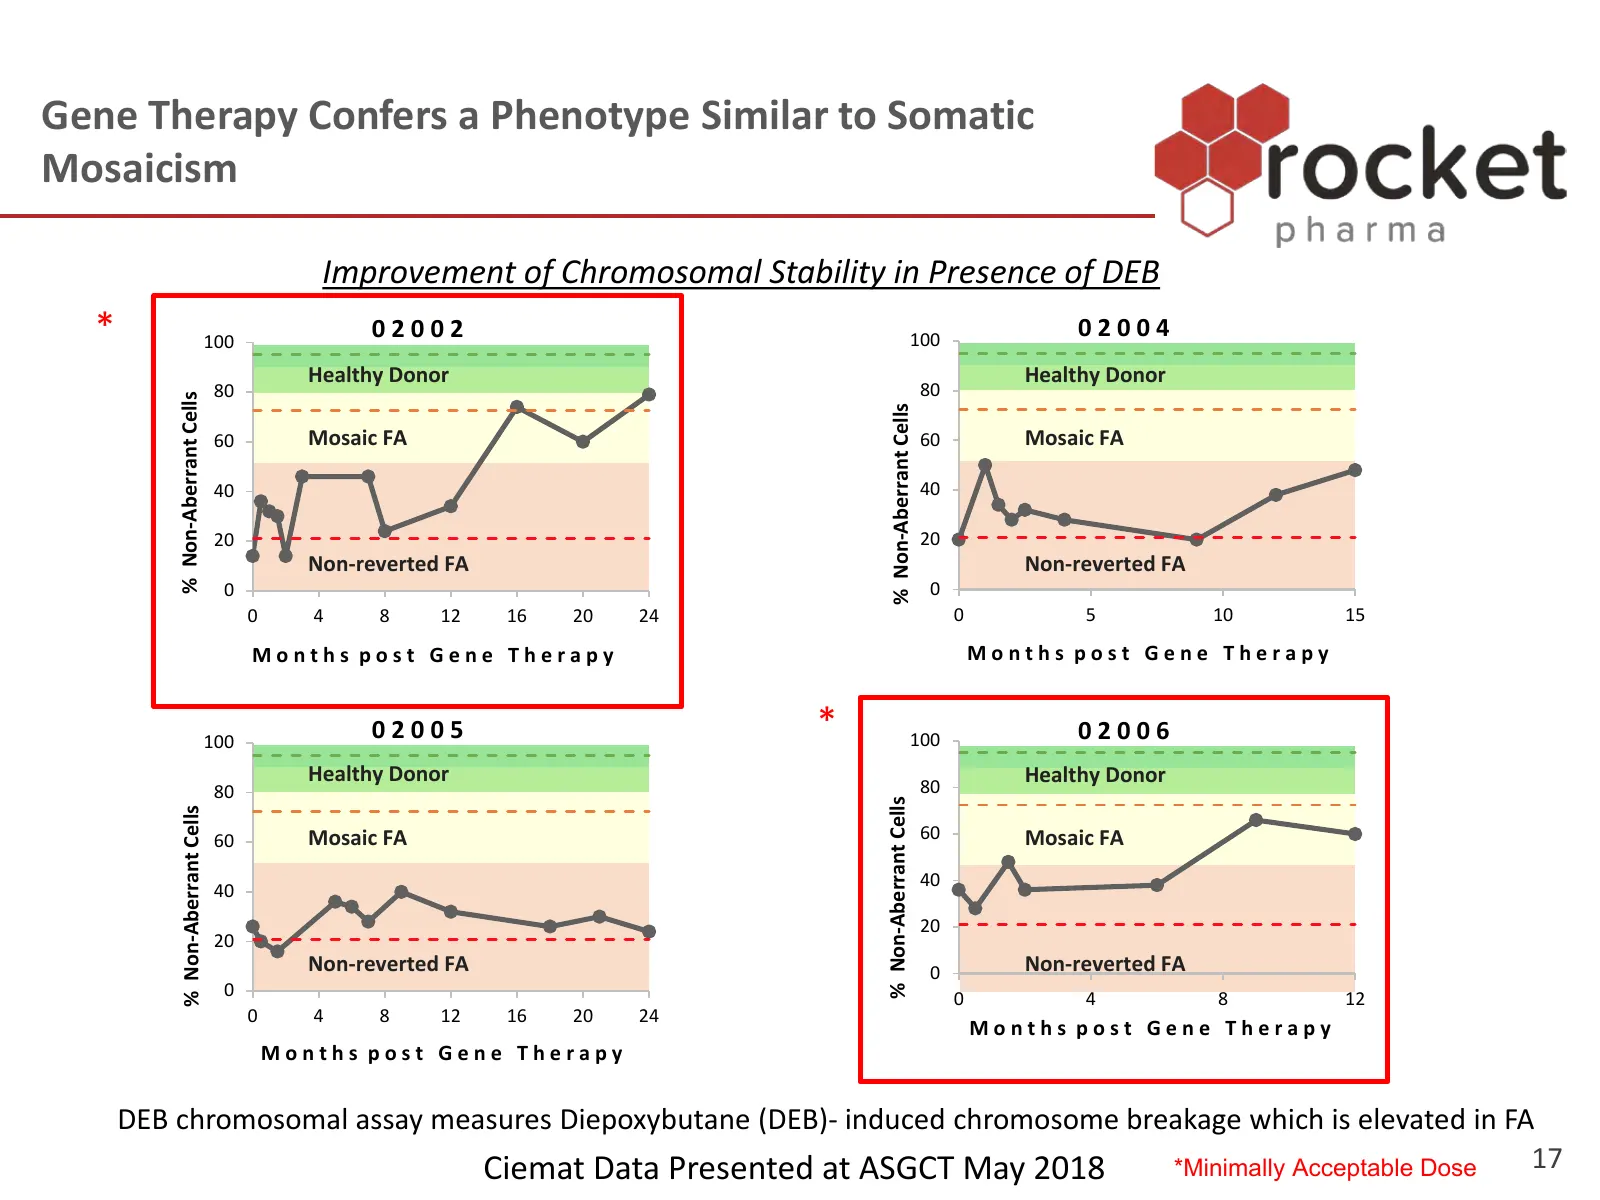
Slide 17: Gene Therapy Confers a Phenotype Similar to Somatic Mosaicism
Gene Therapy Confers a Phenotype Similar to Somatic Mosaicism Improvement of Chromosomal Stability in Presence of DEB * 100 02002 100 02004 Healthy Donor Healthy Donor 80 80 % Non-Aberrant Cells % Non-Aberrant Cells 60 Mosaic FA 60 Mosaic FA 40 40 20 20 Non-reverted FA Non-reverted FA 0 0 0 4 8 12 1
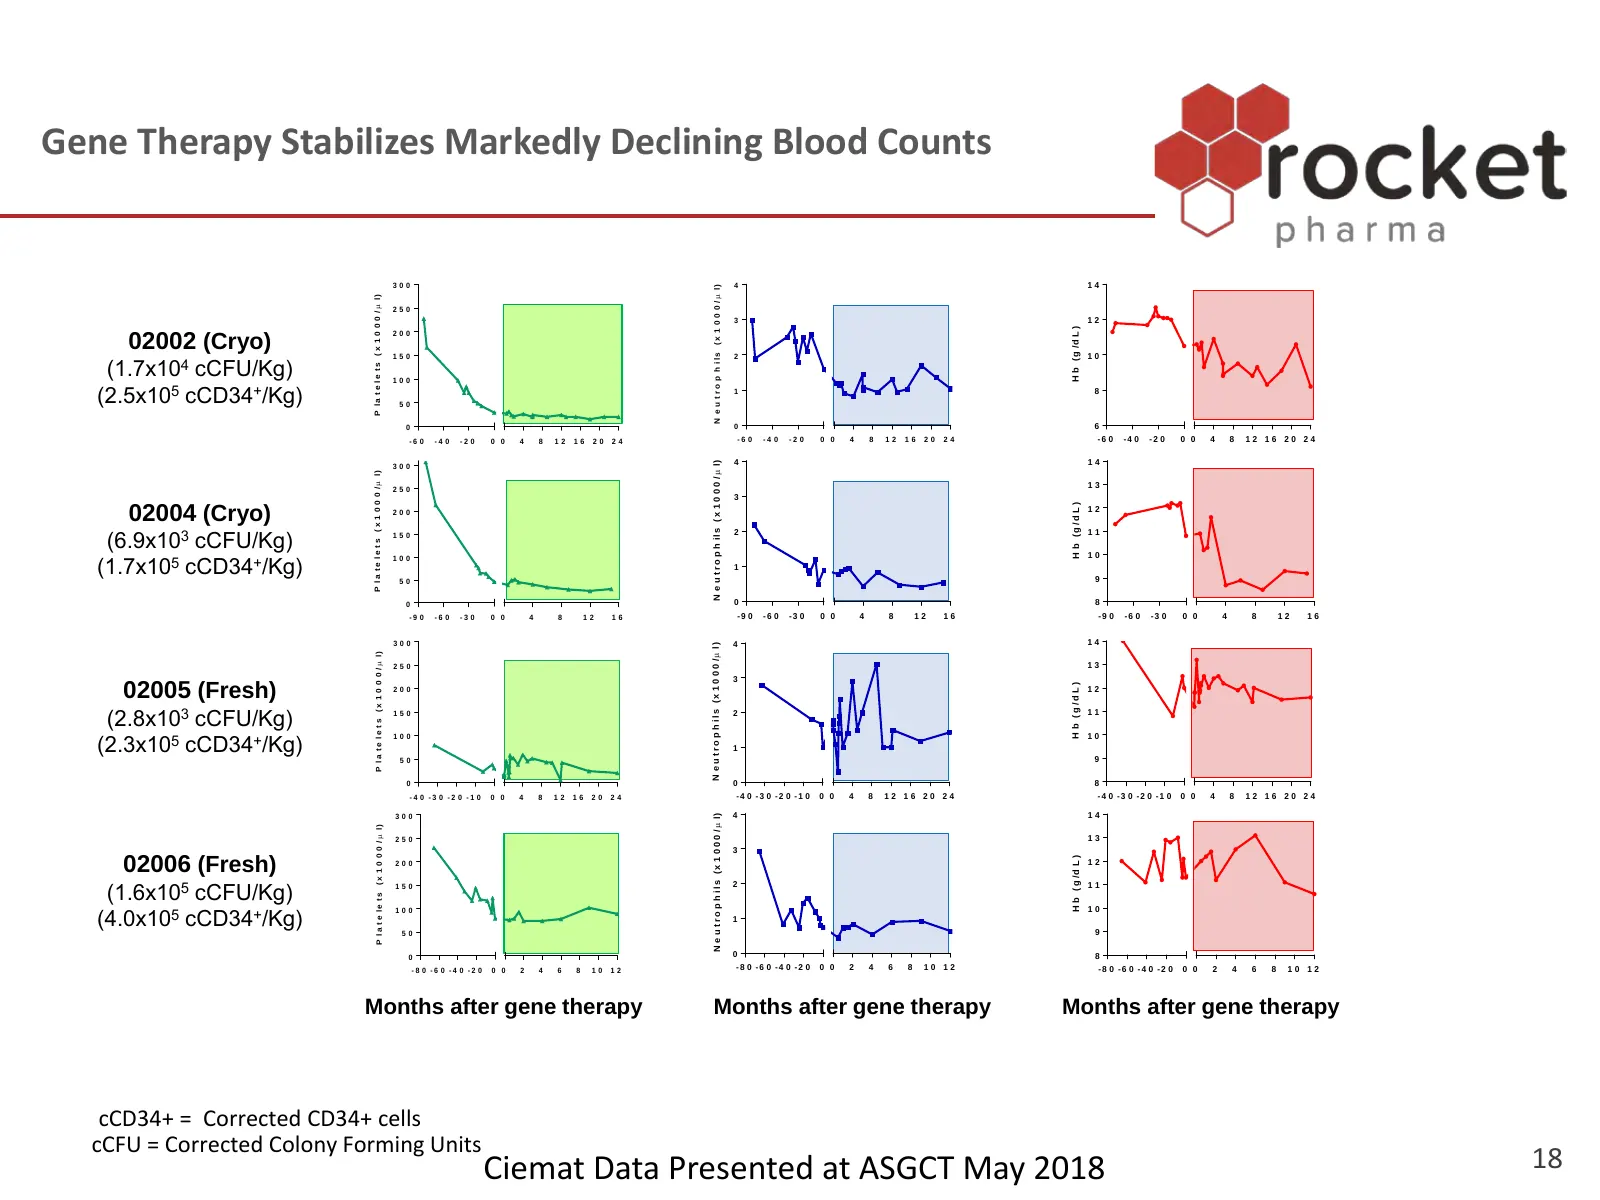
Slide 18: Gene Therapy Stabilizes Markedly Declining Blood Counts
Gene Therapy Stabilizes Markedly Declining Blood Counts 300 4 14 N e u t r o p h i l s ( x 1 0 0 0 / µ l) P l a t e l e t s ( x 1 0 0 0 / µ l) 250 3 12 H b (g /d L ) 200 02002 (Cryo) 150 2 10 (1.7x10⁴ cCFU/Kg) 100 (2.5x10⁵ cCD34+/Kg) 50 1 8 0 0 6 -6 0 -4 0 -2 0 0 0 4 8 12 16 20 24 -6 0 -4 0 -2 0 0 0
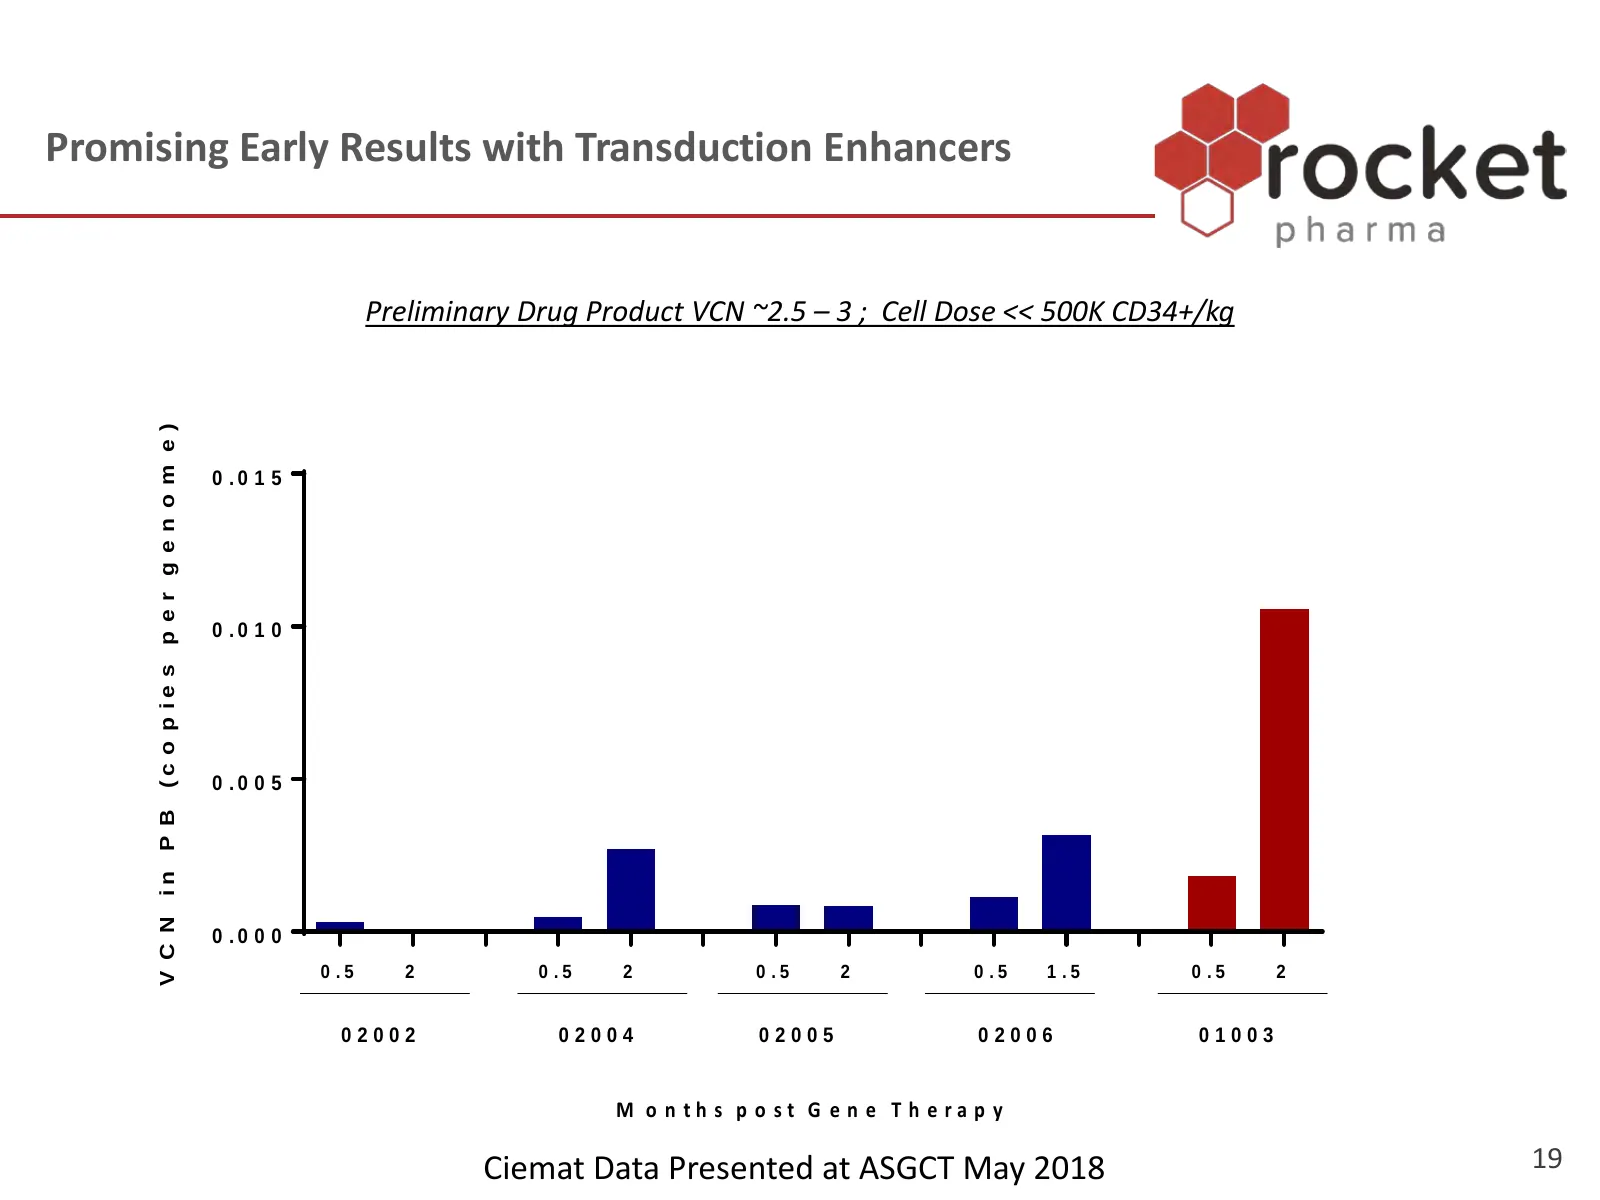
Slide 19: Promising Early Results with Transduction Enhancers
Promising Early Results with Transduction Enhancers Preliminary Drug Product VCN ~2.5 – 3 ; Cell Dose << 500K CD34+/kg (c o p ie s p e r g e n o m e ) 0 .0 1 5 0 .0 1 0 0 .0 0 5 in P B V C N 0 .0 0 0 0 .5 2 0 .5 2 0 .5 2 0 .5 1 .5 0 .5 2 02002 02004 02005 02006 01003 M o n th s p o st G e n e T h e
Slide 20: FA: Clinical Summary & Path Forward
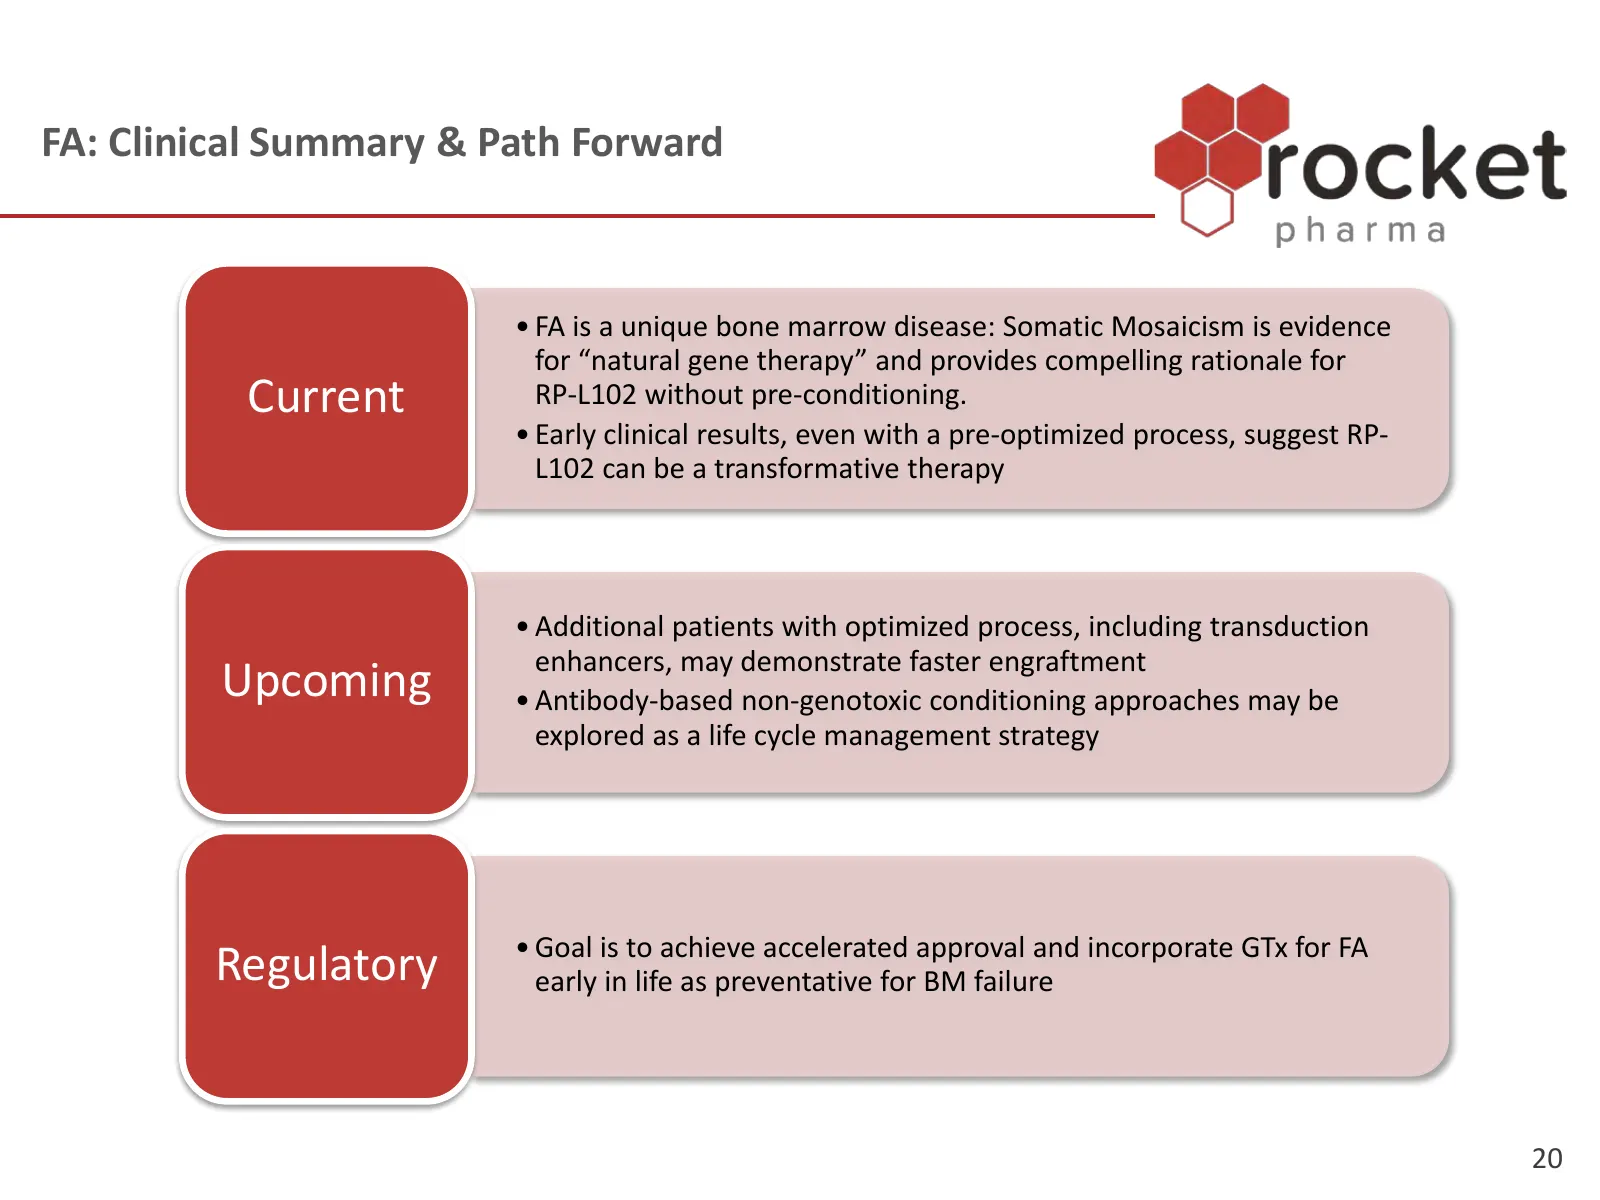
FA: Clinical Summary & Path Forward • FA is a unique bone marrow disease: Somatic Mosaicism is evidence for “natural gene therapy” and provides compelling rationale for Current RP-L102 without pre-conditioning. • Early clinical results, even with a pre-optimized process, suggest RP- L102 can be a tr
Slide 21: Leukocyte Adhesion Deficiency-I (LAD-I)
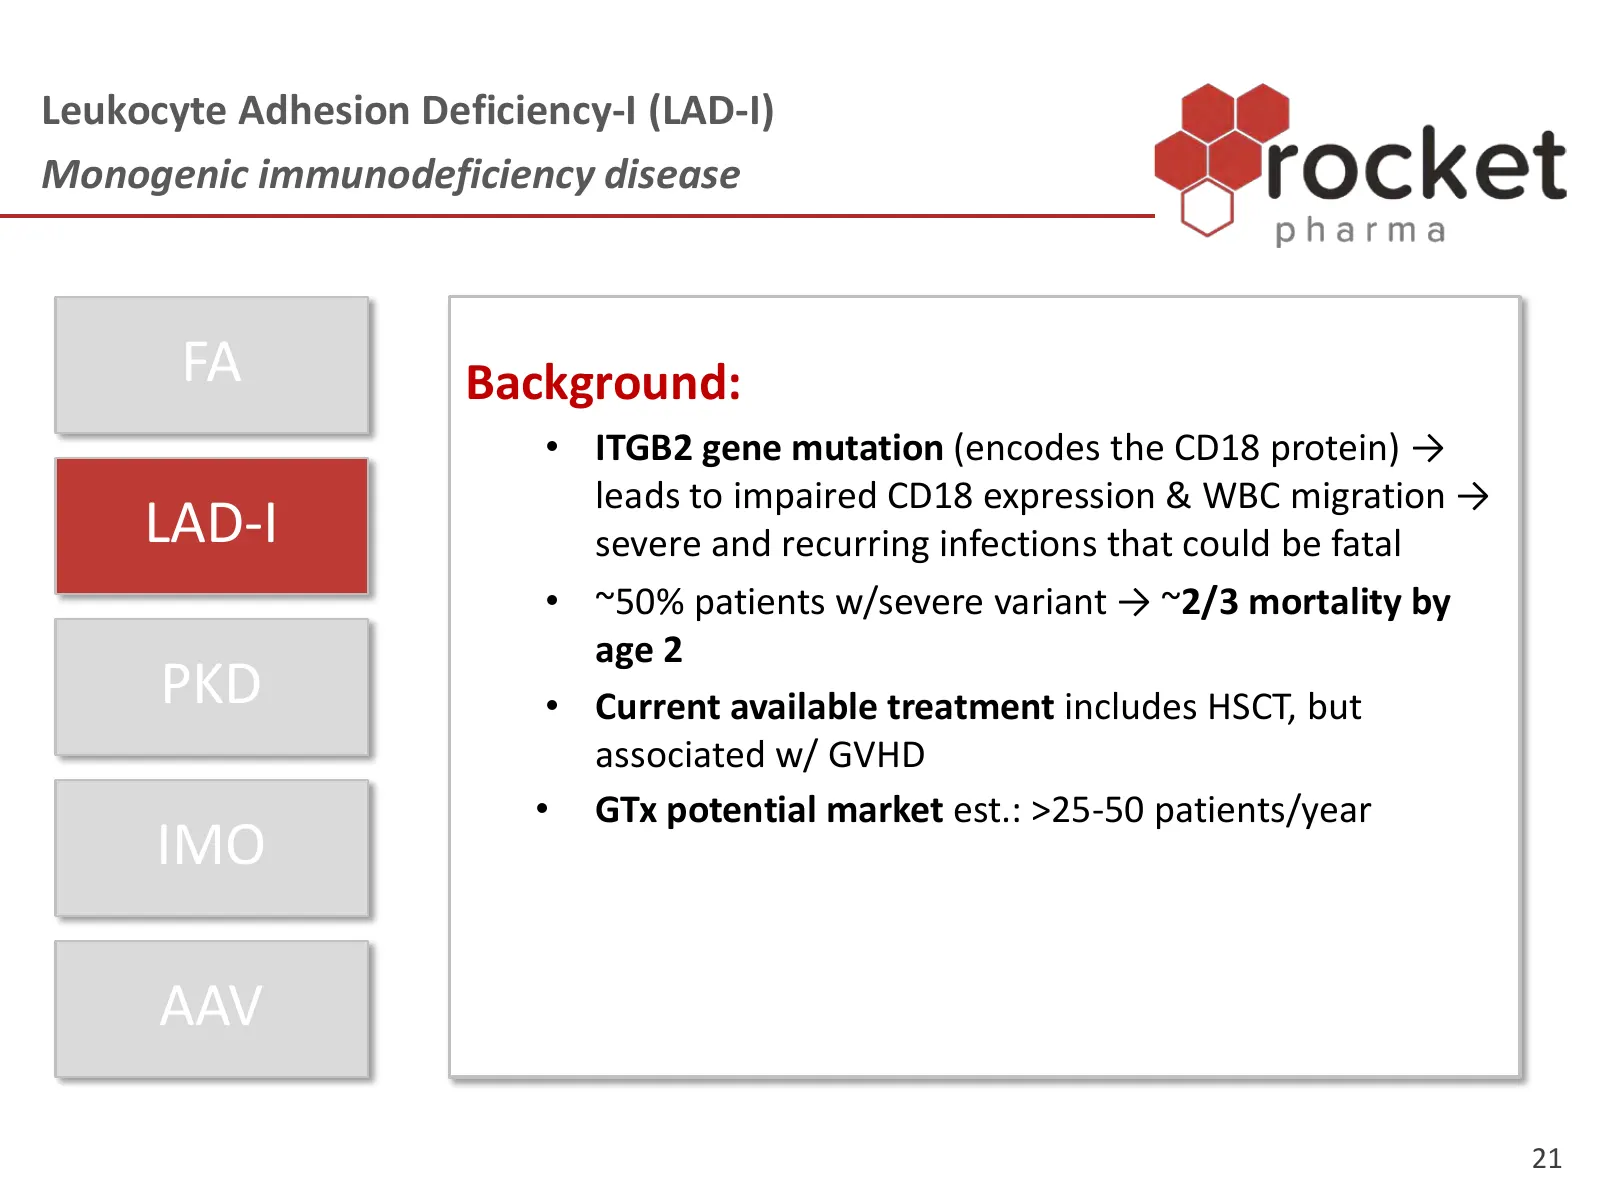
Leukocyte Adhesion Deficiency-I (LAD-I) Monogenic immunodeficiency disease FA Background: • ITGB2 gene mutation (encodes the CD18 protein) → leads to impaired CD18 expression & WBC migration → LAD-I severe and recurring infections that could be fatal • ~50% patients w/severe variant → ~2/3 mortality
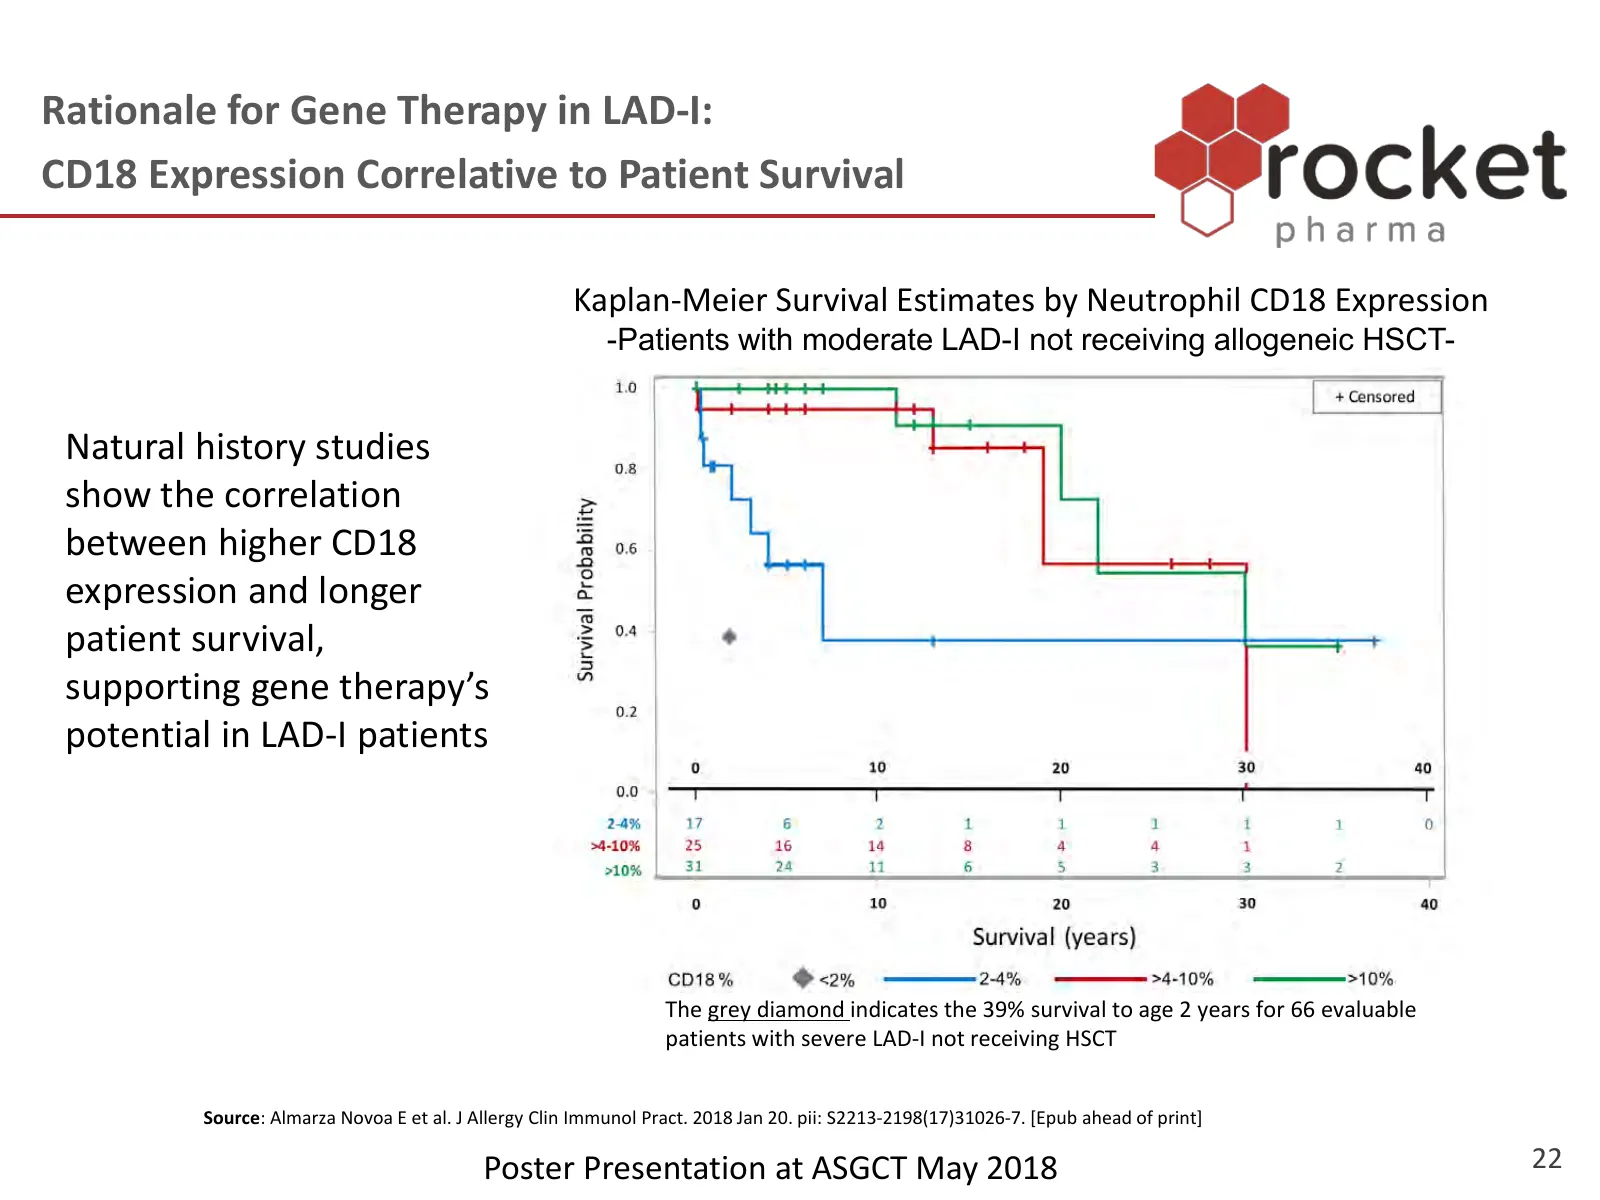
Slide 22: Rationale for Gene Therapy in LAD-I: CD18 Expression
Rationale for Gene Therapy in LAD-I: CD18 Expression Correlative to Patient Survival Kaplan-Meier Survival Estimates by Neutrophil CD18 Expression -Patients with moderate LAD-I not receiving allogeneic HSCT- Natural history studies show the correlation between higher CD18 expression and longer patie
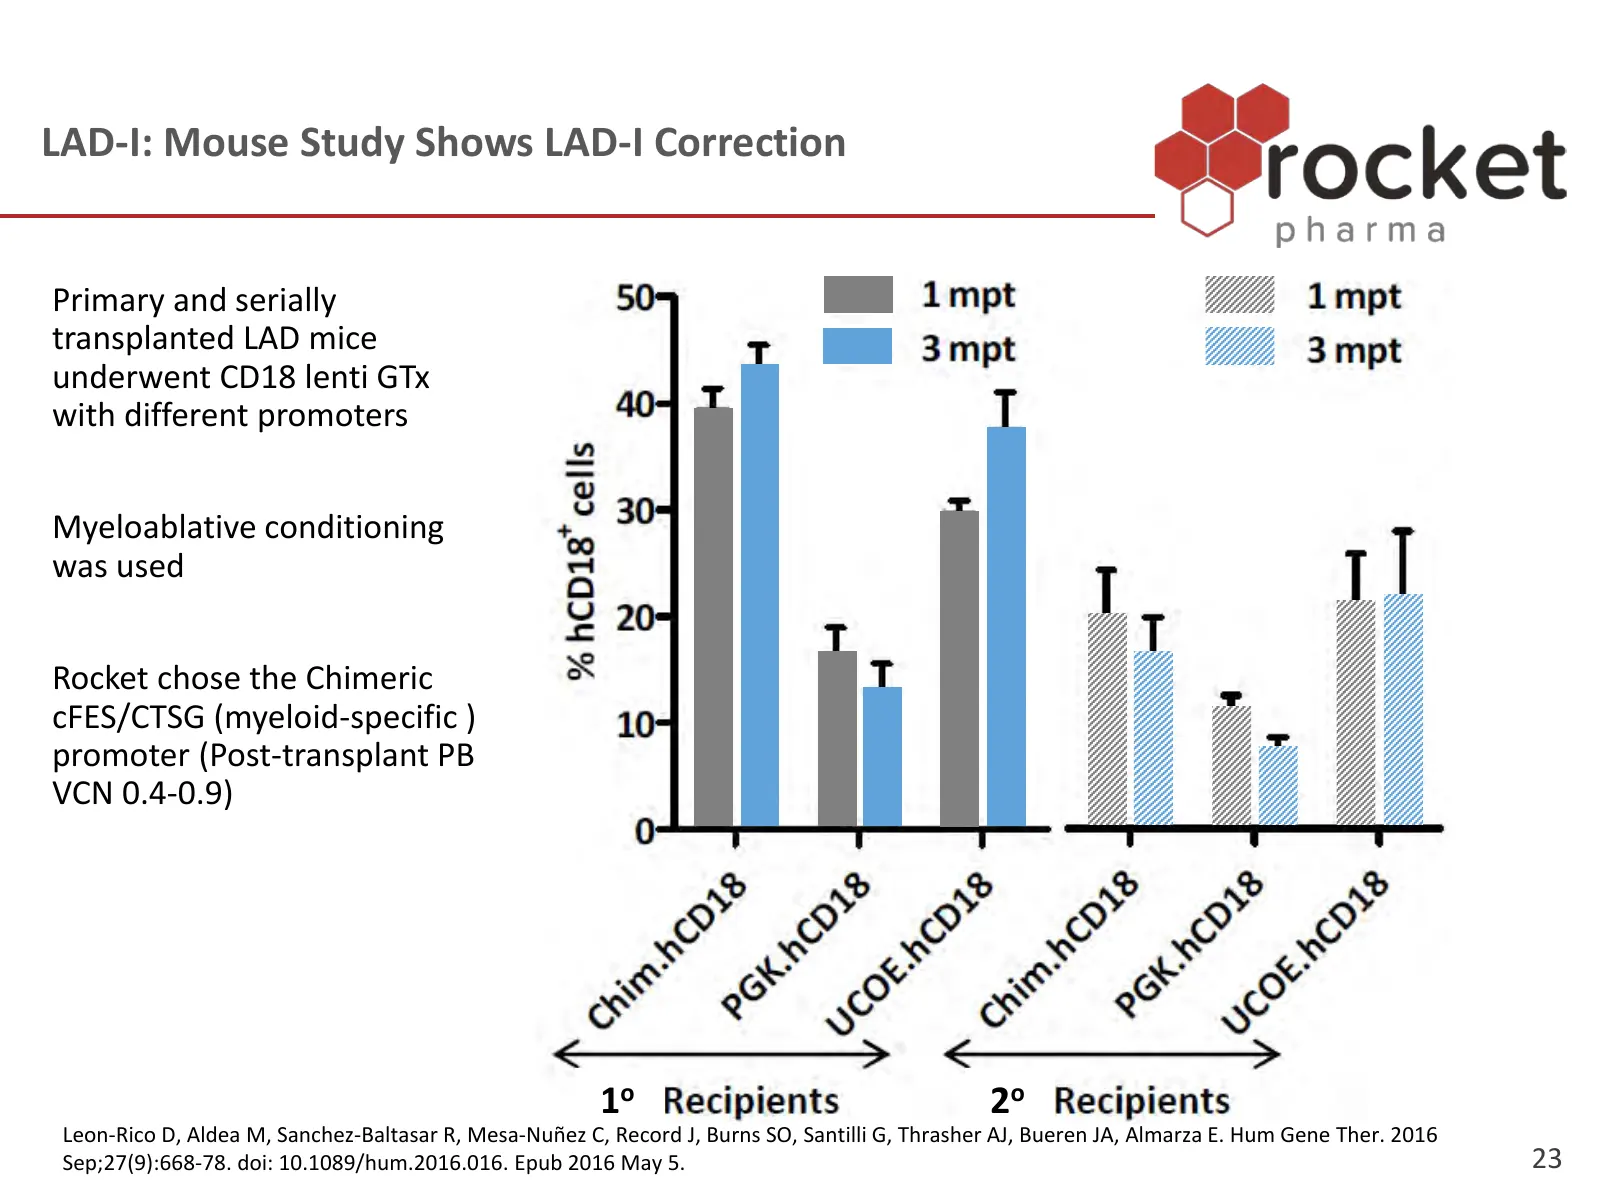
Slide 23: LAD-I: Mouse Study Shows LAD-I Correction
LAD-I: Mouse Study Shows LAD-I Correction Primary and serially transplanted LAD mice underwent CD18 lenti GTx with different promoters Myeloablative conditioning was used Rocket chose the Chimeric cFES/CTSG (myeloid-specific ) promoter (Post-transplant PB VCN 0.4-0.9) 1o 2o Leon-Rico D, Aldea M, San
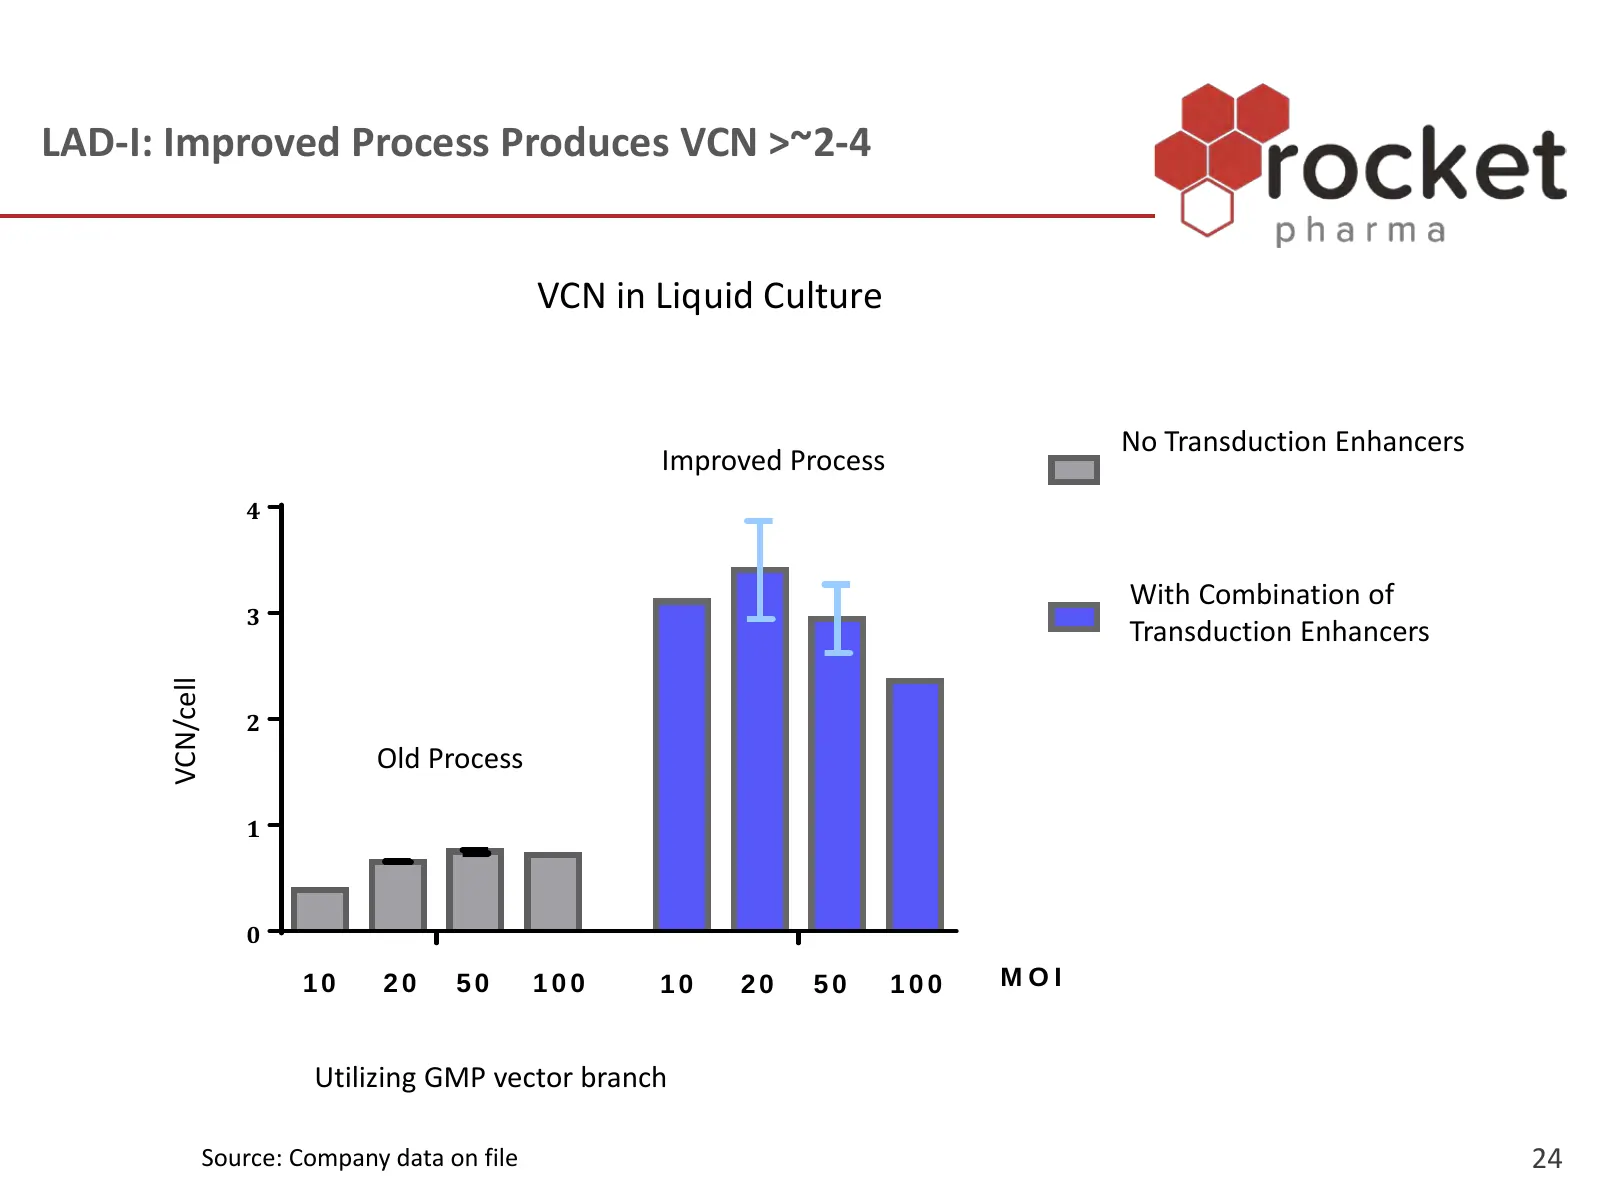
Slide 24: LAD-I: Improved Process Produces VCN >~2-4
LAD-I: Improved Process Produces VCN >~2-4 V C N inVCN L iq uin idLiquid C u l t u rCulture e Im p ro v e dProcess p ro c e s s No N oTransduction T r a n s d u c t iEnhancers on Improved E n h a n ce rs 4 With W it h Combination c o m b i n a t ioof n of 3 TTransduction r a n s d u c t ioEnhancers
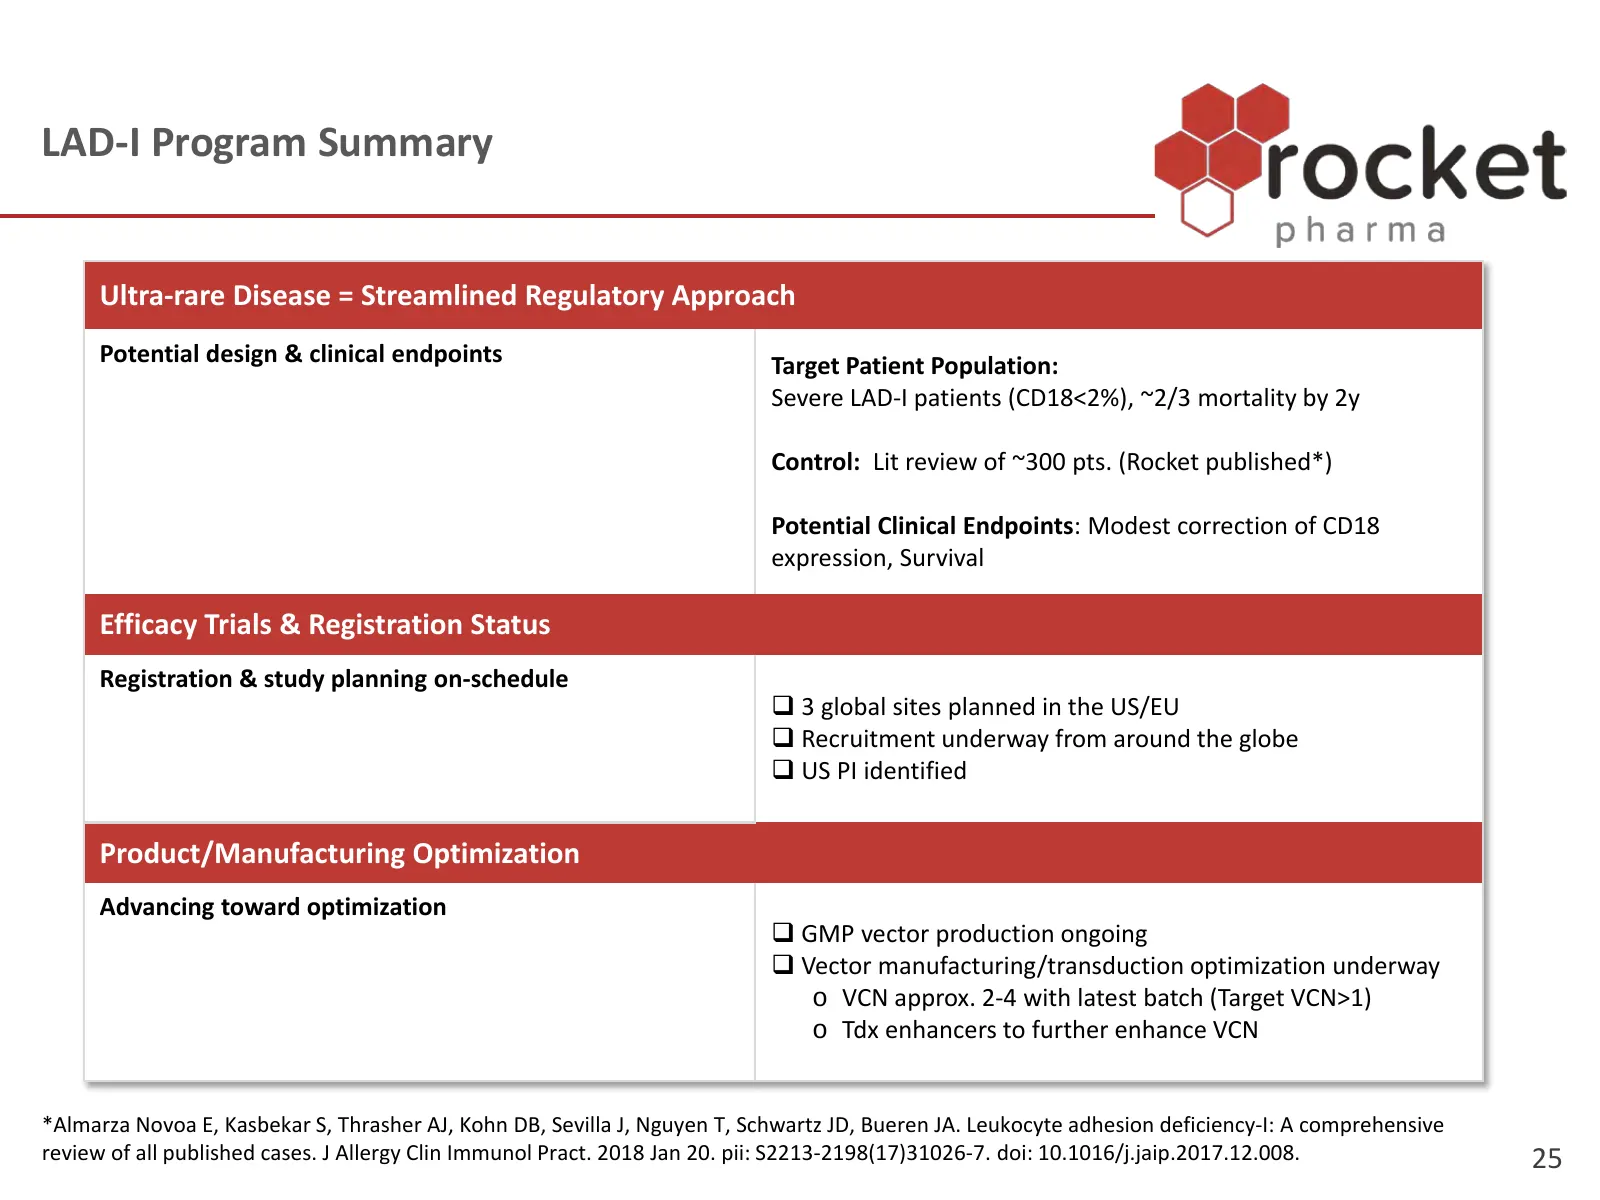
Slide 25: LAD-I Program Summary
LAD-I Program Summary Ultra-rare Disease = Streamlined Regulatory Approach Potential design & clinical endpoints Target Patient Population: Severe LAD-I patients (CD18<2%), ~2/3 mortality by 2y Control: Lit review of ~300 pts. (Rocket published*) Potential Clinical Endpoints: Modest correction of CD
Slide 26: Pyruvate Kinase Deficiency (PKD)
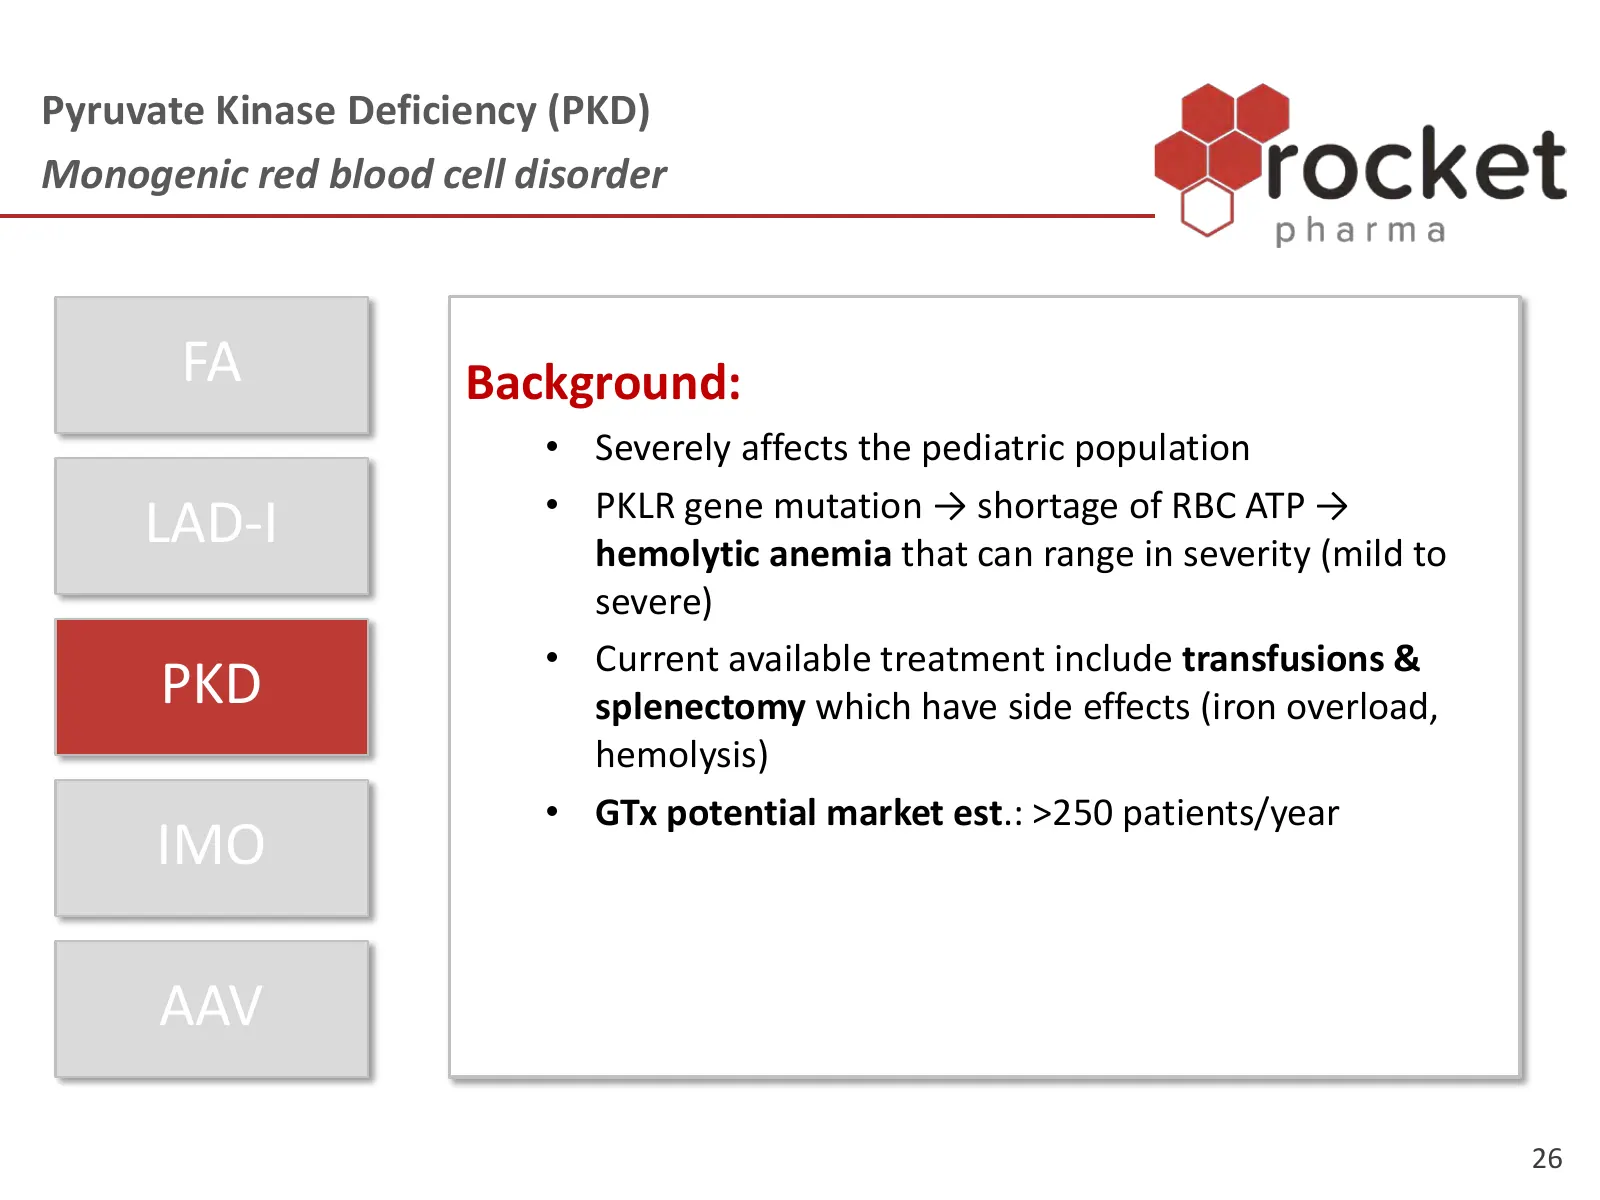
Pyruvate Kinase Deficiency (PKD) Monogenic red blood cell disorder FA Background: • Severely affects the pediatric population • PKLR gene mutation → shortage of RBC ATP → LAD-I hemolytic anemia that can range in severity (mild to severe) • Current available treatment include transfusions & PKD splen
Slide 27: PKD Program Summary
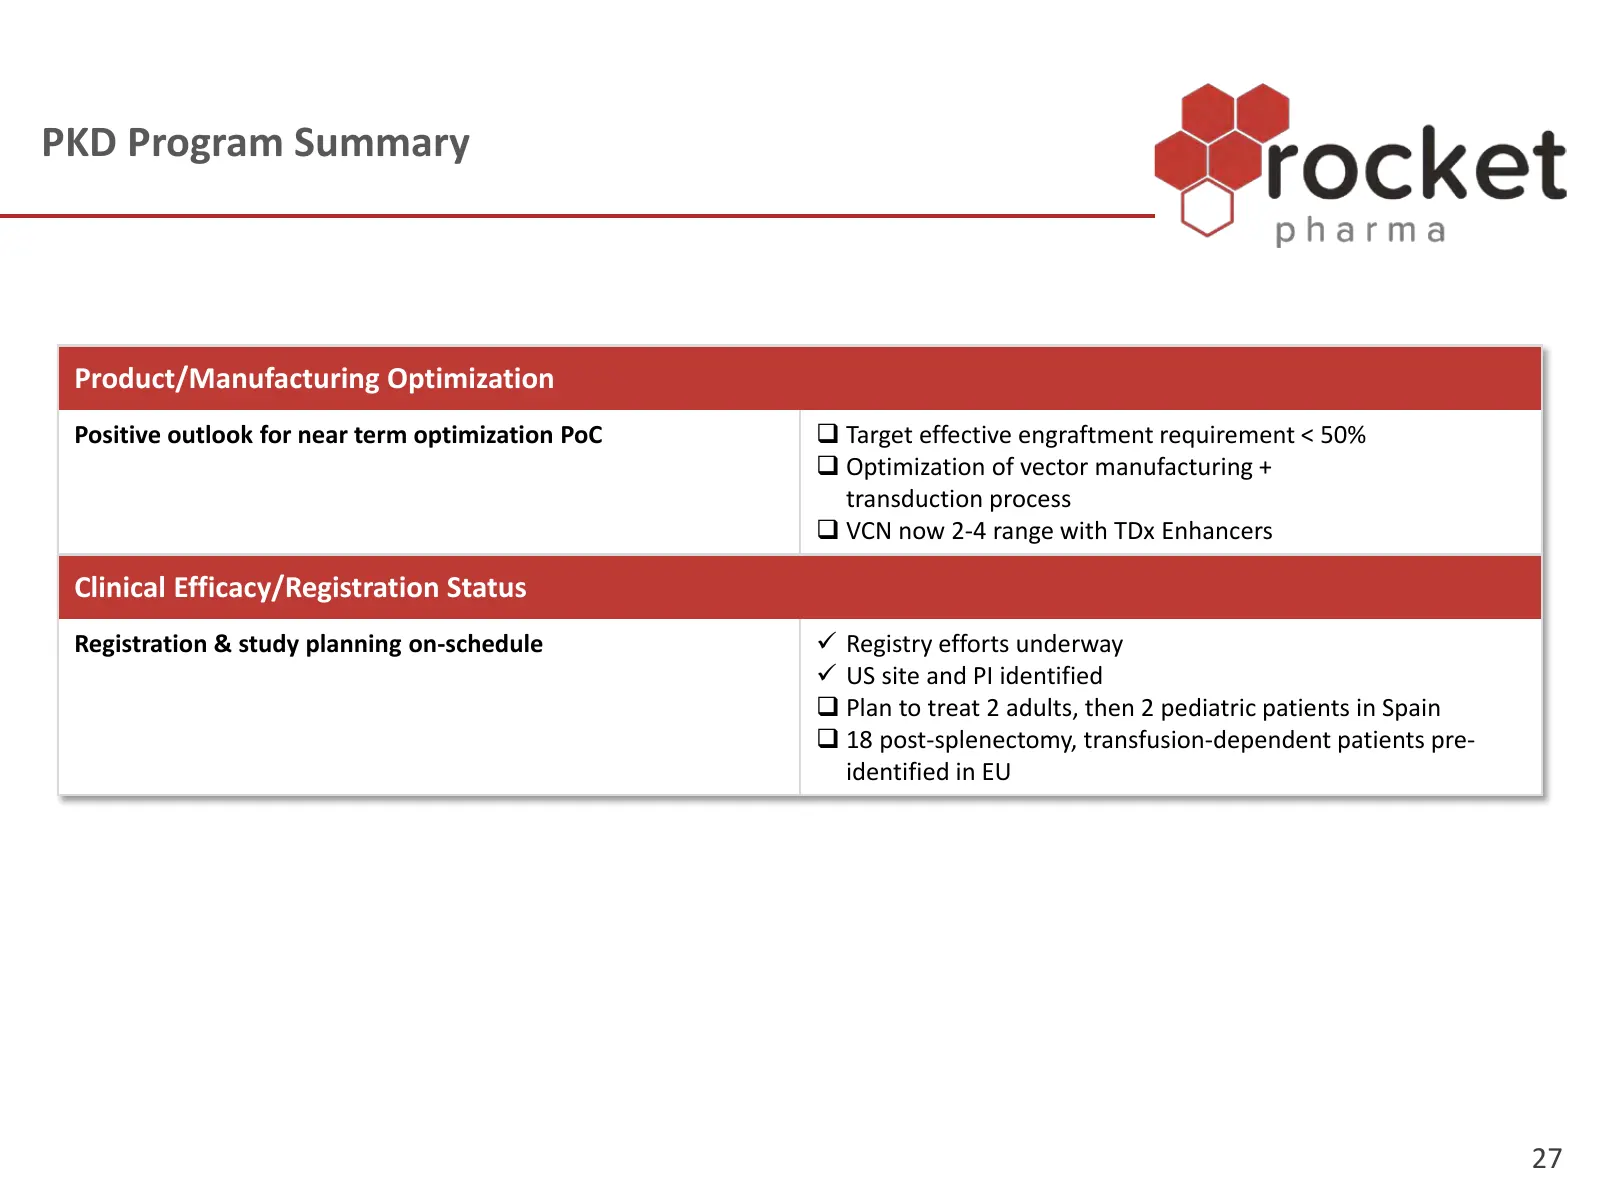
PKD Program Summary Product/Manufacturing Optimization Positive outlook for near term optimization PoC Target effective engraftment requirement < 50% Optimization of vector manufacturing + transduction process VCN now 2-4 range with TDx Enhancers Clinical Efficacy/Registration Status Registrat
Slide 28: Infantile Malignant Osteopetrosis (IMO)
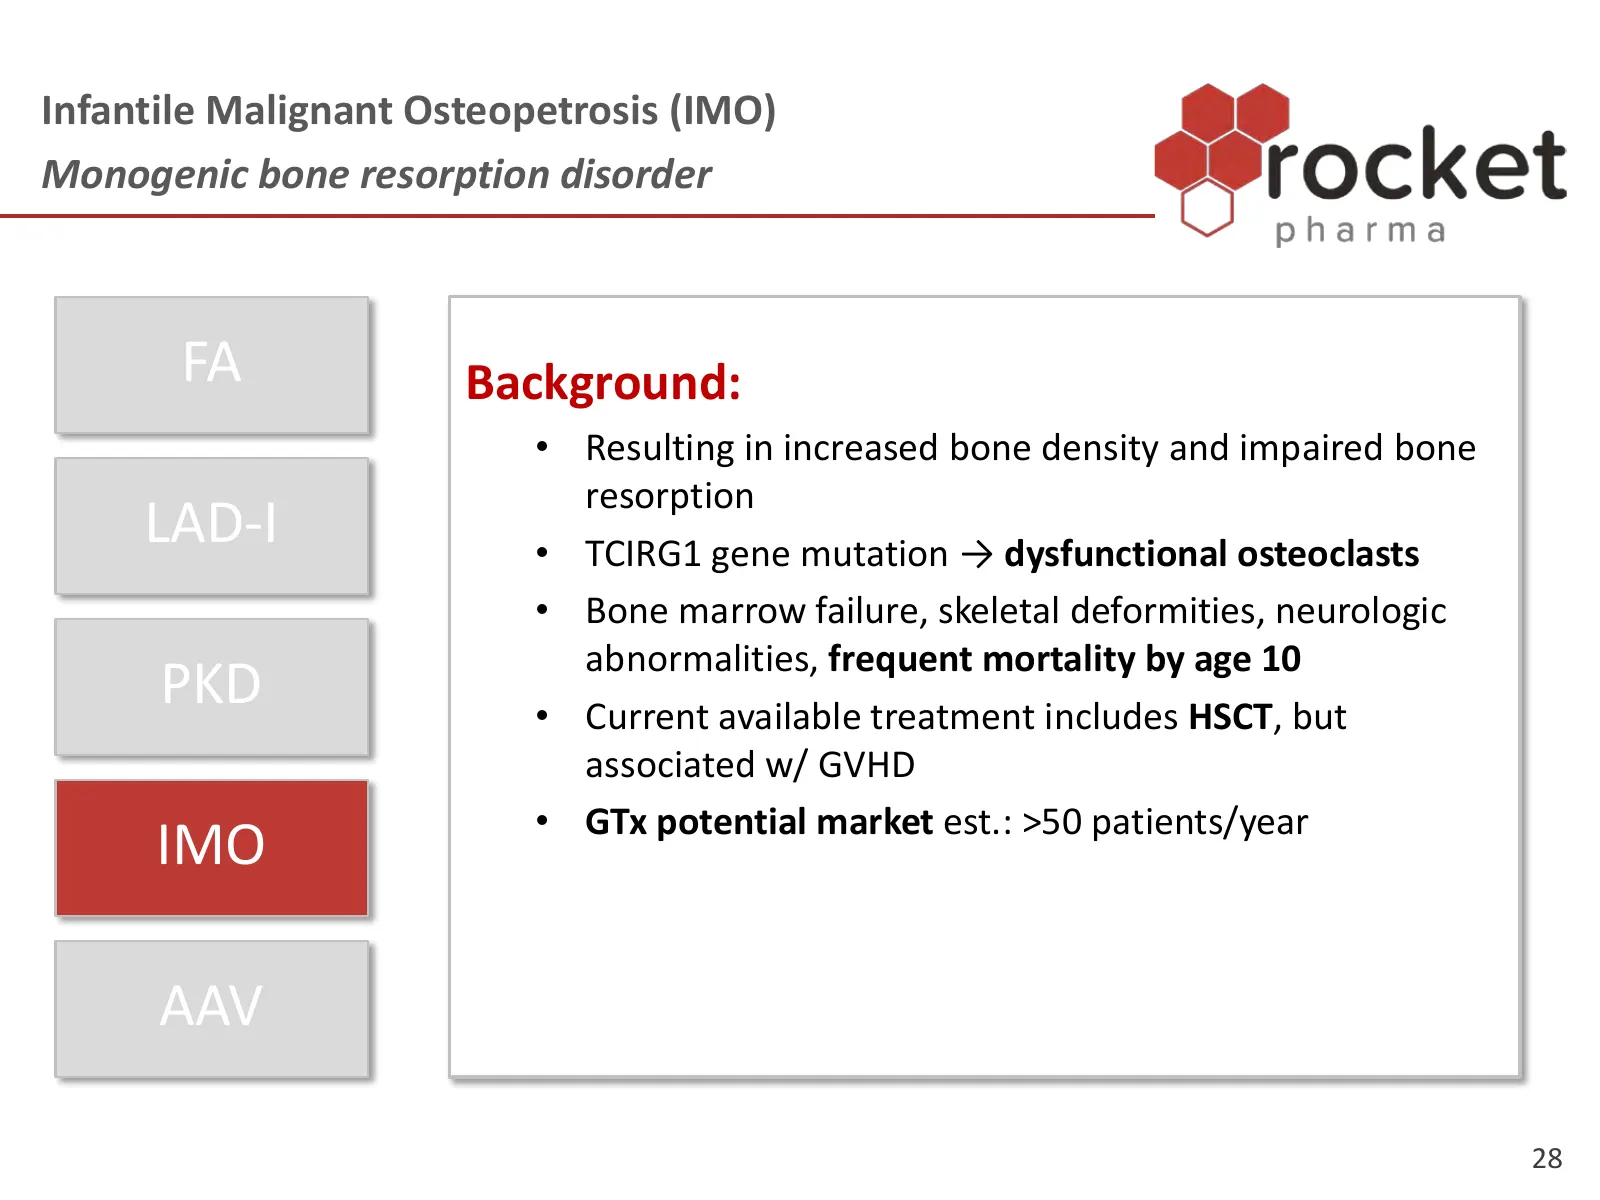
Infantile Malignant Osteopetrosis (IMO) Monogenic bone resorption disorder FA Background: • Resulting in increased bone density and impaired bone resorption LAD-I • TCIRG1 gene mutation → dysfunctional osteoclasts • Bone marrow failure, skeletal deformities, neurologic abnormalities, frequent mortal
Slide 29: AAV Program (Undisclosed)
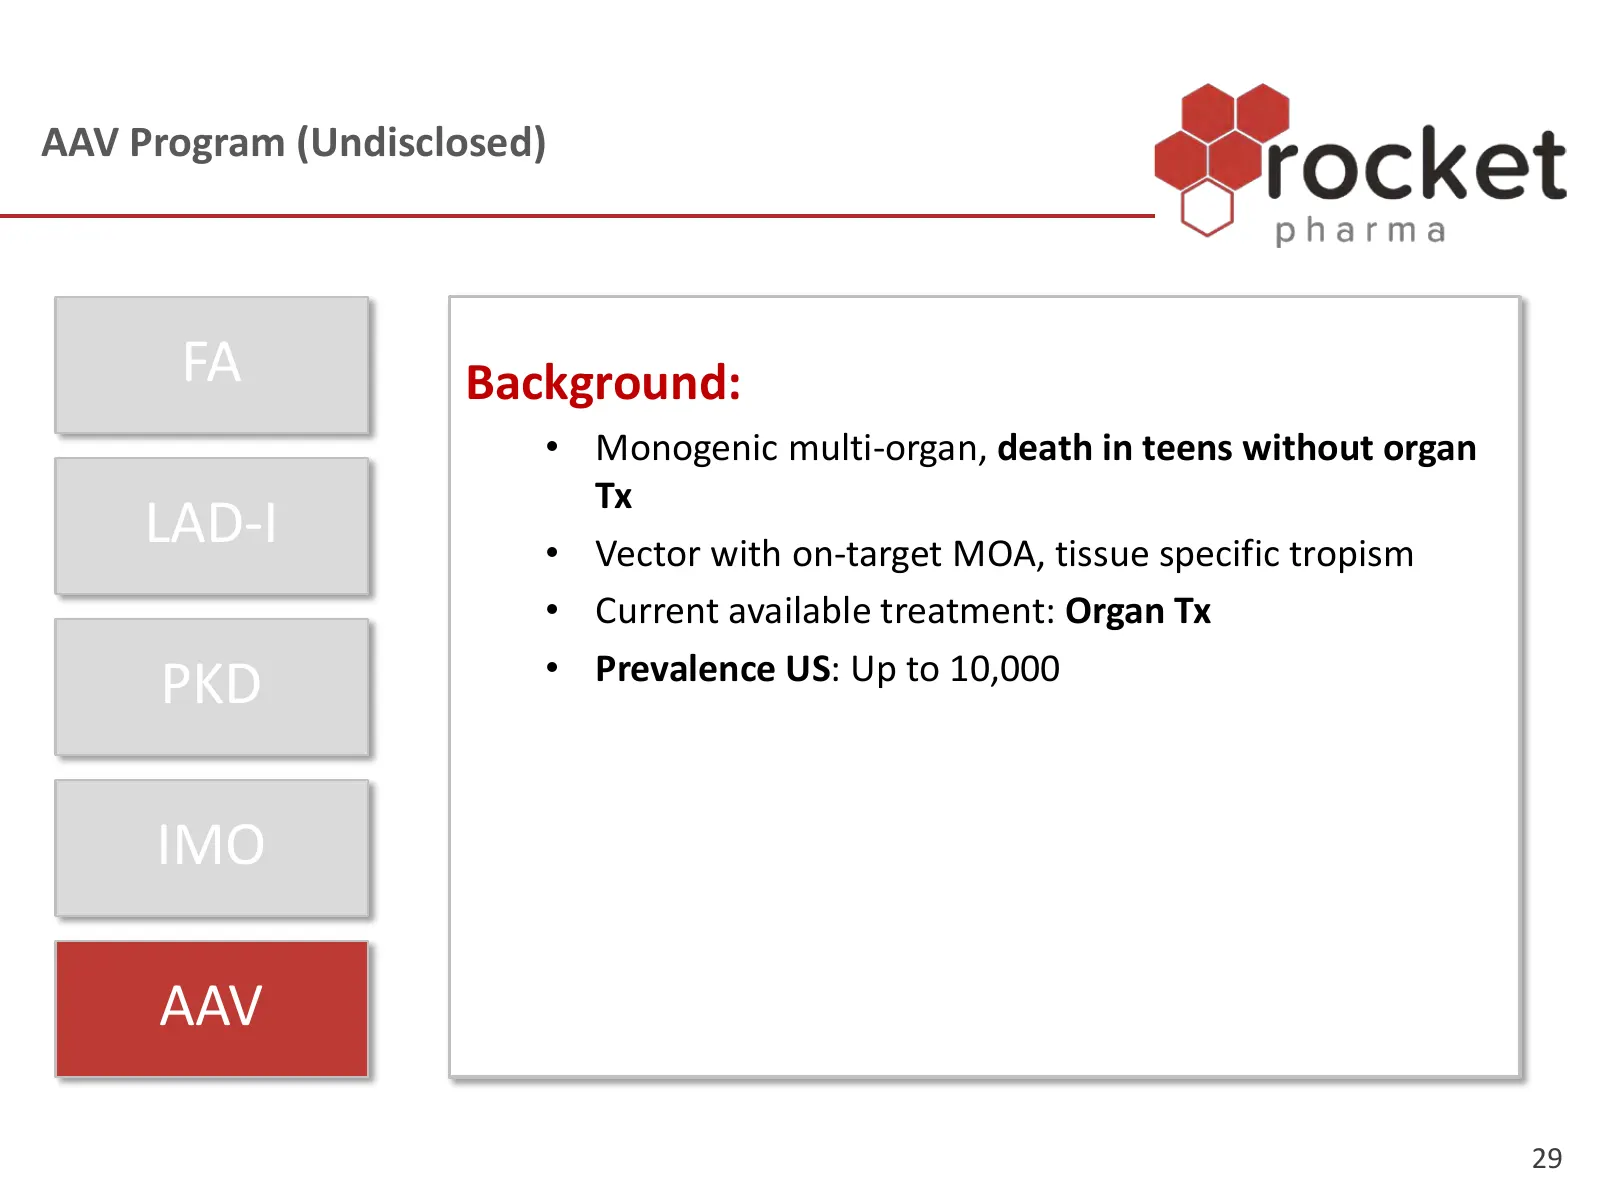
AAV Program (Undisclosed) FA Background: • Monogenic multi-organ, death in teens without organ Tx LAD-I • Vector with on-target MOA, tissue specific tropism • Current available treatment: Organ Tx • Prevalence US: Up to 10,000 PKD IMO AAV 29
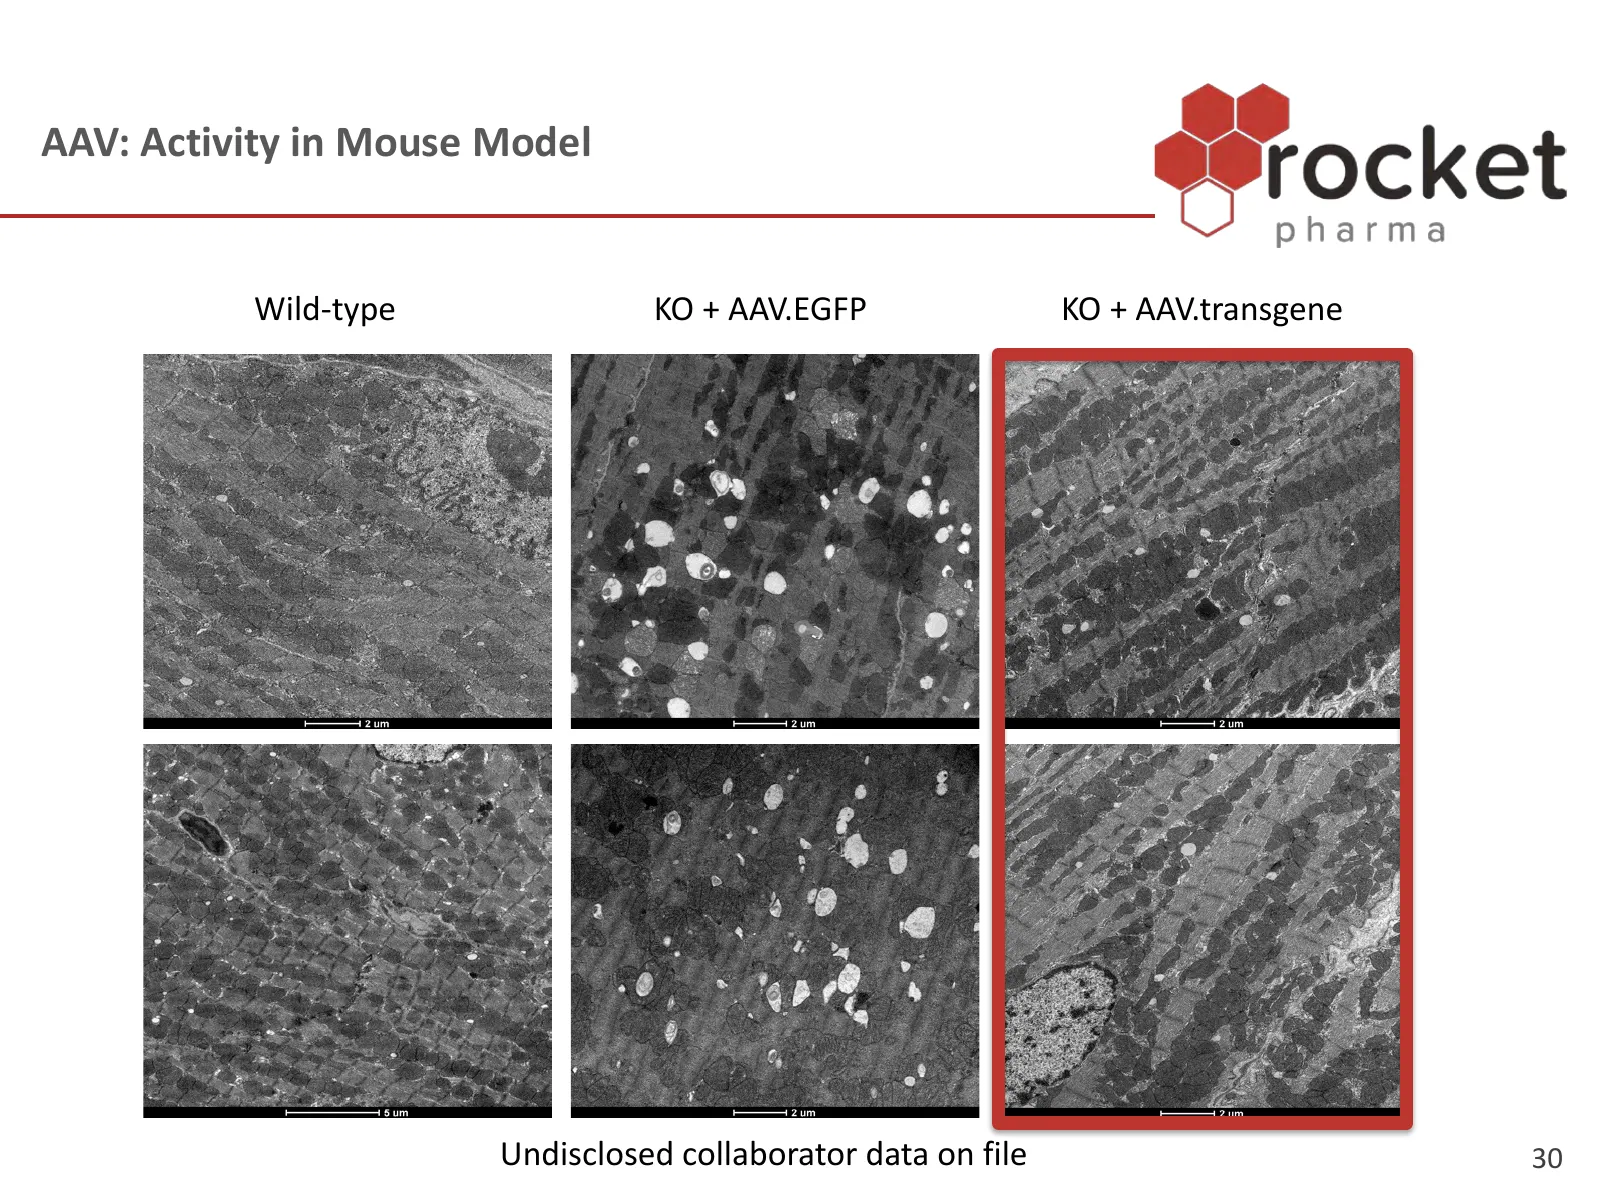
Slide 30: AAV: Activity in Mouse Model
AAV: Activity in Mouse Model Wild-type KO + AAV.EGFP KO + AAV.transgene Undisclosed collaborator data on file 30
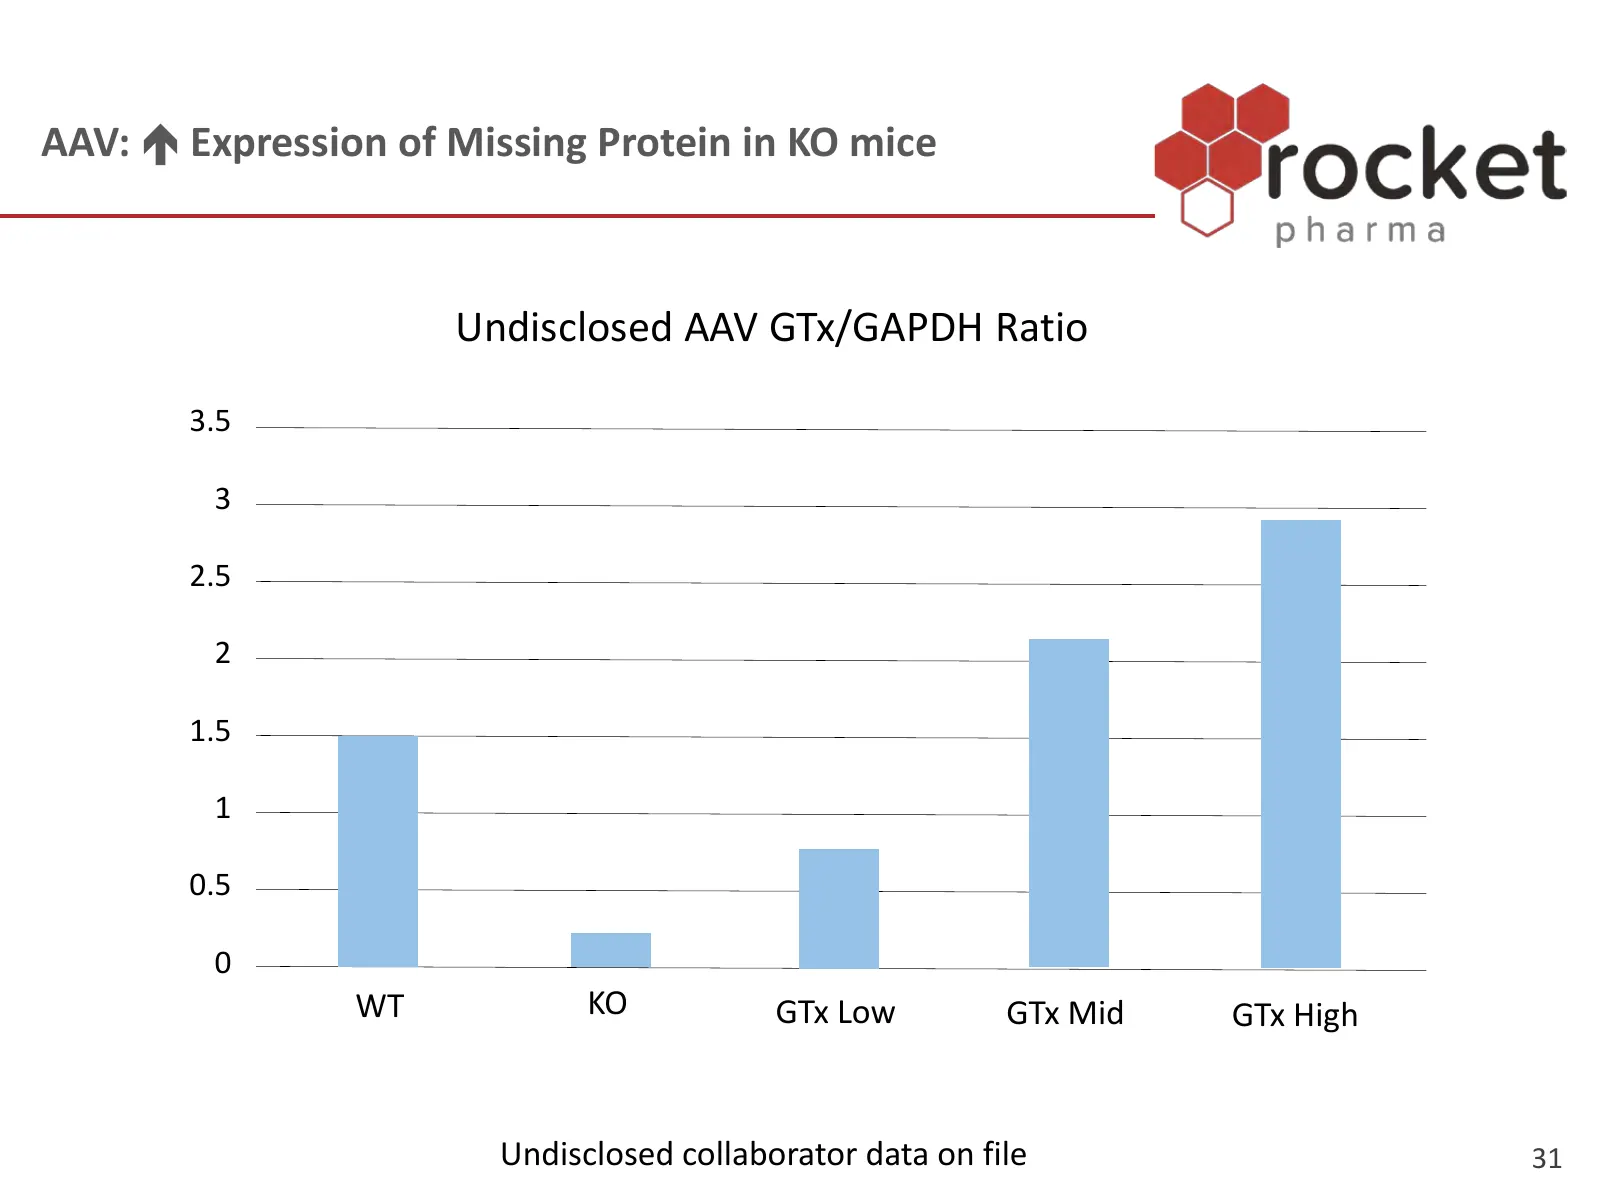
Slide 31: AAV: Expression of Missing Protein in KO mice
AAV: Expression of Missing Protein in KO mice Undisclosed AAV GTx/GAPDH Ratio 3.5 3 2.5 2 1.5 1 0.5 0 WT KO GTx Low GTx Mid GTx High Undisclosed collaborator data on file 31
Slide 32: Growing IP Portfolio
Growing IP Portfolio 4 in-licensed patent families for GTx products and related tech Supporting current pipeline efforts • In-licensed three pending international patent applications filed under Patent Cooperation Treaty (PCT): FA LAD-I PKD • One pending PCT application: Undisclosed AAV Effo
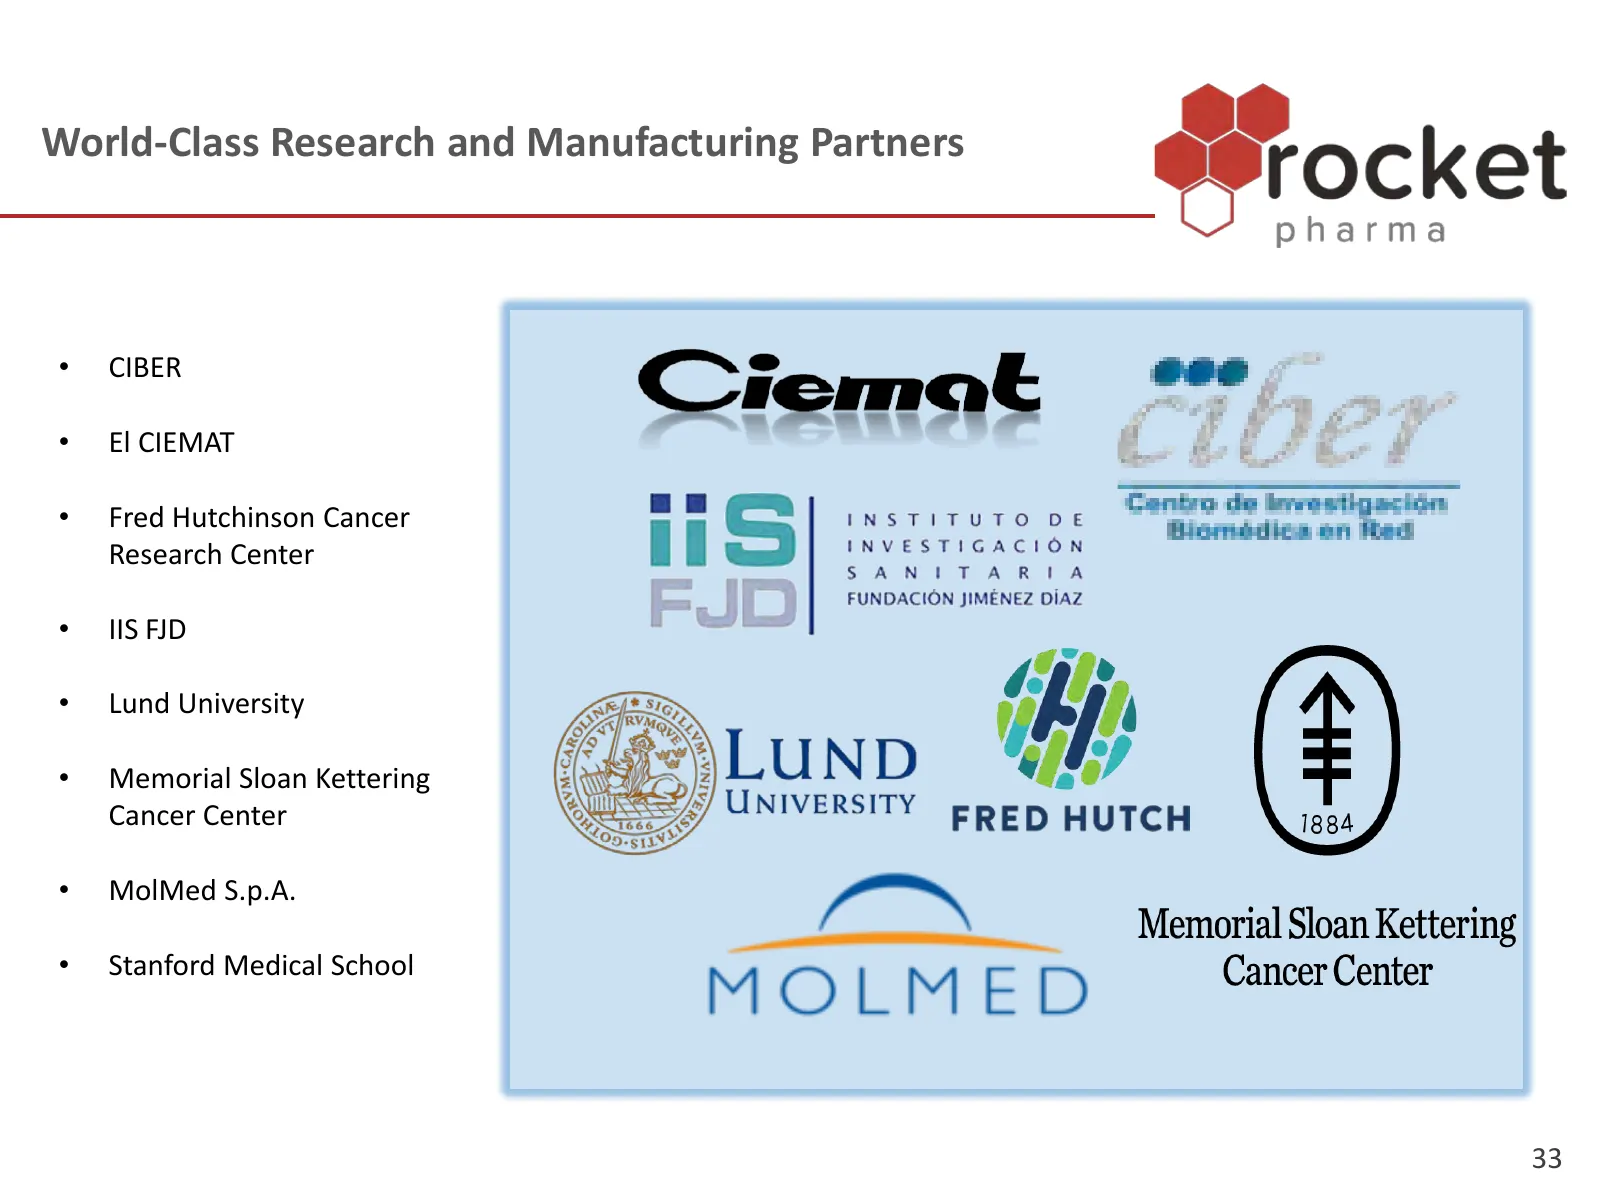
Slide 33: World-Class Research and Manufacturing Partners
World-Class Research and Manufacturing Partners • CIBER • El CIEMAT • Fred Hutchinson Cancer Research Center • IIS FJD • Lund University • Memorial Sloan Kettering Cancer Center • MolMed S.p.A. • Stanford Medical School 33
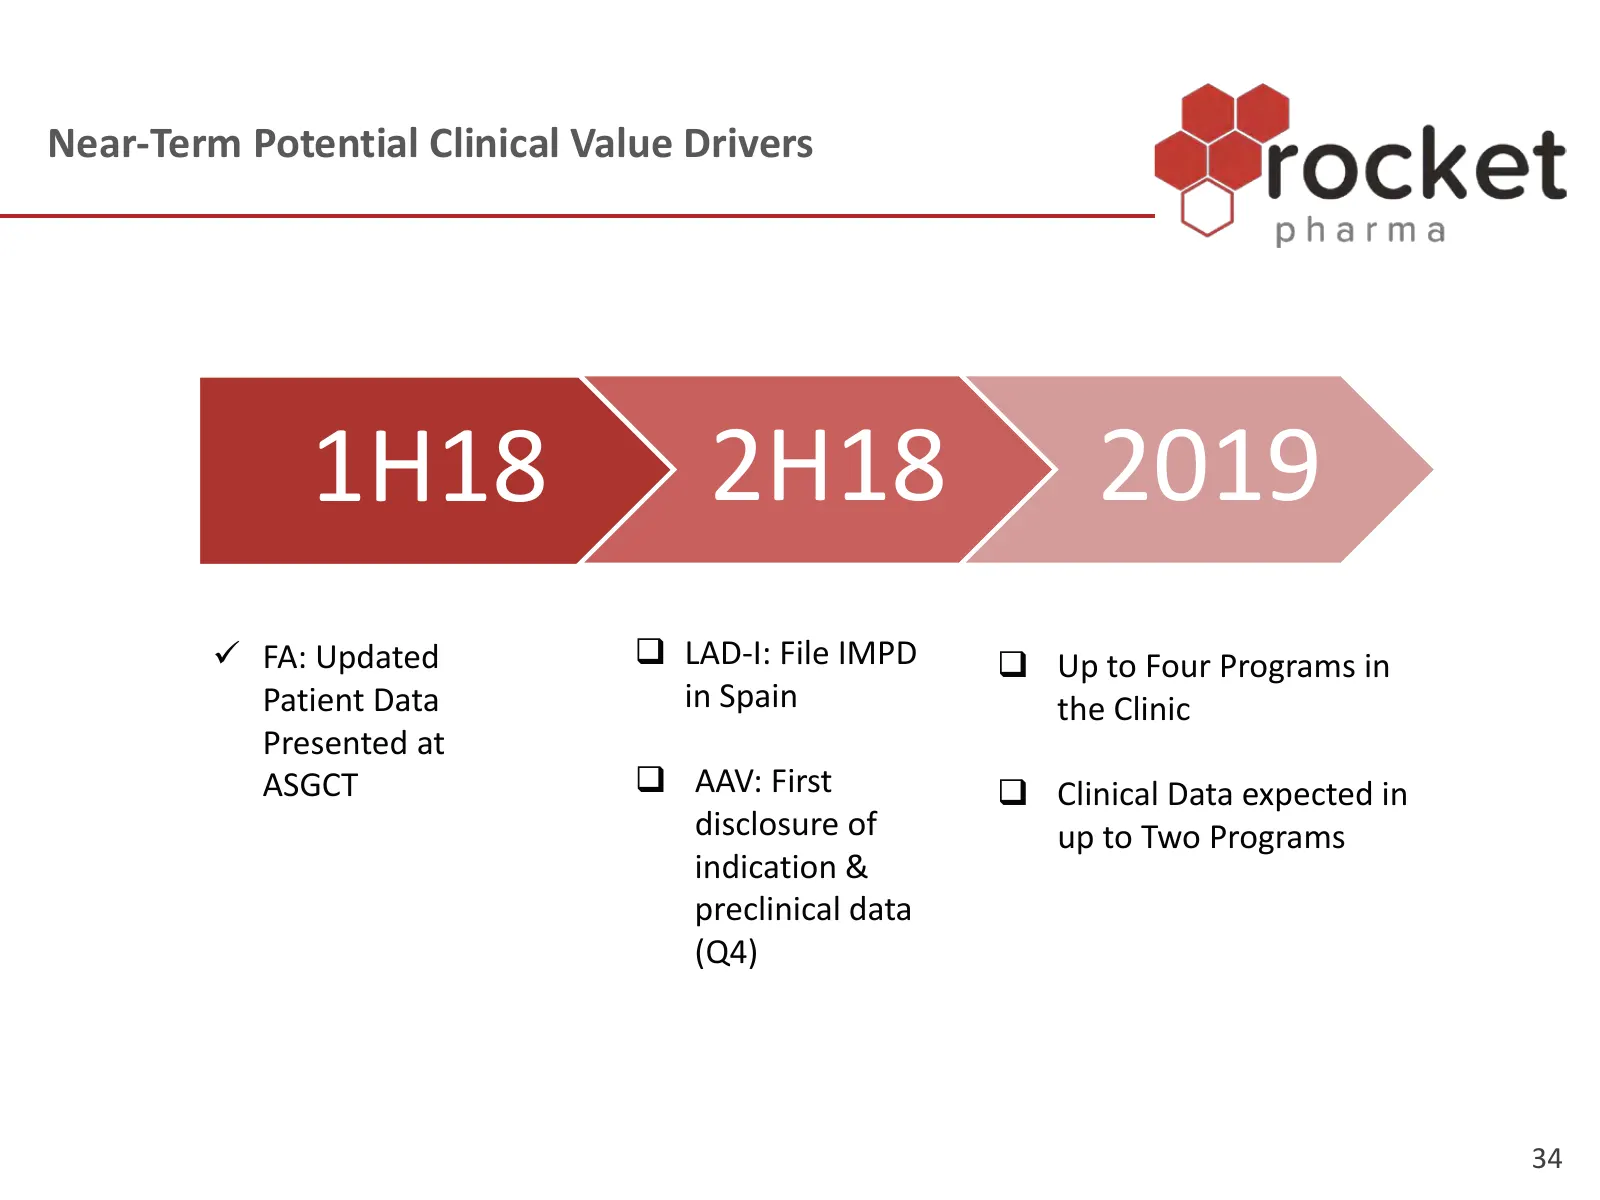
Slide 34: Near-Term Potential Clinical Value Drivers
Near-Term Potential Clinical Value Drivers 1H18 2H18 2019 FA: Updated LAD-I: File IMPD Up to Four Programs in Patient Data in Spain the Clinic Presented at ASGCT AAV: First Clinical Data expected in disclosure of up to Two Programs indication & preclinical data (Q4) 34
Source: Internet Archive copy of rocketpharma.com
More decks from Rocket Pharmaceuticals, Inc.
 Investor Presentation (November 2026)36 slides · November 2026
 Corporate Update (October 2026)23 slides · Oct 6, 2026
 Investor Presentation (August 2026)34 slides · August 2026
 Technical Presentation (May 2025)19 slides · May 15, 2025
 Technical Presentation (November 2024)15 slides · Nov 18, 2024
 Corporate Update (September 2023)25 slides · Sep 12, 2023