Great Plains Energy Incorporated
Great Plains Energy — Investor Presentation (June 2015)
40 slides from Great Plains Energy's investor presentation, Jun 18, 2015
Slide 1: June 19, 2015 Investor Presentation
June 19, 2015 Investor Presentation Exhibit 99.1
Slide 2: Forward-Looking Statement
Forward-Looking Statement Statements made in this presentation that are not based on historical facts are forward-looking, may involve risks and uncertainties, and are intended to be as of the date when made. Forward-looking statements include, but are not limited to, the outcome of regulatory proce
Slide 3: Recent Events
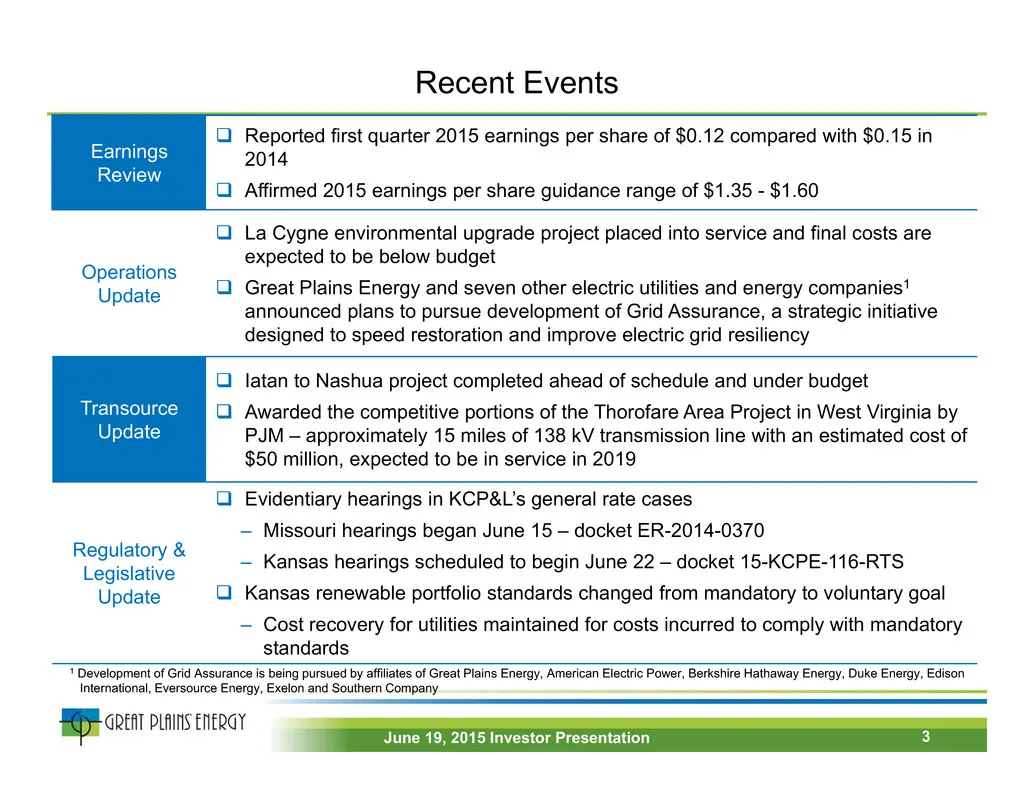
Recent Events Earnings Review Reported first quarter 2015 earnings per share of $0.12 compared with $0.15 in 2014 Affirmed 2015 earnings per share guidance range of $1.35 - $1.60 Operations Update La Cygne environmental upgrade project placed into service and final costs are expected to be bel
Slide 4: KCP&L's Rate Cases - A Key Driver of 2015 to 2016 Earnings Growth
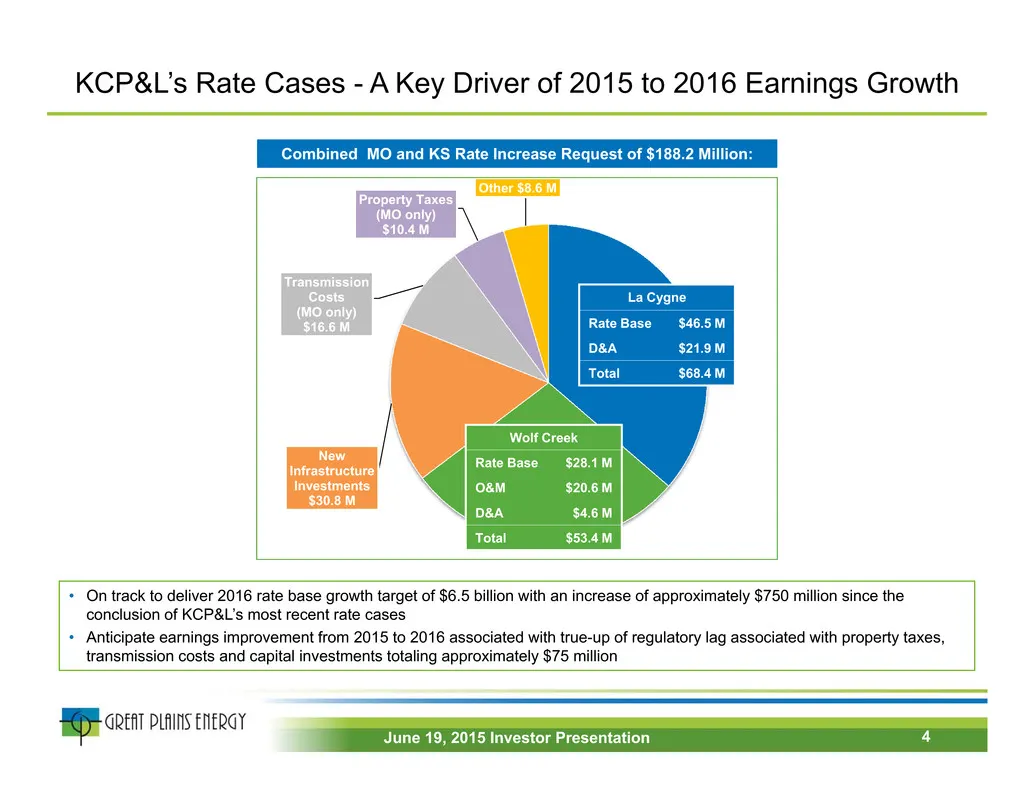
KCP&L’s Rate Cases - A Key Driver of 2015 to 2016 Earnings Growth New Infrastructure Investments $30.8 M Transmission Costs (MO only) $16.6 M Property Taxes (MO only) $10.4 M Other $8.6 M La Cygne Rate Base $46.5 M D&A $21.9 M Total $68.4 M Wolf Creek Rate Base $28.1 M O&M $20.6 M D&A $4.6 M Total $
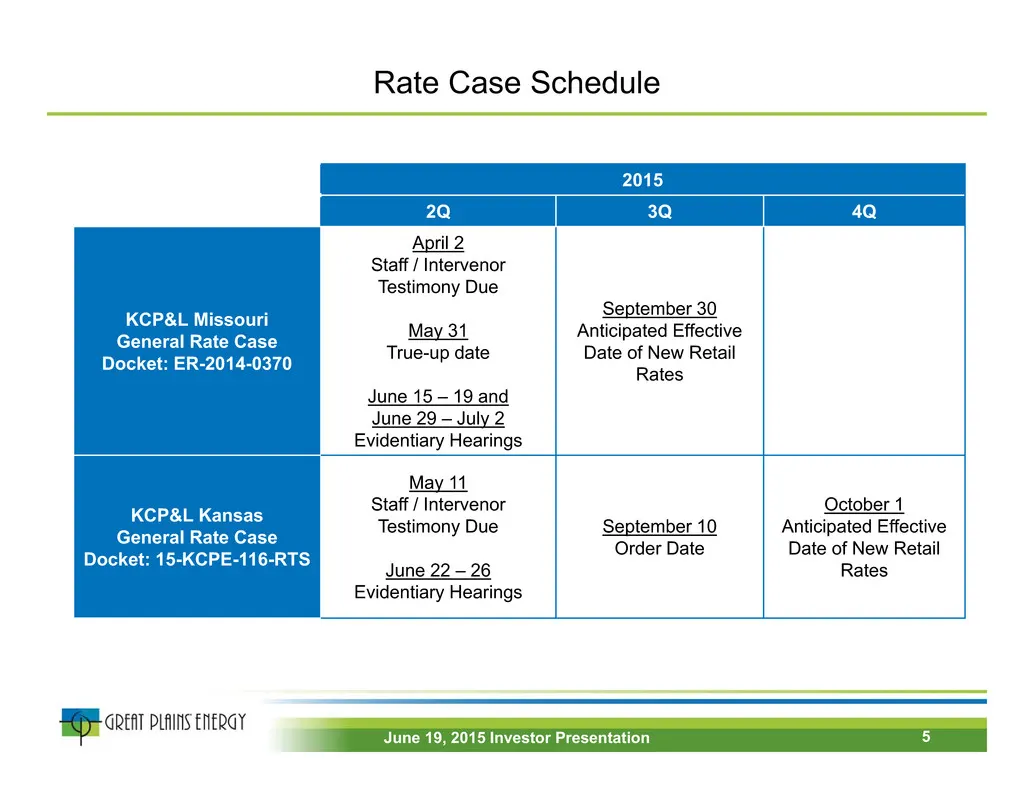
Slide 5: Rate Case Schedule
Rate Case Schedule 2015 2Q 3Q 4Q KCP&L Missouri General Rate Case Docket: ER-2014-0370 April 2 Staff / Intervenor Testimony Due May 31 True-up date June 15 – 19 and June 29 – July 2 Evidentiary Hearings September 30 Anticipated Effective Date of New Retail Rates KCP&L Kansas General Rate Case Docket
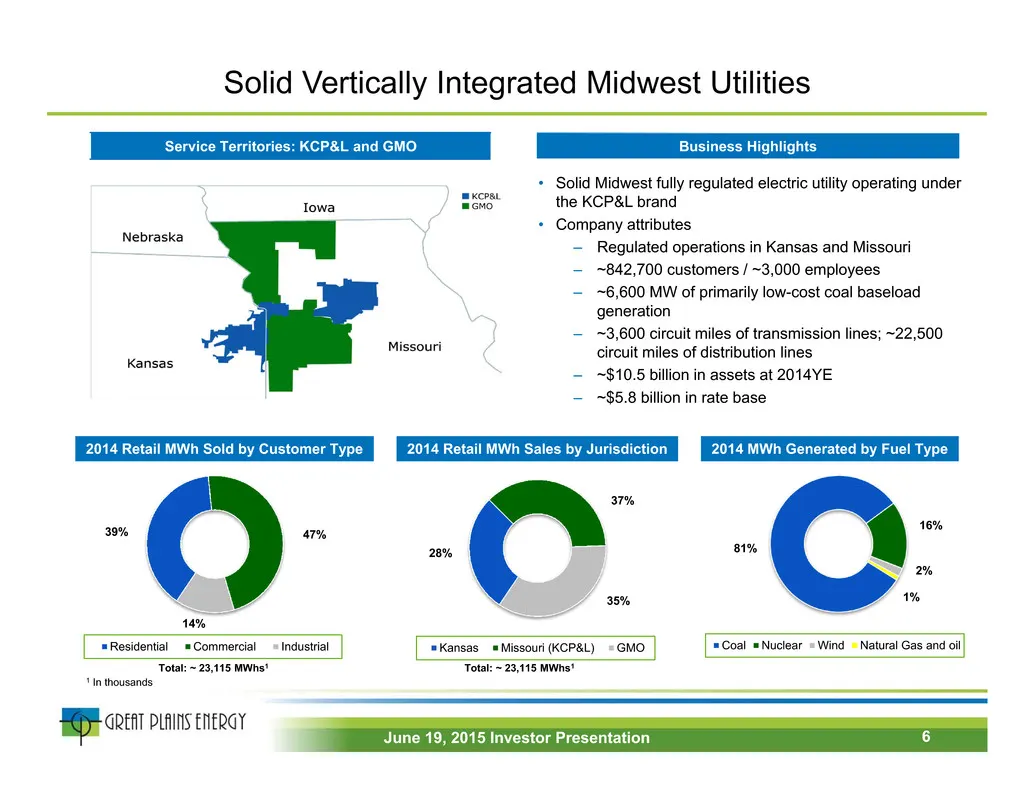
Slide 6: Solid Vertically Integrated Midwest Utilities
Solid Vertically Integrated Midwest Utilities 39% 47% 14% Residential Commercial Industrial 28% 37% 35% Kansas Missouri (KCP&L) GMO • Solid Midwest fully regulated electric utility operating under the KCP&L brand • Company attributes – Regulated operations in Kansas and Missouri – ~842,700 customers
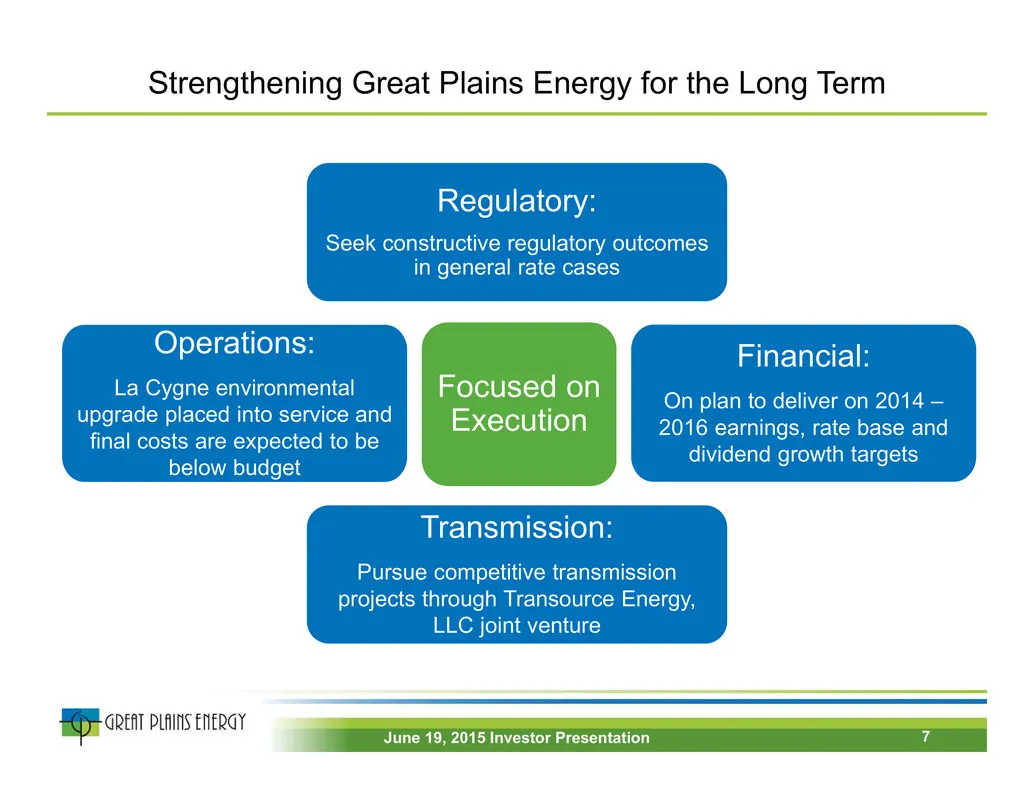
Slide 7: Strengthening Great Plains Energy for the Long Term
Strengthening Great Plains Energy for the Long Term Focused on Execution Regulatory: Seek constructive regulatory outcomes in general rate cases Financial: On plan to deliver on 2014 – 2016 earnings, rate base and dividend growth targets Transmission: Pursue competitive transmission projects through
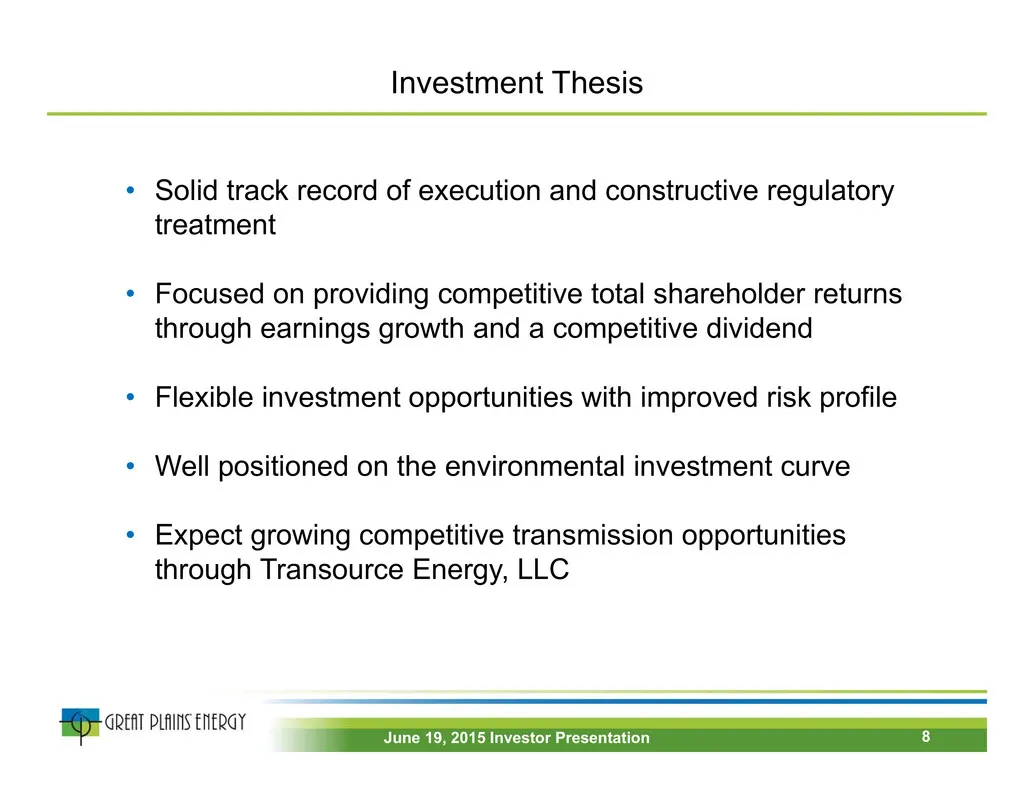
Slide 8: Investment Thesis
Investment Thesis • Solid track record of execution and constructive regulatory treatment • Focused on providing competitive total shareholder returns through earnings growth and a competitive dividend • Flexible investment opportunities with improved risk profile • Well positioned on the environmen
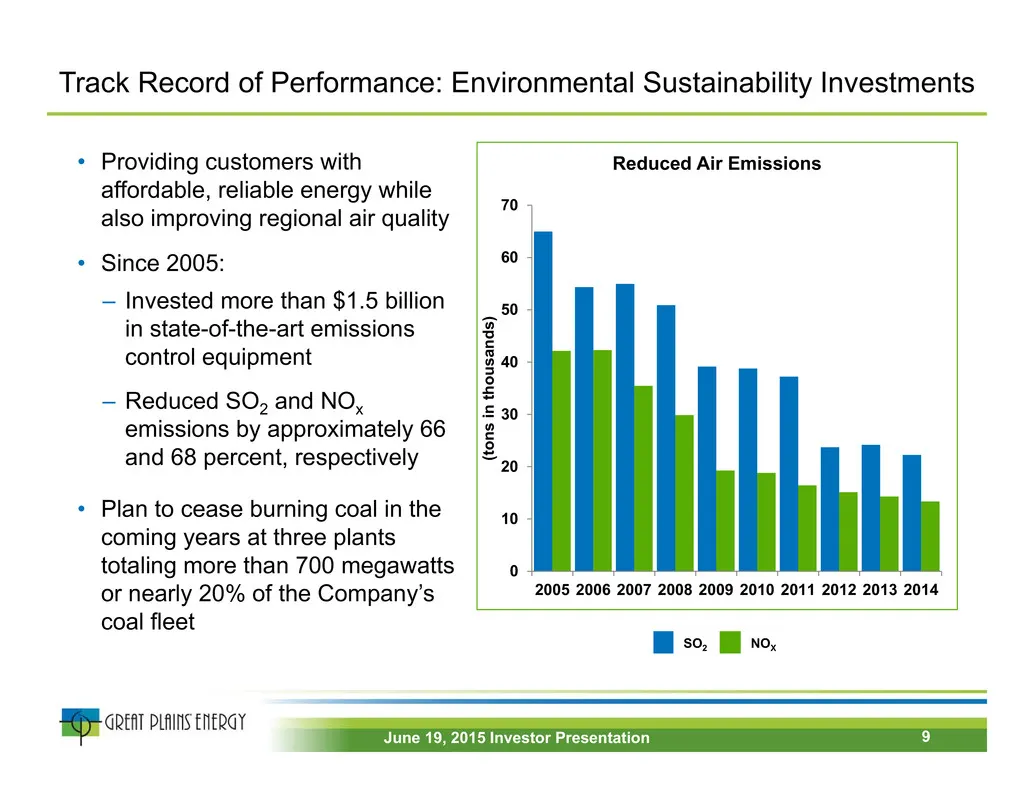
Slide 9: Track Record of Performance: Environmental Sustainability Investments
Track Record of Performance: Environmental Sustainability Investments • Providing customers with affordable, reliable energy while also improving regional air quality • Since 2005: – Invested more than $1.5 billion in state-of-the-art emissions control equipment – Reduced SO2 and NOx emissions by ap
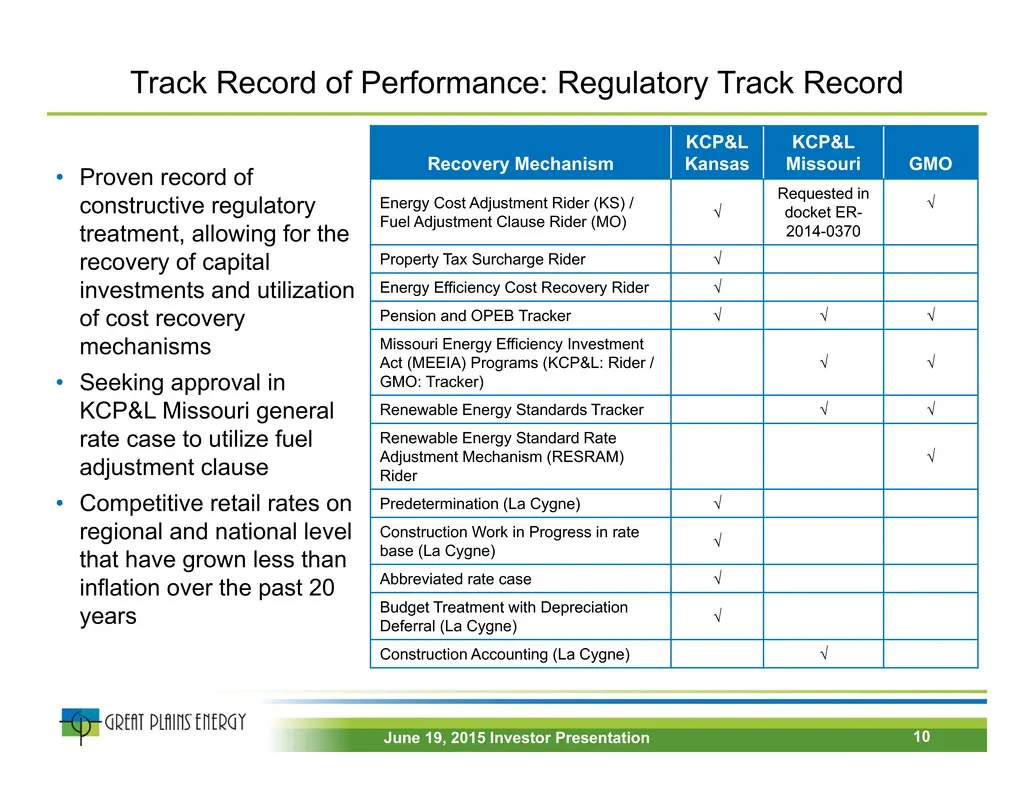
Slide 10: Track Record of Performance: Regulatory Track Record
Track Record of Performance: Regulatory Track Record • Proven record of constructive regulatory treatment, allowing for the recovery of capital investments and utilization of cost recovery mechanisms • Seeking approval in KCP&L Missouri general rate case to utilize fuel adjustment clause • Competiti
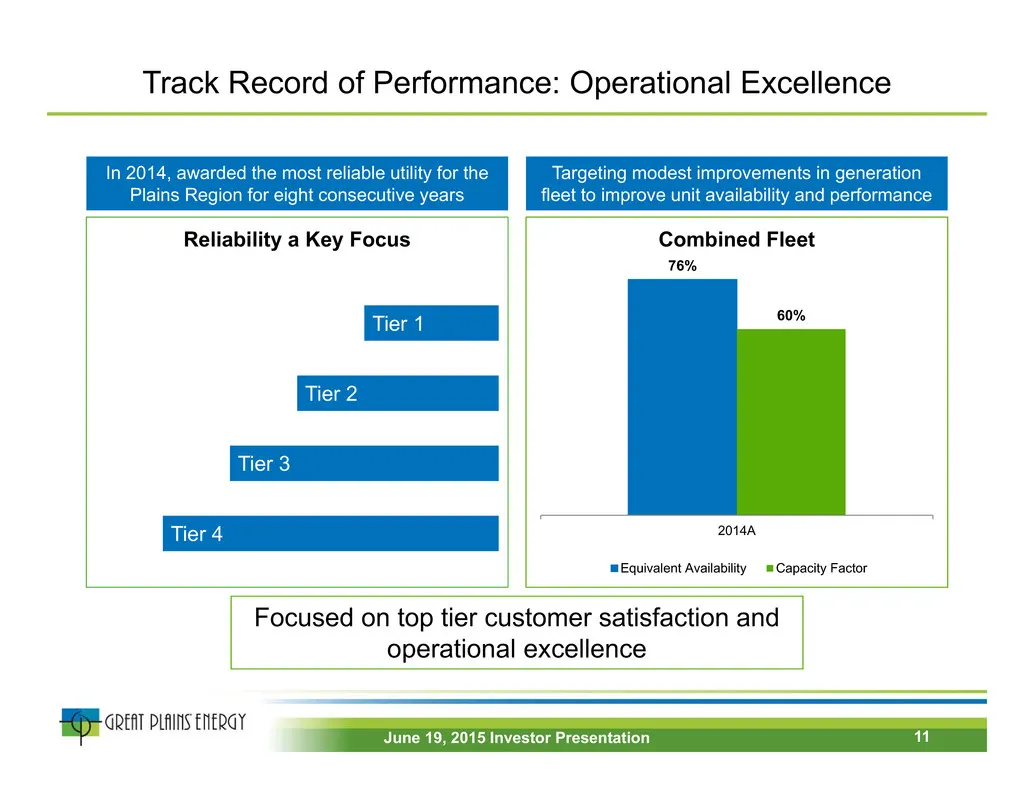
Slide 11: Track Record of Performance: Operational Excellence
Track Record of Performance: Operational Excellence Focused on top tier customer satisfaction and operational excellence Tier 4 Tier 3 Tier 2 Tier 1 Reliability a Key Focus In 2014, awarded the most reliable utility for the Plains Region for eight consecutive years 76% 60% 2014A Combined Fleet Equiv
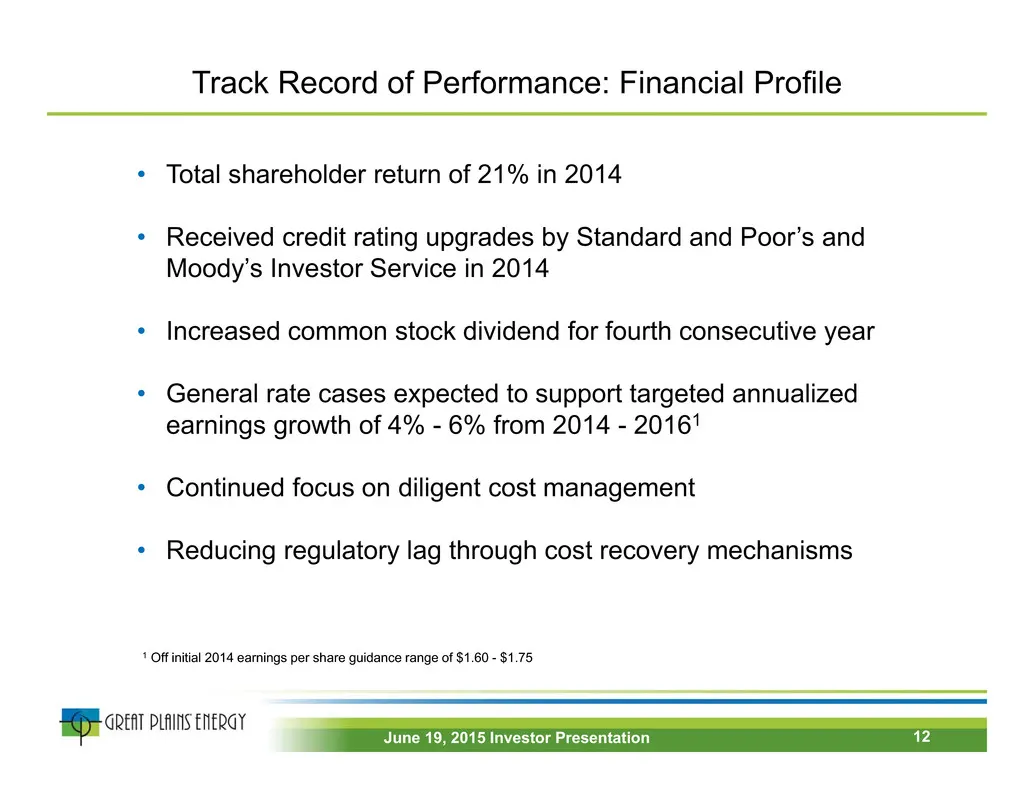
Slide 12: Track Record of Performance: Financial Profile
Track Record of Performance: Financial Profile • Total shareholder return of 21% in 2014 • Received credit rating upgrades by Standard and Poor’s and Moody’s Investor Service in 2014 • Increased common stock dividend for fourth consecutive year • General rate cases expected to support targeted annua
Slide 13: Solid TSR Opportunities Ahead with Flexibility: Focused on Reducing Lag
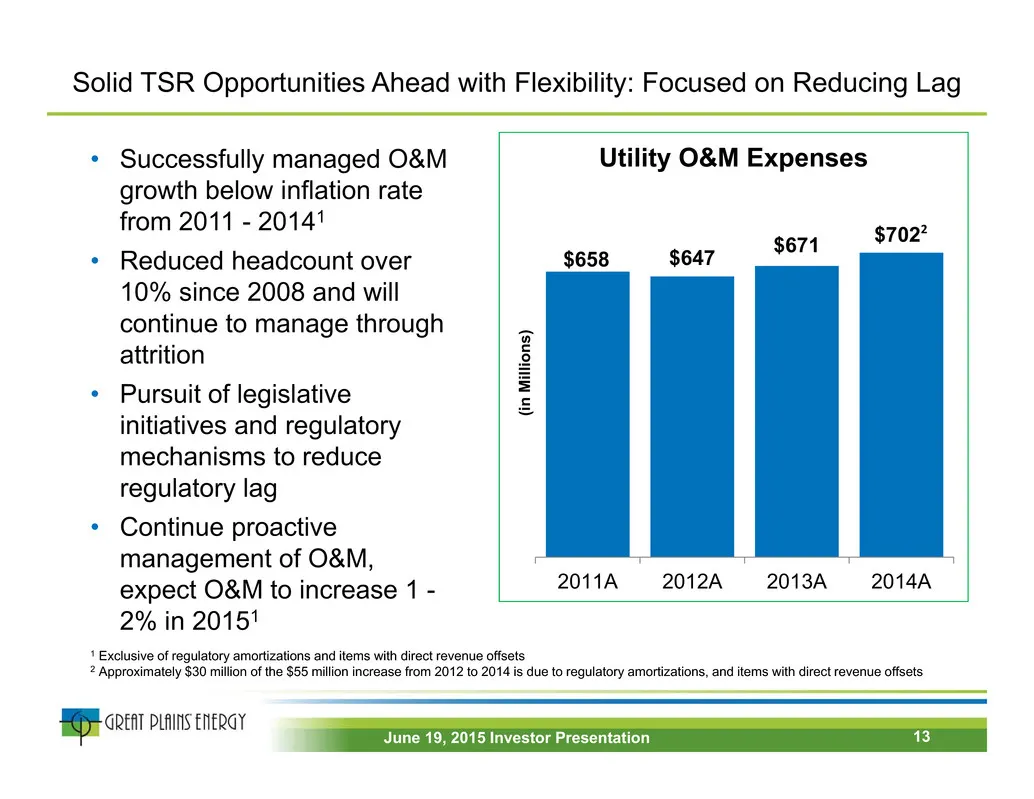
Solid TSR Opportunities Ahead with Flexibility: Focused on Reducing Lag $658 $647 $671 $702 2011A 2012A 2013A 2014A (in Millions ) Utility O&M Expenses• Successfully managed O&M growth below inflation rate from 2011 - 20141 • Reduced headcount over 10% since 2008 and will continue to manage through
Slide 14: Long-Term Growth Targets
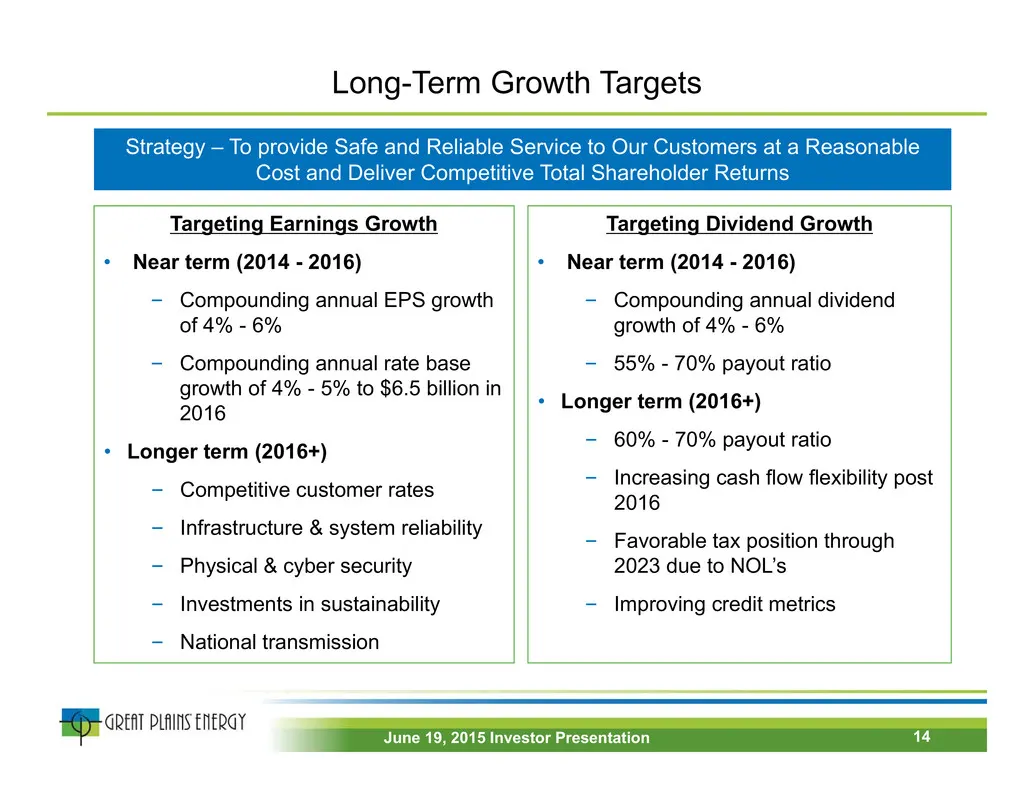
Long-Term Growth Targets Targeting Earnings Growth • Near term (2014 - 2016) ‒ Compounding annual EPS growth of 4% - 6% ‒ Compounding annual rate base growth of 4% - 5% to $6.5 billion in 2016 • Longer term (2016+) ‒ Competitive customer rates ‒ Infrastructure & system reliability ‒ Physical & cyber
Slide 15: Solid TSR Opportunities Ahead with Flexibility: Dividend Growth
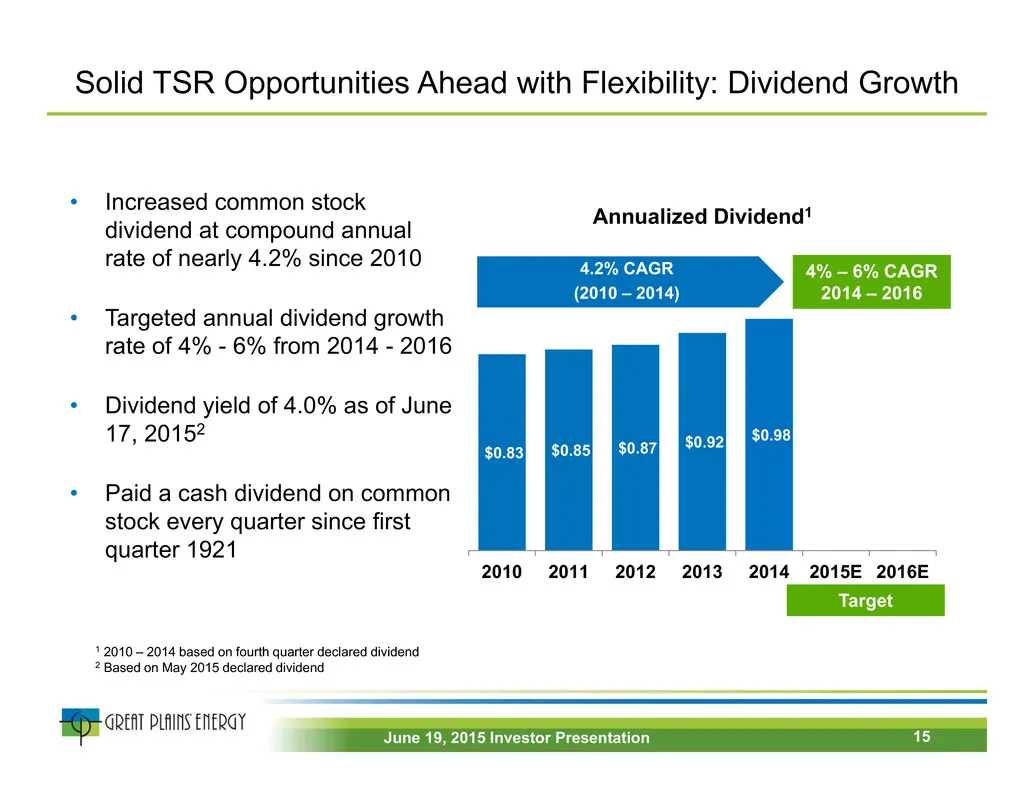
$0.83 $0.85 $0.87 $0.92 $0.98 2010 2011 2012 2013 2014 2015E 2016E Annualized Dividend1 Solid TSR Opportunities Ahead with Flexibility: Dividend Growth 1 2010 – 2014 based on fourth quarter declared dividend 2 Based on May 2015 declared dividend • Increased common stock dividend at compound annual r
Slide 16: GXP – Attractive Platform for Shareholders
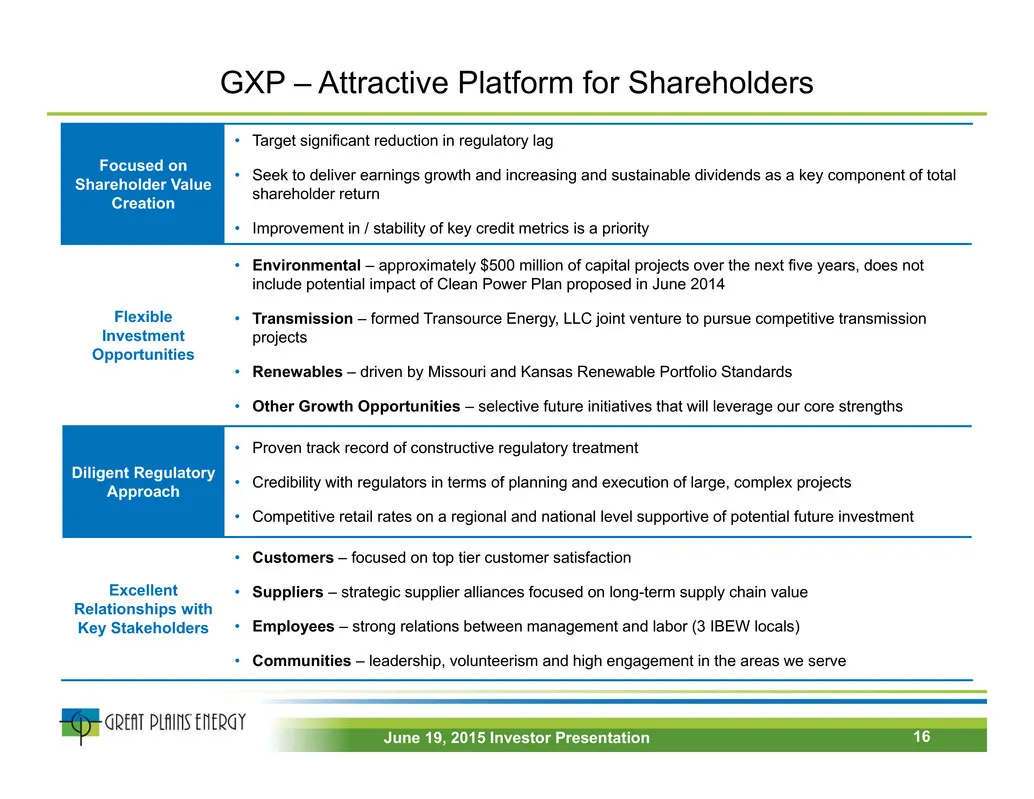
GXP – Attractive Platform for Shareholders Focused on Shareholder Value Creation • Target significant reduction in regulatory lag • Seek to deliver earnings growth and increasing and sustainable dividends as a key component of total shareholder return • Improvement in / stability of key credit metri
Slide 17: Investor Relations Information
• NYSE: GXP • www.greatplainsenergy.com • Company Contacts: Lori Wright Vice President – Investor Relations and Treasurer (816) 556-2506 lori.wright@kcpl.com Tony Carreño Director, Investor Relations (816) 654-1763 anthony.carreno@kcpl.com Investor Relations Information 17June 19, 2015 Investor Pres
Slide 18: Appendix Pages
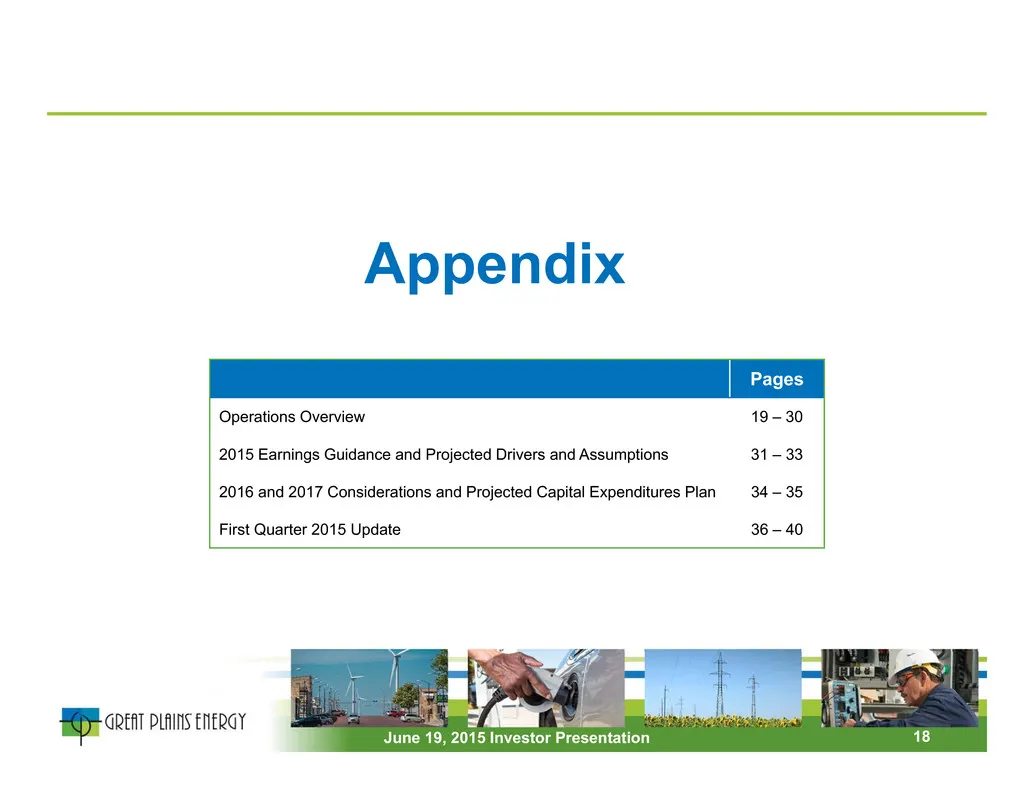
Appendix Pages Operations Overview 19 – 30 2015 Earnings Guidance and Projected Drivers and Assumptions 31 – 33 2016 and 2017 Considerations and Projected Capital Expenditures Plan 34 – 35 First Quarter 2015 Update 36 – 40 18June 19, 2015 Investor Presentation
Slide 19: Environmental
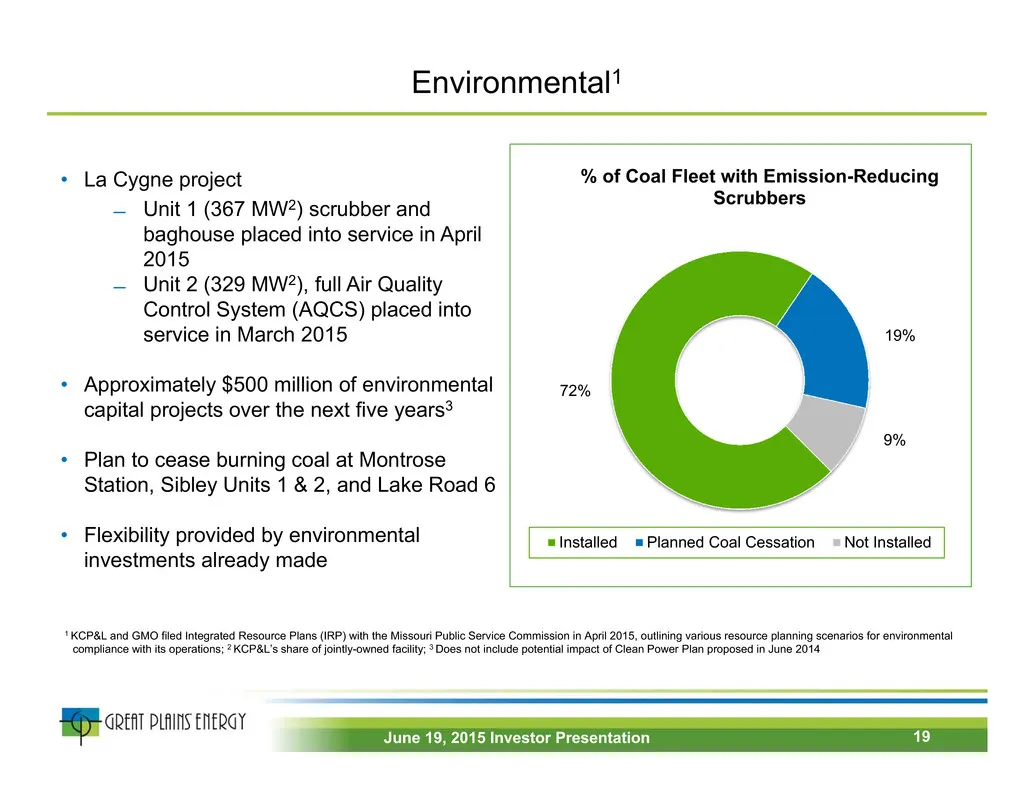
Environmental1 72% 19% 9% % of Coal Fleet with Emission-Reducing Scrubbers Installed Planned Coal Cessation Not Installed • La Cygne project ̶ Unit 1 (367 MW2) scrubber and baghouse placed into service in April 2015 ̶ Unit 2 (329 MW2), full Air Quality Control System (AQCS) placed into service in Ma
Slide 20: La Cygne Environmental Upgrade, Construction Update
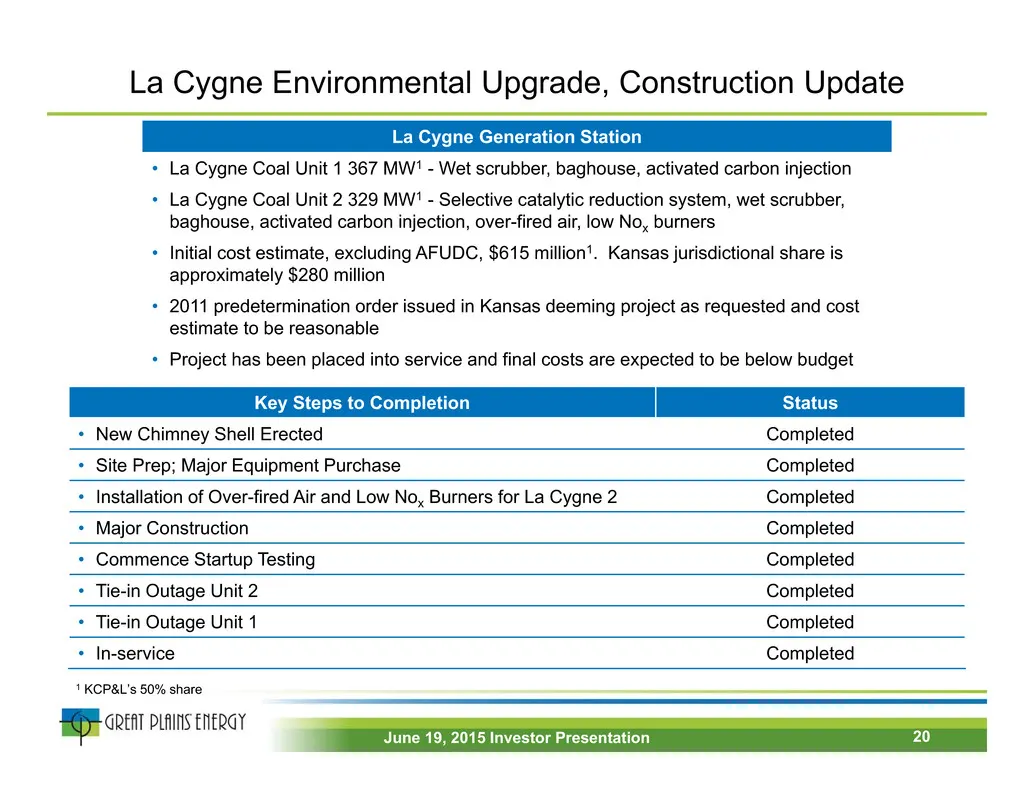
La Cygne Environmental Upgrade, Construction Update 1 KCP&L’s 50% share Key Steps to Completion Status • New Chimney Shell Erected Completed • Site Prep; Major Equipment Purchase Completed • Installation of Over-fired Air and Low Nox Burners for La Cygne 2 Completed • Major Construction Completed •
Slide 21: Renewable Energy and Energy Efficiency
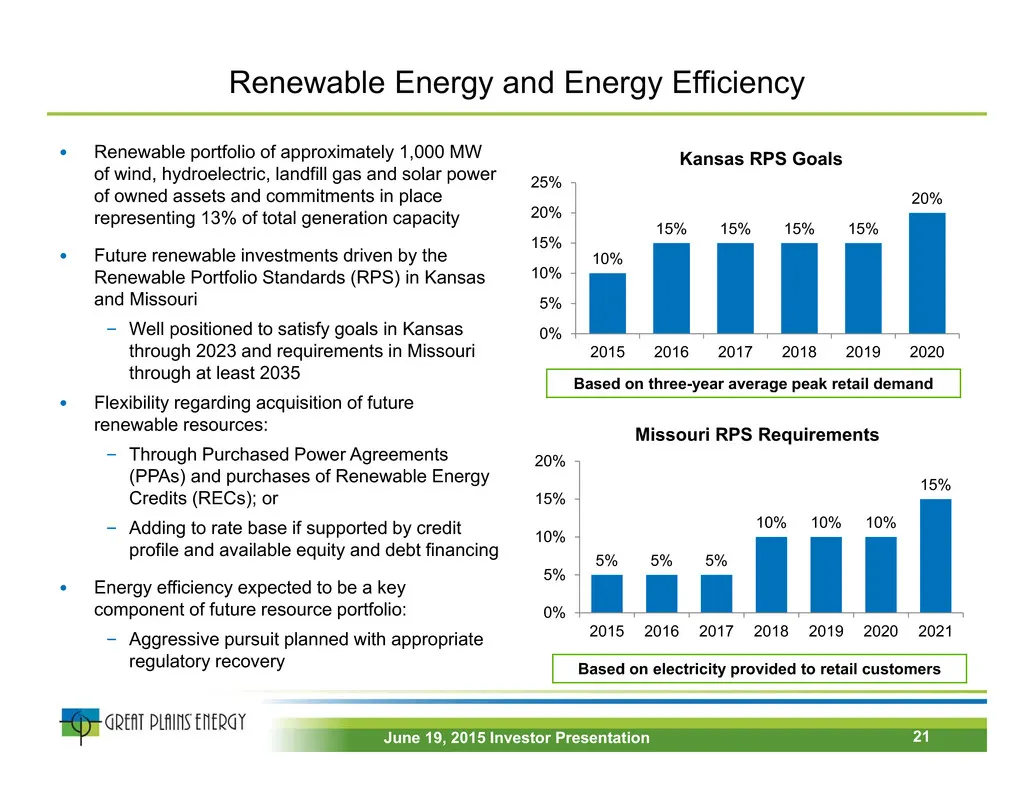
Renewable Energy and Energy Efficiency • Renewable portfolio of approximately 1,000 MW of wind, hydroelectric, landfill gas and solar power of owned assets and commitments in place representing 13% of total generation capacity • Future renewable investments driven by the Renewable Portfolio Standard
Slide 22: Transource Energy, LLC
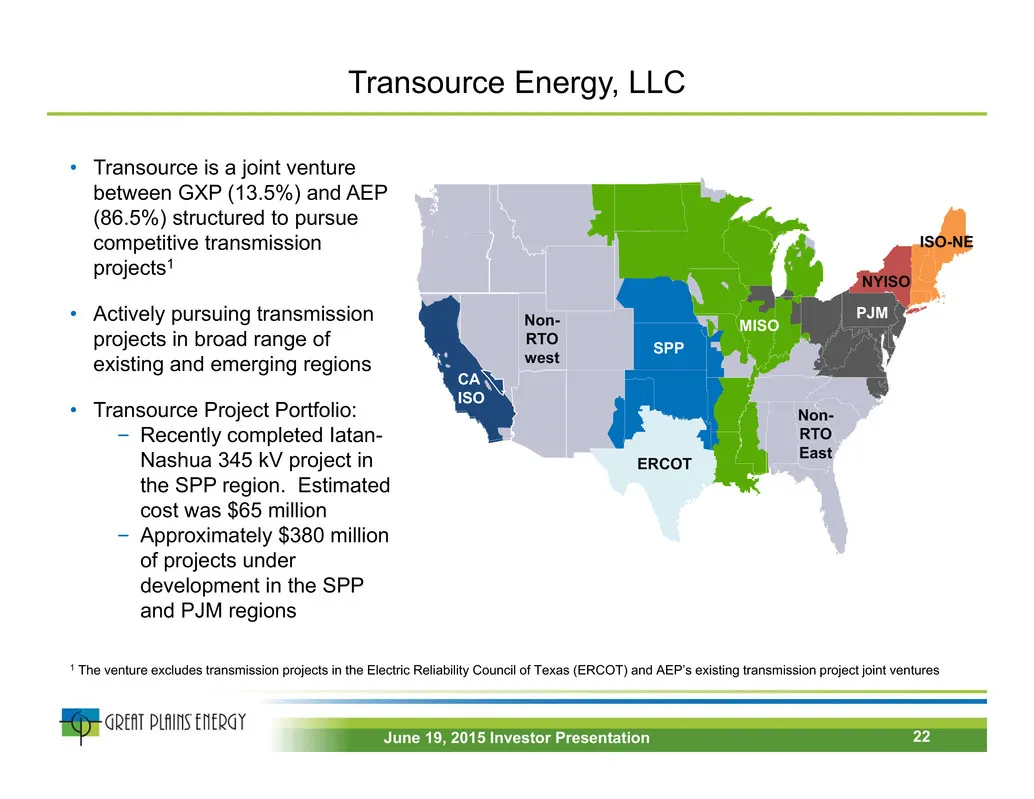
Transource Energy, LLC SPP ERCOT CA ISO Non- RTO west Non- RTO East MISO PJM NYISO ISO-NE • Transource is a joint venture between GXP (13.5%) and AEP (86.5%) structured to pursue competitive transmission projects1 • Actively pursuing transmission projects in broad range of existing and emerging regi
Slide 23: Transource's Competitive Advantage
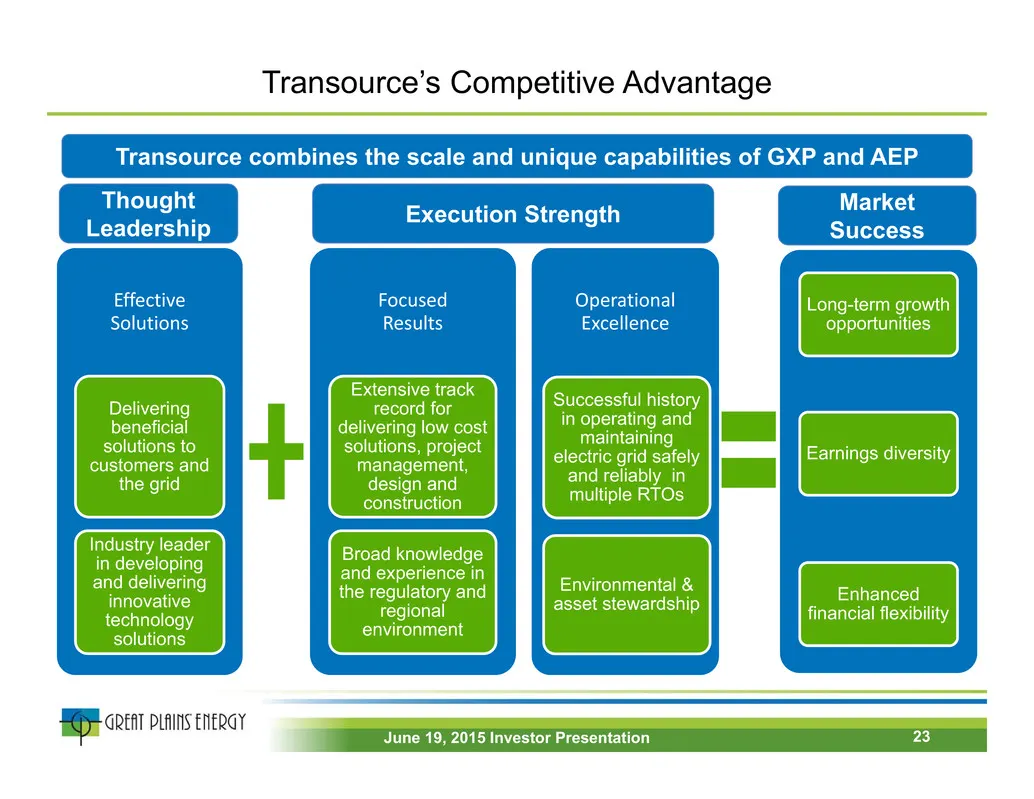
Transource’s Competitive Advantage Transource combines the scale and unique capabilities of GXP and AEP Operational Excellence Successful history in operating and maintaining electric grid safely and reliably in multiple RTOs Environmental & asset stewardship Focused Results Extensive track record f
Slide 24: Competitive Process Timeline for Initial Focus Regions
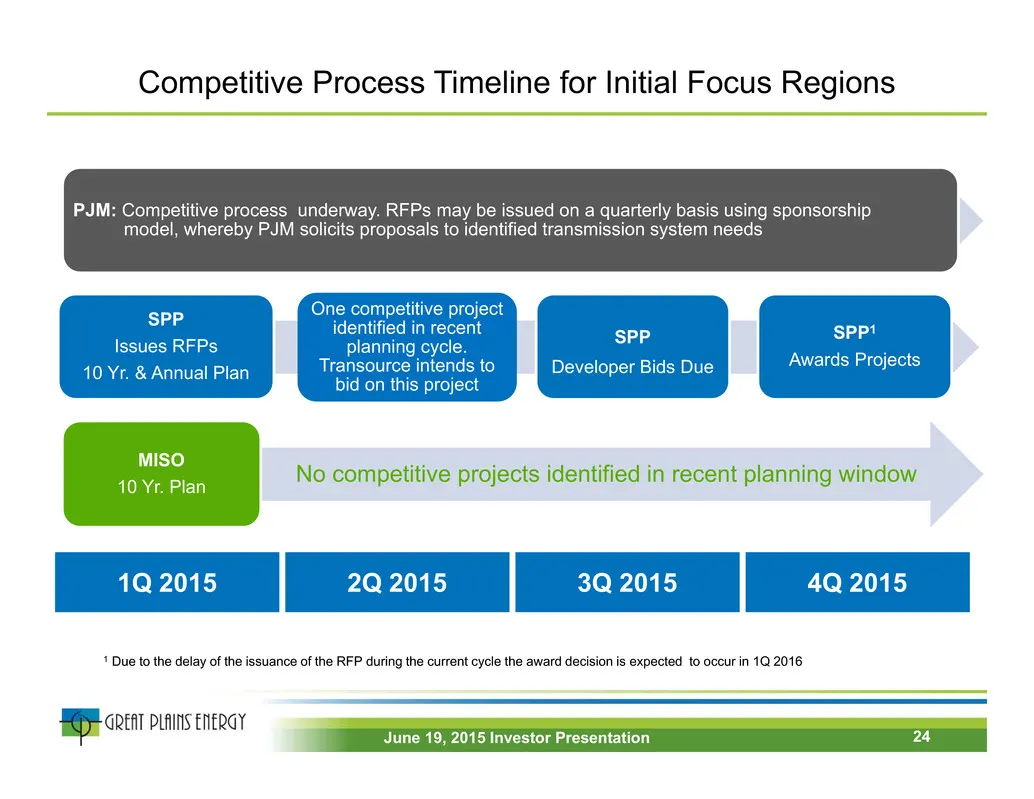
Competitive Process Timeline for Initial Focus Regions 1Q 2015 2Q 2015 3Q 2015 4Q 2015 SPP Issues RFPs 10 Yr. & Annual Plan One competitive project identified in recent planning cycle. Transource intends to bid on this project SPP Developer Bids Due SPP1 Awards Projects PJM: Competitive process unde
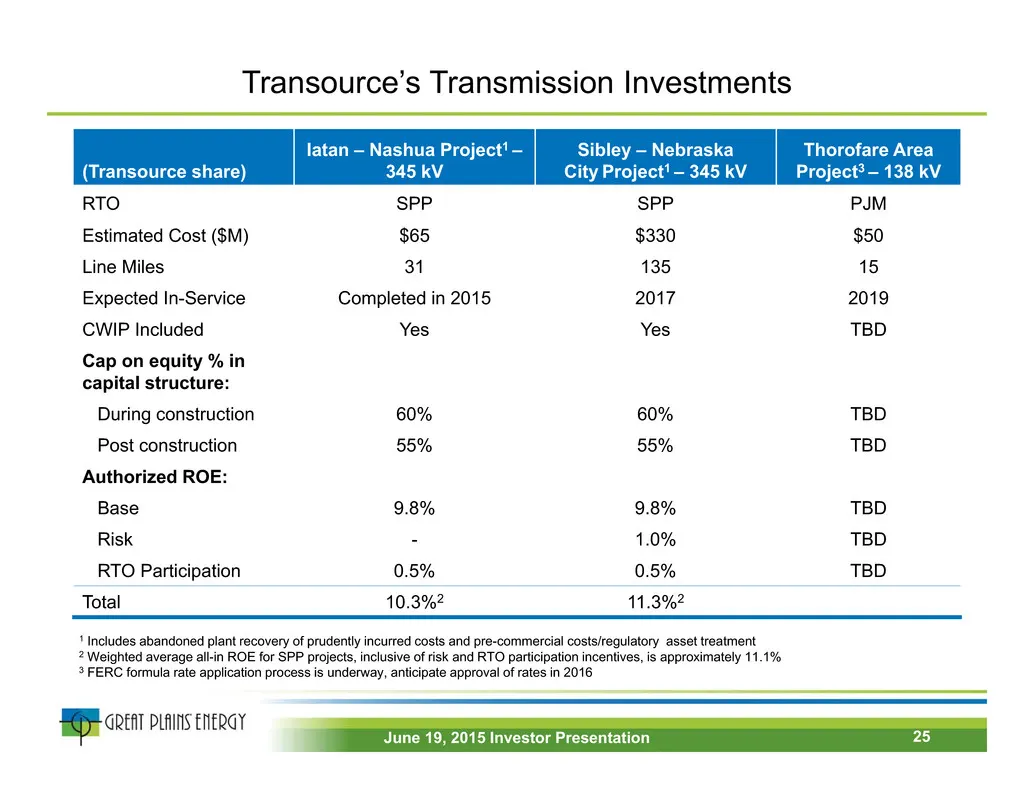
Slide 25: Transource's Transmission Investments
Transource’s Transmission Investments 25June 19, 2015 Investor Presentation (Transource share) Iatan – Nashua Project1 – 345 kV Sibley – Nebraska City Project1 – 345 kV Thorofare Area Project3 – 138 kV RTO SPP SPP PJM Estimated Cost ($M) $65 $330 $50 Line Miles 31 135 15 Expected In-Service Complete
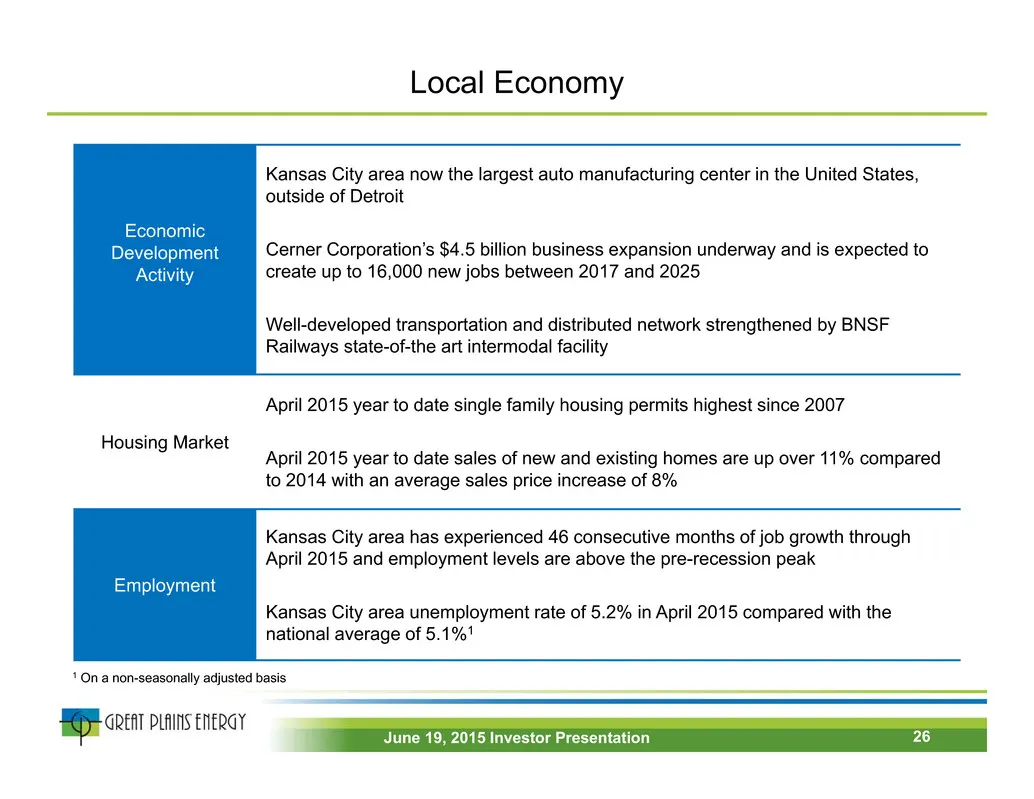
Slide 26: Local Economy
Local Economy Economic Development Activity Kansas City area now the largest auto manufacturing center in the United States, outside of Detroit Cerner Corporation’s $4.5 billion business expansion underway and is expected to create up to 16,000 new jobs between 2017 and 2025 Well-developed transport
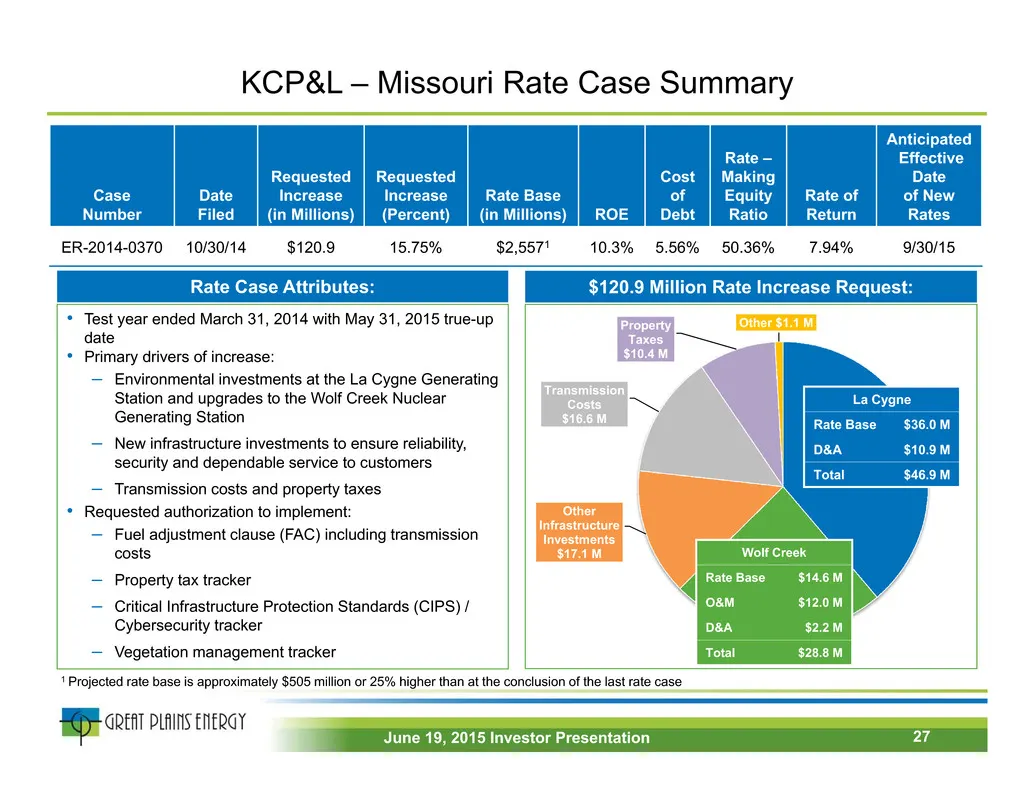
Slide 27: KCP&L – Missouri Rate Case Summary
KCP&L – Missouri Rate Case Summary Case Number Date Filed Requested Increase (in Millions) Requested Increase (Percent) Rate Base (in Millions) ROE Cost of Debt Rate – Making Equity Ratio Rate of Return Anticipated Effective Date of New Rates ER-2014-0370 10/30/14 $120.9 15.75% $2,5571 10.3% 5.56% 5
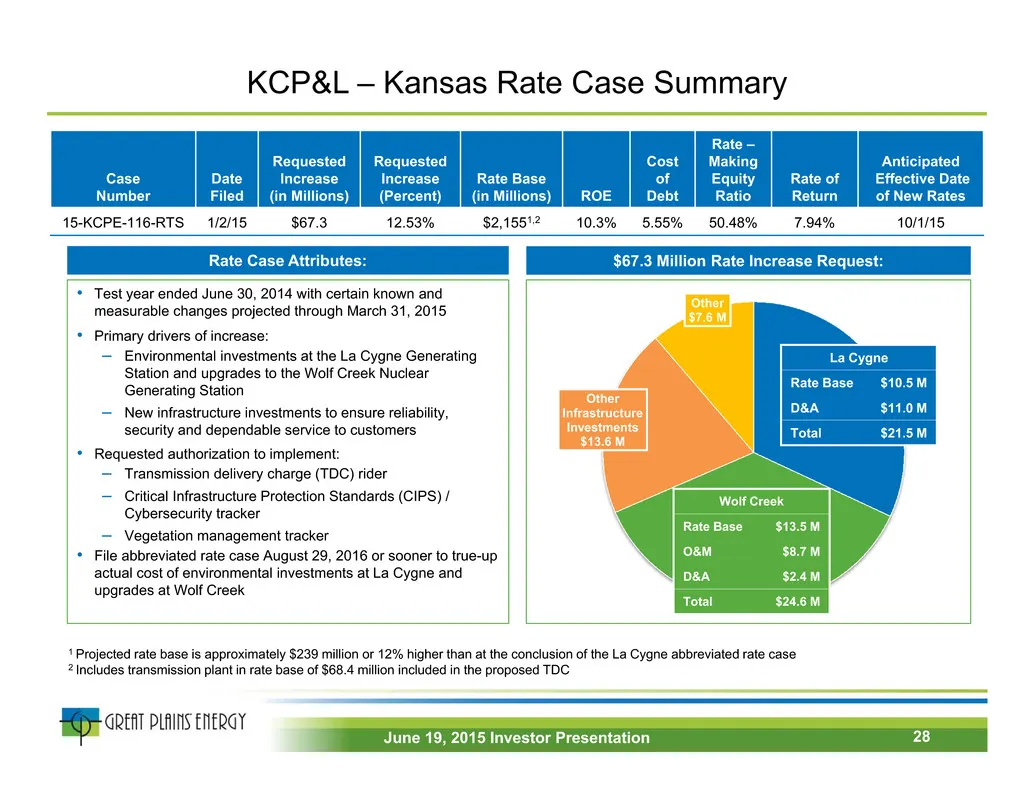
Slide 28: KCP&L – Kansas Rate Case Summary
KCP&L – Kansas Rate Case Summary Case Number Date Filed Requested Increase (in Millions) Requested Increase (Percent) Rate Base (in Millions) ROE Cost of Debt Rate – Making Equity Ratio Rate of Return Anticipated Effective Date of New Rates 15-KCPE-116-RTS 1/2/15 $67.3 12.53% $2,1551,2 10.3% 5.55% 5
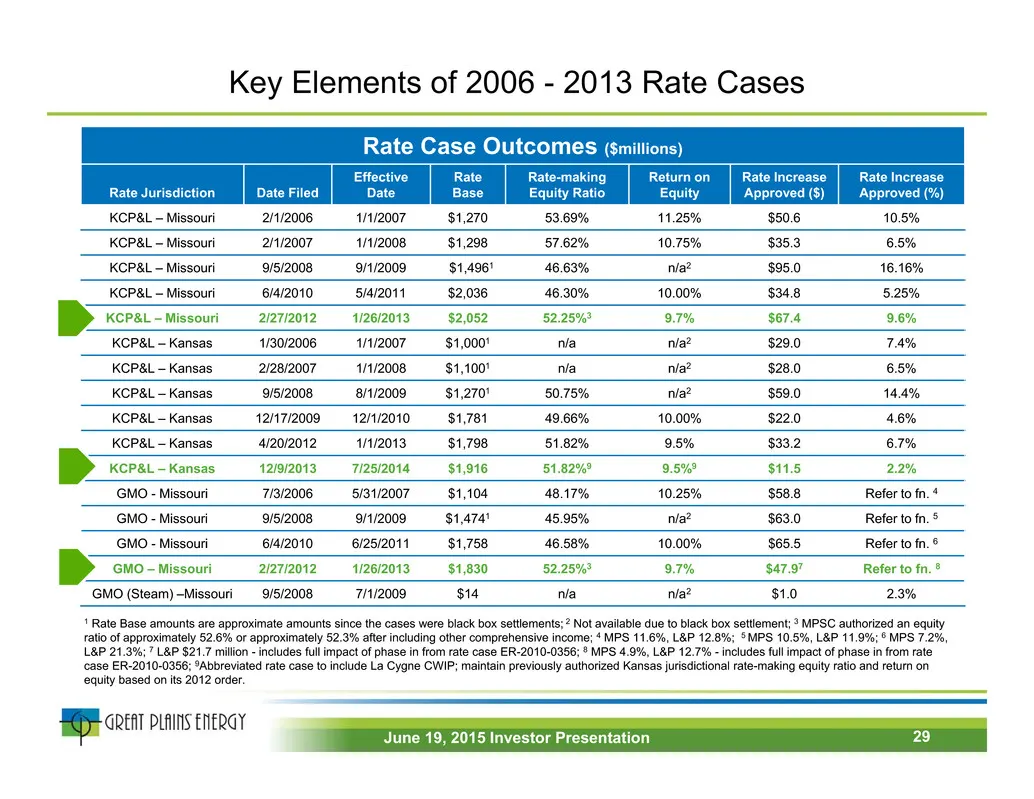
Slide 29: Key Elements of 2006 - 2013 Rate Cases
Key Elements of 2006 - 2013 Rate Cases Rate Case Outcomes ($millions) Rate Jurisdiction Date Filed Effective Date Rate Base Rate-making Equity Ratio Return on Equity Rate Increase Approved ($) Rate Increase Approved (%) KCP&L – Missouri 2/1/2006 1/1/2007 $1,270 53.69% 11.25% $50.6 10.5% KCP&L – Miss
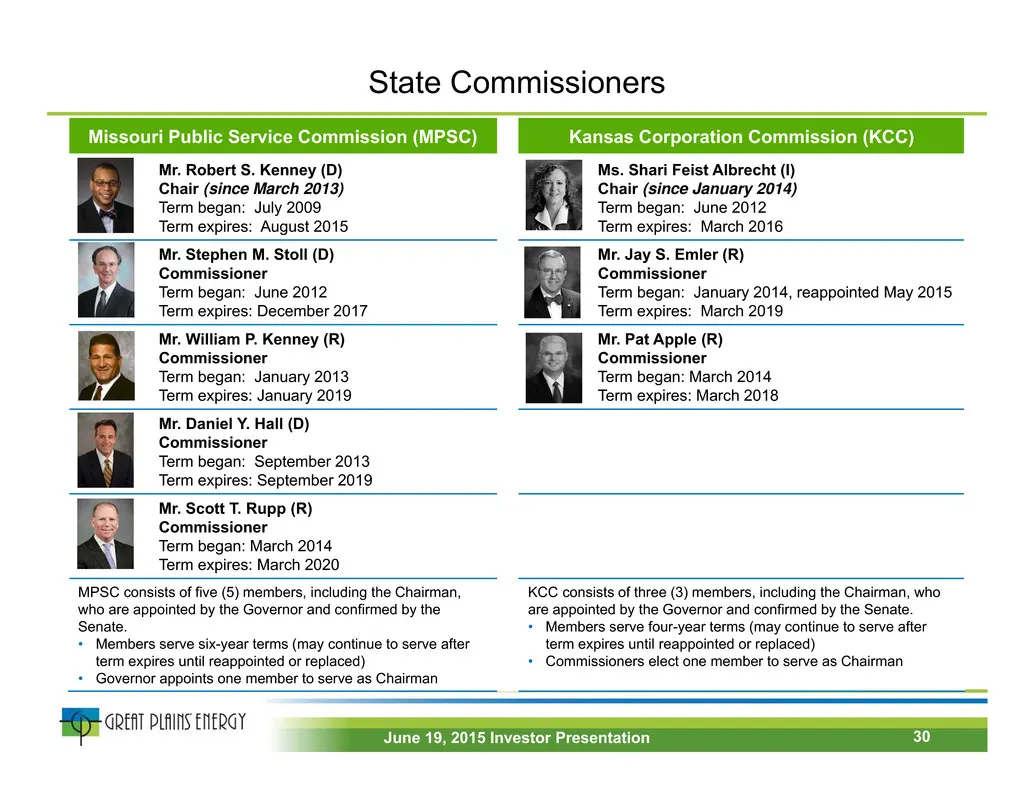
Slide 30: State Commissioners
State Commissioners Missouri Public Service Commission (MPSC) Kansas Corporation Commission (KCC) Mr. Robert S. Kenney (D) Chair (since March 2013) Term began: July 2009 Term expires: August 2015 Ms. Shari Feist Albrecht (I) Chair (since January 2014) Term began: June 2012 Term expires: March 2016 M
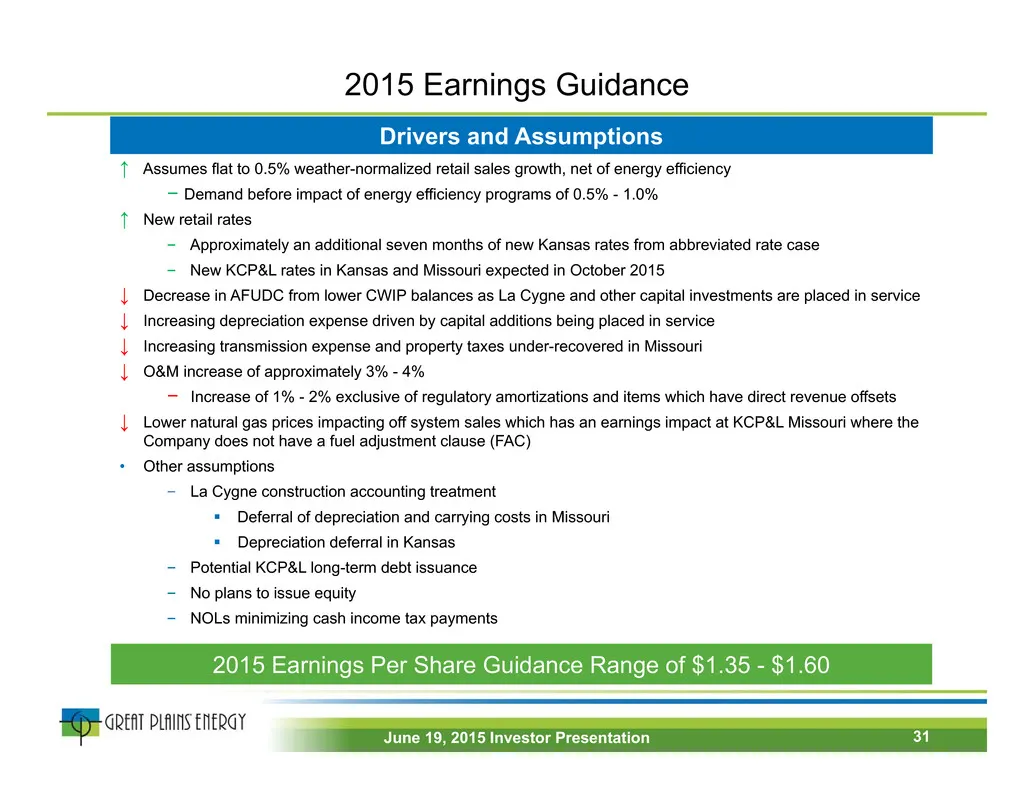
Slide 31: 2015 Earnings Guidance Drivers and Assumptions
2015 Earnings Guidance Drivers and Assumptions ↑ Assumes flat to 0.5% weather-normalized retail sales growth, net of energy efficiency ‒ Demand before impact of energy efficiency programs of 0.5% - 1.0% ↑ New retail rates ‒ Approximately an additional seven months of new Kansas rates from abbreviate
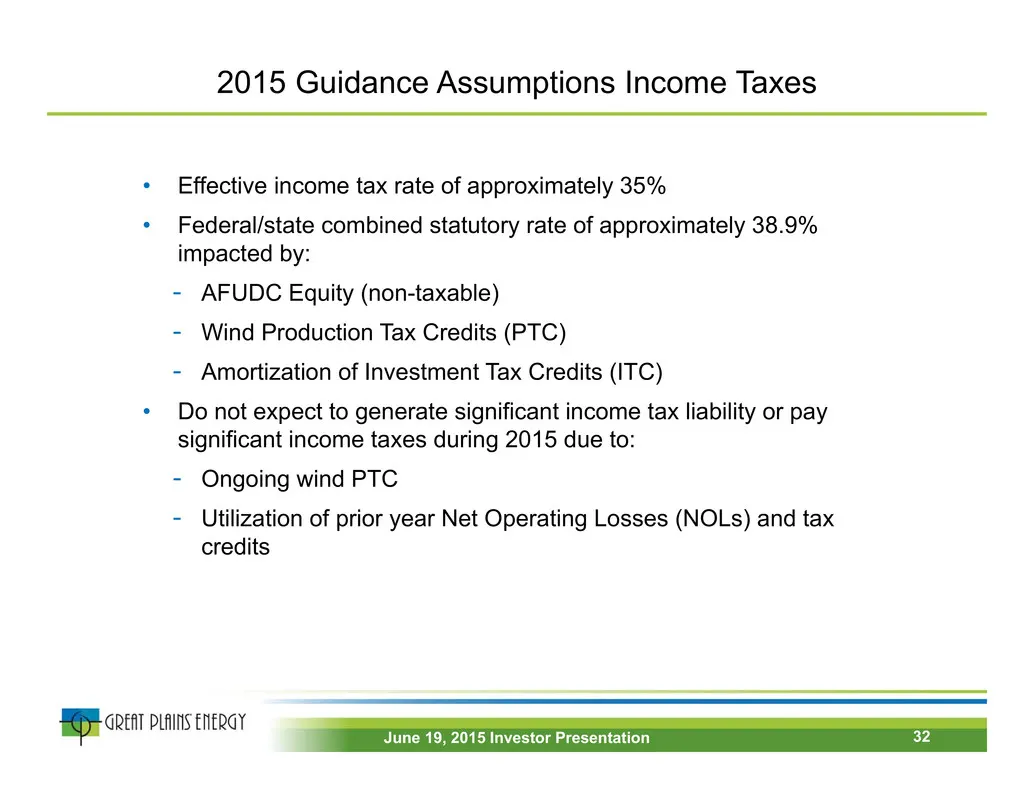
Slide 32: 2015 Guidance Assumptions: Income Taxes
2015 Guidance Assumptions Income Taxes • Effective income tax rate of approximately 35% • Federal/state combined statutory rate of approximately 38.9% impacted by: - AFUDC Equity (non-taxable) - Wind Production Tax Credits (PTC) - Amortization of Investment Tax Credits (ITC) • Do not expect to gener
Slide 33: 2015 Guidance Assumption: Deferred Income Tax
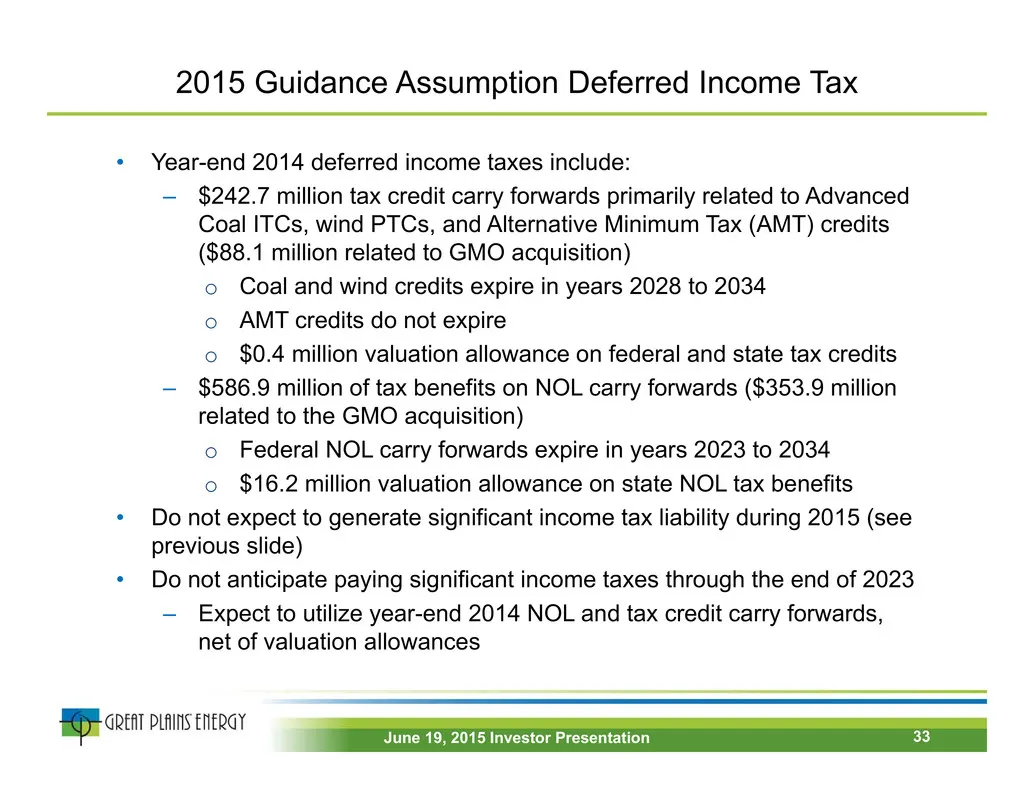
2015 Guidance Assumption Deferred Income Tax 33June 19, 2015 Investor Presentation • Year-end 2014 deferred income taxes include: – $242.7 million tax credit carry forwards primarily related to Advanced Coal ITCs, wind PTCs, and Alternative Minimum Tax (AMT) credits ($88.1 million related to GMO acq
Slide 34: 2016 and 2017 Considerations
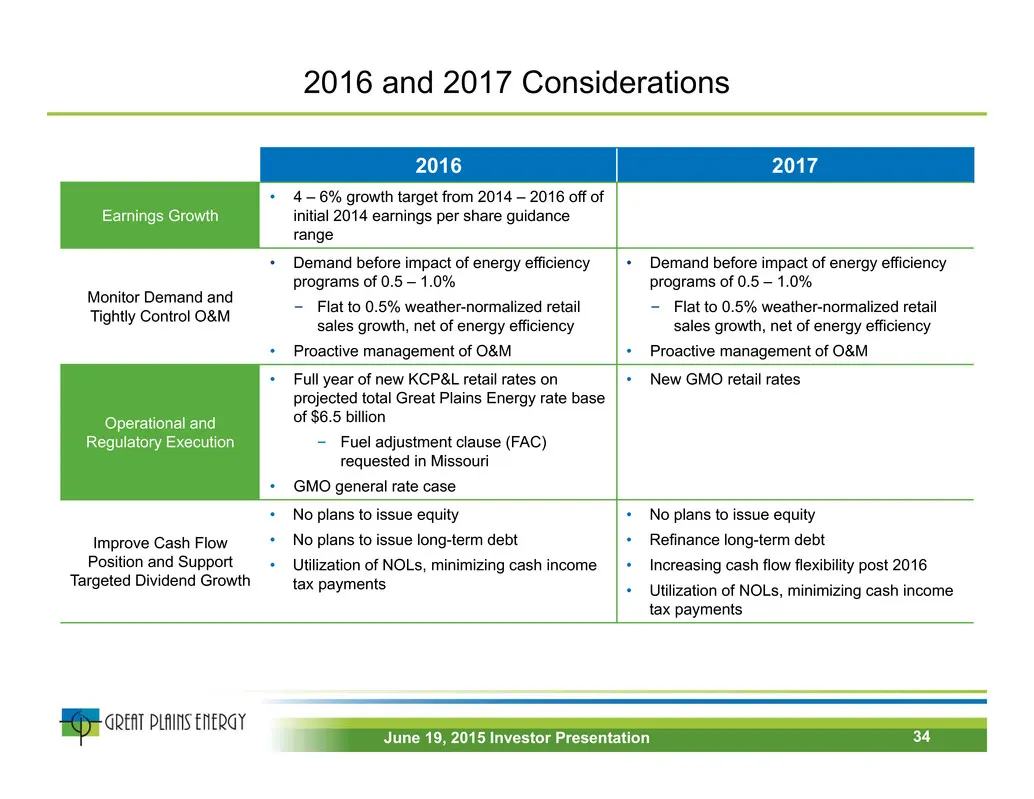
2016 and 2017 Considerations 2016 2017 Earnings Growth • 4 – 6% growth target from 2014 – 2016 off of initial 2014 earnings per share guidance range Monitor Demand and Tightly Control O&M • Demand before impact of energy efficiency programs of 0.5 – 1.0% ‒ Flat to 0.5% weather-normalized retail sale
Slide 35: Projected Utility Capital Expenditures
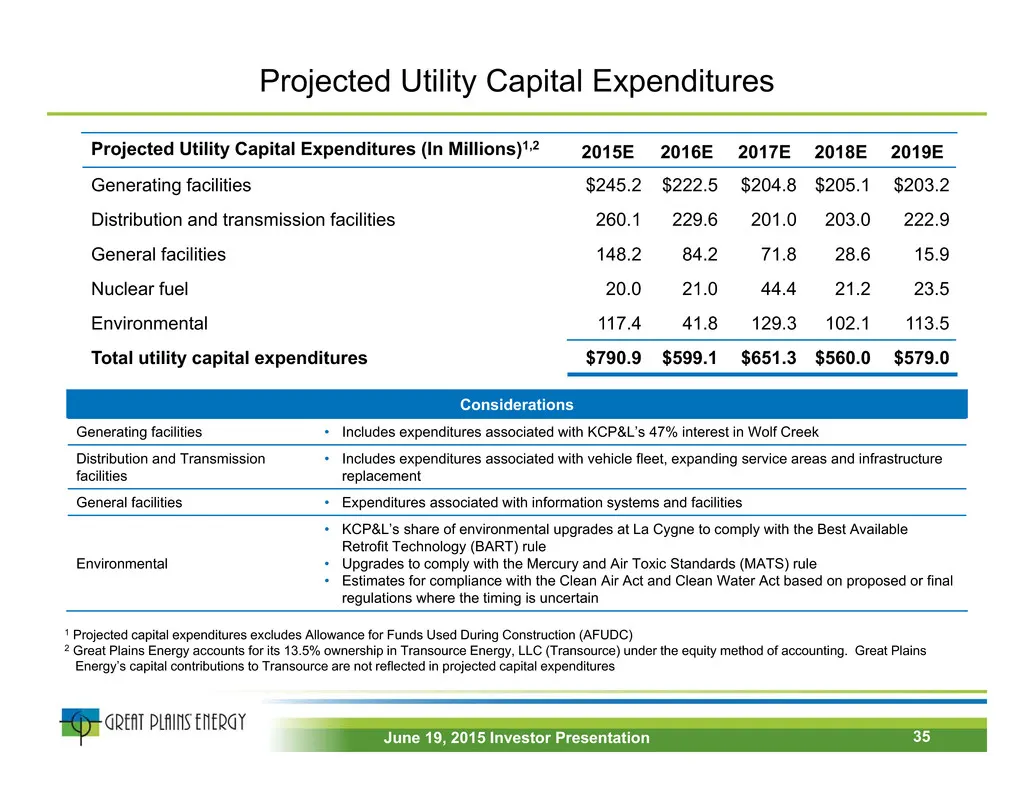
Projected Utility Capital Expenditures Considerations Generating facilities • Includes expenditures associated with KCP&L’s 47% interest in Wolf Creek Distribution and Transmission facilities • Includes expenditures associated with vehicle fleet, expanding service areas and infrastructure replacemen
Slide 36: 2015 First Quarter EPS Reconciliation Versus 2014
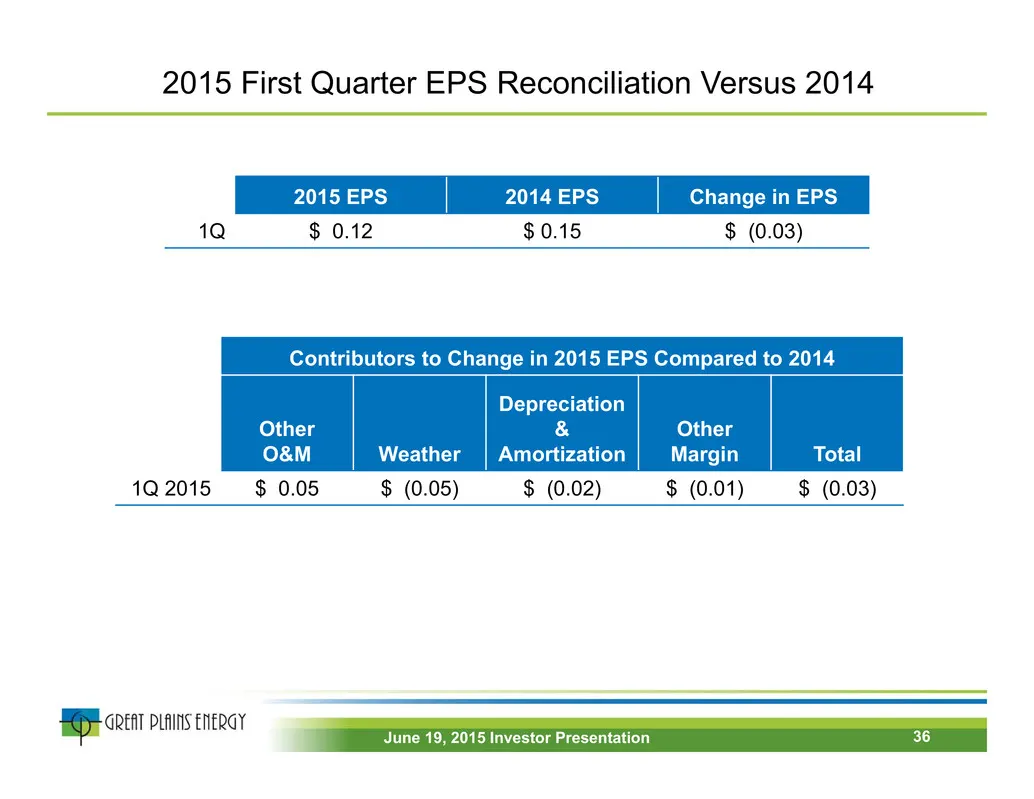
2015 First Quarter EPS Reconciliation Versus 2014 Contributors to Change in 2015 EPS Compared to 2014 Other O&M Weather Depreciation & Amortization Other Margin Total 1Q 2015 $ 0.05 $ (0.05) $ (0.02) $ (0.01) $ (0.03) 2015 EPS 2014 EPS Change in EPS 1Q $ 0.12 $ 0.15 $ (0.03) 36June 19, 2015 Investor
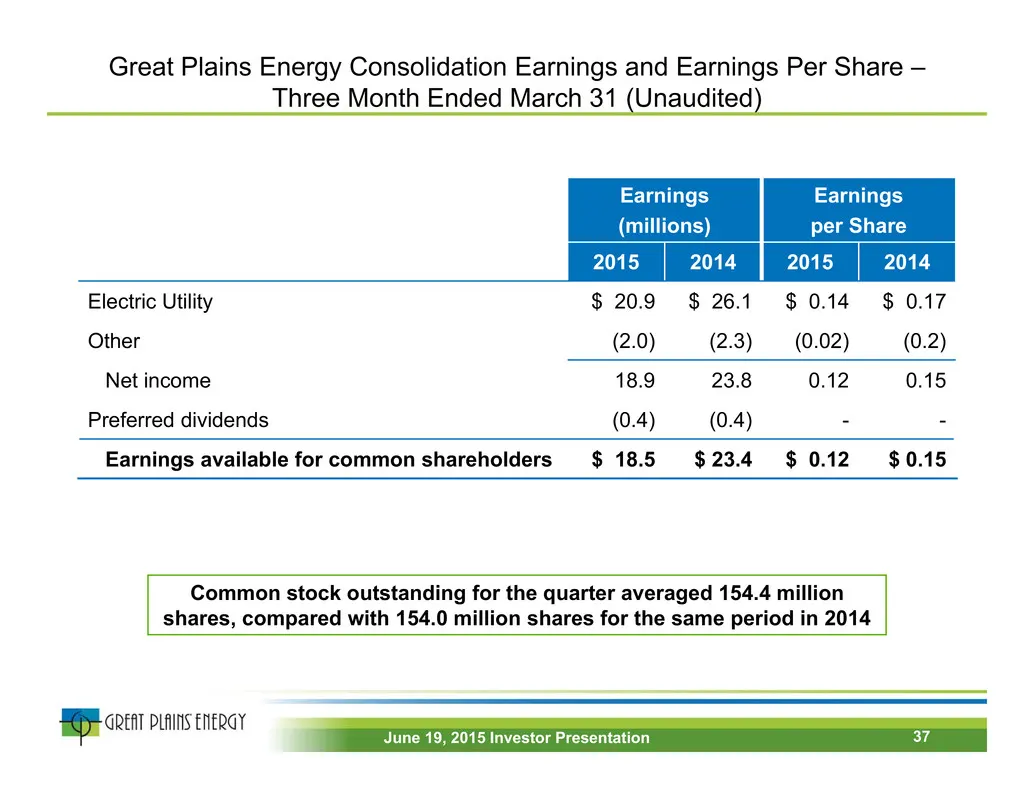
Slide 37: Consolidated Earnings and Earnings Per Share – Three Months Ended March 31
Great Plains Energy Consolidation Earnings and Earnings Per Share – Three Month Ended March 31 (Unaudited) Common stock outstanding for the quarter averaged 154.4 million shares, compared with 154.0 million shares for the same period in 2014 Earnings (millions) Earnings per Share 2015 2014 2015 2014
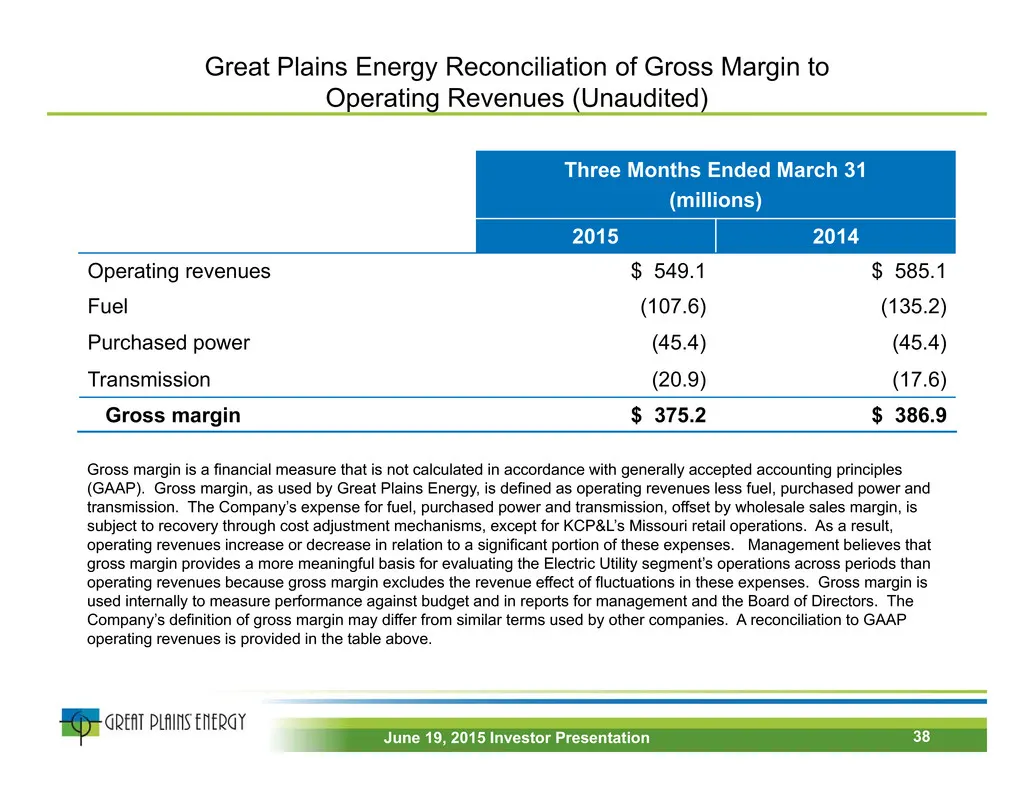
Slide 38: Reconciliation of Gross Margin to Operating Revenues
Great Plains Energy Reconciliation of Gross Margin to Operating Revenues (Unaudited) Gross margin is a financial measure that is not calculated in accordance with generally accepted accounting principles (GAAP). Gross margin, as used by Great Plains Energy, is defined as operating revenues less fuel
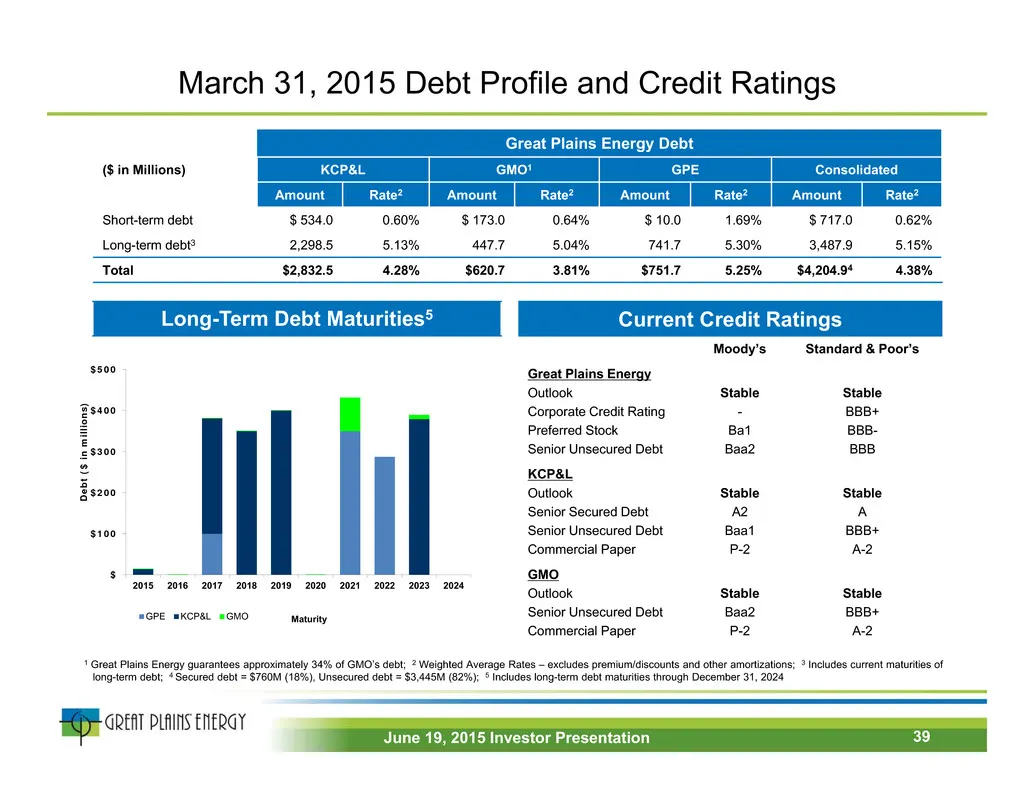
Slide 39: Debt Profile and Credit Ratings
March 31, 2015 Debt Profile and Credit Ratings Great Plains Energy Debt ($ in Millions) KCP&L GMO1 GPE Consolidated Amount Rate2 Amount Rate2 Amount Rate2 Amount Rate2 Short-term debt $ 534.0 0.60% $ 173.0 0.64% $ 10.0 1.69% $ 717.0 0.62% Long-term debt3 2,298.5 5.13% 447.7 5.04% 741.7 5.30% 3,487.9
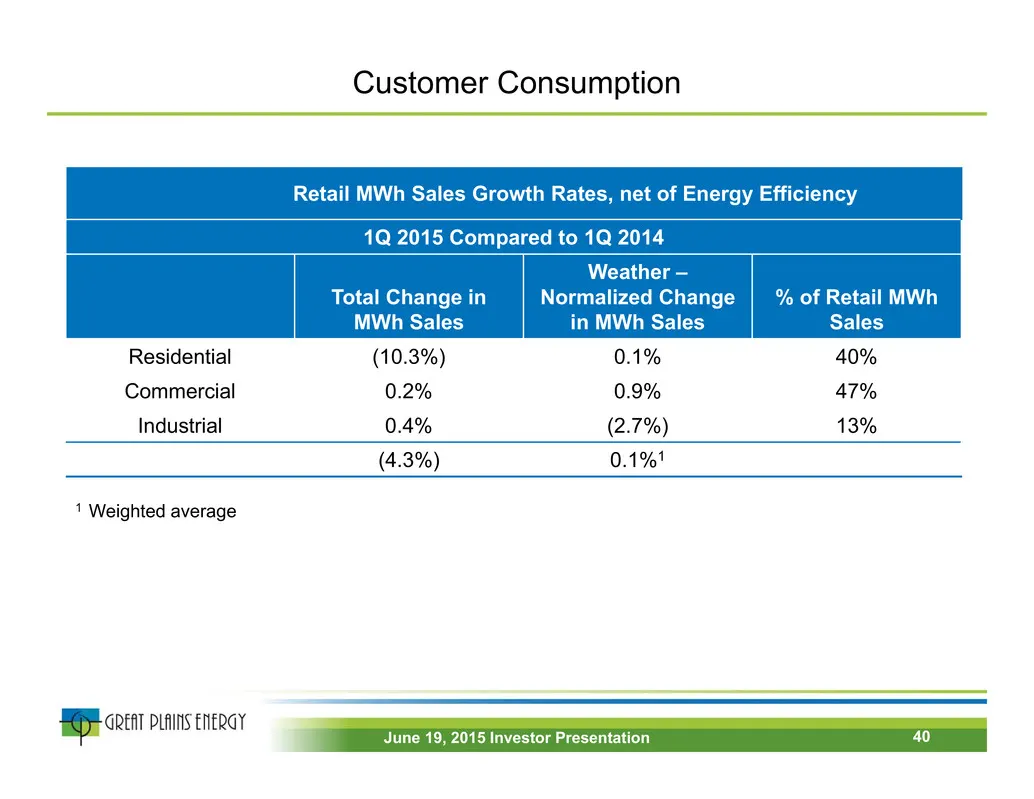
Slide 40: Customer Consumption
Customer Consumption 1 Weighted average Retail MWh Sales Growth Rates, net of Energy Efficiency 1Q 2015 Compared to 1Q 2014 Total Change in MWh Sales Weather – Normalized Change in MWh Sales % of Retail MWh Sales Residential (10.3%) 0.1% 40% Commercial 0.2% 0.9% 47% Industrial 0.4% (2.7%) 13% (4.3%)
Source: SEC EDGAR · 8-K filed Jun 18, 2015
More decks from Great Plains Energy Incorporated
 Merger or Acquisition (January 2018)27 slides · Jan 10, 2018
 2017 Edison Electric Institute Financial Conference25 slides · Nov 3, 2017
 Merger or Acquisition (October 2017)14 slides · Oct 31, 2017
 Merger or Acquisition (October 2017)9 slides · Oct 31, 2017
 Merger or Acquisition (August 2017)18 slides · Aug 8, 2017
 Merger or Acquisition (August 2017)9 slides · Aug 8, 2017