Extended Stay America — Q1 2017 Earnings Presentation
12 slides from Extended Stay America's earnings presentation, Apr 27, 2017
Slide 1: Q1 2017 Earnings Summary
April 27, 2017 Extended Stay America, Inc. ESH Hospitality, Inc. Q1 2017 Earnings Summary
Slide 2: Important Disclosure Information
2 important disclosure information This presentation contains forward-looking statements within the meaning of the federal securities laws. Statements related to, among other things, future financial performance, including our 2017 outlook, the expected timing, completion and effects of any proposed
Slide 3: Q1 2017 Operating Results & Financial Highlights
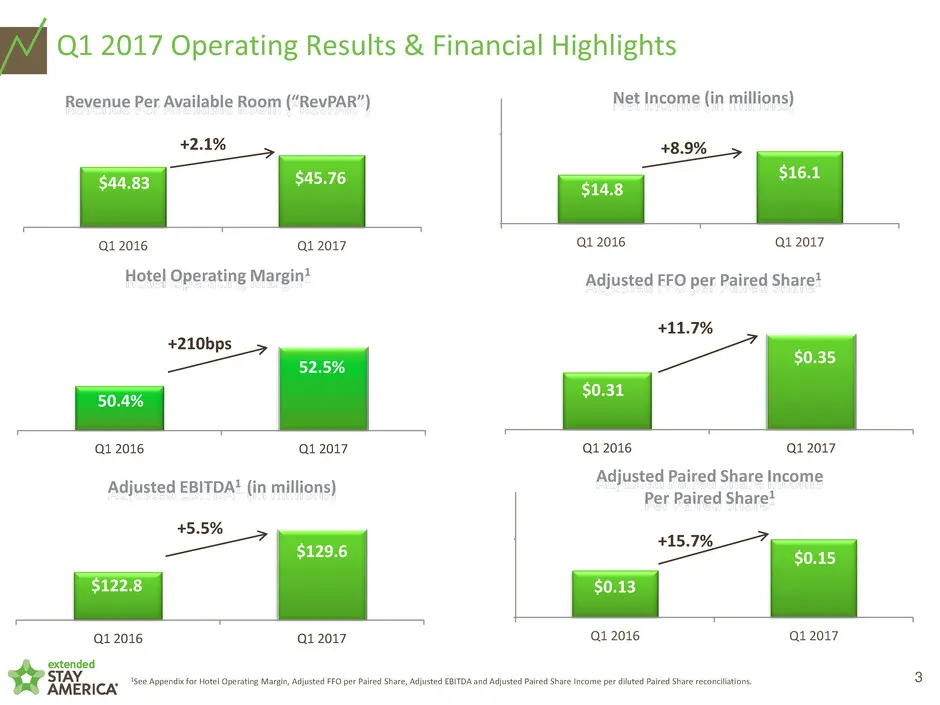
3 1See Appendix for Hotel Operating Margin, Adjusted FFO per Paired Share, Adjusted EBITDA and Adjusted Paired Share Income per diluted Paired Share reconciliations. Q1 2017 Operating Results & Financial Highlights $44.83 $45.76 Q1 2016 Q1 2017 Revenue Per Available Room (“RevPAR”) $0.31 $0.35 Q1 20
Slide 4: Other Q1 Highlights
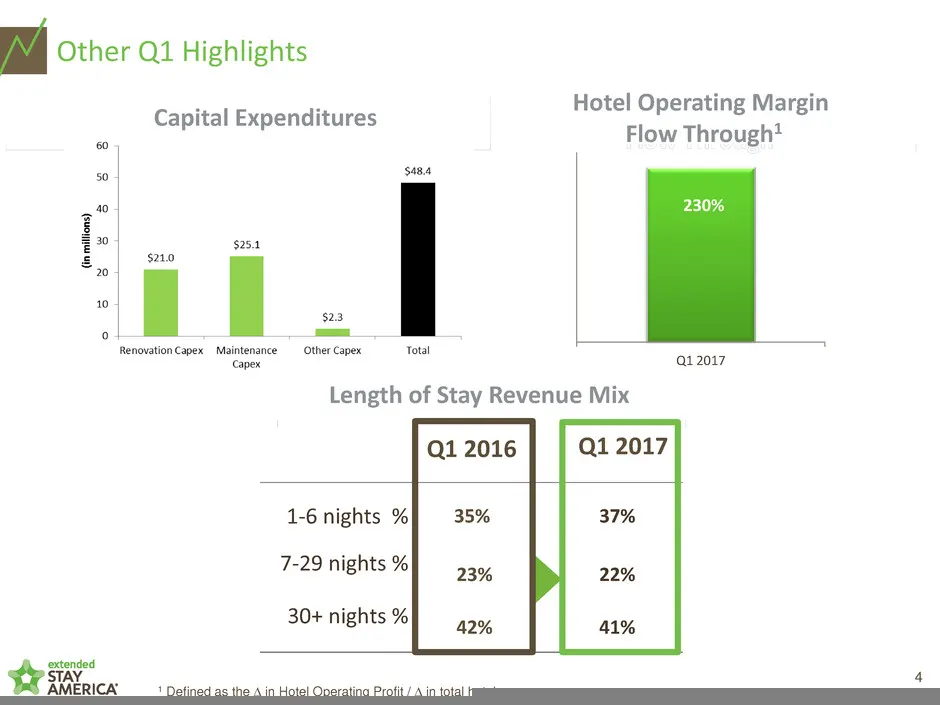
4 Other Q1 Highlights Length of Stay Revenue Mix 1-6 nights % 35% 37% 7-29 nights % 23% 22% 30+ nights % 42% 41% Q1 2017 Q1 2016 Capital Expenditures Hotel Operating Margin Flow Through1 230% Q1 2017 1 Defined as the D in Hotel Operating Profit / D in total hotel revenues.
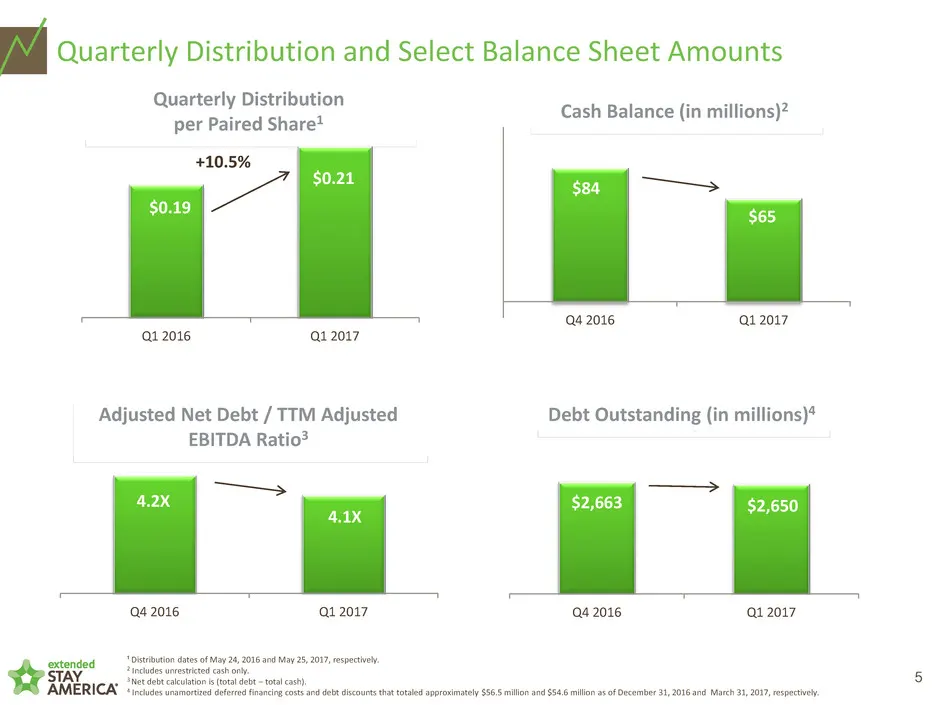
Slide 5: Quarterly Distribution and Select Balance Sheet Amounts
5 Quarterly Distribution and Select Balance Sheet Amounts Quarterly Distribution per Paired Share1 $0.19 $0.21 Q1 2016 Q1 2017 +10.5% Adjusted Net Debt / TTM Adjusted EBITDA Ratio3 4.2X 4.1X Q4 2016 Q1 2017 ¹ Distribution dates of May 24, 2016 and May 25, 2017, respectively. 2 Includes unrestricted
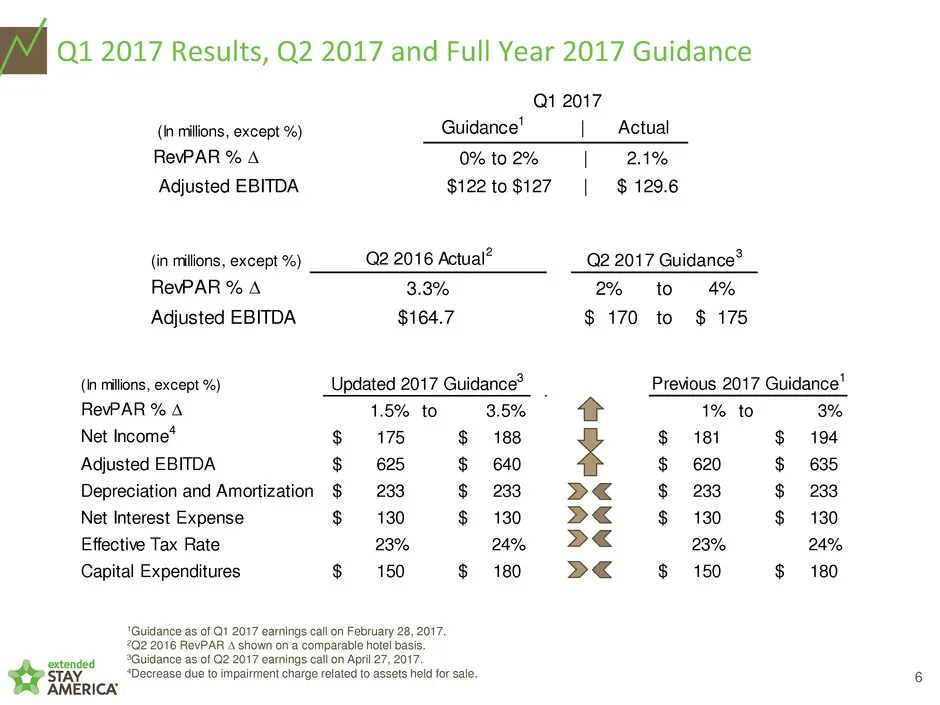
Slide 6: Q1 2017 Results, Q2 2017 and Full Year 2017 Guidance
6 Q1 2017 Results, Q2 2017 and Full Year 2017 Guidance 1% to 3% 181$ 194$ 620$ 635$ 233$ 233$ 130$ 130$ 23% 24% 150$ 180$ Previous 2017 Guidance1 1Guidance as of Q1 2017 earnings call on February 28, 2017. 2Q2 2016 RevPAR D shown on a comparable hotel basis. 3Guidance as of Q2 2017 earnings call on

Slide 7: Appendix
appendix
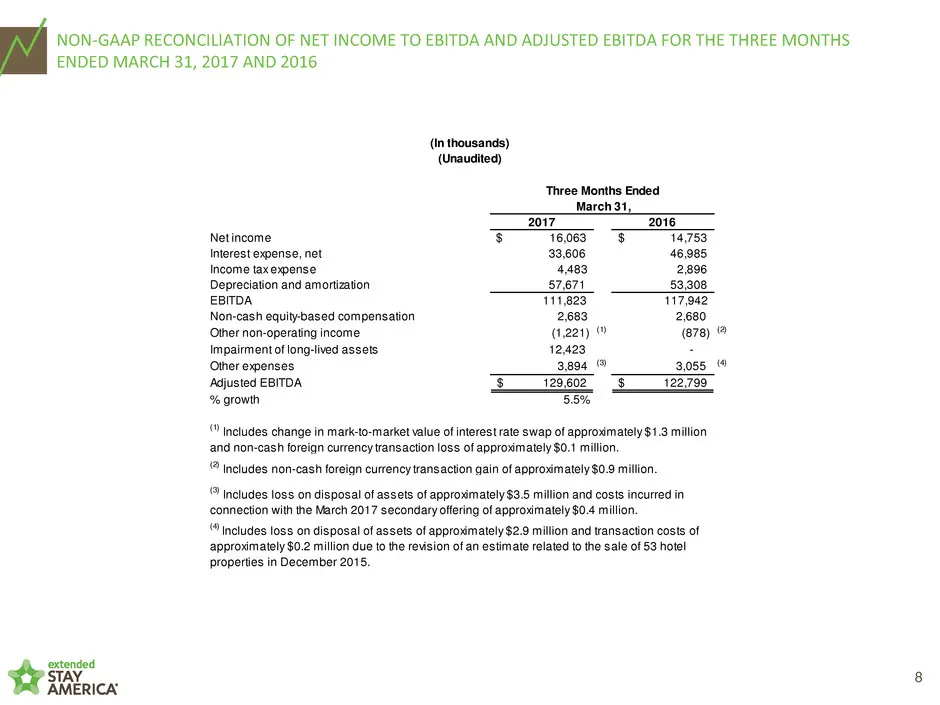
Slide 8: Net Income to EBITDA and Adjusted EBITDA, Three Months Ended March 31, 2017 and 2016
8 NON-GAAP RECONCILIATION OF NET INCOME TO EBITDA AND ADJUSTED EBITDA FOR THE THREE MONTHS ENDED MARCH 31, 2017 AND 2016 2017 2016 Net income $ 16,063 14,753$ Interest expense, net 33,606 46,985 Income tax expense 4,483 2,896 Depreciation and amortization 57,671 53,308 EBITDA 111,823 117,942 Non-cas
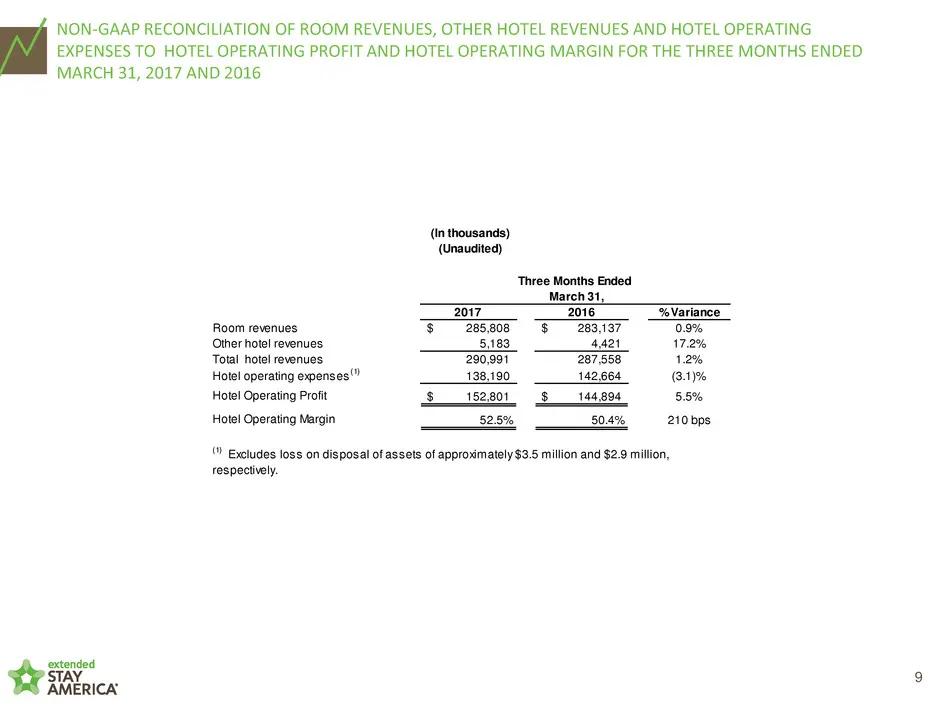
Slide 9: Room Revenues to Hotel Operating Profit and Hotel Operating Margin
9 NON-GAAP RECONCILIATION OF ROOM REVENUES, OTHER HOTEL REVENUES AND HOTEL OPERATING EXPENSES TO HOTEL OPERATING PROFIT AND HOTEL OPERATING MARGIN FOR THE THREE MONTHS ENDED MARCH 31, 2017 AND 2016 2017 2016 % Variance Room revenues 285,808$ 283,137$ 0.9% Other hotel revenues 5,183 4,421 17.2% Total
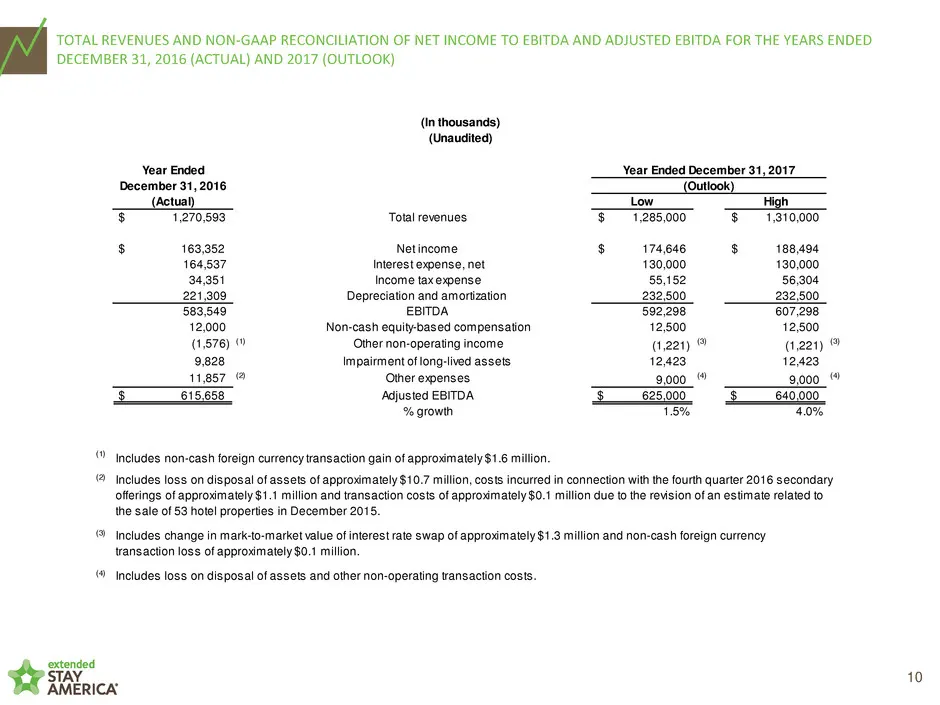
Slide 10: Total Revenues and Net Income to EBITDA and Adjusted EBITDA, 2016 Actual and 2017 Outlook
10 TOTAL REVENUES AND NON-GAAP RECONCILIATION OF NET INCOME TO EBITDA AND ADJUSTED EBITDA FOR THE YEARS ENDED DECEMBER 31, 2016 (ACTUAL) AND 2017 (OUTLOOK) Year Ended December 31, 2016 (Actual) Low High $ 1,270,593 Total revenues 1,285,000$ 1,310,000$ $ 163,352 Net income 174,646$ 188,494$ 164,537 I
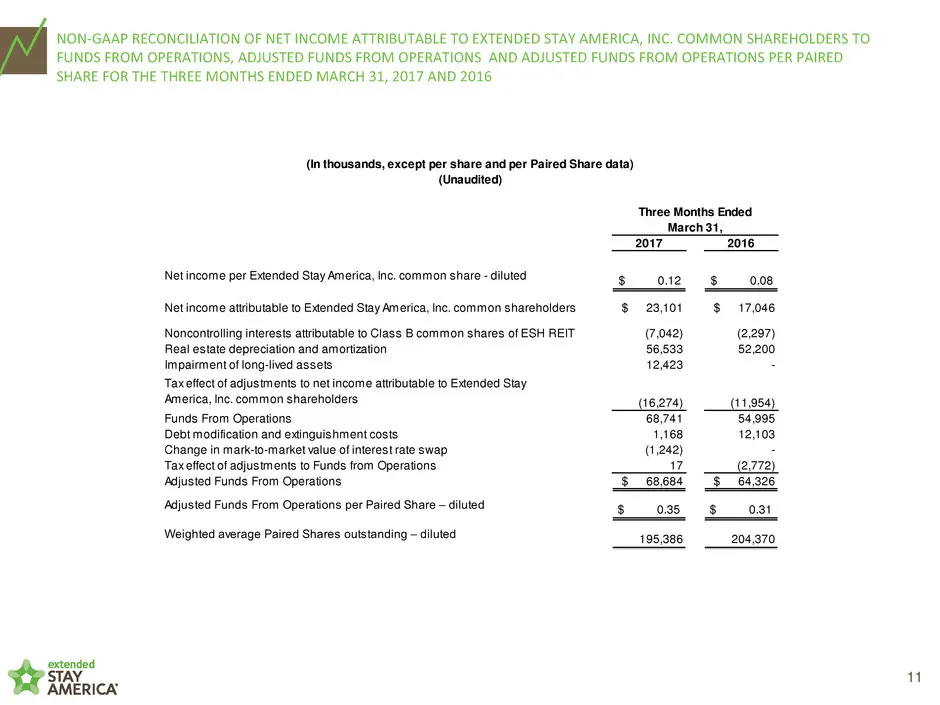
Slide 11: Net Income to Funds From Operations and Adjusted FFO per Paired Share
11 NON-GAAP RECONCILIATION OF NET INCOME ATTRIBUTABLE TO EXTENDED STAY AMERICA, INC. COMMON SHAREHOLDERS TO FUNDS FROM OPERATIONS, ADJUSTED FUNDS FROM OPERATIONS AND ADJUSTED FUNDS FROM OPERATIONS PER PAIRED SHARE FOR THE THREE MONTHS ENDED MARCH 31, 2017 AND 2016 2017 2016 Net income per Extended S
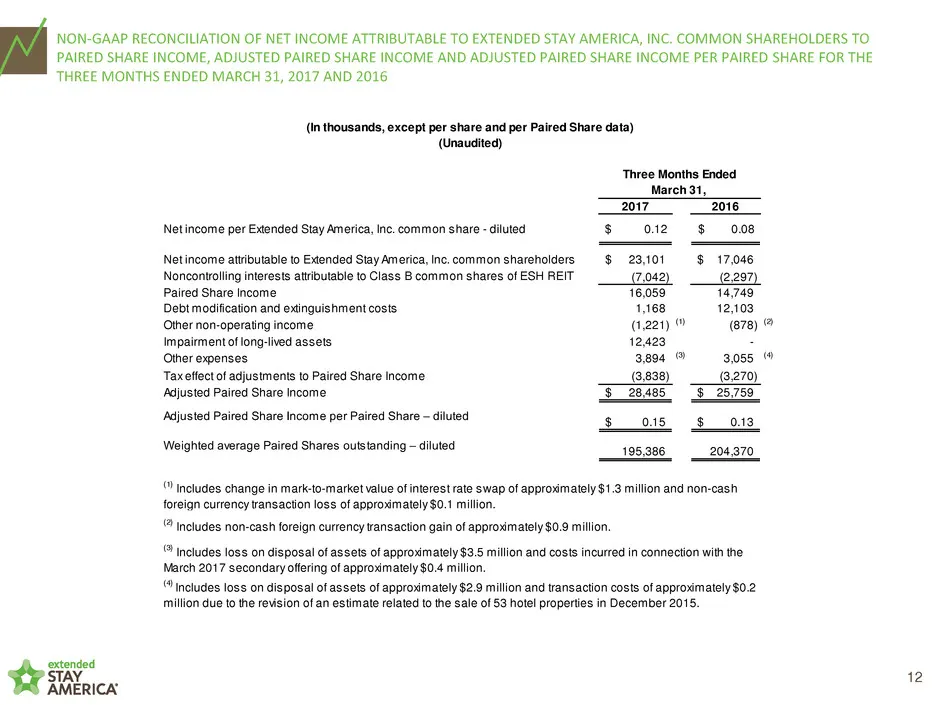
Slide 12: Net Income to Paired Share Income and Adjusted Paired Share Income
12 NON-GAAP RECONCILIATION OF NET INCOME ATTRIBUTABLE TO EXTENDED STAY AMERICA, INC. COMMON SHAREHOLDERS TO PAIRED SHARE INCOME, ADJUSTED PAIRED SHARE INCOME AND ADJUSTED PAIRED SHARE INCOME PER PAIRED SHARE FOR THE THREE MONTHS ENDED MARCH 31, 2017 AND 2016 2017 2016 Net income per Extended Stay Am
Source: SEC EDGAR · 8-K filed Apr 27, 2017
More decks from Extended Stay America Inc
 Proxy Contest (May 2021)40 slides · May 19, 2021
 Proxy Contest (May 2021)97 slides · May 18, 2021
 Q4 2020 Earnings Presentation30 slides · Feb 25, 2021
 Q3 2020 Earnings Presentation15 slides · Nov 9, 2020
 Q2 2020 Earnings Presentation15 slides · Aug 10, 2020
 Q1 2020 Earnings Presentation15 slides · May 6, 2020