National Financial Partners Corp
National Financial Partners — Q2 2010 Earnings Presentation
23 slides from National Financial Partners's earnings presentation, Aug 4, 2010

Slide 1: Second Quarter 2010 Earnings Call Presentation
SECOND QUARTER 2010 EARNINGS CALL PRESENTATION August 4, 2010 Exhibit 99.1

Slide 2: Reconciliation: Net Income to Cash Earnings
Reconciliation: Net Income to Cash Earnings ($ in thousands, except per share data) (1) Cash earnings is a non-GAAP measure, which the Company defines as net income excluding amortization of intangibles, depreciation, the after-tax impact of the impairment of goodwill and intangible assets and the a
Slide 3: Reconciliation: Net Income to Adjusted EBITDA
Corporate Individual Advisor Client Group Client Group Services Group Consolidated Reconciliation: Net Income to Adjusted EBITDA (1) Adjusted EBITDA is a non-GAAP measure, which the Company defines as net income excluding income tax expense, interest income, interest expense, other, net, amortizatio

Slide 4: Jessica Bibliowicz, Chairman, President & CEO
JESSICA BIBLIOWICZ Chairman, President & Chief Executive Officer

Slide 5: Revenue grew 4.8%; Organic revenue grew 7.3%
Revenue grew 4.8%; Organic revenue grew 7.3% 2Q10 Highlights Revenue of $234.9 million, grew 4.8% Organic revenue grew 7.3% • Positive contributions from all three business segments Adjusted EBITDA of $26.3 million • Management fee increase • Associated with sequential positive performance in Indivi
Slide 6: Business Segments
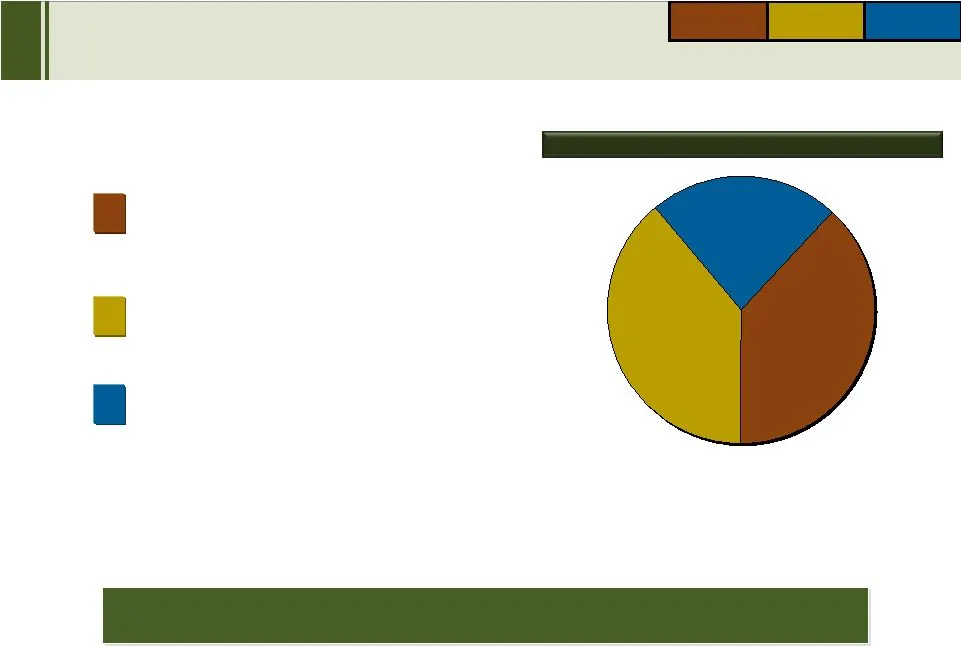
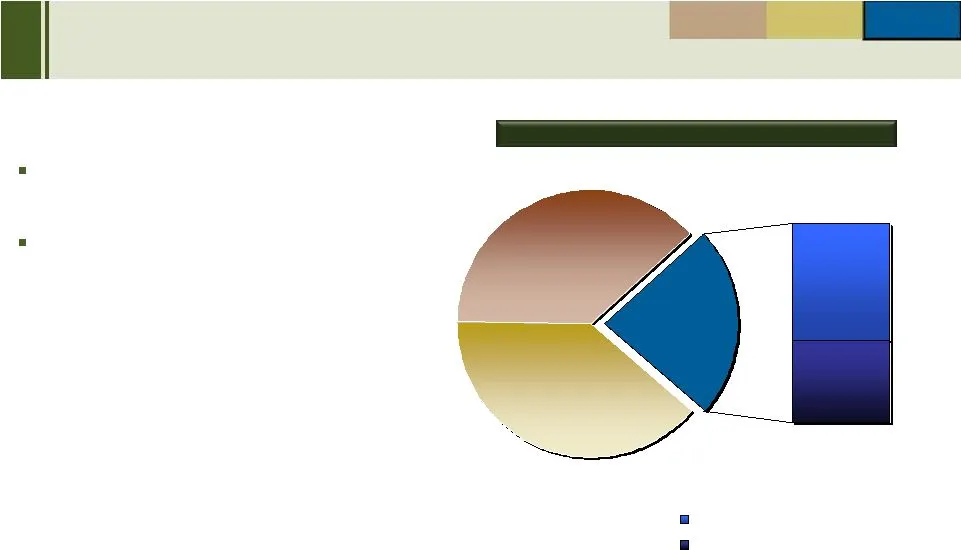
INDIVIDUAL CLIENT GROUP CORPORATE CLIENT GROUP ADVISOR SERVICES GROUP $91.4 39% $54.0 23% $89.5 38% 2Q10 Revenue $234.9 million Provides clients the advantages of coordinated resources Business Segments INDIVIDUAL CLIENT GROUP CORPORATE CLIENT GROUP ADVISOR SERVICES GROUP Advisor Services Group Orga
Slide 7: Corporate Client Group Overview & Components of Revenue
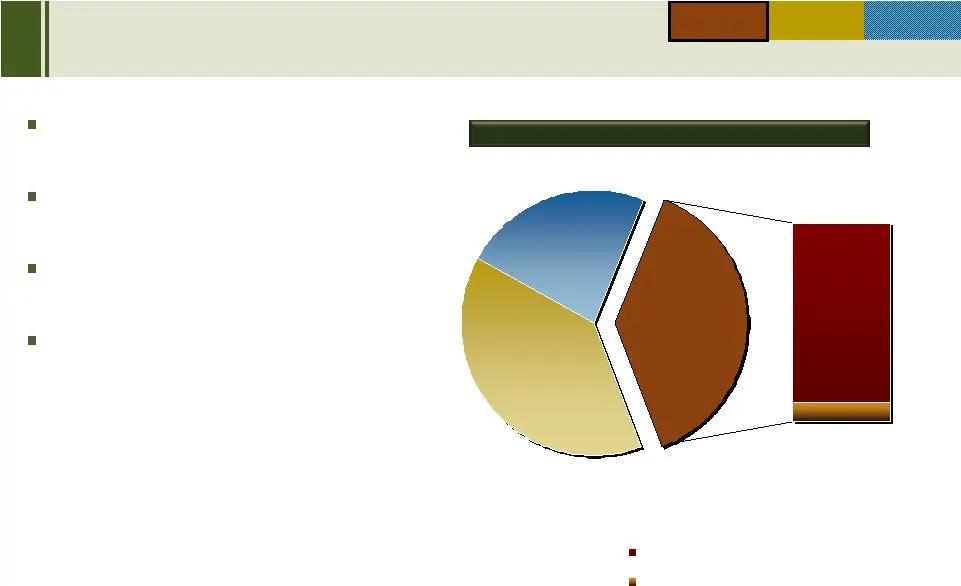
2Q10 Revenue Breakdown INDIVIDUAL CLIENT GROUP CORPORATE CLIENT GROUP ADVISOR SERVICES GROUP 39% 23% 38% 10% 90% A leader in the middle market Solid performance Recurring revenue Focusing on healthcare reform • Short-term opportunities • Long-term implications INDIVIDUAL CLIENT GROUP CORPORATE CLIEN
Slide 8: Individual Client Group Overview & Components of Revenue
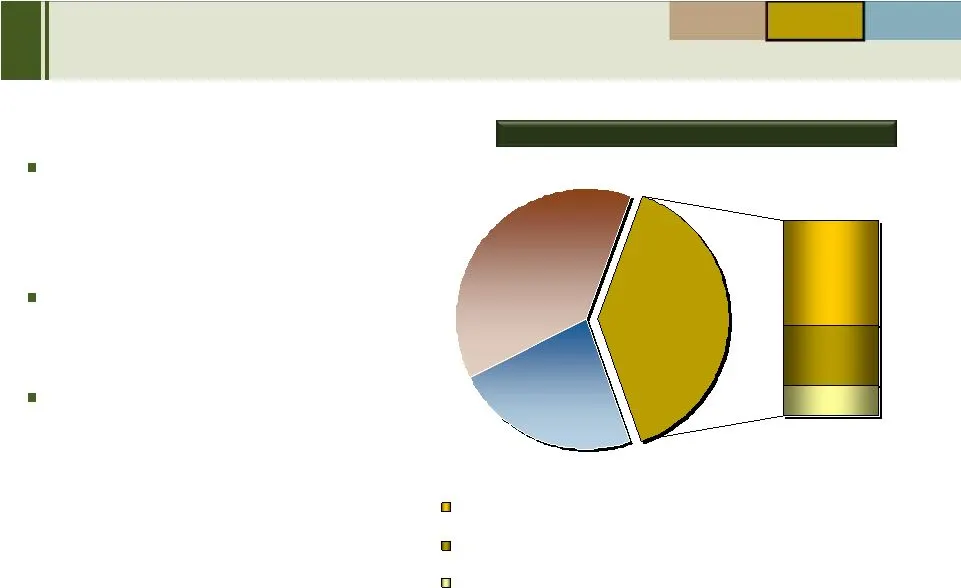
2Q10 Revenue Breakdown 23% 38% 39% CORPORATE CLIENT GROUP INDIVIDUAL CLIENT GROUP ADVISOR SERVICES GROUP #1 independent distributor with many top tier carriers (carrier data) Improving pattern in life insurance sales Continued strong performance by investment advisors 31% 15% 54% NFP Marketing Organ
Slide 9: Advisor Services Group Overview
2Q10 Revenue Breakdown 39% 38% 23% 41% 59% CORPORATE CLIENT GROUP INDIVIDUAL CLIENT GROUP ADVISOR SERVICES GROUP Strong performance of advisors Attractive advisor platform NFP Asset Based Fees NFP Commissions % of ASG Revenue Advisor Services Group Overview INDIVIDUAL CLIENT GROUP ADVISOR SERVICES G
Slide 10: Recurring Revenue by Business Segment
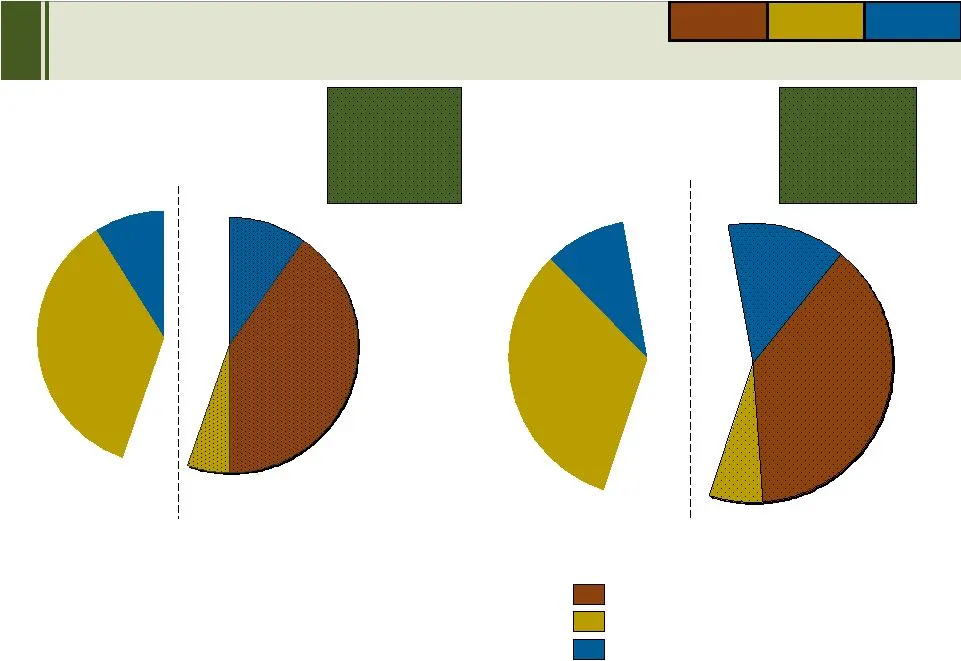
$80.3 36% $19.8 9% $89.8 40% $12.2 5% $22.1 10% INDIVIDUAL CLIENT GROUP CORPORATE CLIENT GROUP ADVISOR SERVICES GROUP 2Q10 Recurring revenue 58% 2Q09 Recurring revenue 55% $14.1 6% $89.5 38% $31.9 14% $77.3 33% $22.1 9% Recurring Revenue by Business Segment 2Q10 Revenue $234.9 million INDIVIDUAL CLI

Slide 11: NFP's leadership recognized across business lines
NFP’s leadership recognized across business lines Recent Industry Recognition #9 Top Insurance Broker Globally ( Best ’ s Review ) #1 Executive Benefits Provider by Non-Qualified Deferred Compensation Plans Administered ( PlanSponsor ) Top 10 Independent Broker Dealer (by both Financial Planning and

Slide 12: Doug Hammond, Chief Operating Officer
DOUG HAMMOND Chief Operating Officer

Slide 13: Corporate Client Group
Corporate Client Group A leader in the corporate middle market Coordinated independent solutions • Health and welfare • Retirement planning • Ancillary services • Executive benefits • P&C insurance Helping clients navigate healthcare environment • Presents opportunities • Expect margin pressure in s

Slide 14: Individual Client Group
Individual Client Group A leader in servicing high net worth individuals • Independent life insurance • Investment advisory Closing larger life insurance cases with greater frequency High tax environment Focus on recruitment Investment advisory positive performance • Client retention • Client additi

Slide 15: Advisor Services Group
Advisor Services Group Serves independent financial advisors • Broker-dealer • Corporate registered investment advisor Assets under management increased over 20% year over year Actively recruiting

Slide 16: Donna Blank, Chief Financial Officer
DONNA BLANK Chief Financial Officer
Slide 17
Slide 18: Management Fees as % of Adjusted Income Before Management Fees
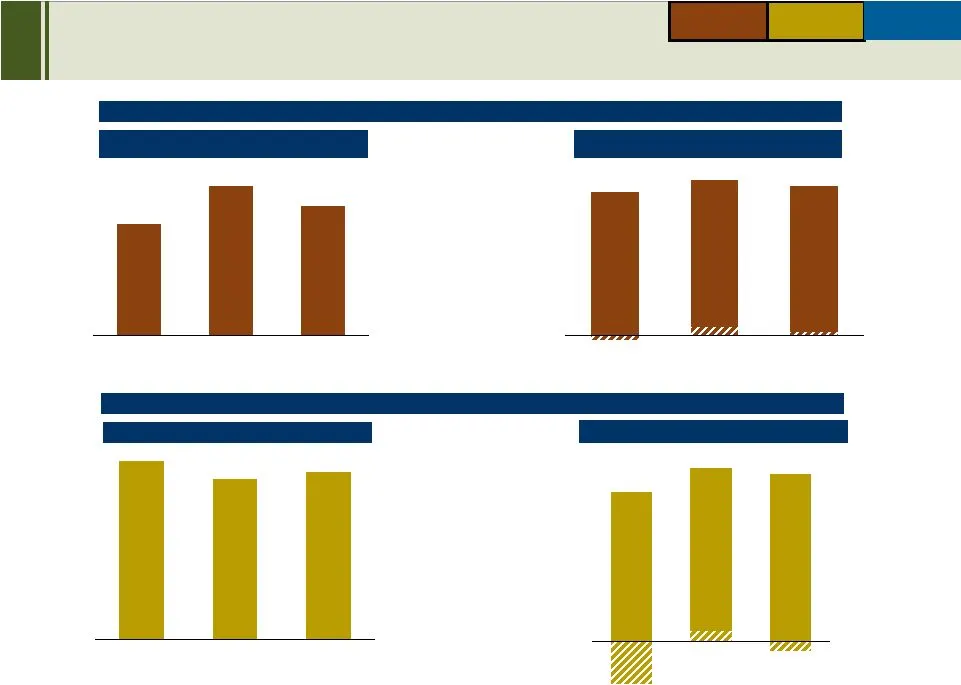
38.5% 39.0% 38.0% INDIVIDUAL CLIENT GROUP CORPORATE CLIENT GROUP ADVISOR SERVICES GROUP 2009 2010 2010 2009 Corporate Client Group Individual Client Group 55.0% 49.5% 51.6% 1Q09 2Q09 YTD09 1Q10 2Q10 YTD10 42.8% 37.3% 32.1% 1Q09 2Q09 YTD09 55.7% 53.8% 58.7% Management Fees as % of Adjusted Income Bef
Slide 19: Business Segments Quarter-over-Quarter Financial Highlights
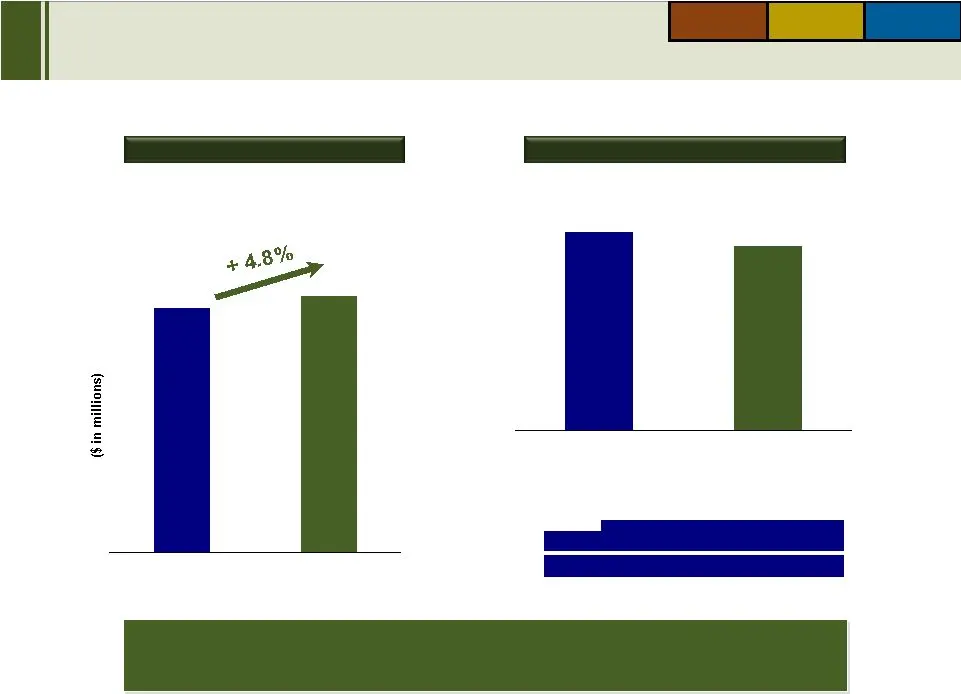
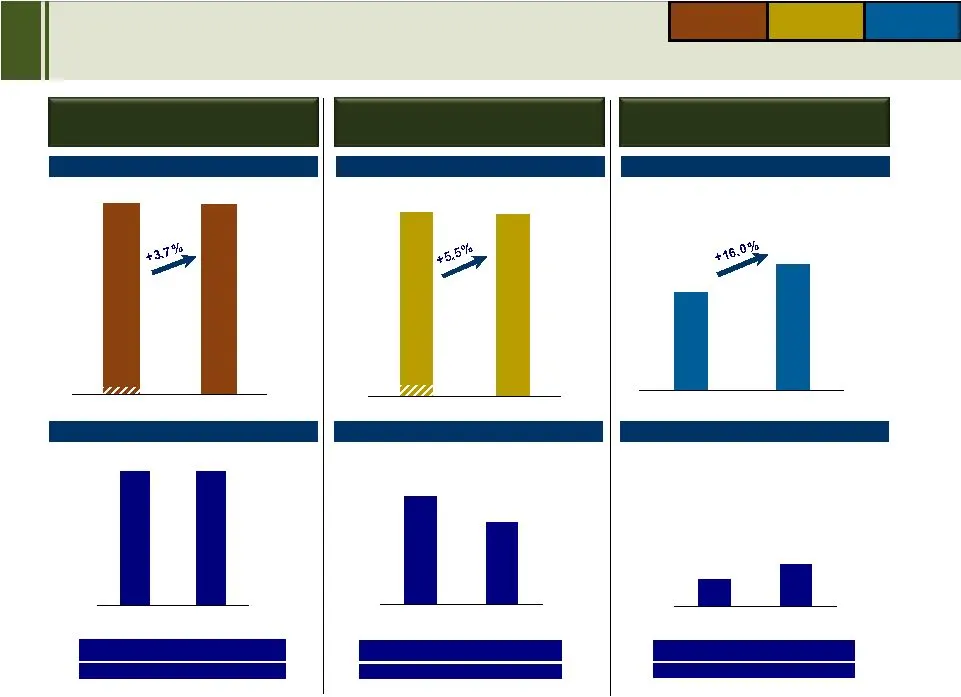
$86.3 $89.5 INDIVIDUAL CLIENT GROUP CORPORATE CLIENT GROUP ADVISOR SERVICES GROUP Corporate Client Group (CCG) Individual Client Group (ICG) Advisor Services Group (ASG) Revenue Revenue Revenue Adjusted EBITDA & Margin Adjusted EBITDA & Margin Adjusted EBITDA & Margin 2Q09 2Q10 Adjusted EBITDA Margi
Slide 20: Continue to Generate Operating Cash Flow
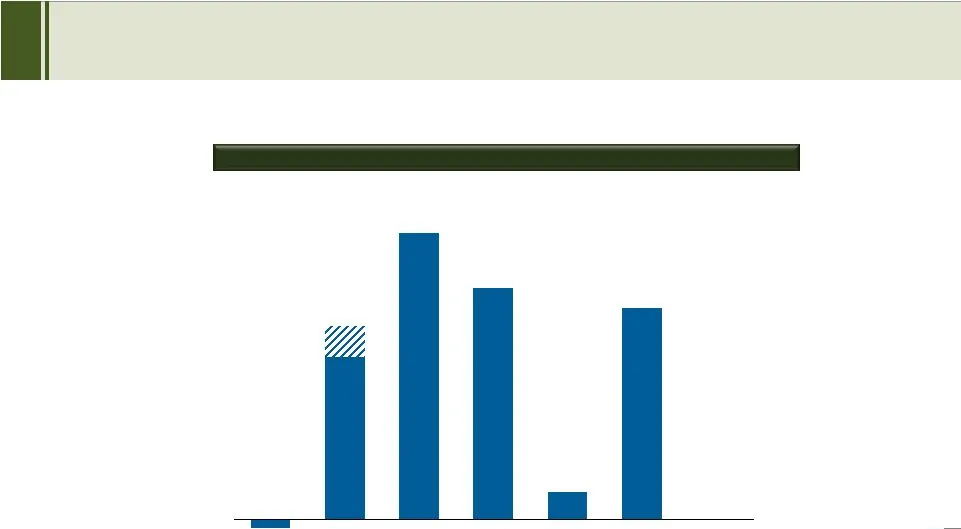
Operating Cash Flow (consolidated) $28.6 Continue to Generate Operating Cash Flow ($ in millions) 2Q09 operating cash flow included $5.5 million of key-person life insurance proceeds -$1.6 $50.4 $40.8 $37.3 $4.9 $34.1 1Q'09 2Q'09 3Q'09 4Q'09 1Q'10 2Q'10
Slide 21: Overview of Recapitalization
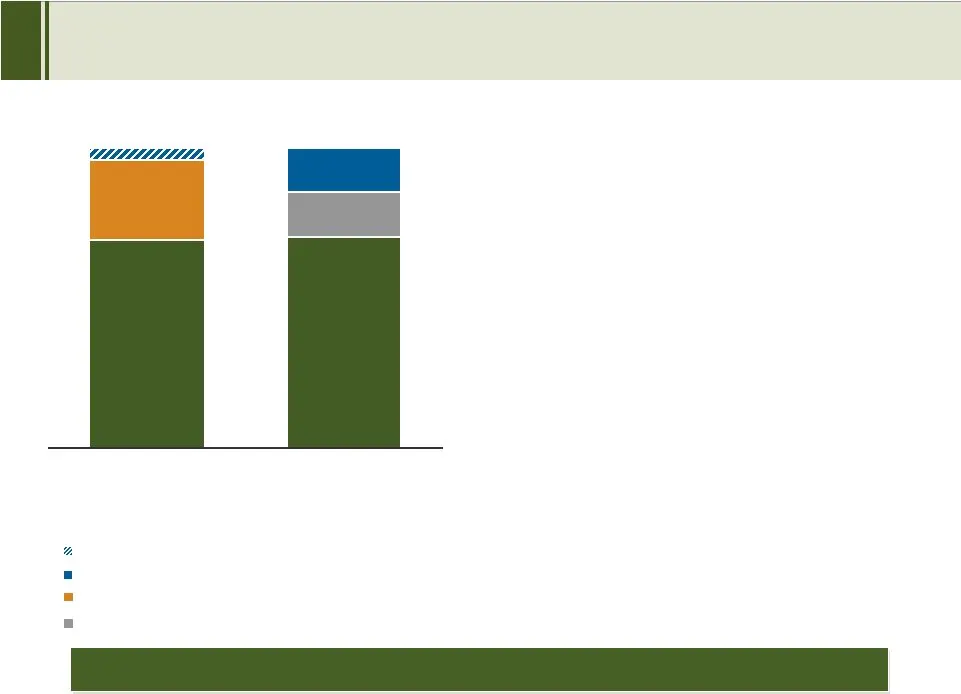
$125 $230 $125 Equity Equity Achieved improved maturity profile; reduced refinancing risk Status Quo March 31 Pro Forma Re-Cap as of July 8 Overview of Recapitalization 1. Issued $125.0 million of new 7-year Convertible Senior Notes, due 2017 2. Tendered for $229.9 million of the $230.0 million exis
Slide 22: Debt Maturity Profile
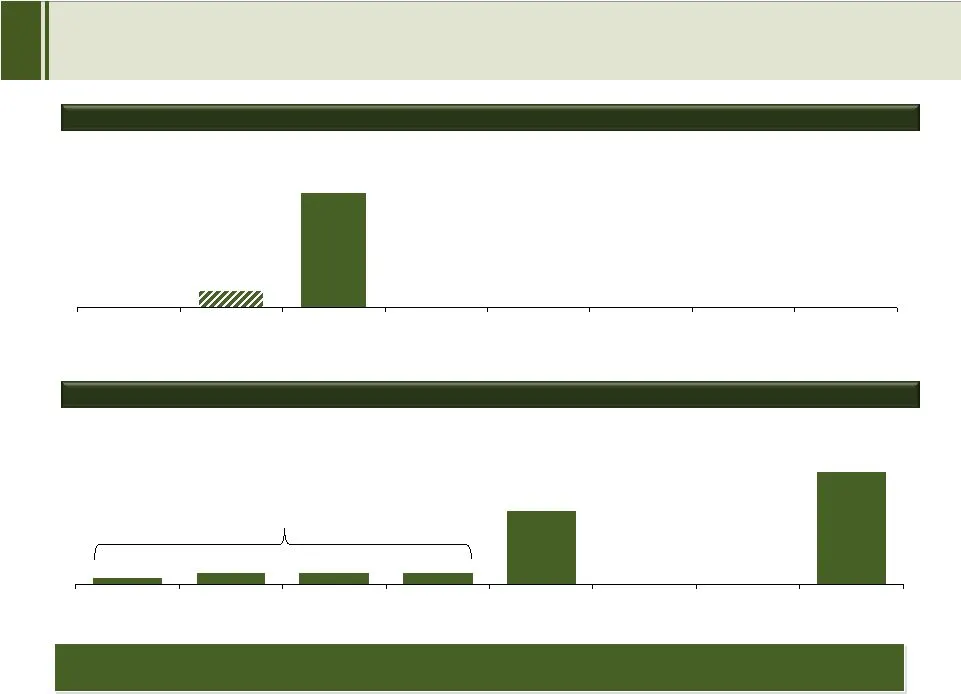
Maturity Profile as of 3/31/10 New Maturity Profile as of 7/8/10 Lengthen debt maturities; spread future principal payments Debt Maturity Profile $35.0 $230.0 $81.3 $12.5 $12.5 $12.5 $6.3 $125.0 Senior Secured Credit Facility Convertible Senior Notes Senior Secured Credit Facility Term Loan (Prepaya

Slide 23: Second Quarter 2010 Earnings Call Presentation
SECOND QUARTER 2010 EARNINGS CALL PRESENTATION
Source: SEC EDGAR · 8-K filed Aug 4, 2010
More decks from National Financial Partners Corp
 Q4 2012 Earnings Presentation19 slides · Feb 15, 2013
 Q3 2012 Earnings Presentation18 slides · Oct 31, 2012
 Q2 2012 Earnings Presentation19 slides · Jul 31, 2012
 Q1 2012 Earnings Presentation19 slides · Apr 27, 2012
 Q4 2011 Earnings Presentation18 slides · Feb 8, 2012
 Q3 2011 Earnings Presentation19 slides · Oct 28, 2011