BMC Stock — Investor Presentation (May 2016)
36 slides from BMC Stock's investor presentation, May 16, 2016
Slide 1: BMC Stock Holdings, Inc. Investor Presentation May 2016
Exhibit 99.1 BMC Stock Holdings, Inc. Investor Presentation May 2016
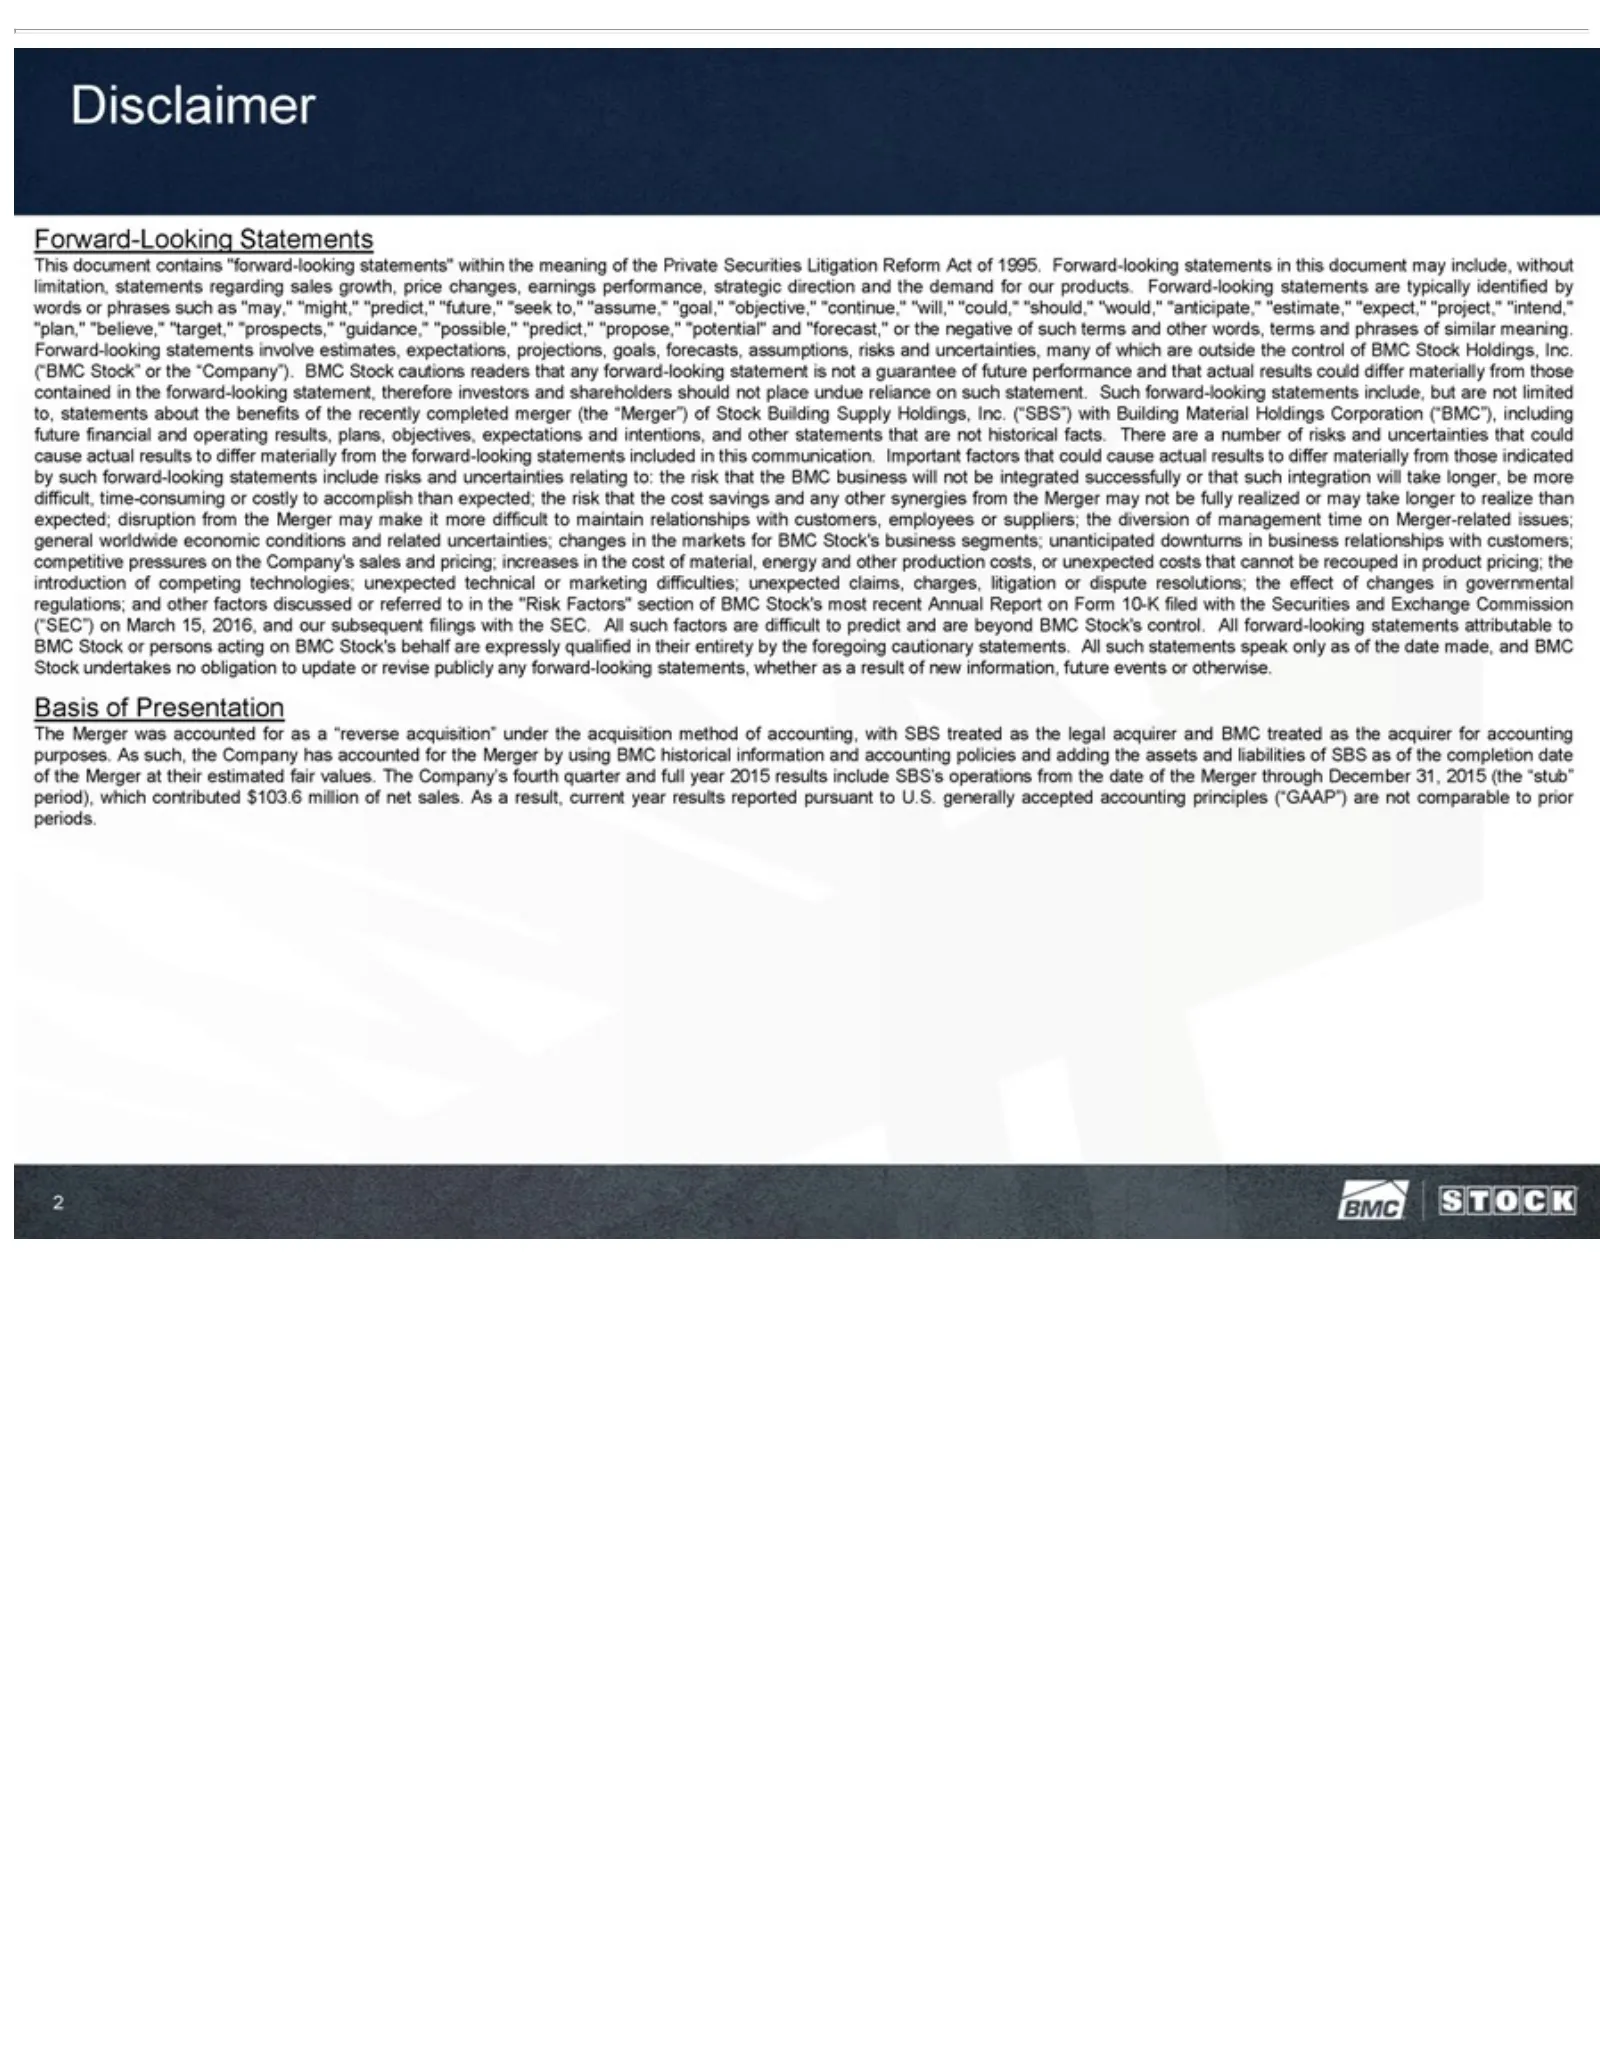
Slide 2: Disclaimer
Disclaimer may or “target,” estimates, readers shareholders Building are cause integration realize worldwide Company’s technical BMC and All otherwise. purposes. estimated netphrases not sales. such are include, actual Stock’s than historical that beyond statements “prospects,” Supply or As As fair
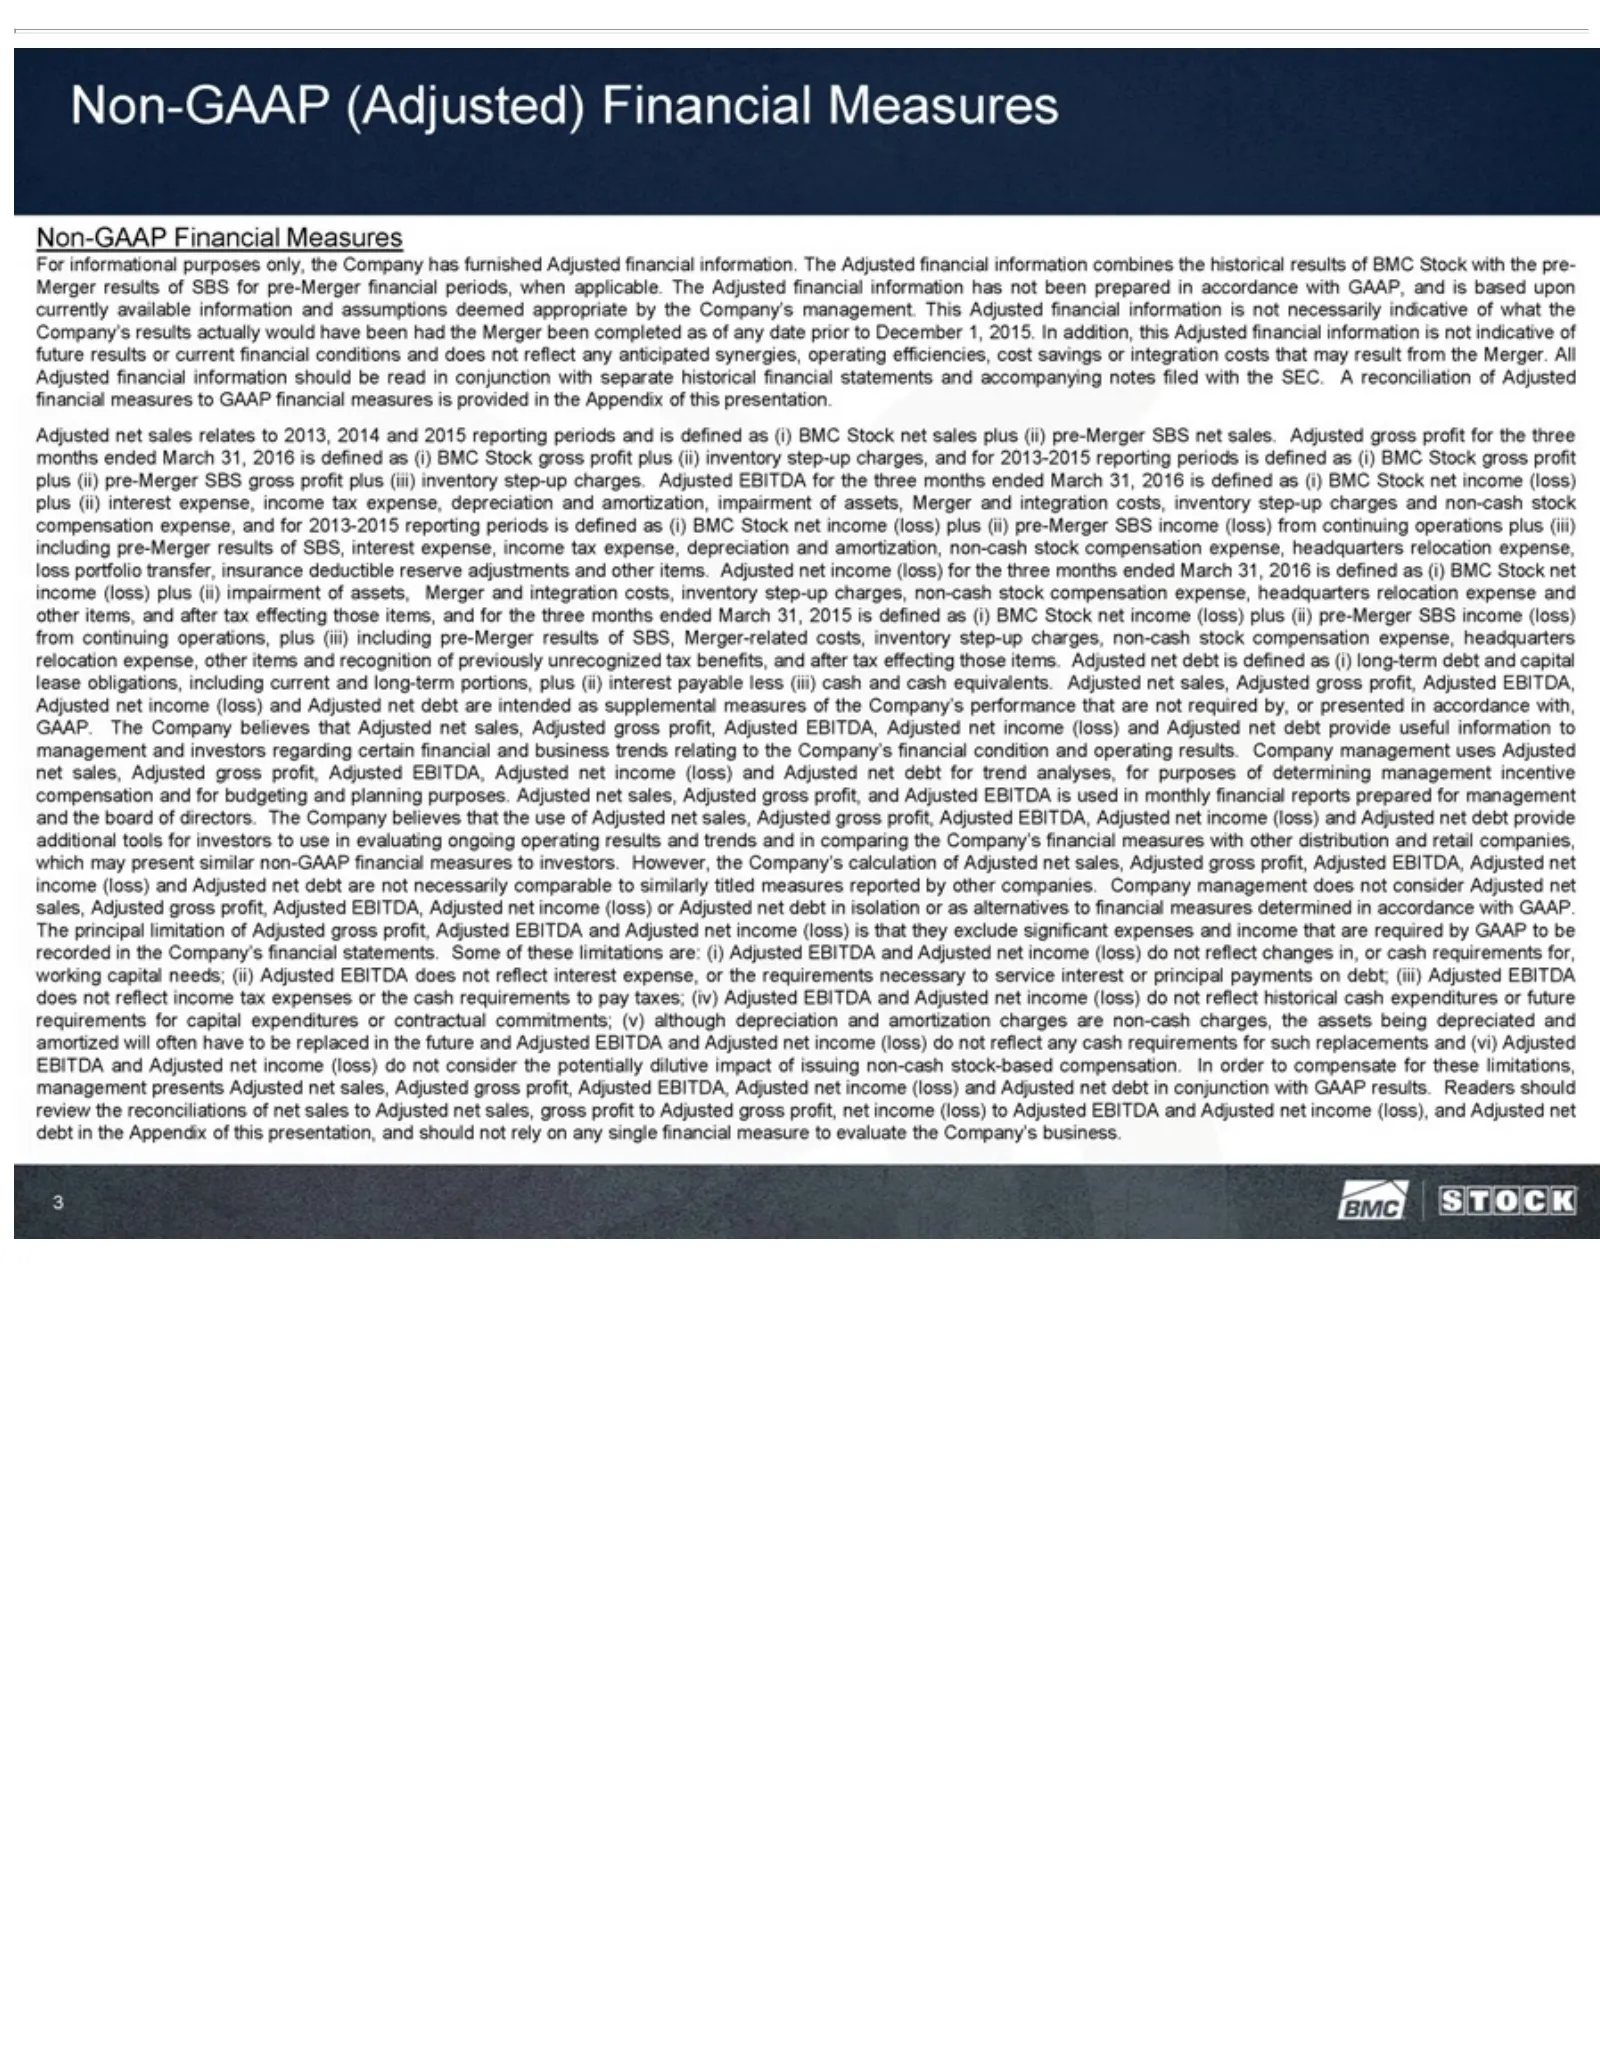
Slide 3: Non-GAAP Financial Measures
Non-GAAP historical upon have any statements 2014 plus months step-up (iii) deductible costs, (i) compensation capital Adjusted profit, condition management board evaluating However, measures by needs; requirements depreciation cash for reconciliations and BMC other GAAP these anticipated should inc
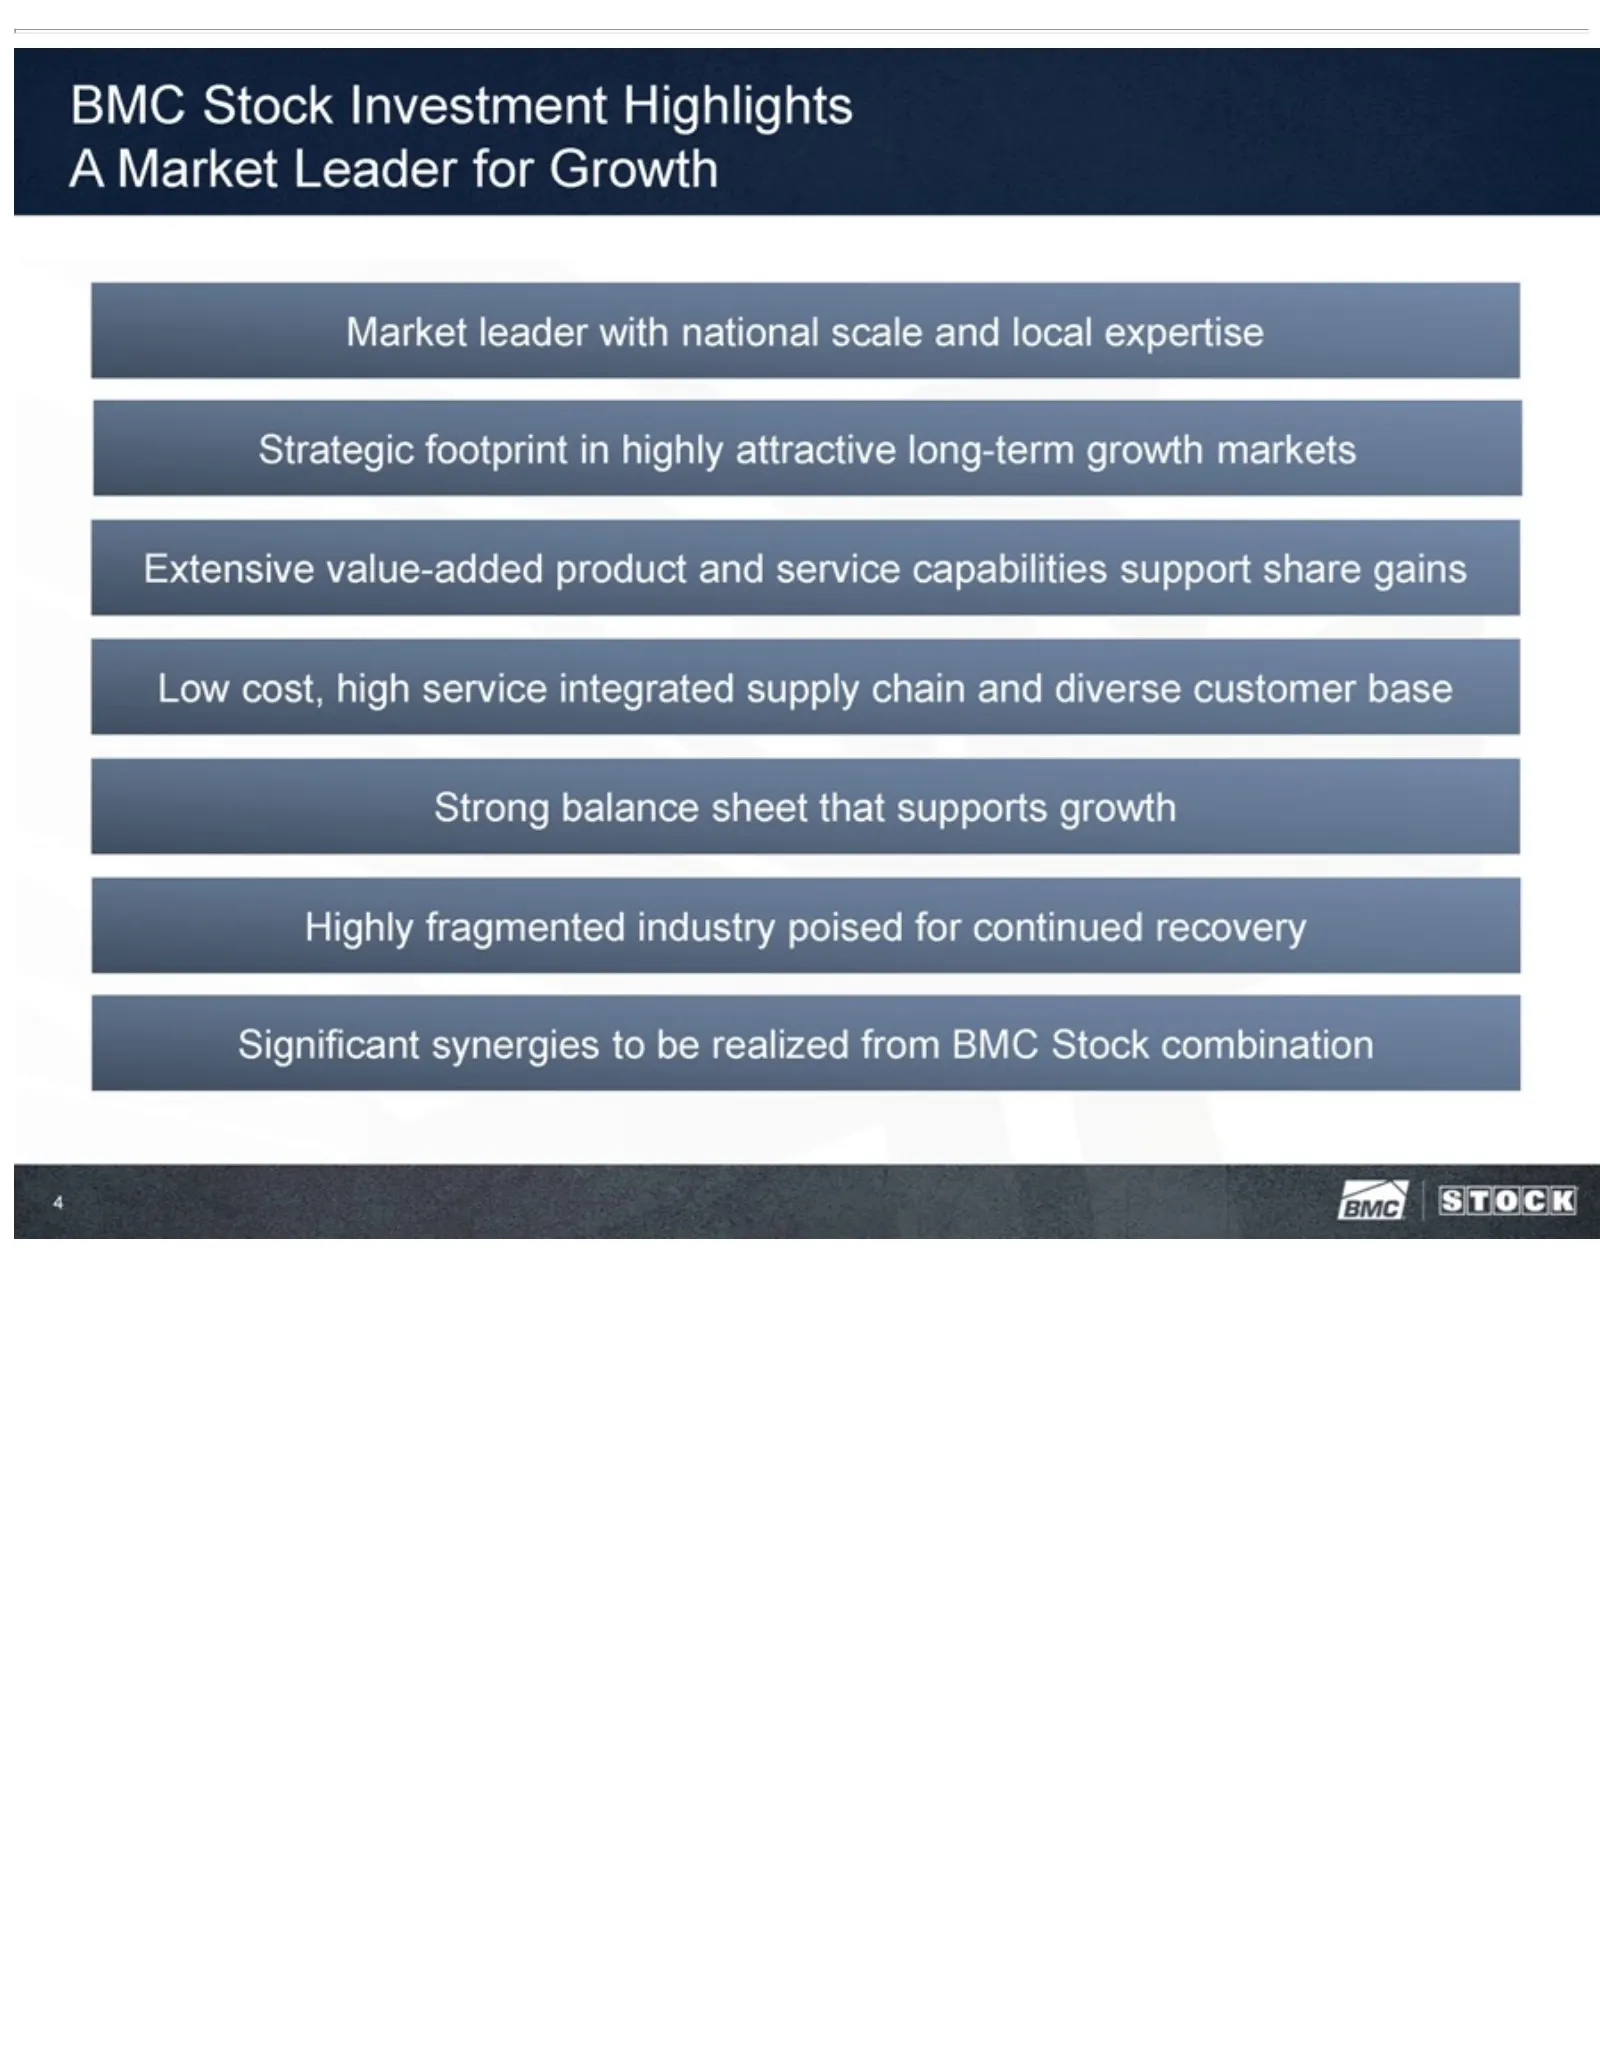
Slide 4: BMC Stock Investment Highlights
BMC Stock service Significant capabilities synergies Investment support to be Highlights realized share gains A from Market Low BMC cost, Leader Stock high for combination service Growthintegrated Market 4 leader supplywith chain national and diverse scale and customer local expertise base Strong St
Slide 5: Company Overview
= & red 0) > e) > = © ror = fe) O
Slide 6: Company Snapshot
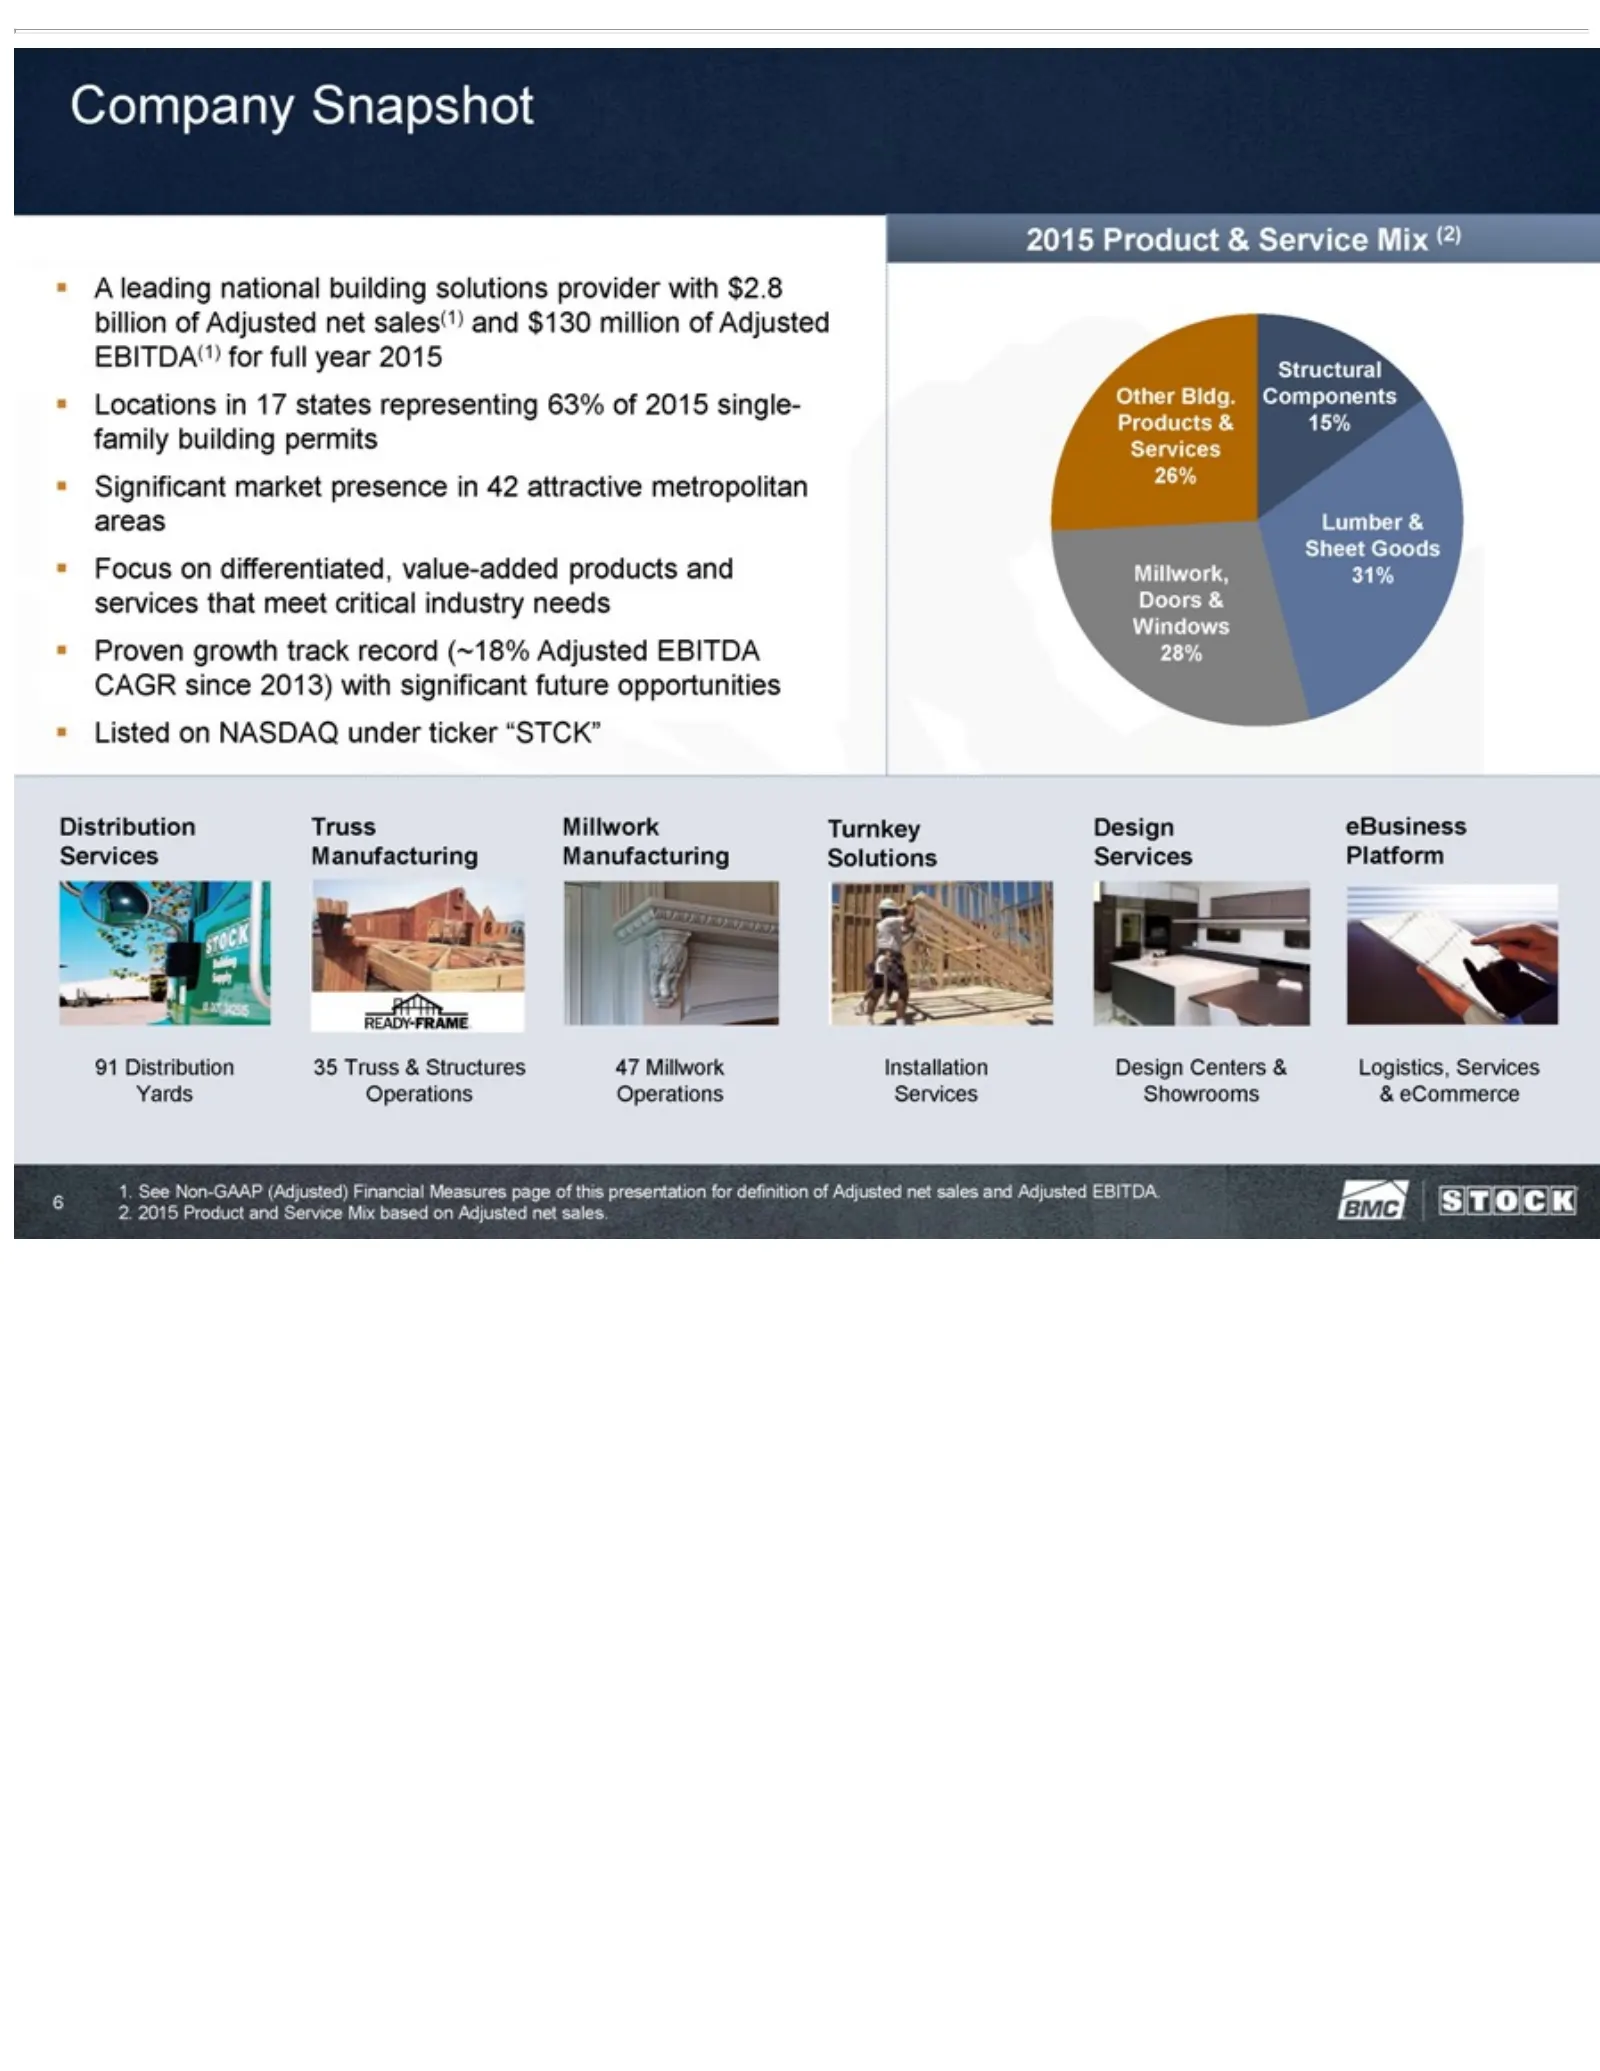
Company single- (~18% Components Millwork of this presentation Adjusted family Operations Snapshot 15% building EBITDA Millwork, for •ATurnkey definition permits leading CAGR Doors Solutions •national Significant of since & Adjusted Windows 2013) building Installation market net with 28% solutions s
Slide 7: BMC Company History Timeline
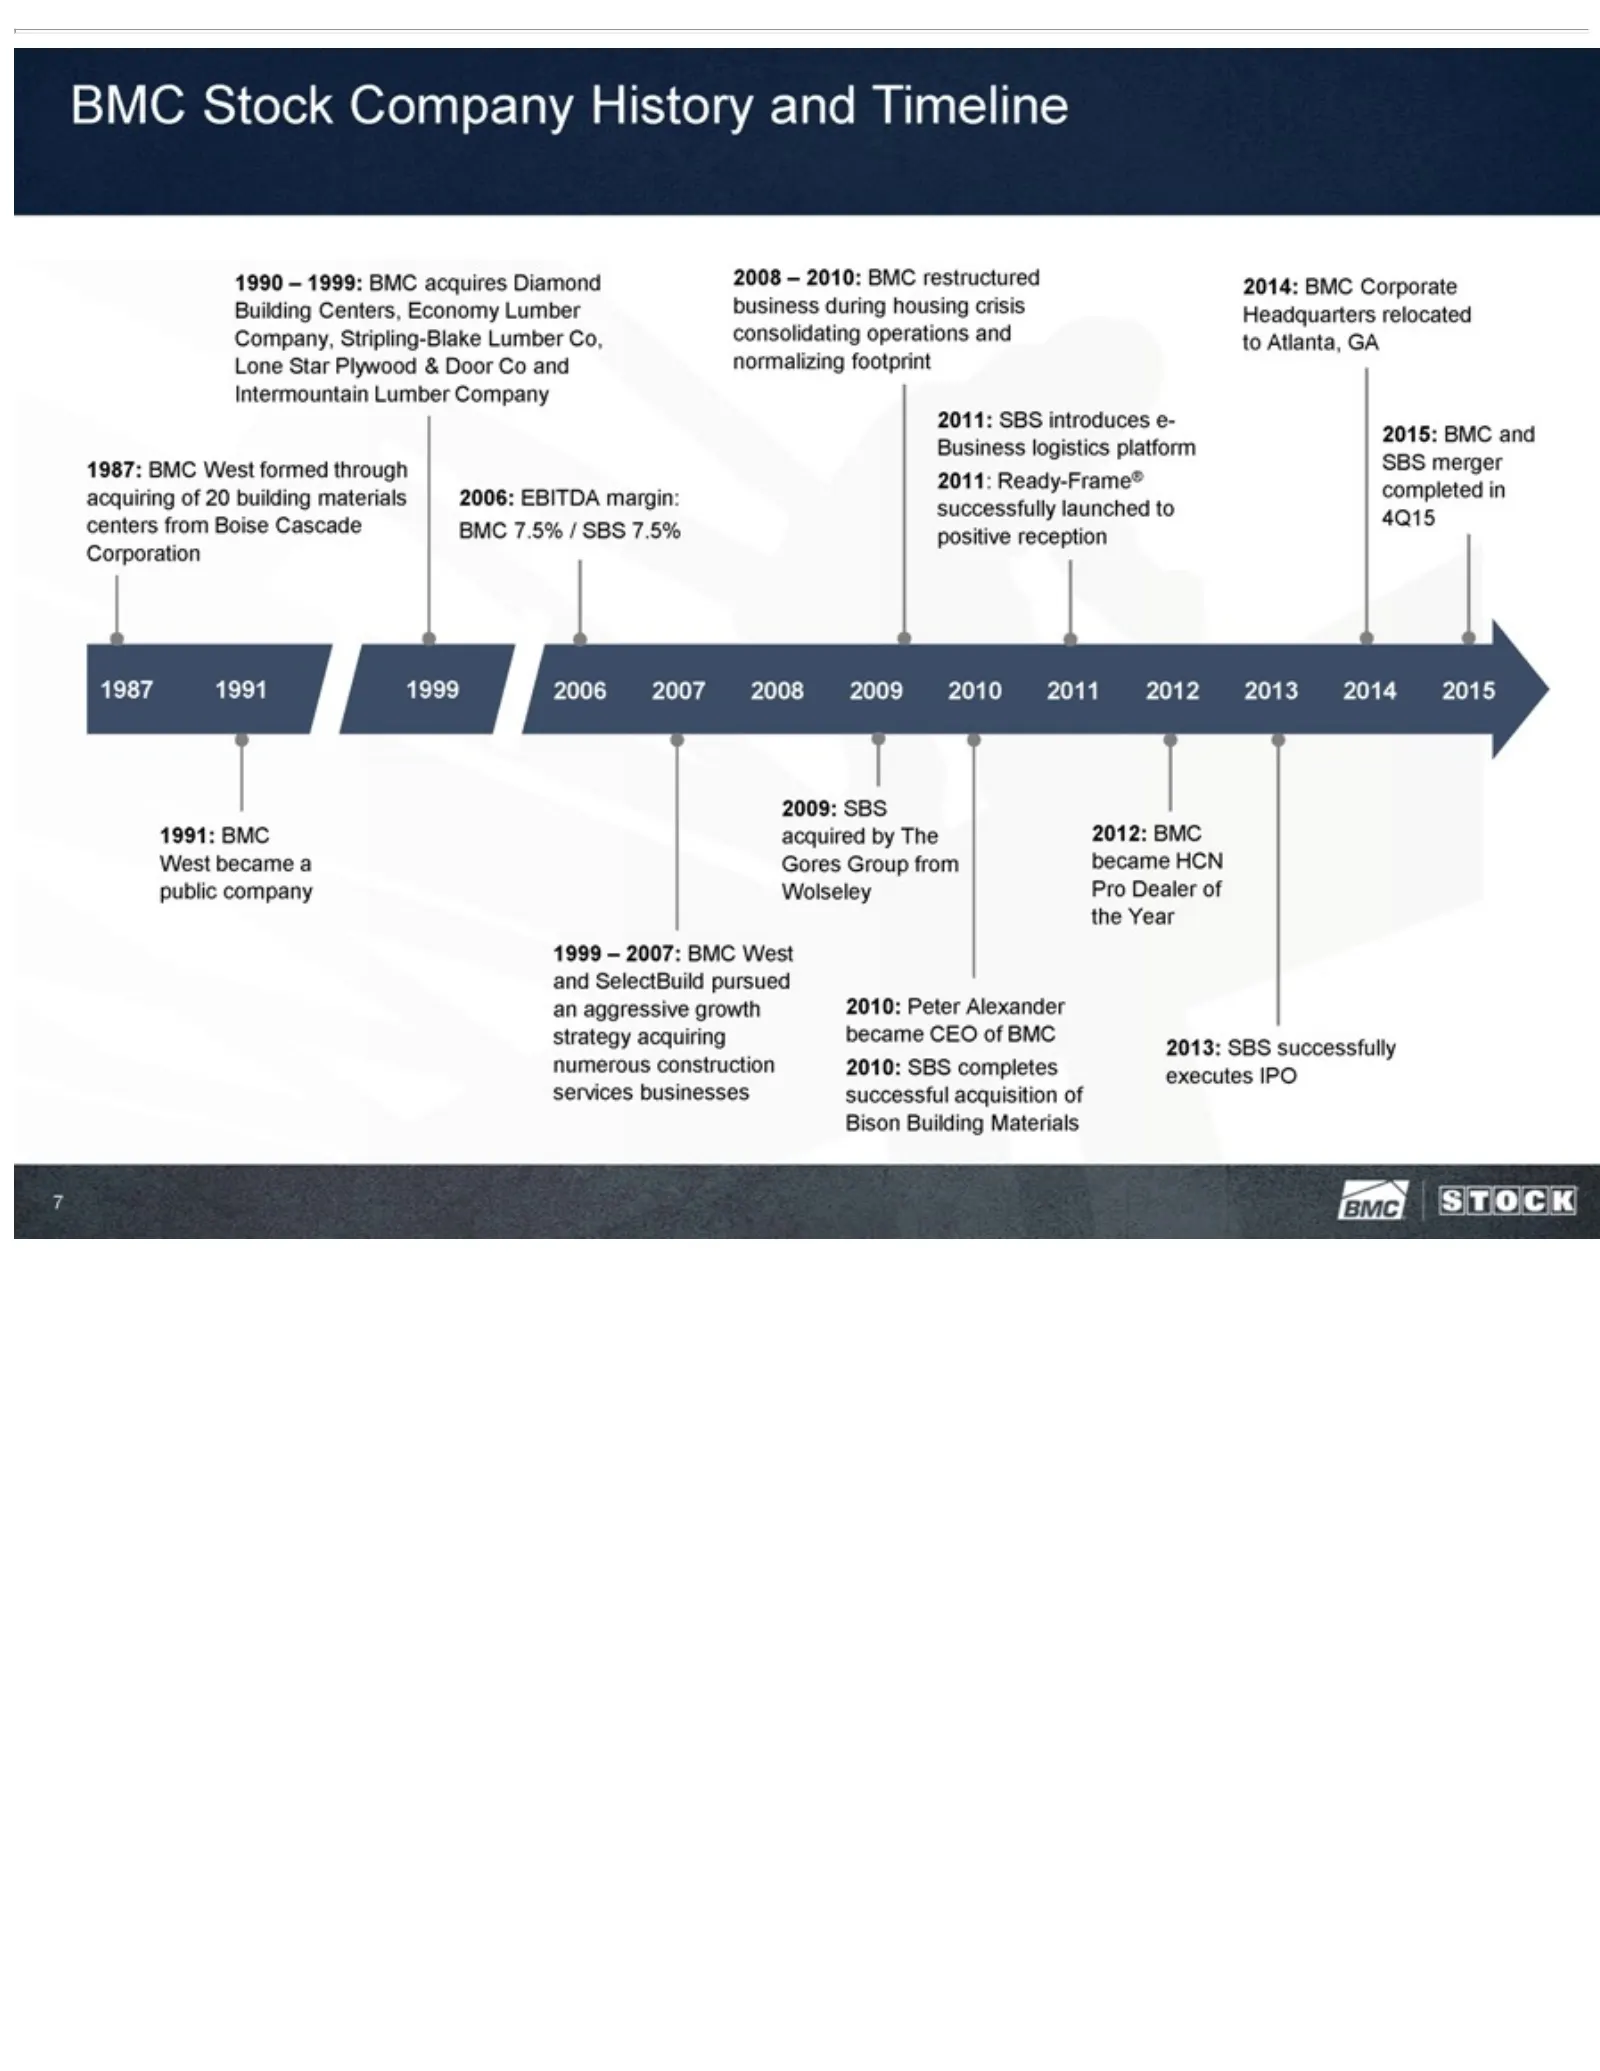
BMC Company through launched by 2010: TheStock Peter Gores acquiring to2008 Alexander positive Company Group – 2010: of reception 20 from History became BMC building Wolseley restructured 2015: and CEO materials Timeline 2012: of BMCBMCBMC business centers and 1990 2010: SBS became –from during SBS
Slide 8: Market Leader in Highly Fragmented Industry
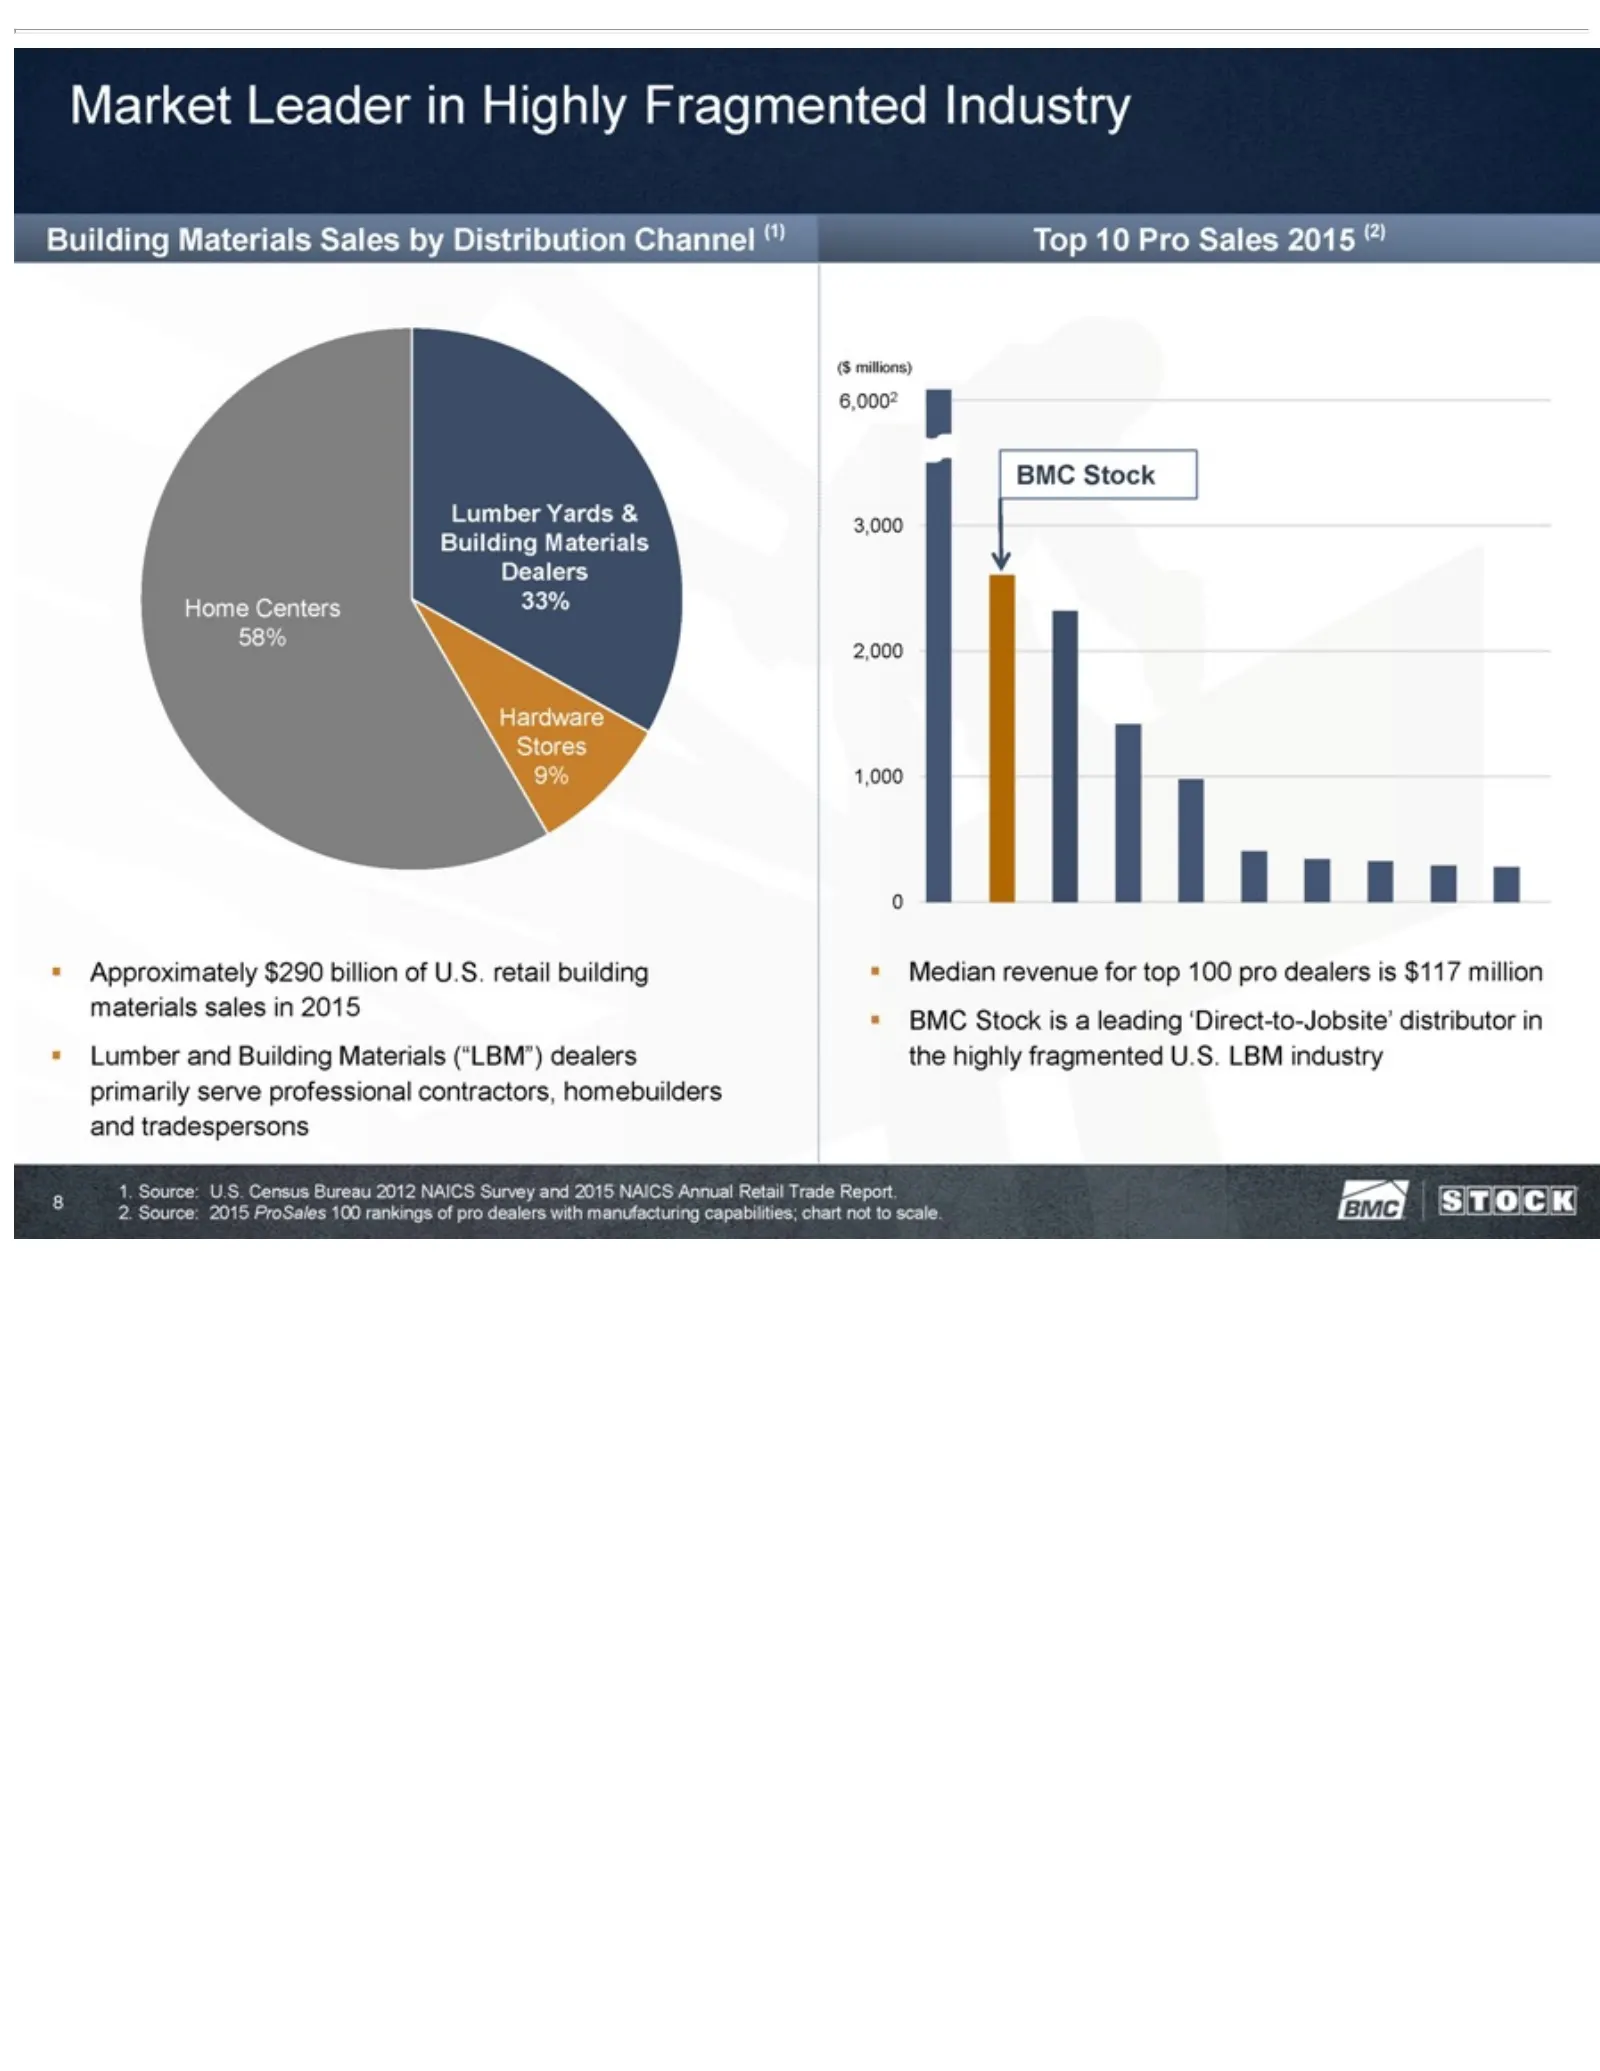
Marketof billion 6,0002 Census 3,000 Leader Bureau U.S.2,000 retail in 2012 Highly 1,000 building NAICS Fragmented 0 BMC Survey materials Stock and Industry sales •2015 Median in NAICS Building 2015 revenue • Lumber Annual Materials for top Retail and100 Sales Building Trade pro bydealers Distributi
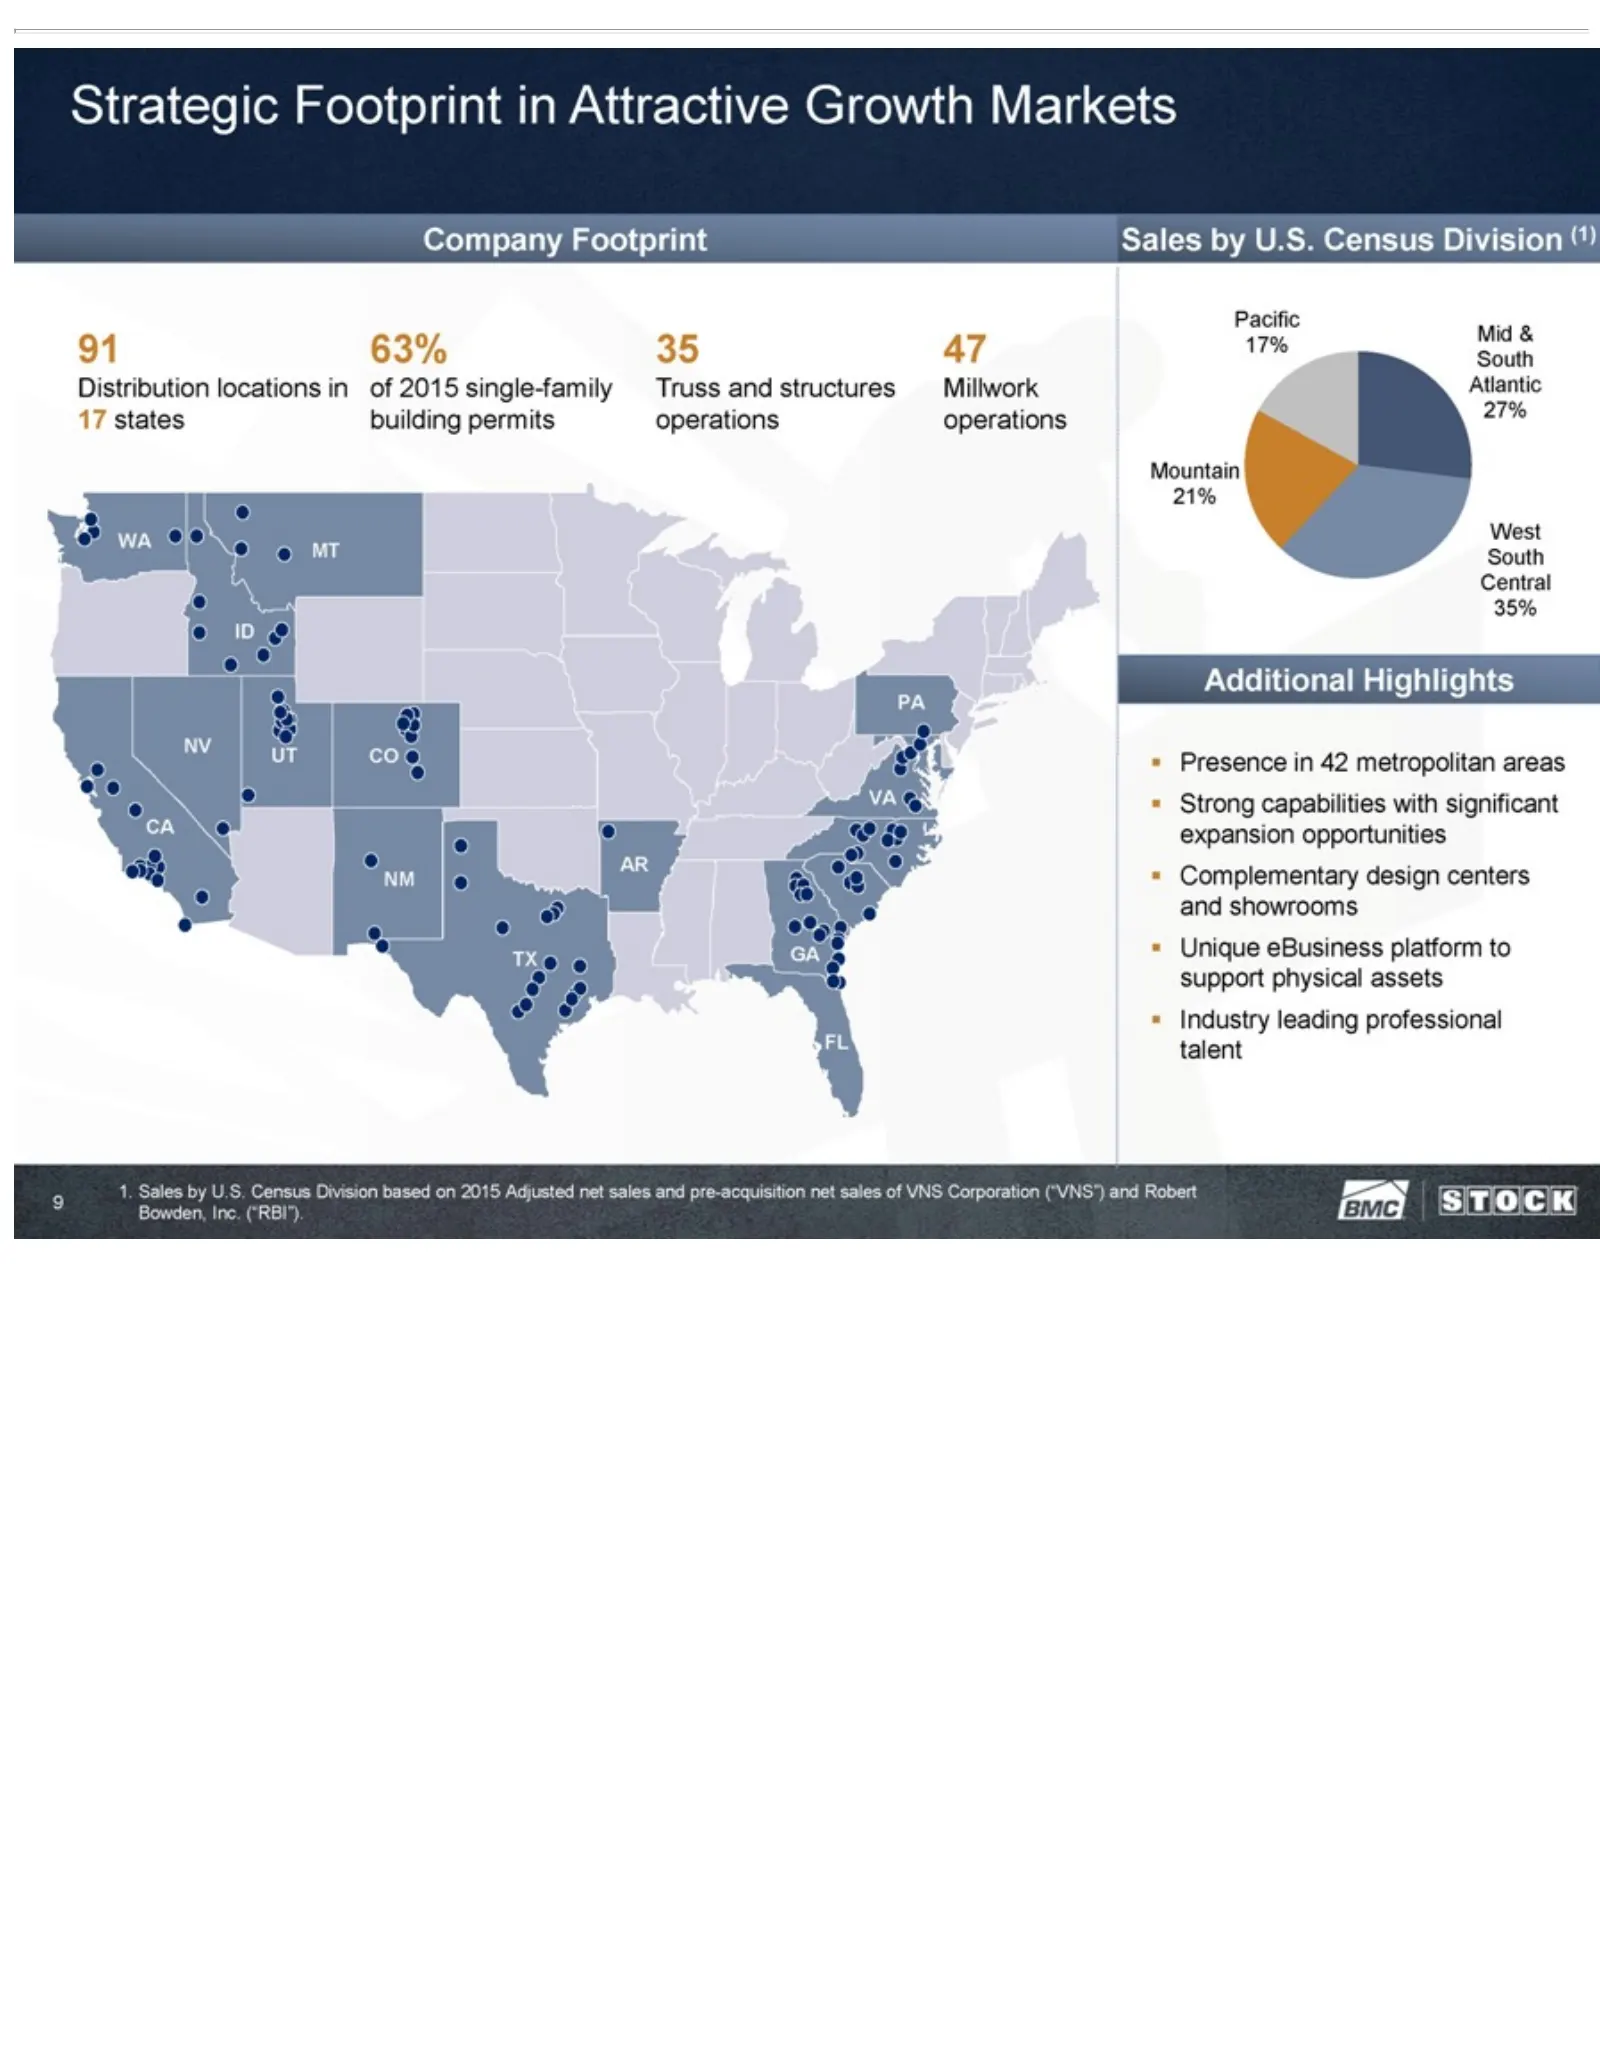
Slide 9: Strategic Footprint in Attractive Growth Markets
Strategic •ID Census Strong PA NV Division capabilities Footprint UT CObased VA inwith Attractive CA onsignificant AR 2015NMAdjusted Growth TXexpansion GAMarkets net FLsales Sales opportunities Company and bypre-acquisition U.S.Footprint Census • Complementary Division 91 netDistribution sales (1)of
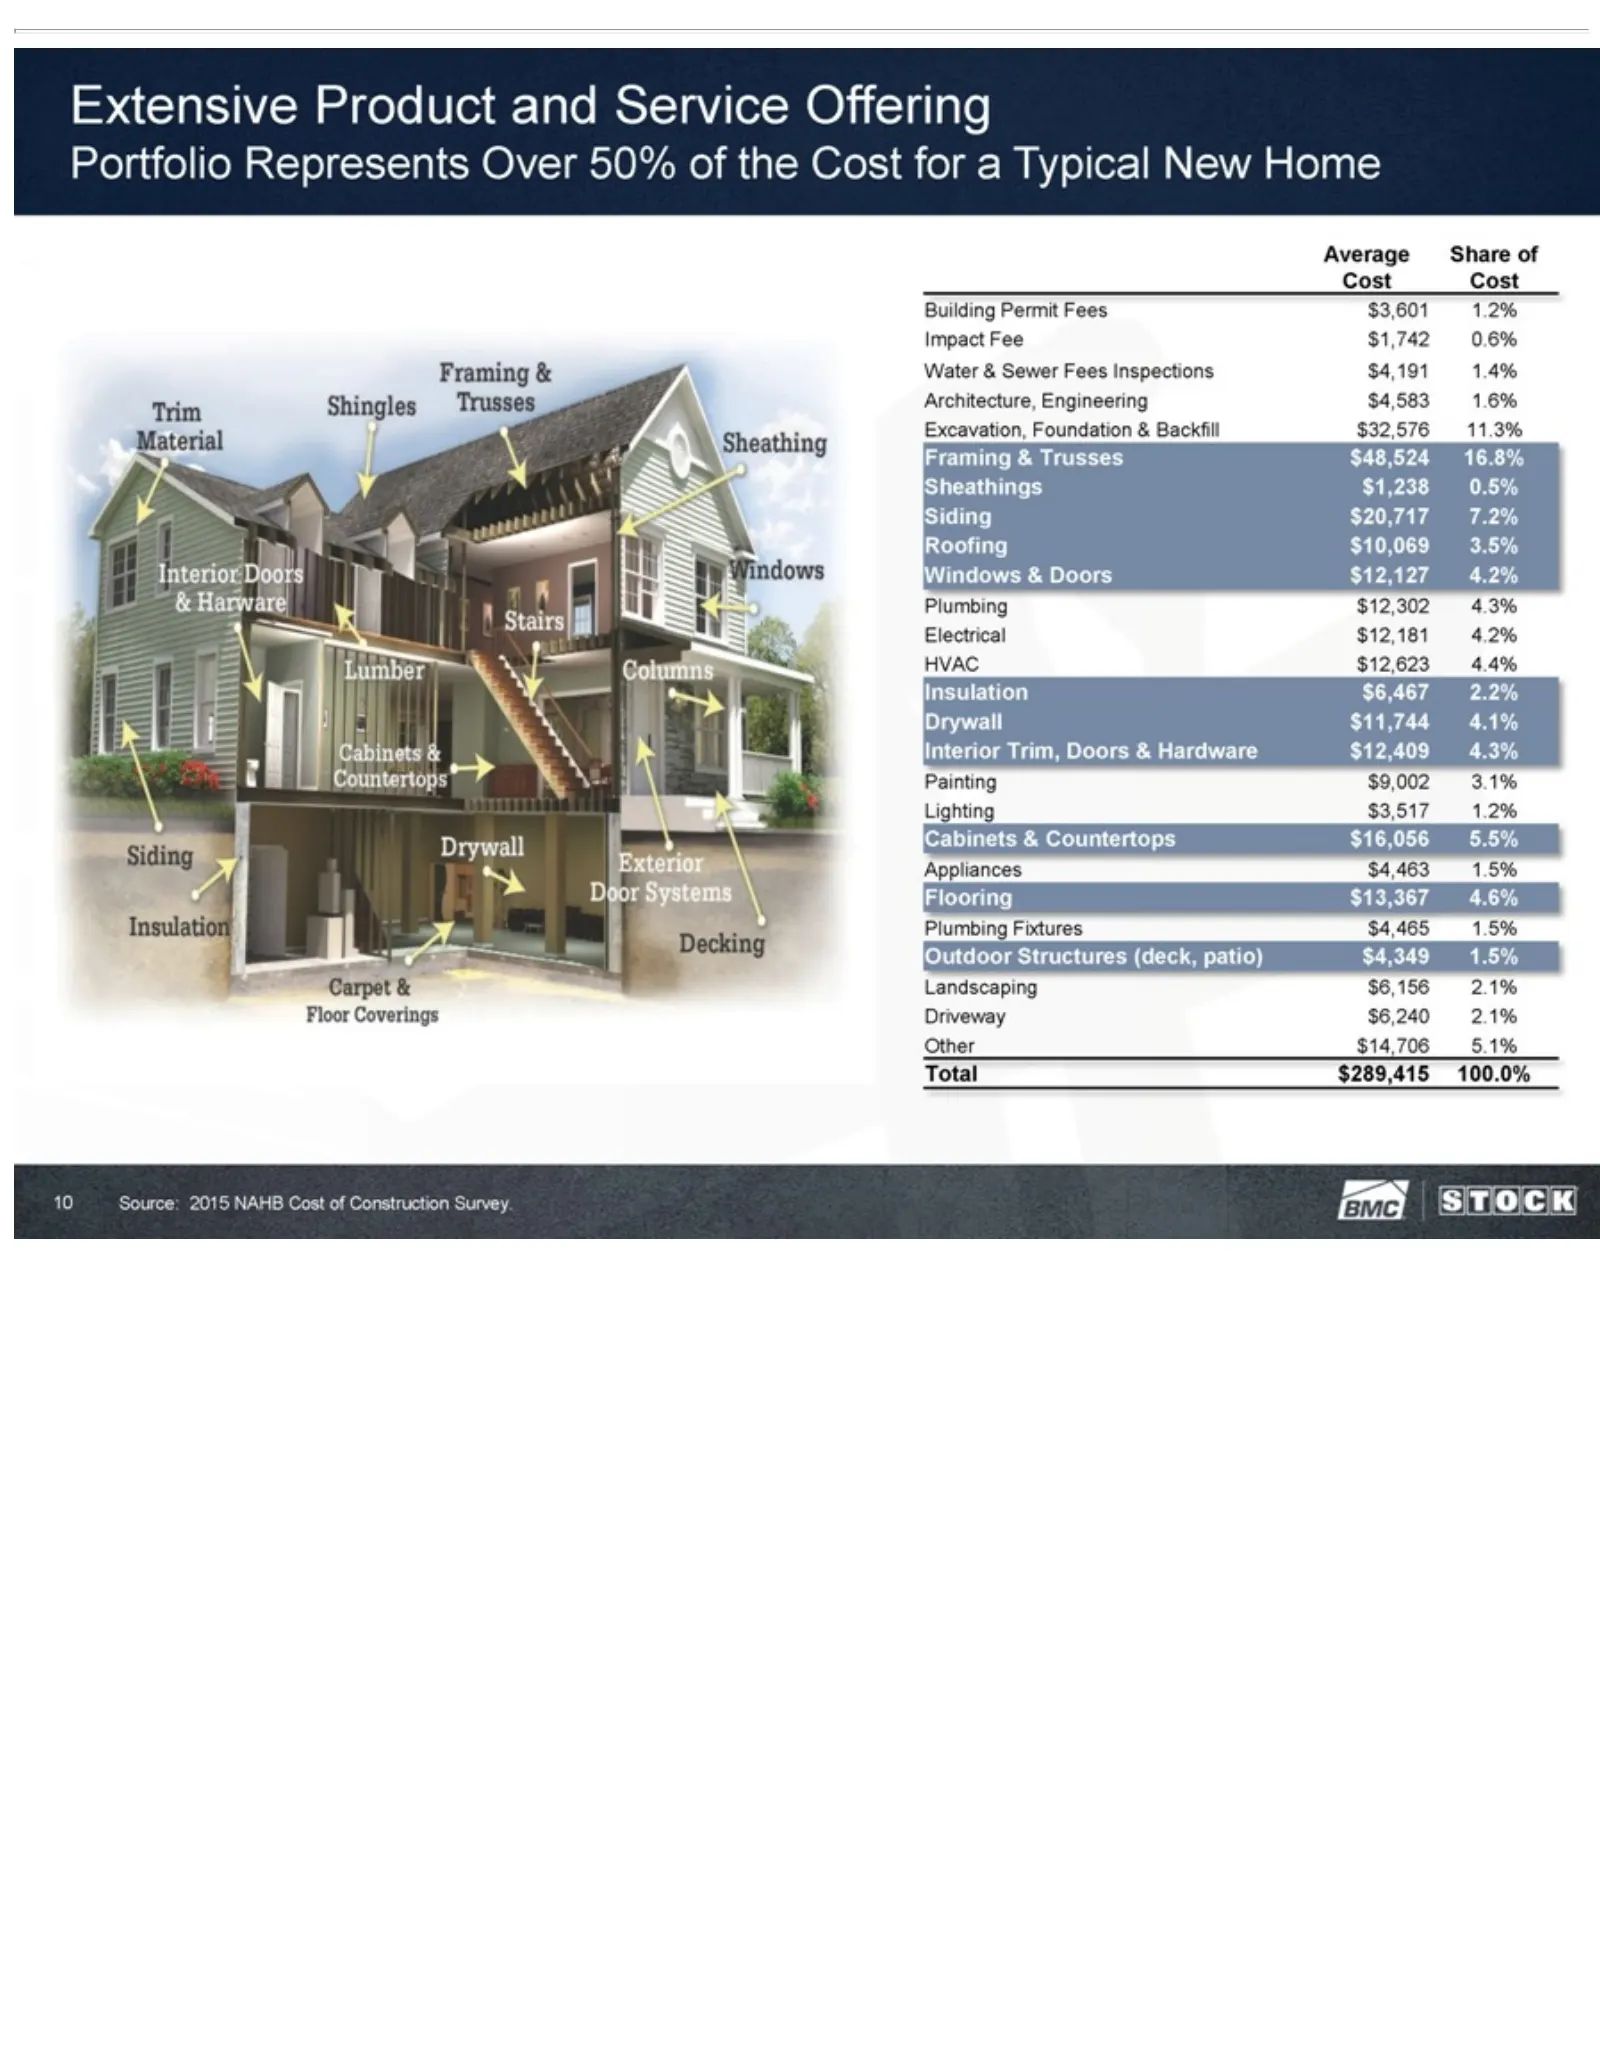
Slide 10: Extensive Product and Service Offering
Extensive Inspections 3.5% $9,002 $6,156 Windows 3.1% 2.1% Product $4,191 Lighting Driveway & Doors and 1.4% $3,517 Service $6,240 $12,127 Architecture, 1.2% Offering 2.1% 4.2% Cabinets Other Engineering Plumbing Portfolio $14,706 & Countertops Represents $12,302 $4,583 5.1% Total 4.3% 1.6% $16,056
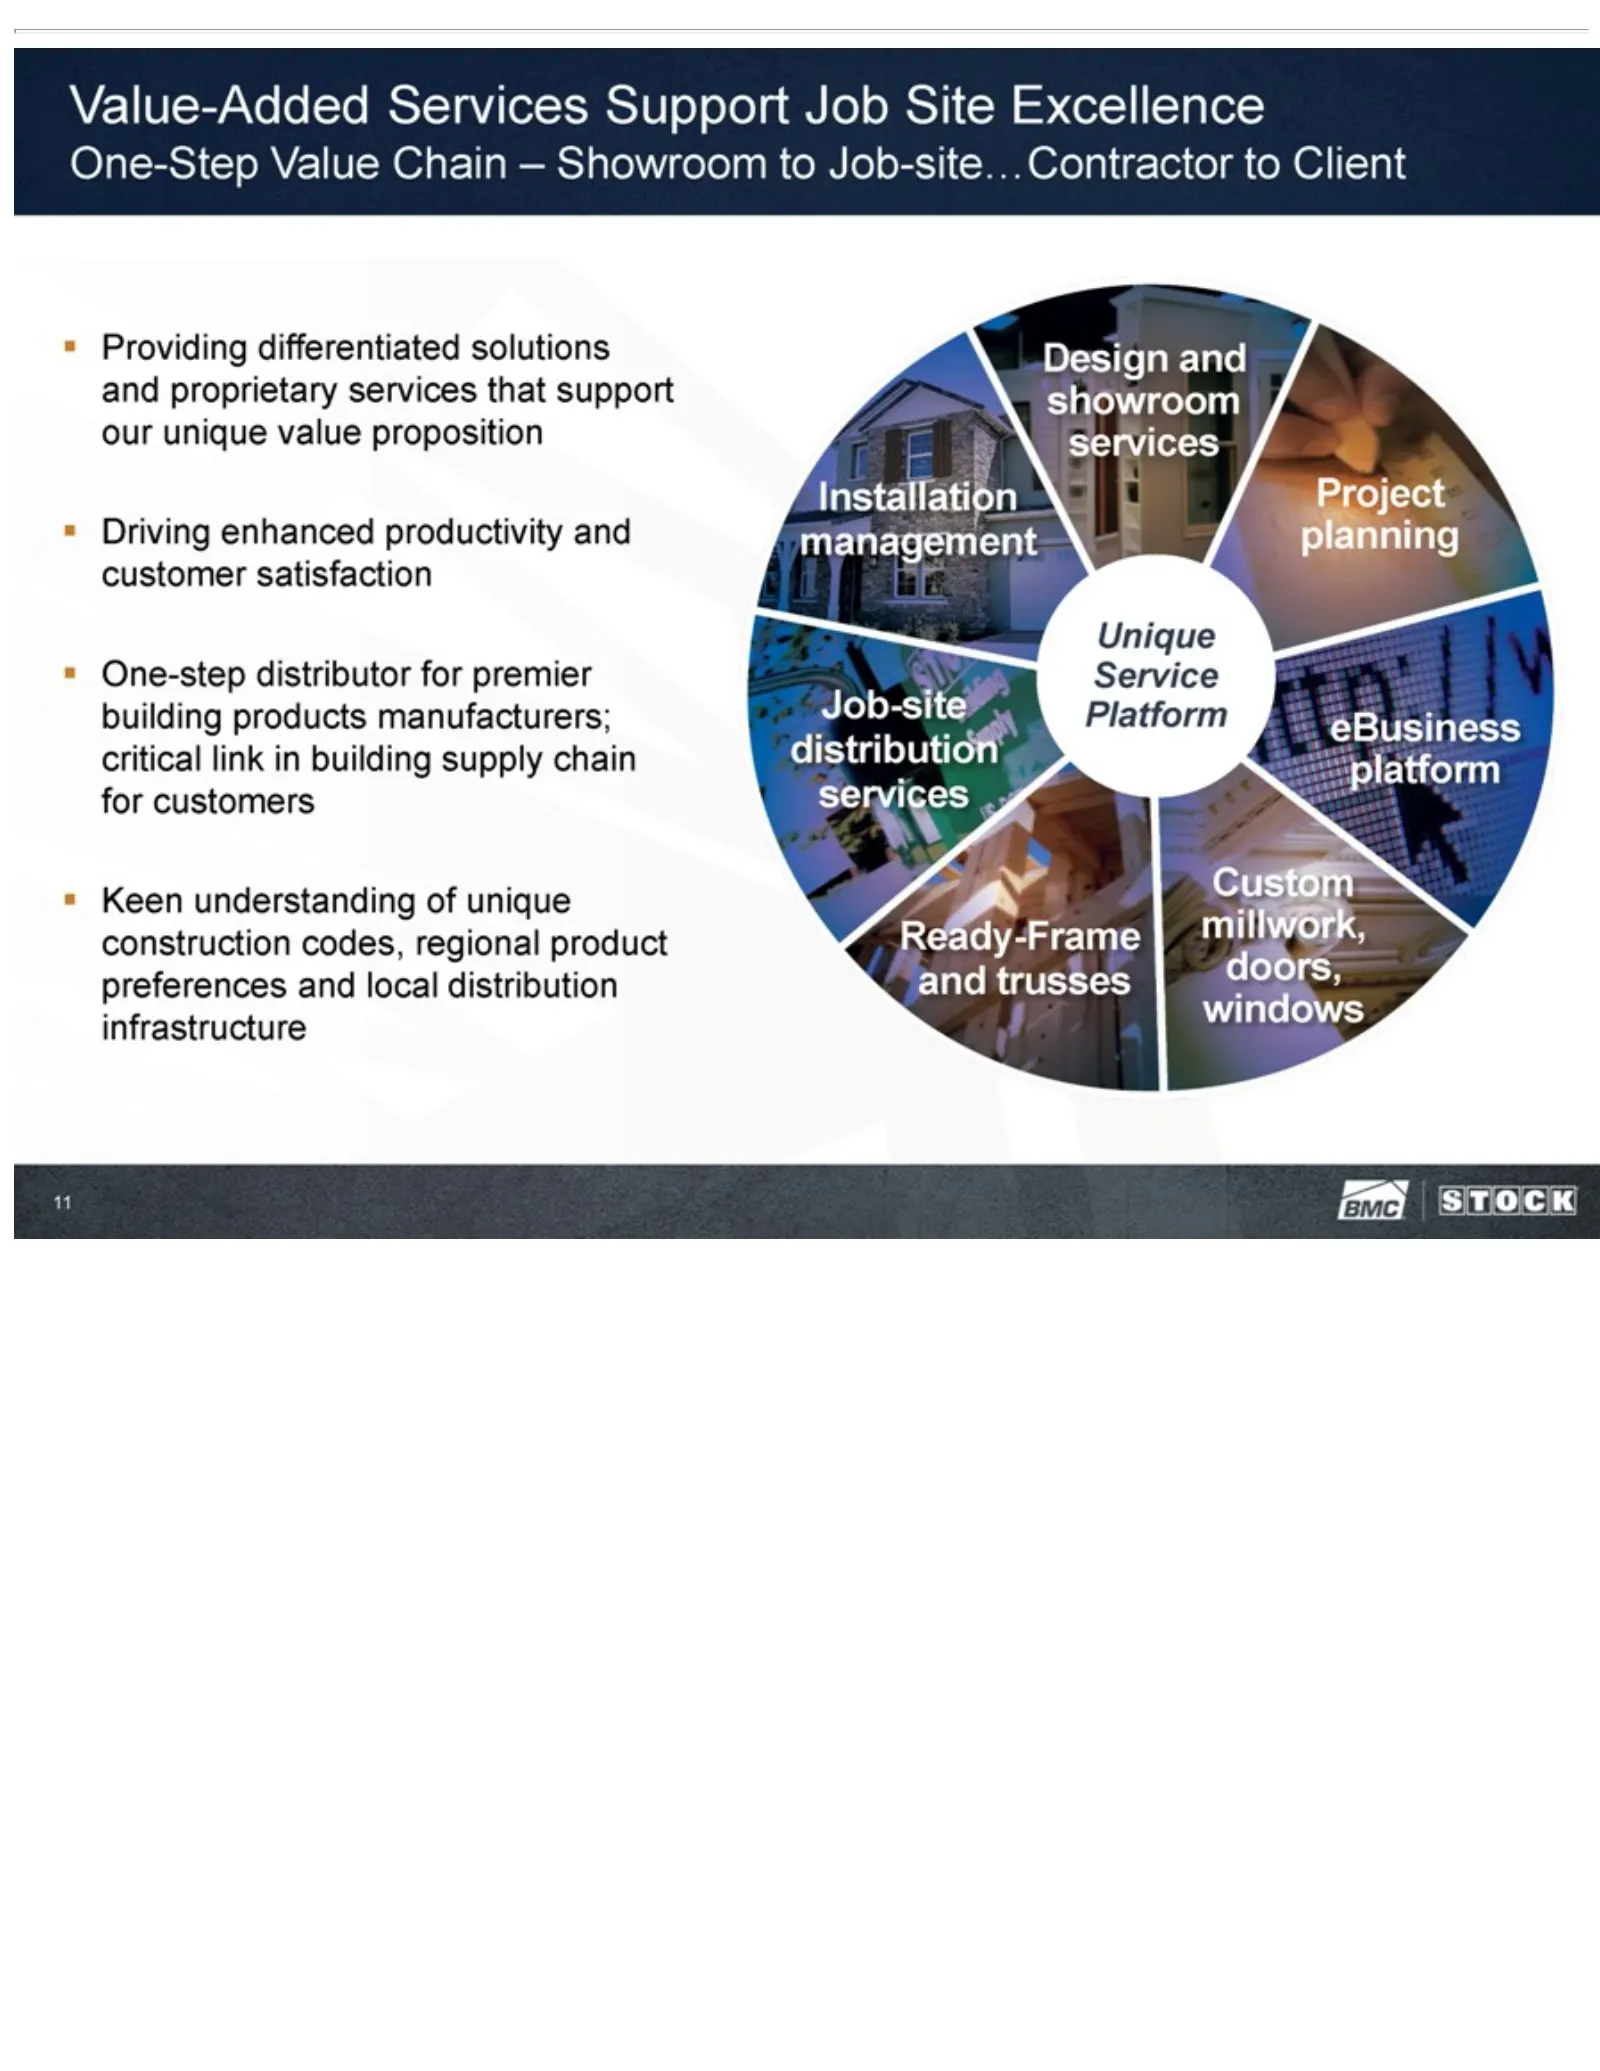
Slide 11: Value-Added Services: Unique Value Proposition
Value-Added proposition unique trusses construction Job-site • Driving Services distribution codes, enhanced Support regional services Job productivity Site product Installation Excellence preferences and management customer One-Step and satisfaction local Value Unique distribution Chain Service • O
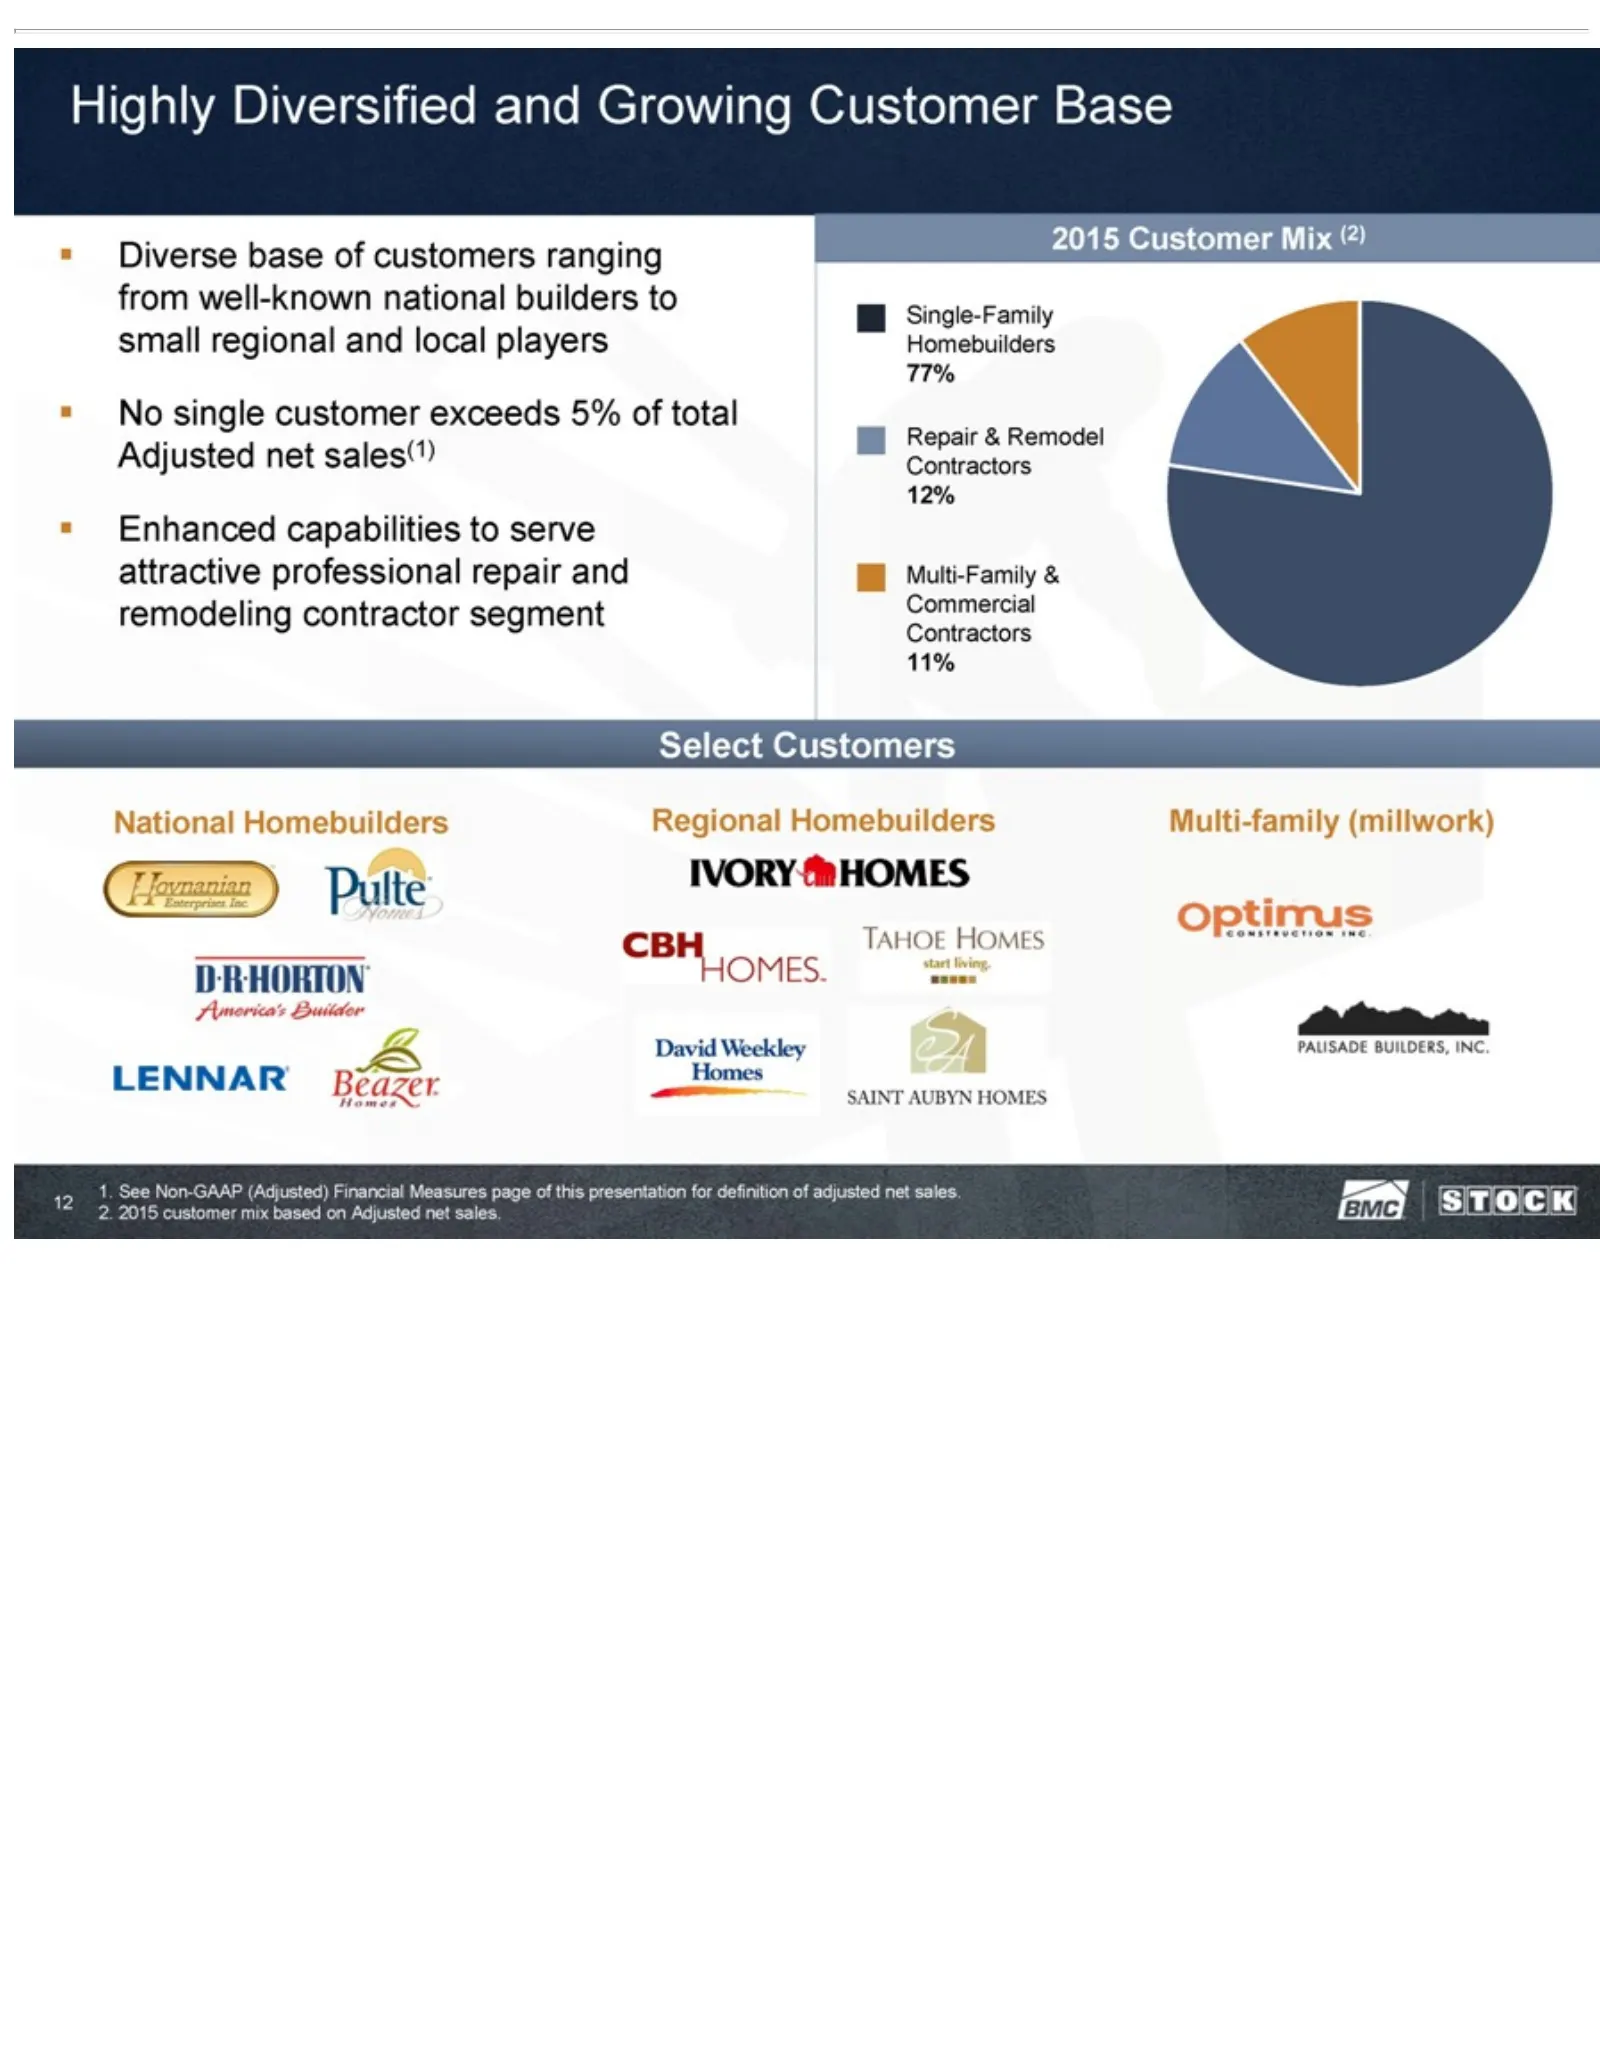
Slide 12: Highly Diversified Customer Base
Highly Diversified Enhanced Commercial adjusted net capabilities sales. Contractors 2.and 2015 toGrowing serve 11% customer Select attractive Customer mix Customers professional based Baseon National • Adjusted Diverse repair Homebuilders base net andsales. of remodeling customers 12Regional contrac
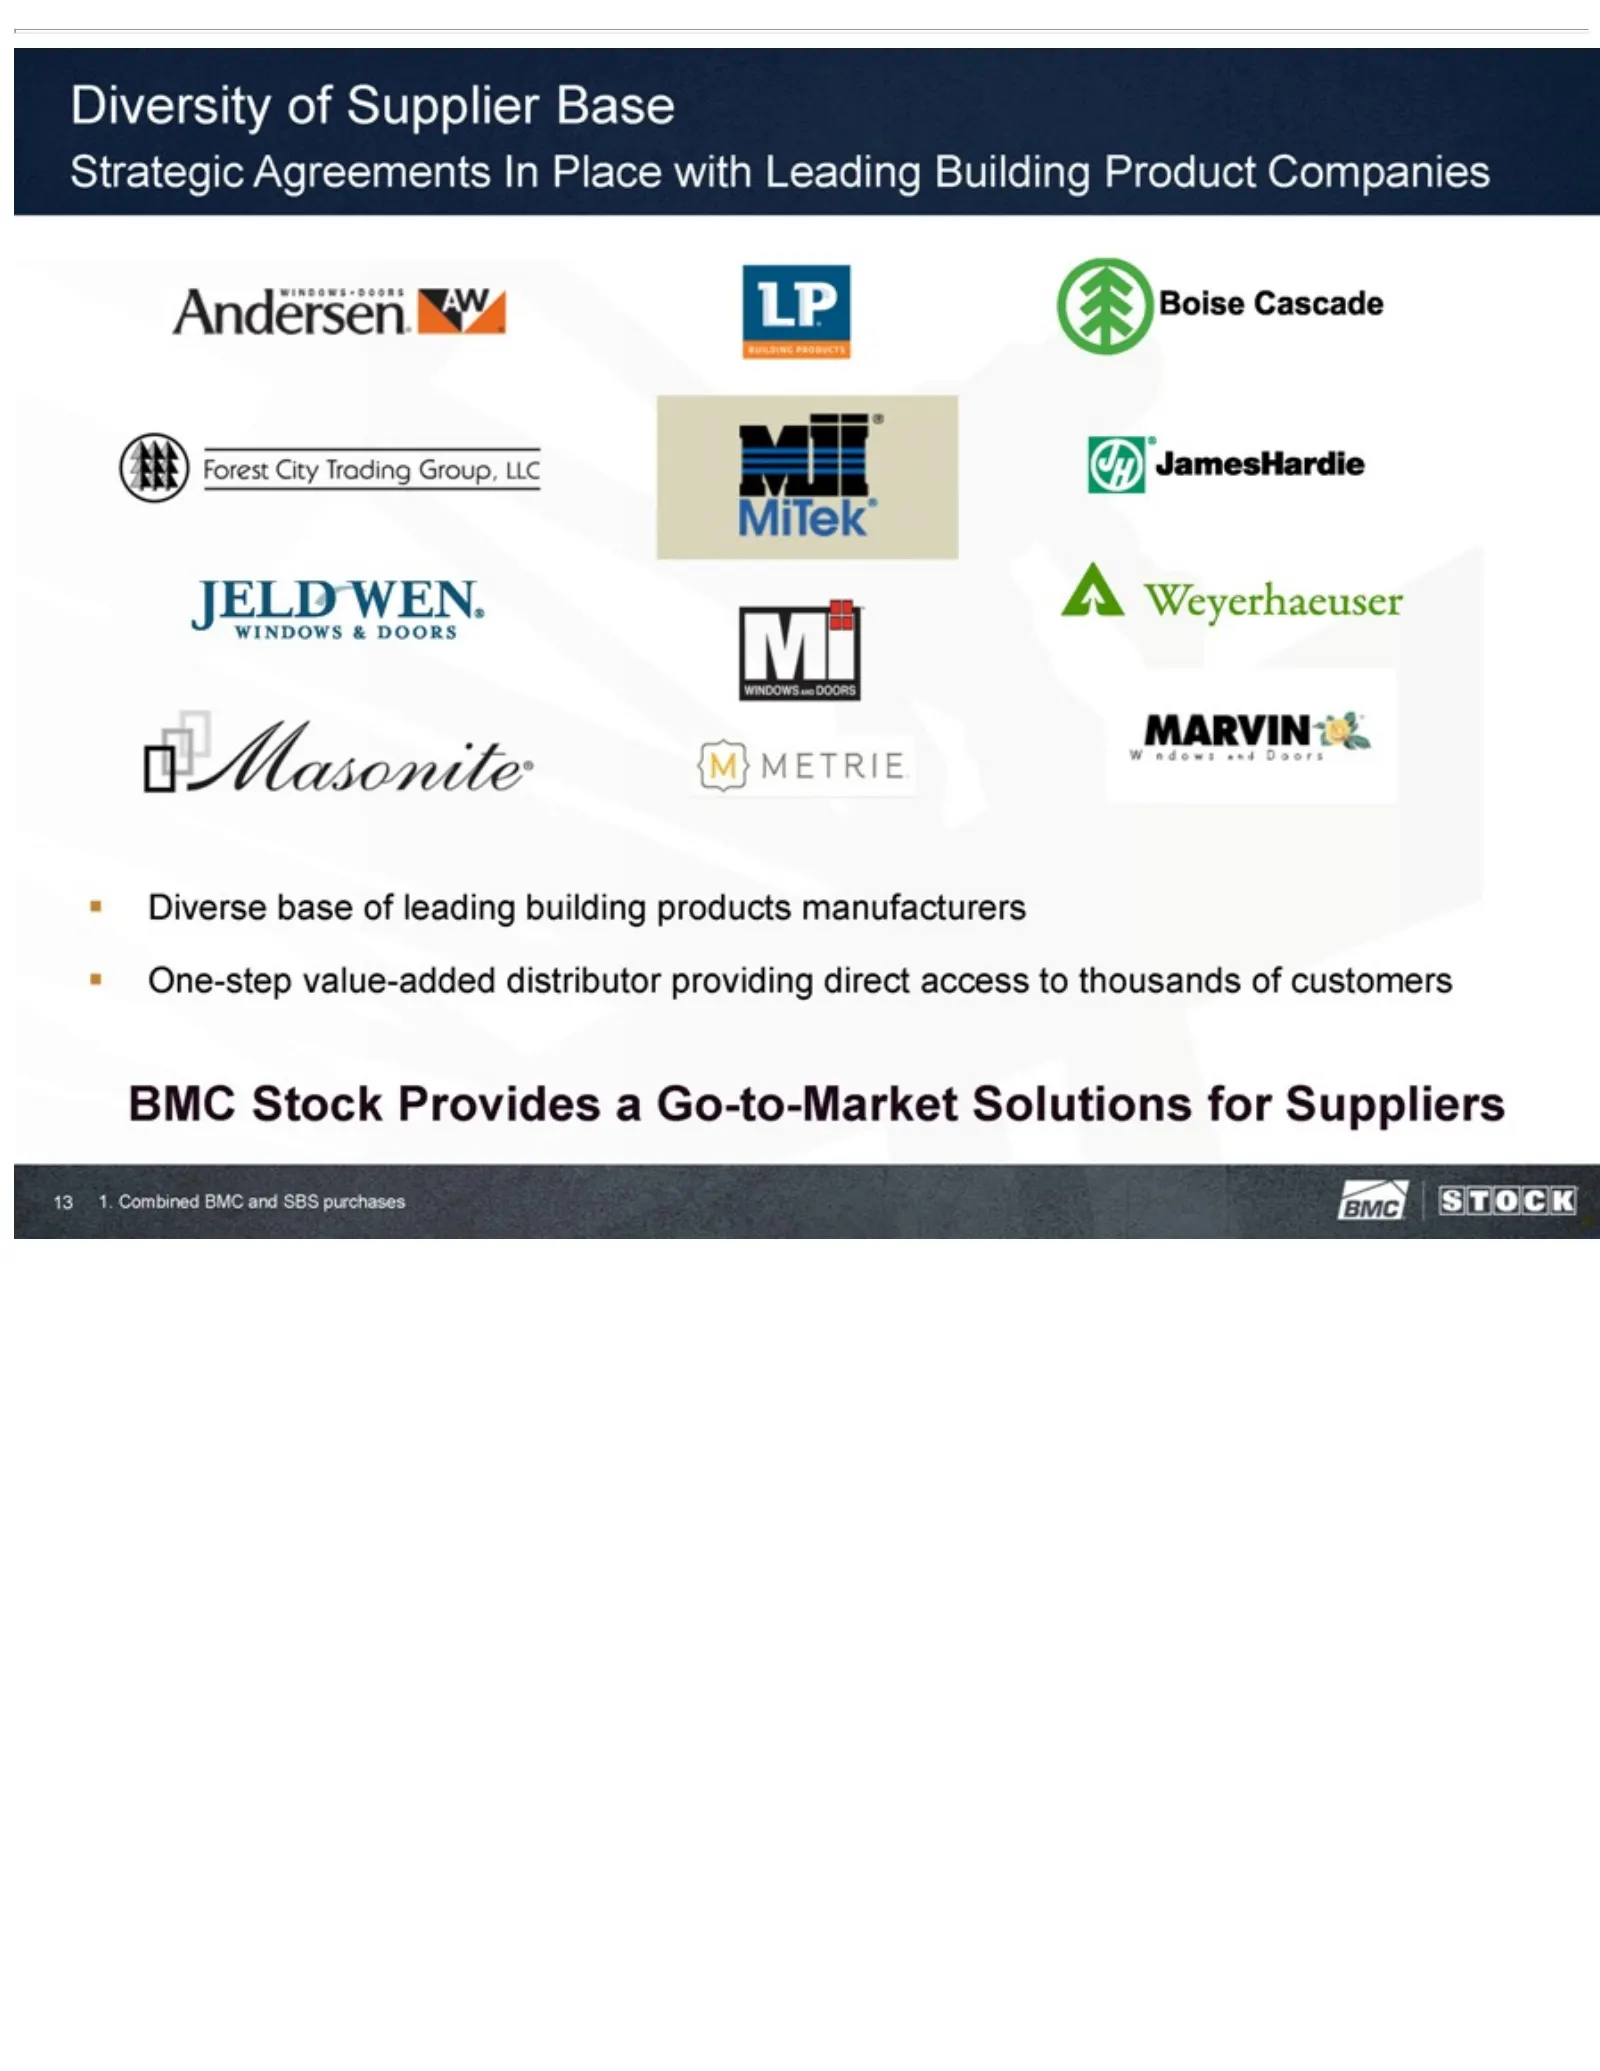
Slide 13: Diversity of Supplier Base and Strategic Agreements
Diversity of thousands ofSupplier customers Base BMCStrategic Stock Agreements Provides a Go-to-Market In Place withSolutions Leading Building for Suppliers Product 1. Combined Companies BMC Diverse and SBS base purchases of leading 13 building products manufacturers One-step value-added distributor
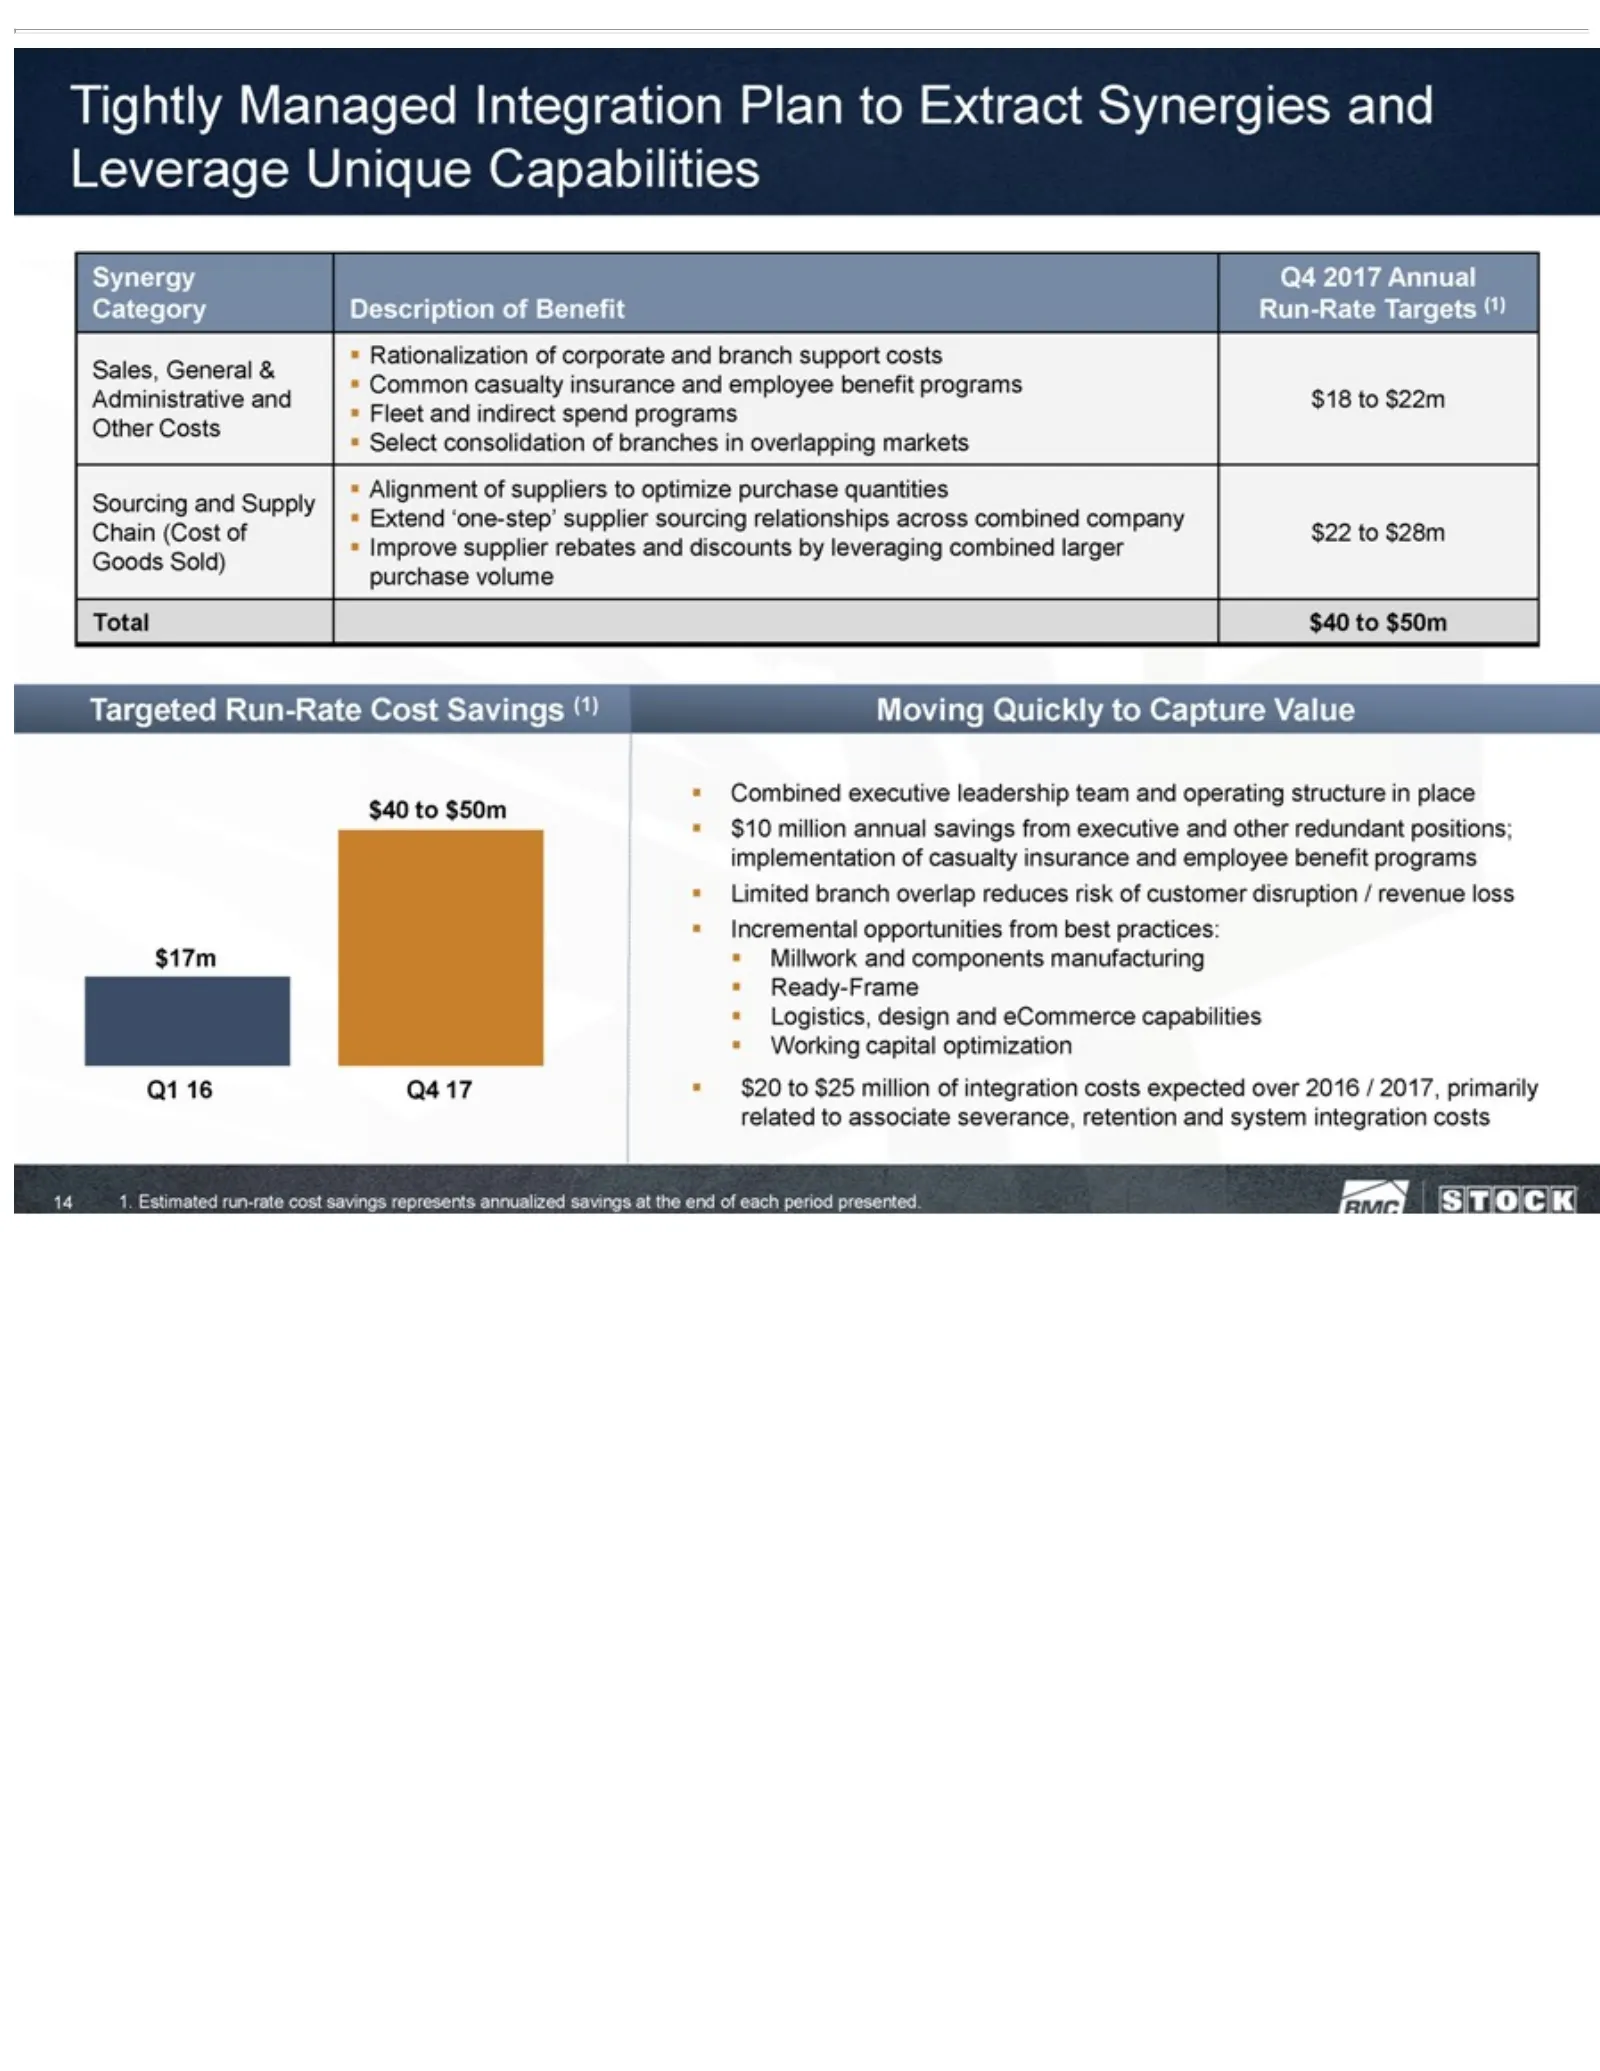
Slide 14: Tightly Managed Integration Plan and Synergies
Tightly costs markets discounts leadership reduces optimization savings Sales, Managed at risk Alignment by the team General of leveraging $20 end customer and to Integration ofof $25 operating & each suppliers Common combined million disruption period Plan structure to of casualty presented. to opt
Slide 15: Focused Growth Strategy
2 Focused Growth Strategy
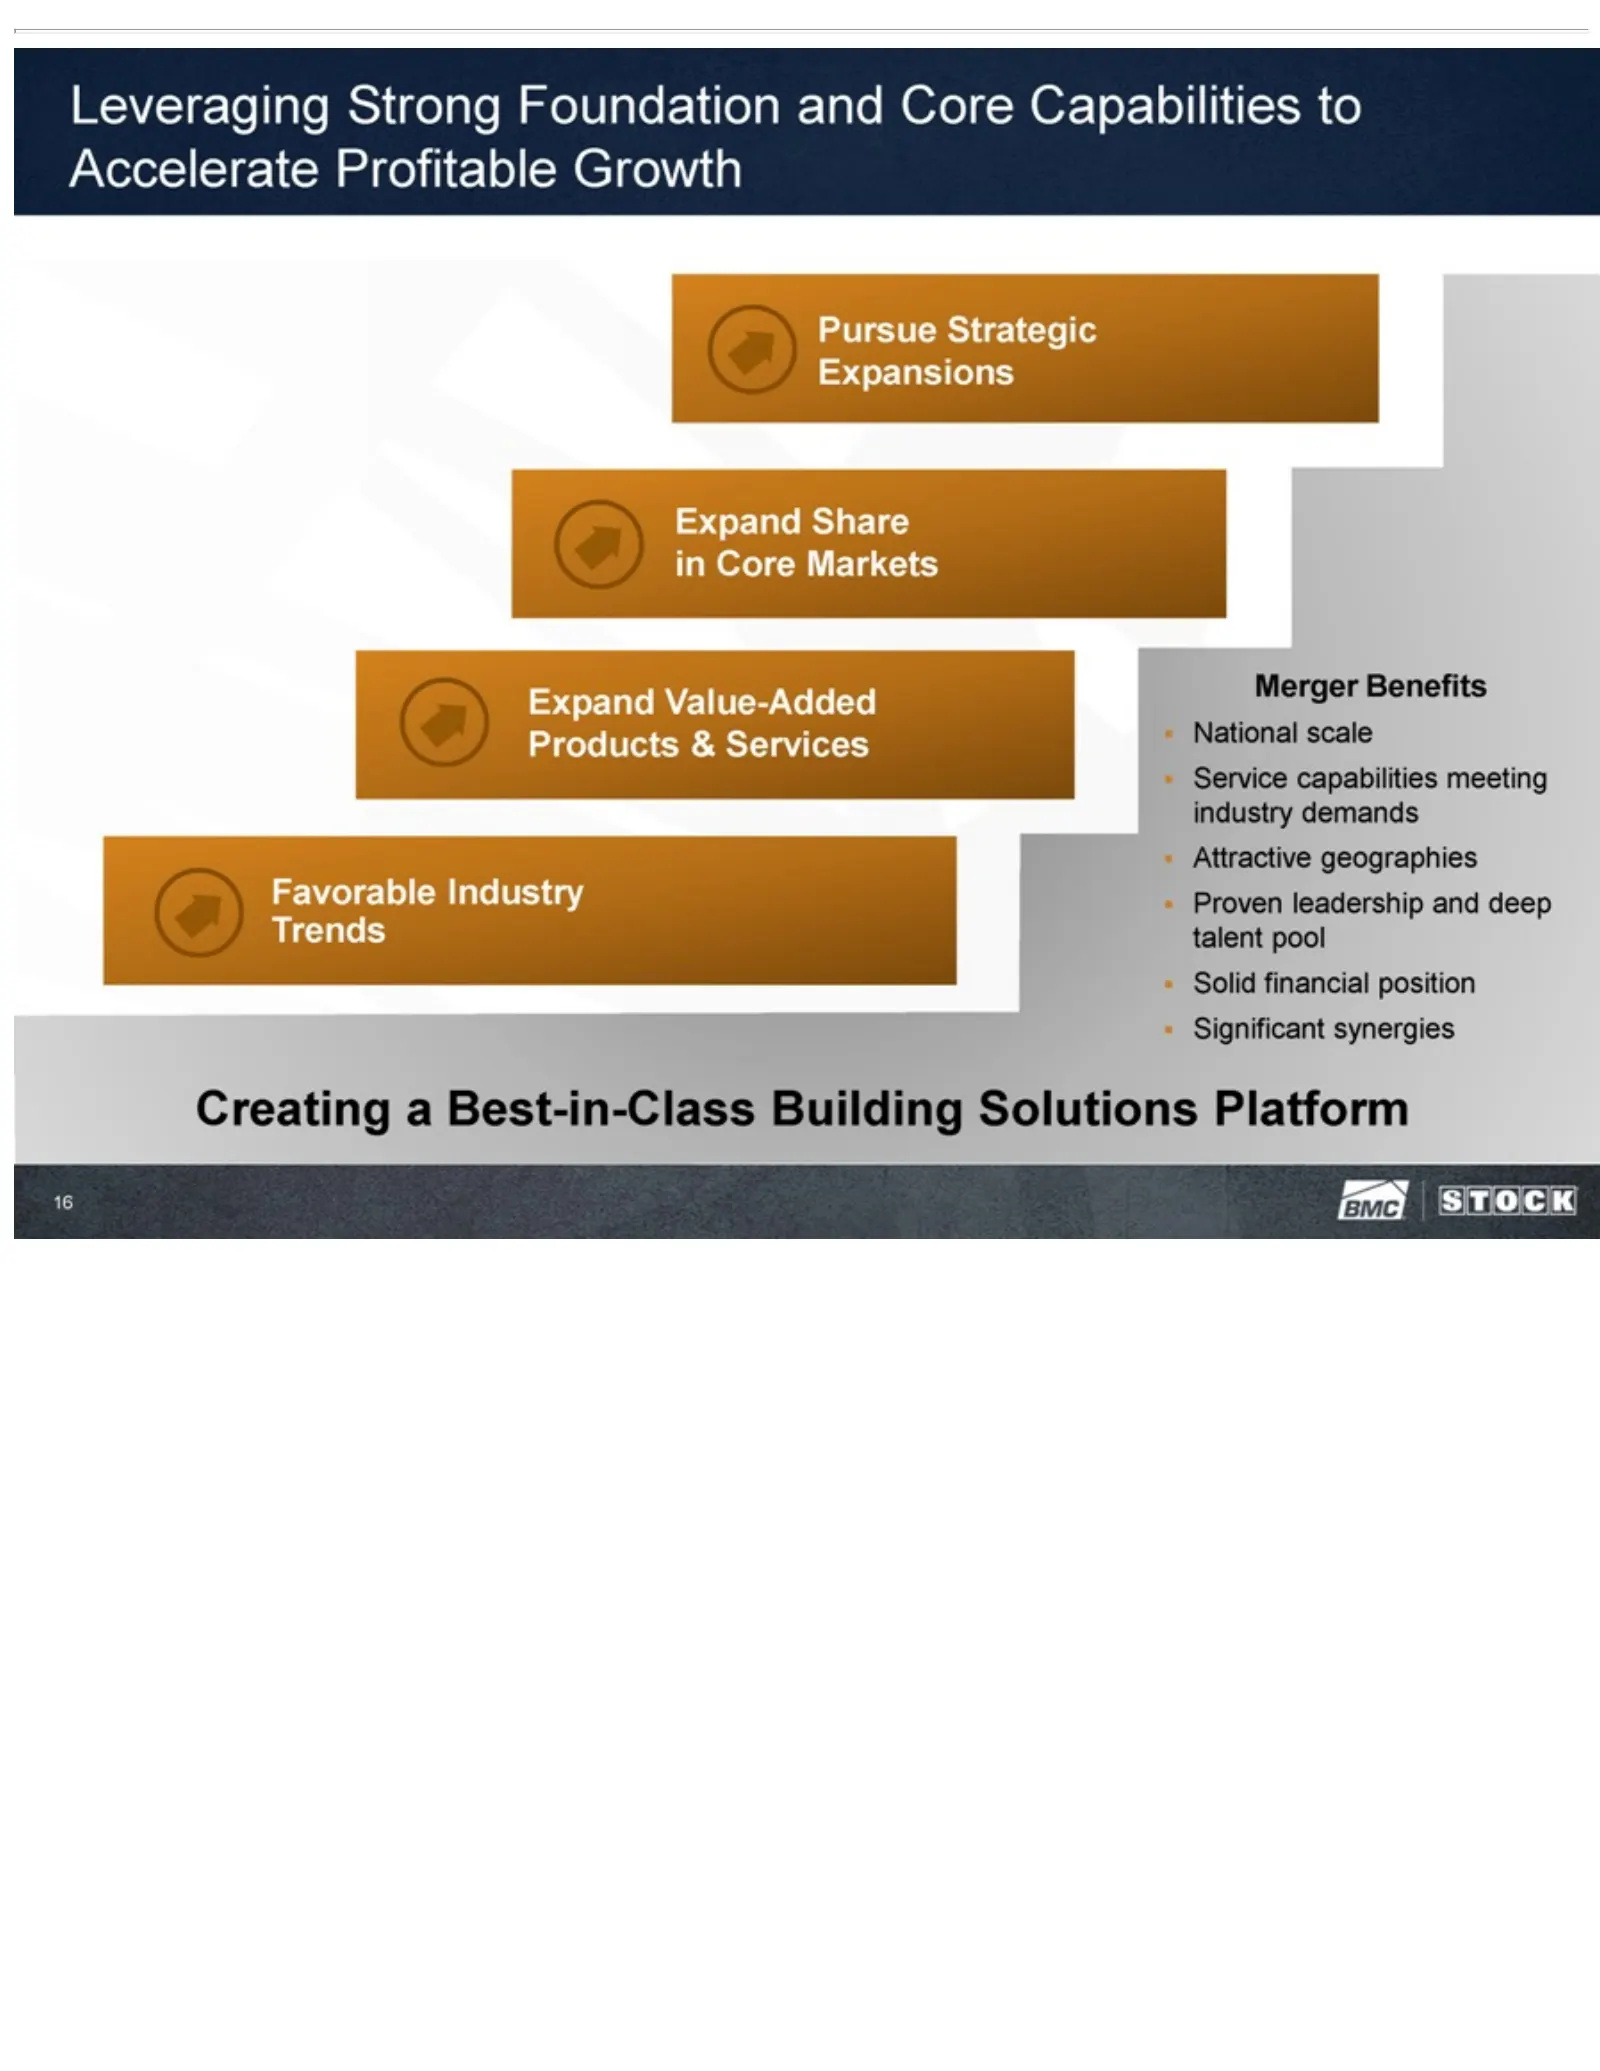
Slide 16: Leveraging Merger Benefits to Accelerate Profitable Growth
Leveraging Merger Building Benefits Solutions Strong National Foundation Platform scale 16and Service Corecapabilities Capabilitiesmeeting to Accelerate industry Profitable demandsGrowth Attractive Pursue geographies StrategicProven Expansions leadership ExpandandShare deep in talent Corepool Market
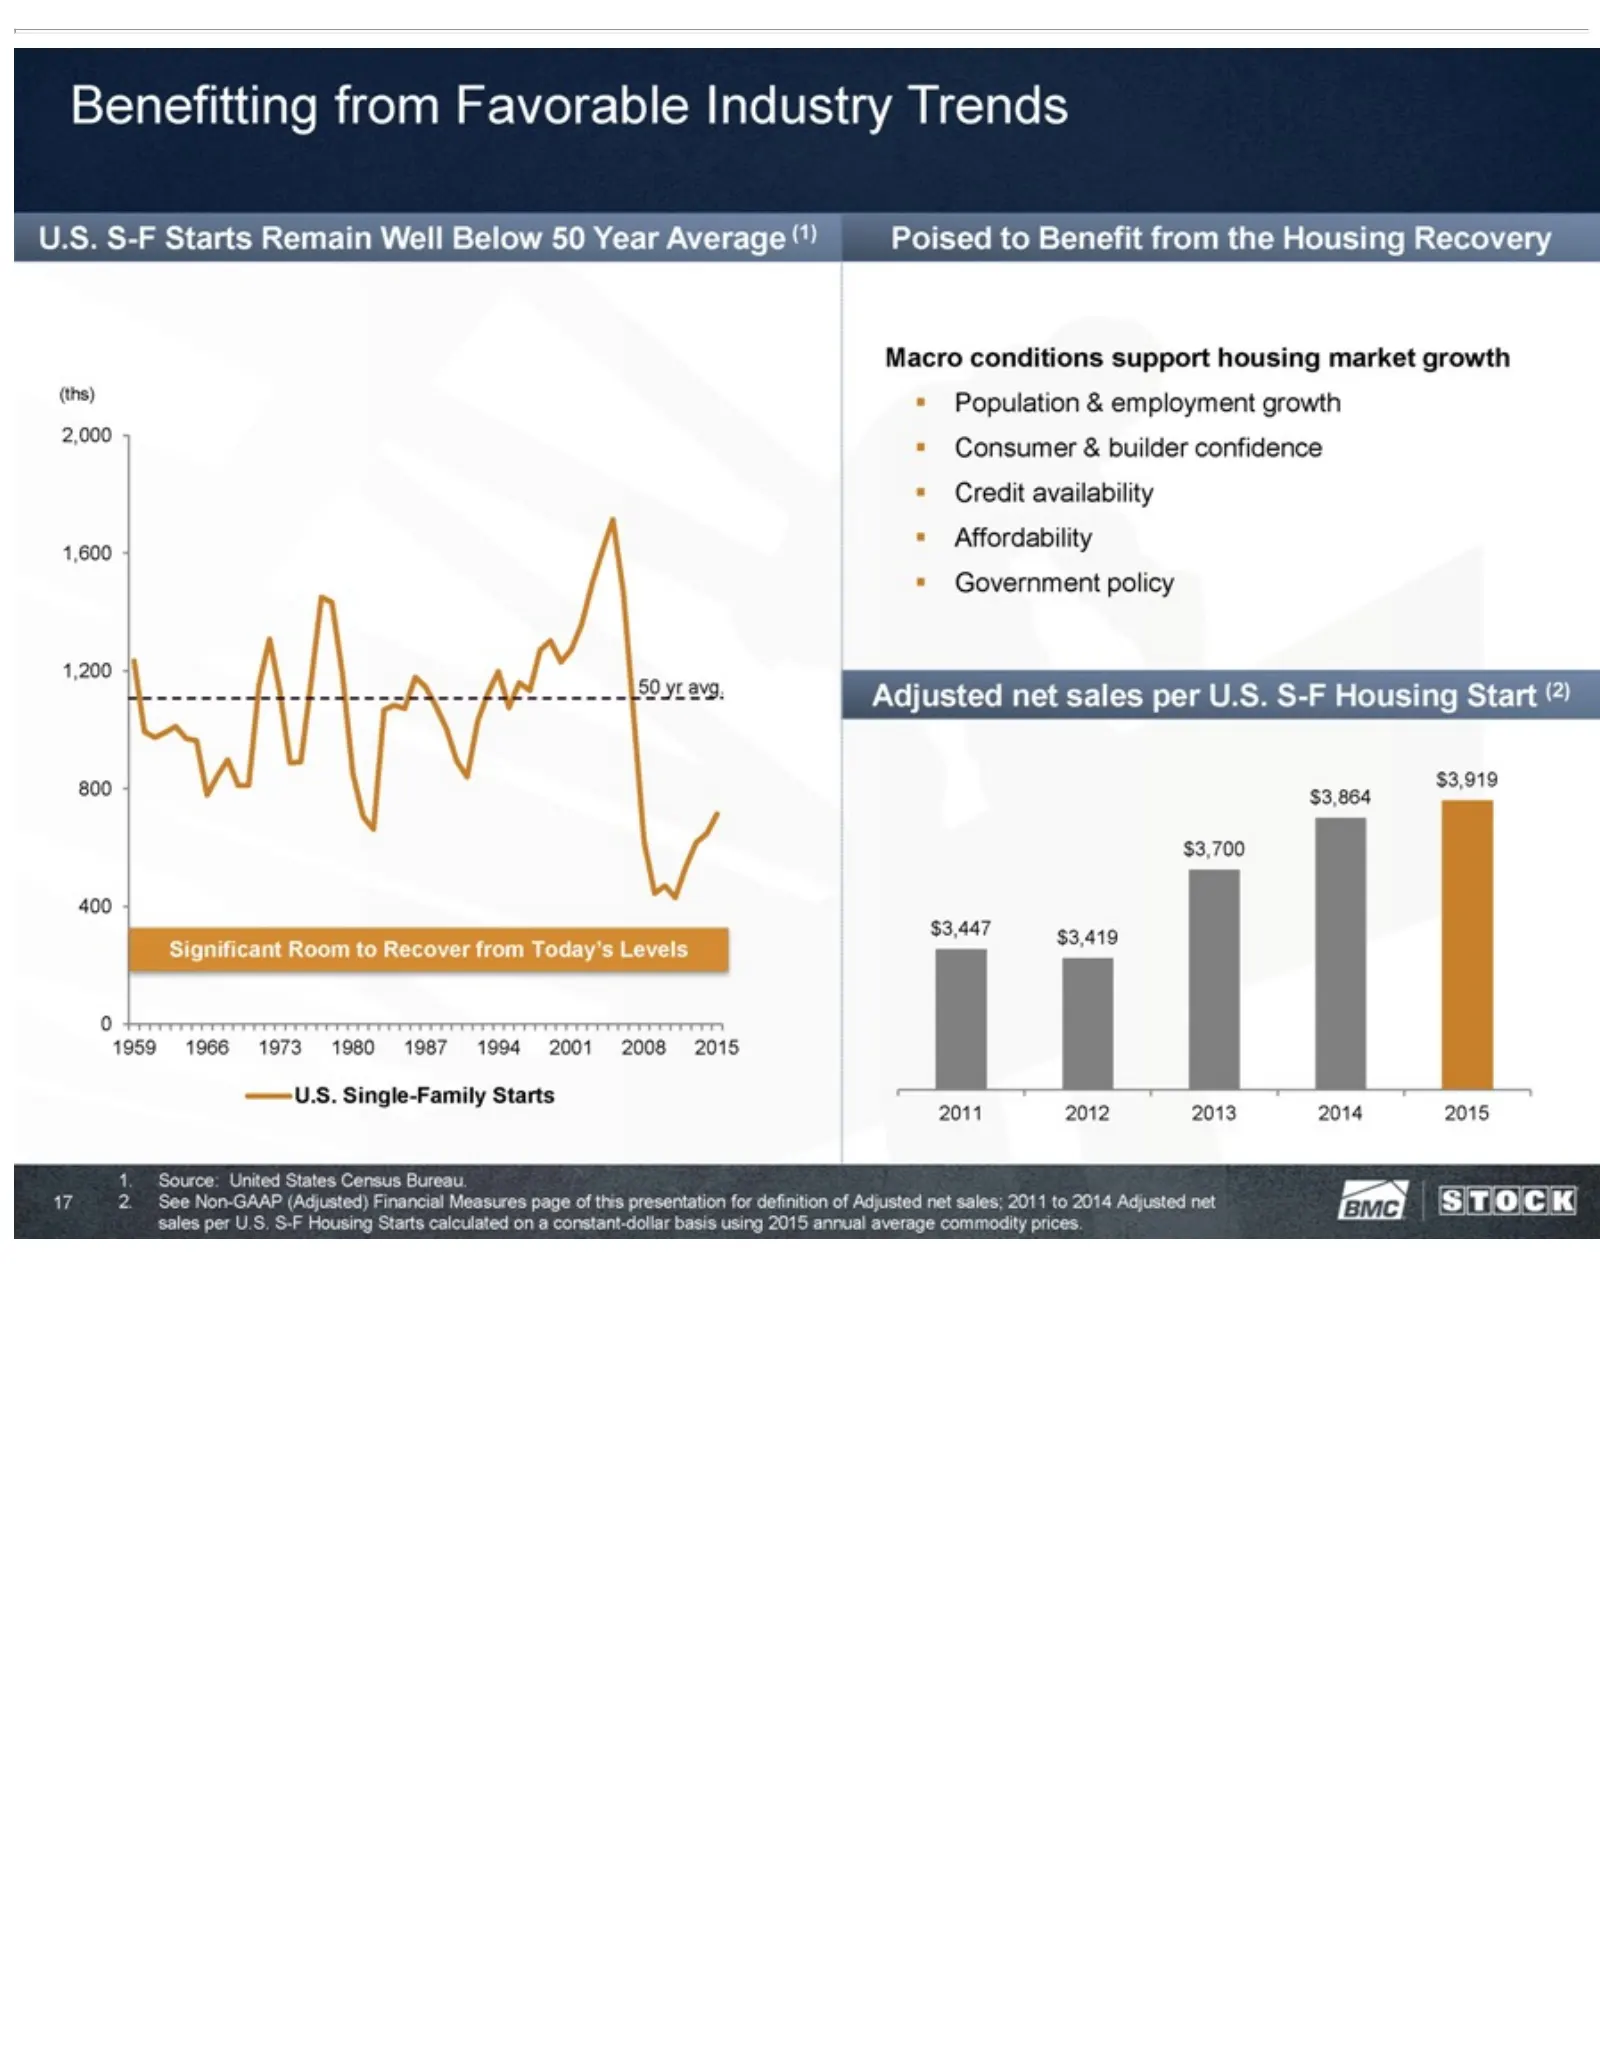
Slide 17: Benefitting from Favorable Industry Trends
Benefitting 1987 confidence Bureau. using 1994 2015 2. See 2001 •annual from Credit Non-GAAP 2008 Favorable average availability 2015commodity (Adjusted) Industry U.S.• Single-Family Affordability Trends Financial prices. U.S. 17 • Starts Government Measures S-F Starts Poised page Remain policy to B
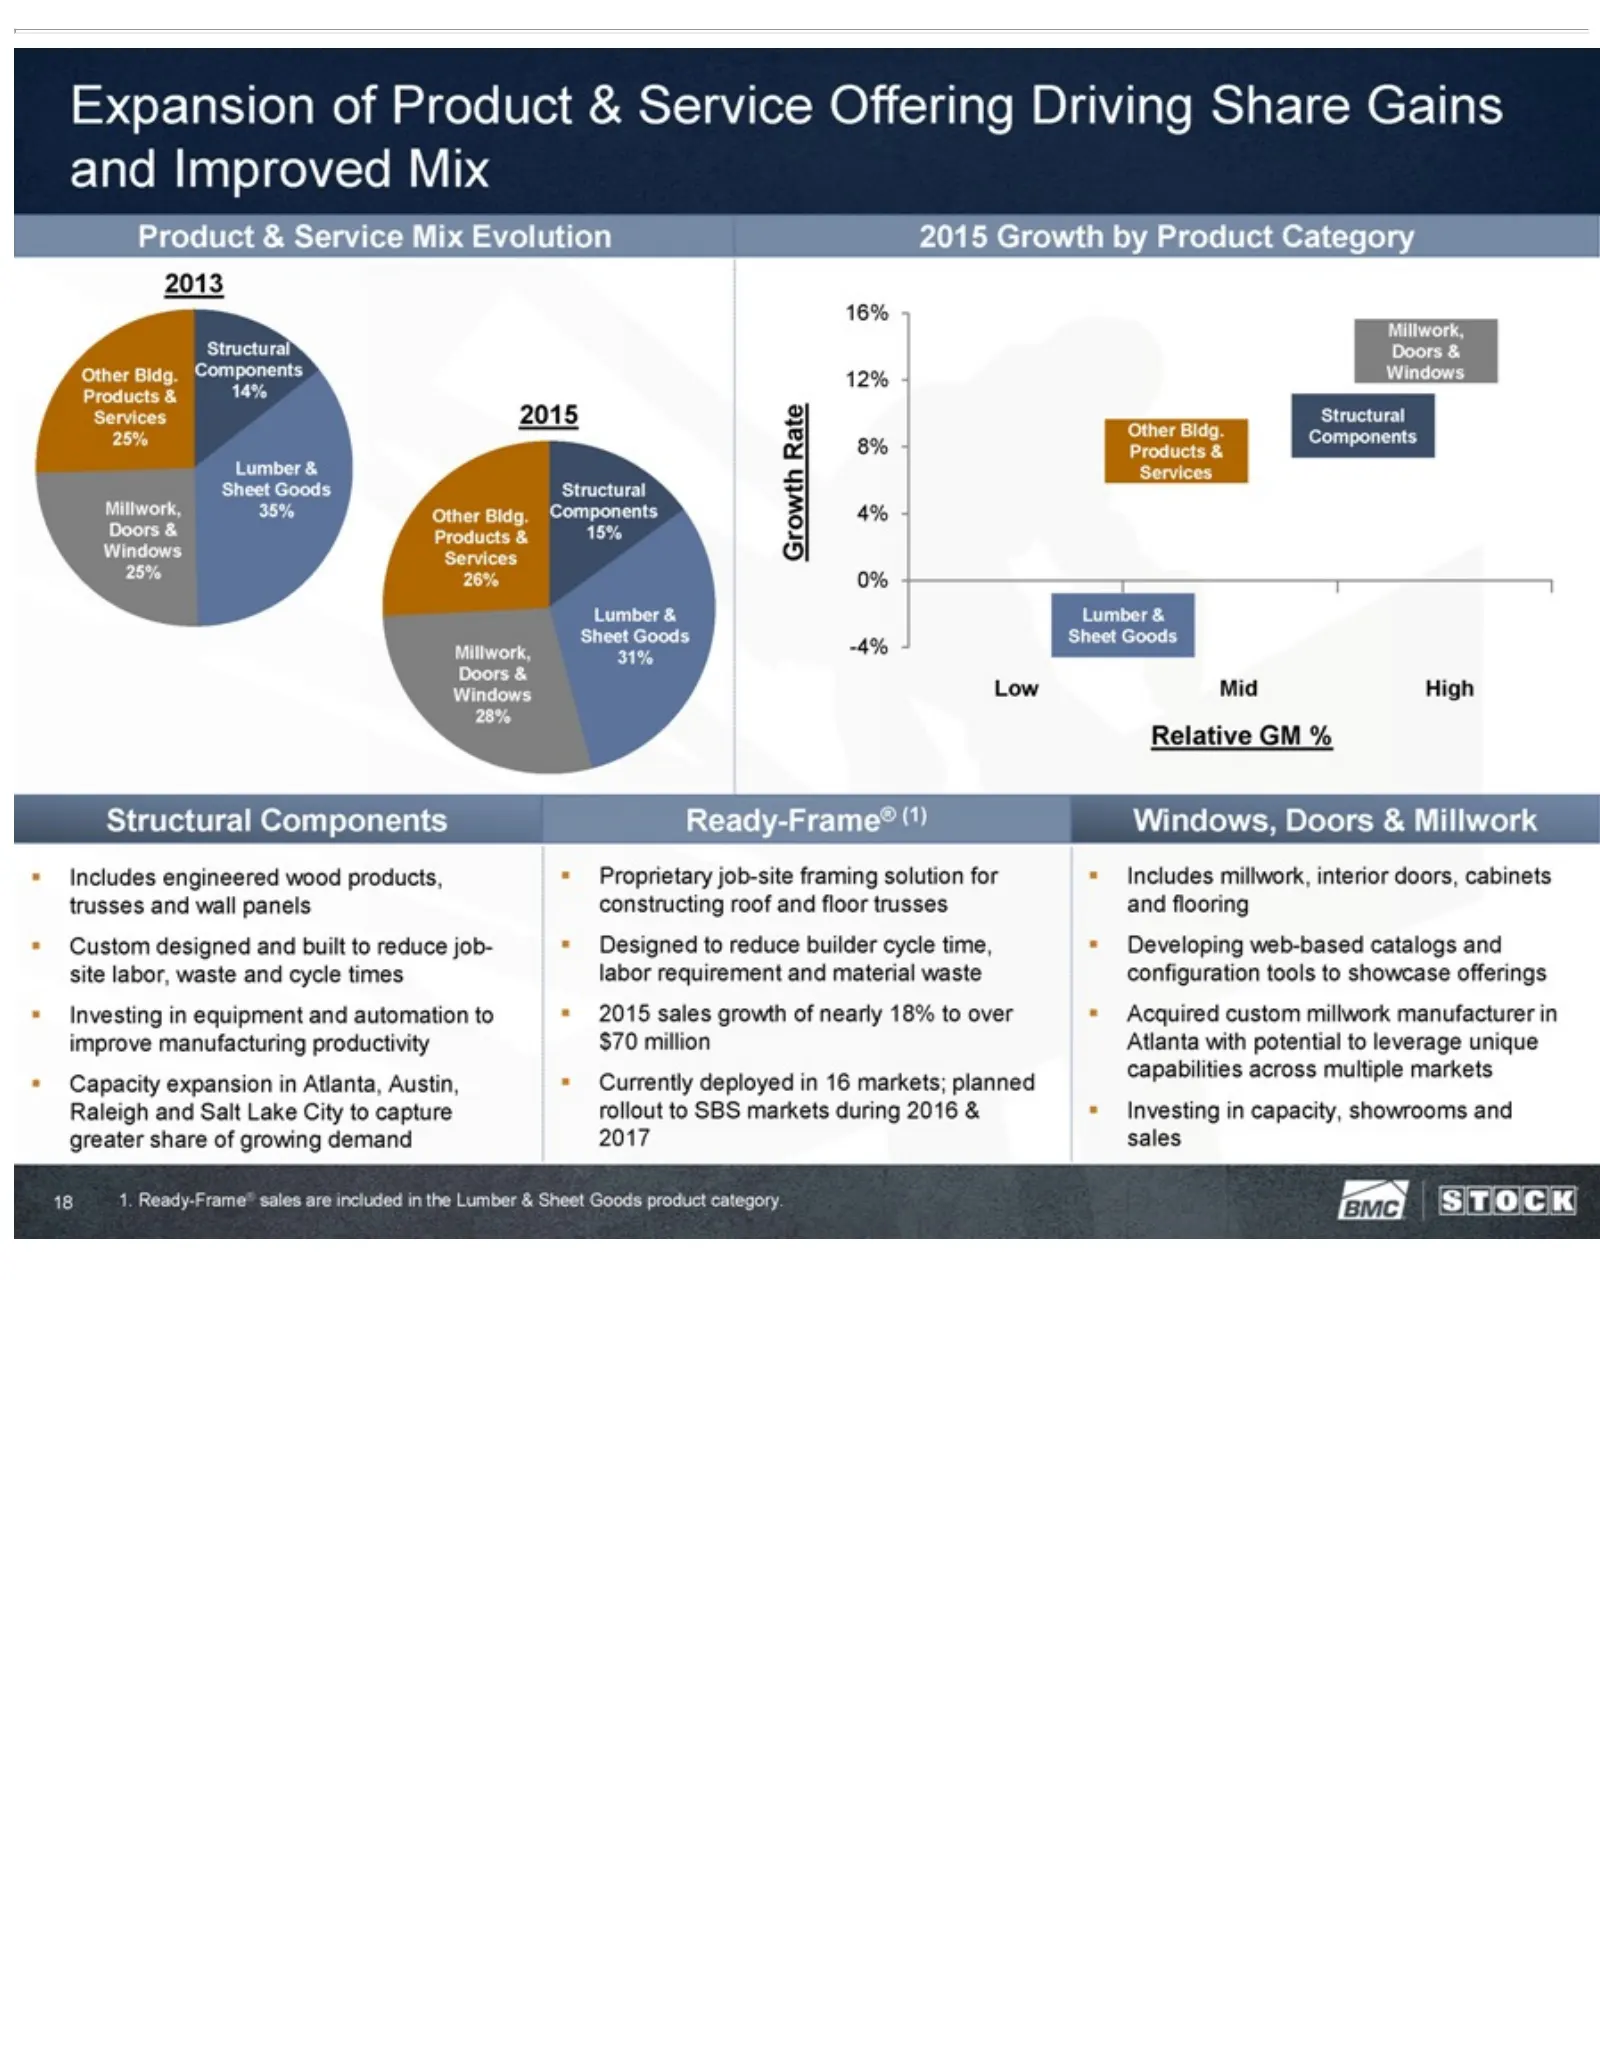
Slide 18: Expansion of Millwork, Doors & Windows; Share Gains
Expansion Millwork, Rate engineered expansion builder Doors potential 16% &cycle Millwork to12% Doors in of wood leverage Atlanta, time, Product 8%& products, labor •4% Windows Includes unique Austin, &0%Service requirement -4% trusses capabilities Raleigh millwork, 25% Millwork, Offering and 2015 a
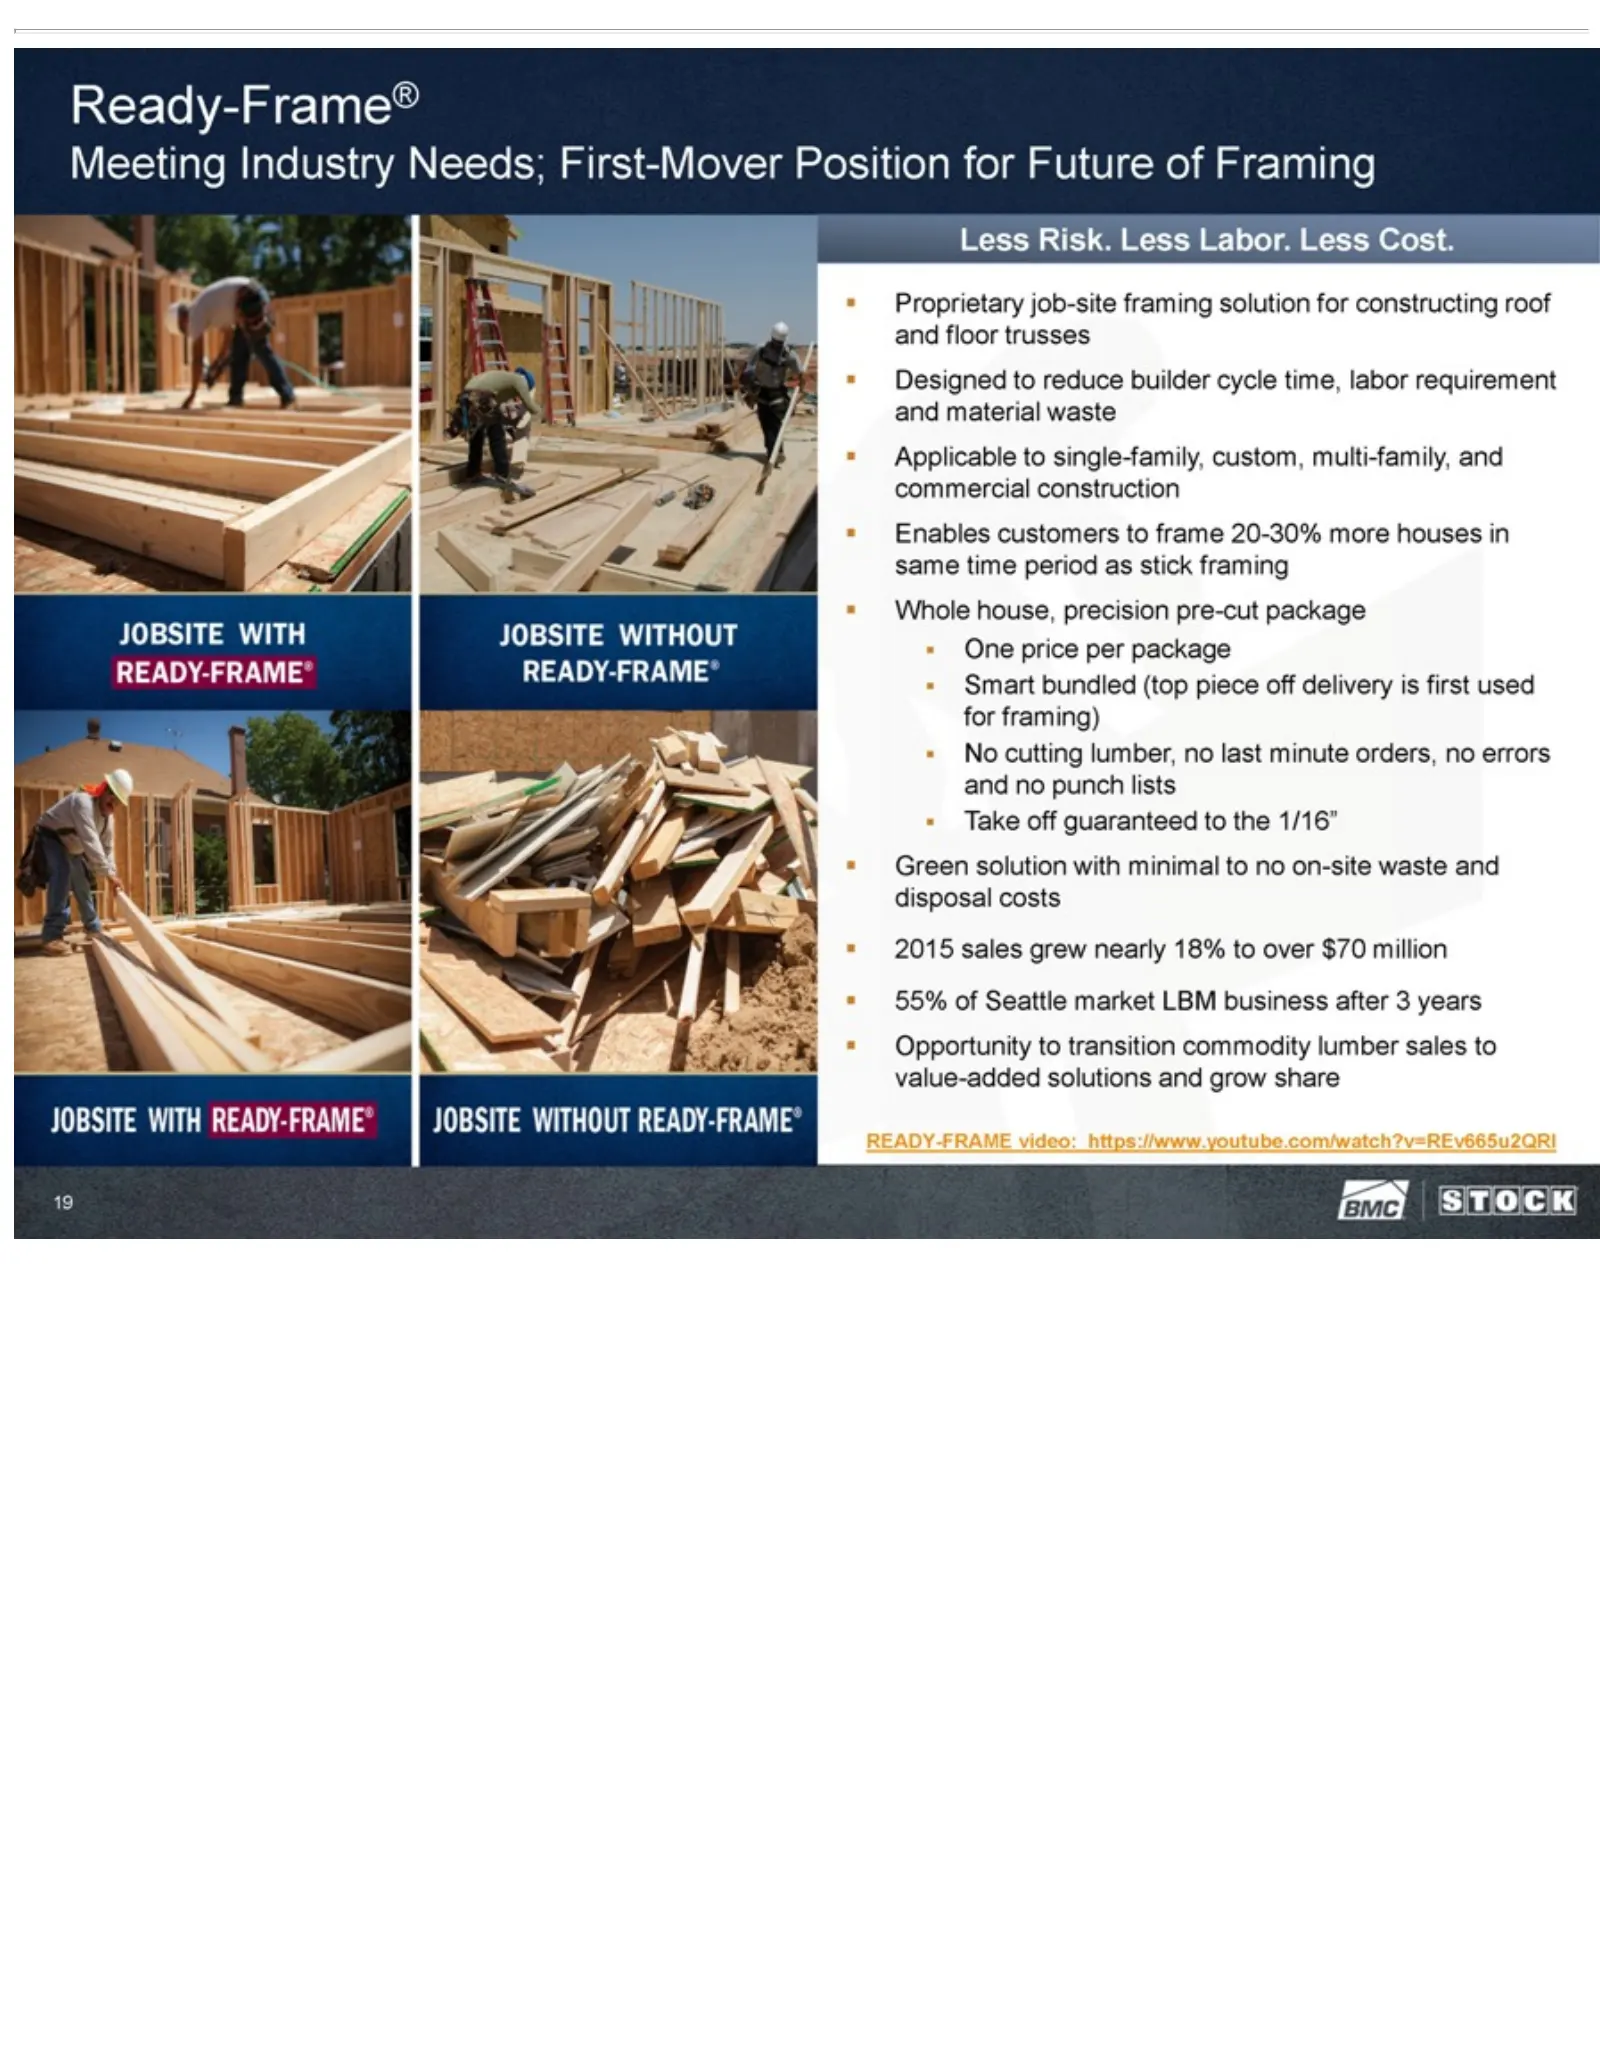
Slide 19: Ready-Frame® Framing Solution
Ready-Frame® builder framing guaranteed commodity cycle Whole to lumber time, the house, Meeting 1/16” labor sales precision Green requirement Industry to value-added solution pre-cut Needs; and with package solutions First-Mover material minimal One and waste to price Position grow no Applicable on
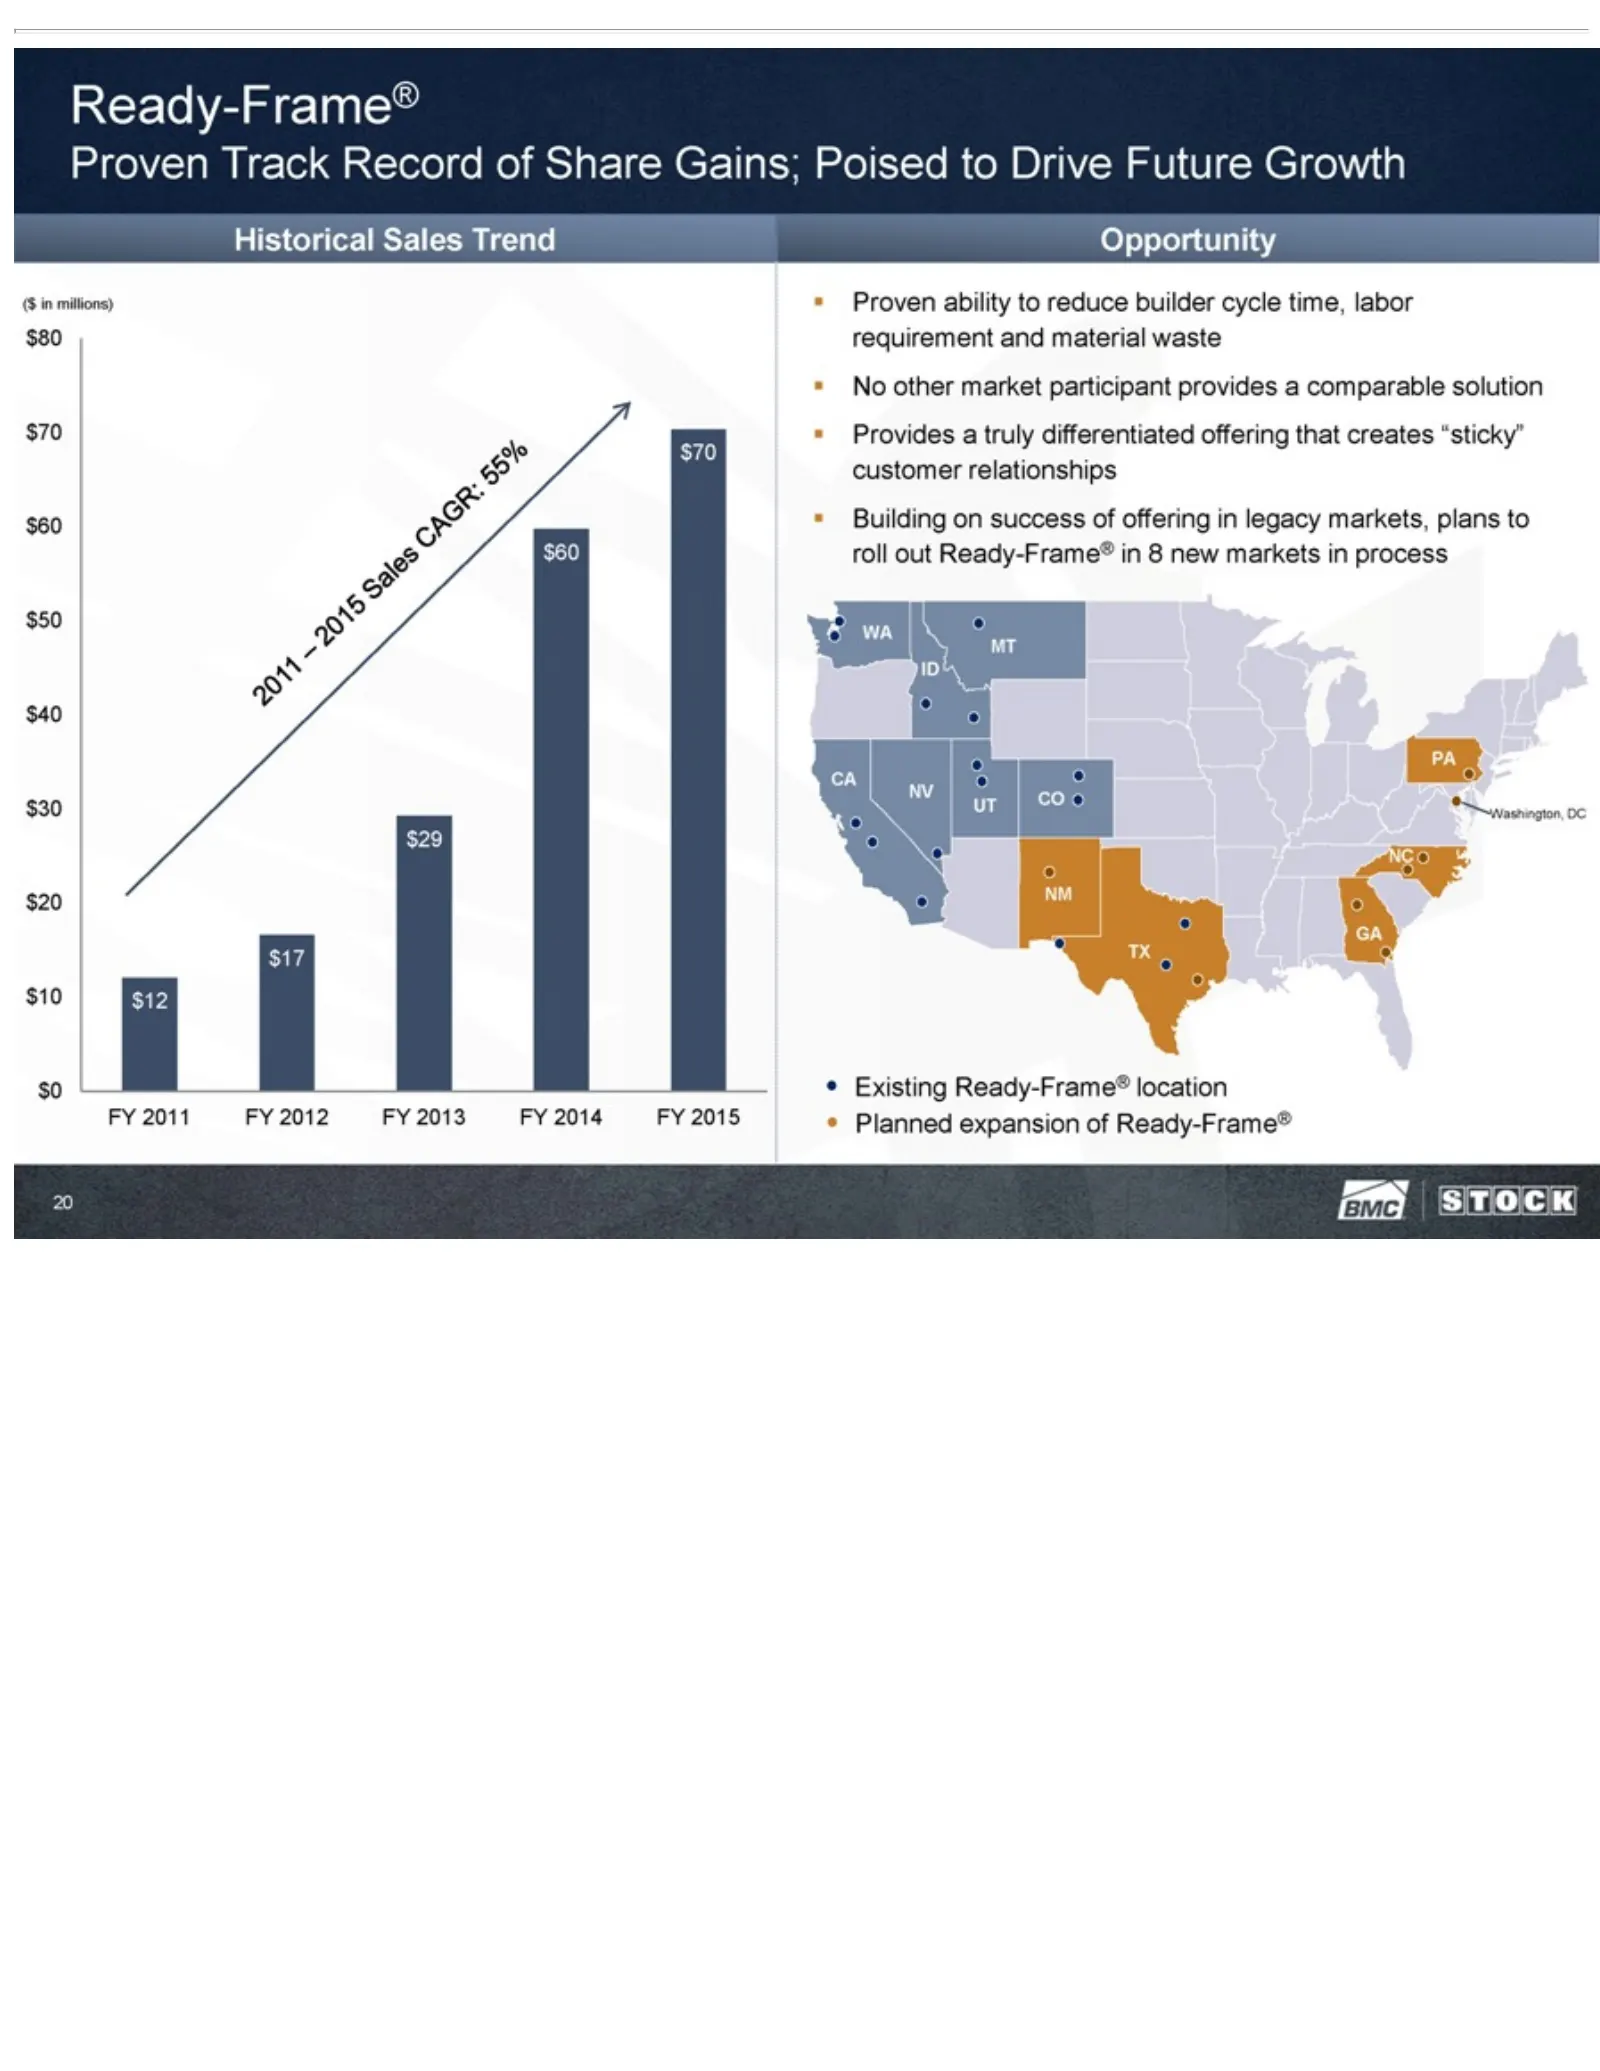
Slide 20: Ready-Frame® Opportunity and Sales Trend
FY 2015 customer “sticky” Ready-Frame® Opportunity Proven location relationships Proven Track Planned ability Record Building expansion toofreduce Share on of success builder Ready-Frame® Gains;ofPoised cycle offering time, to20 in Drive labor legacy Future requirement markets, Growth plans and Hist
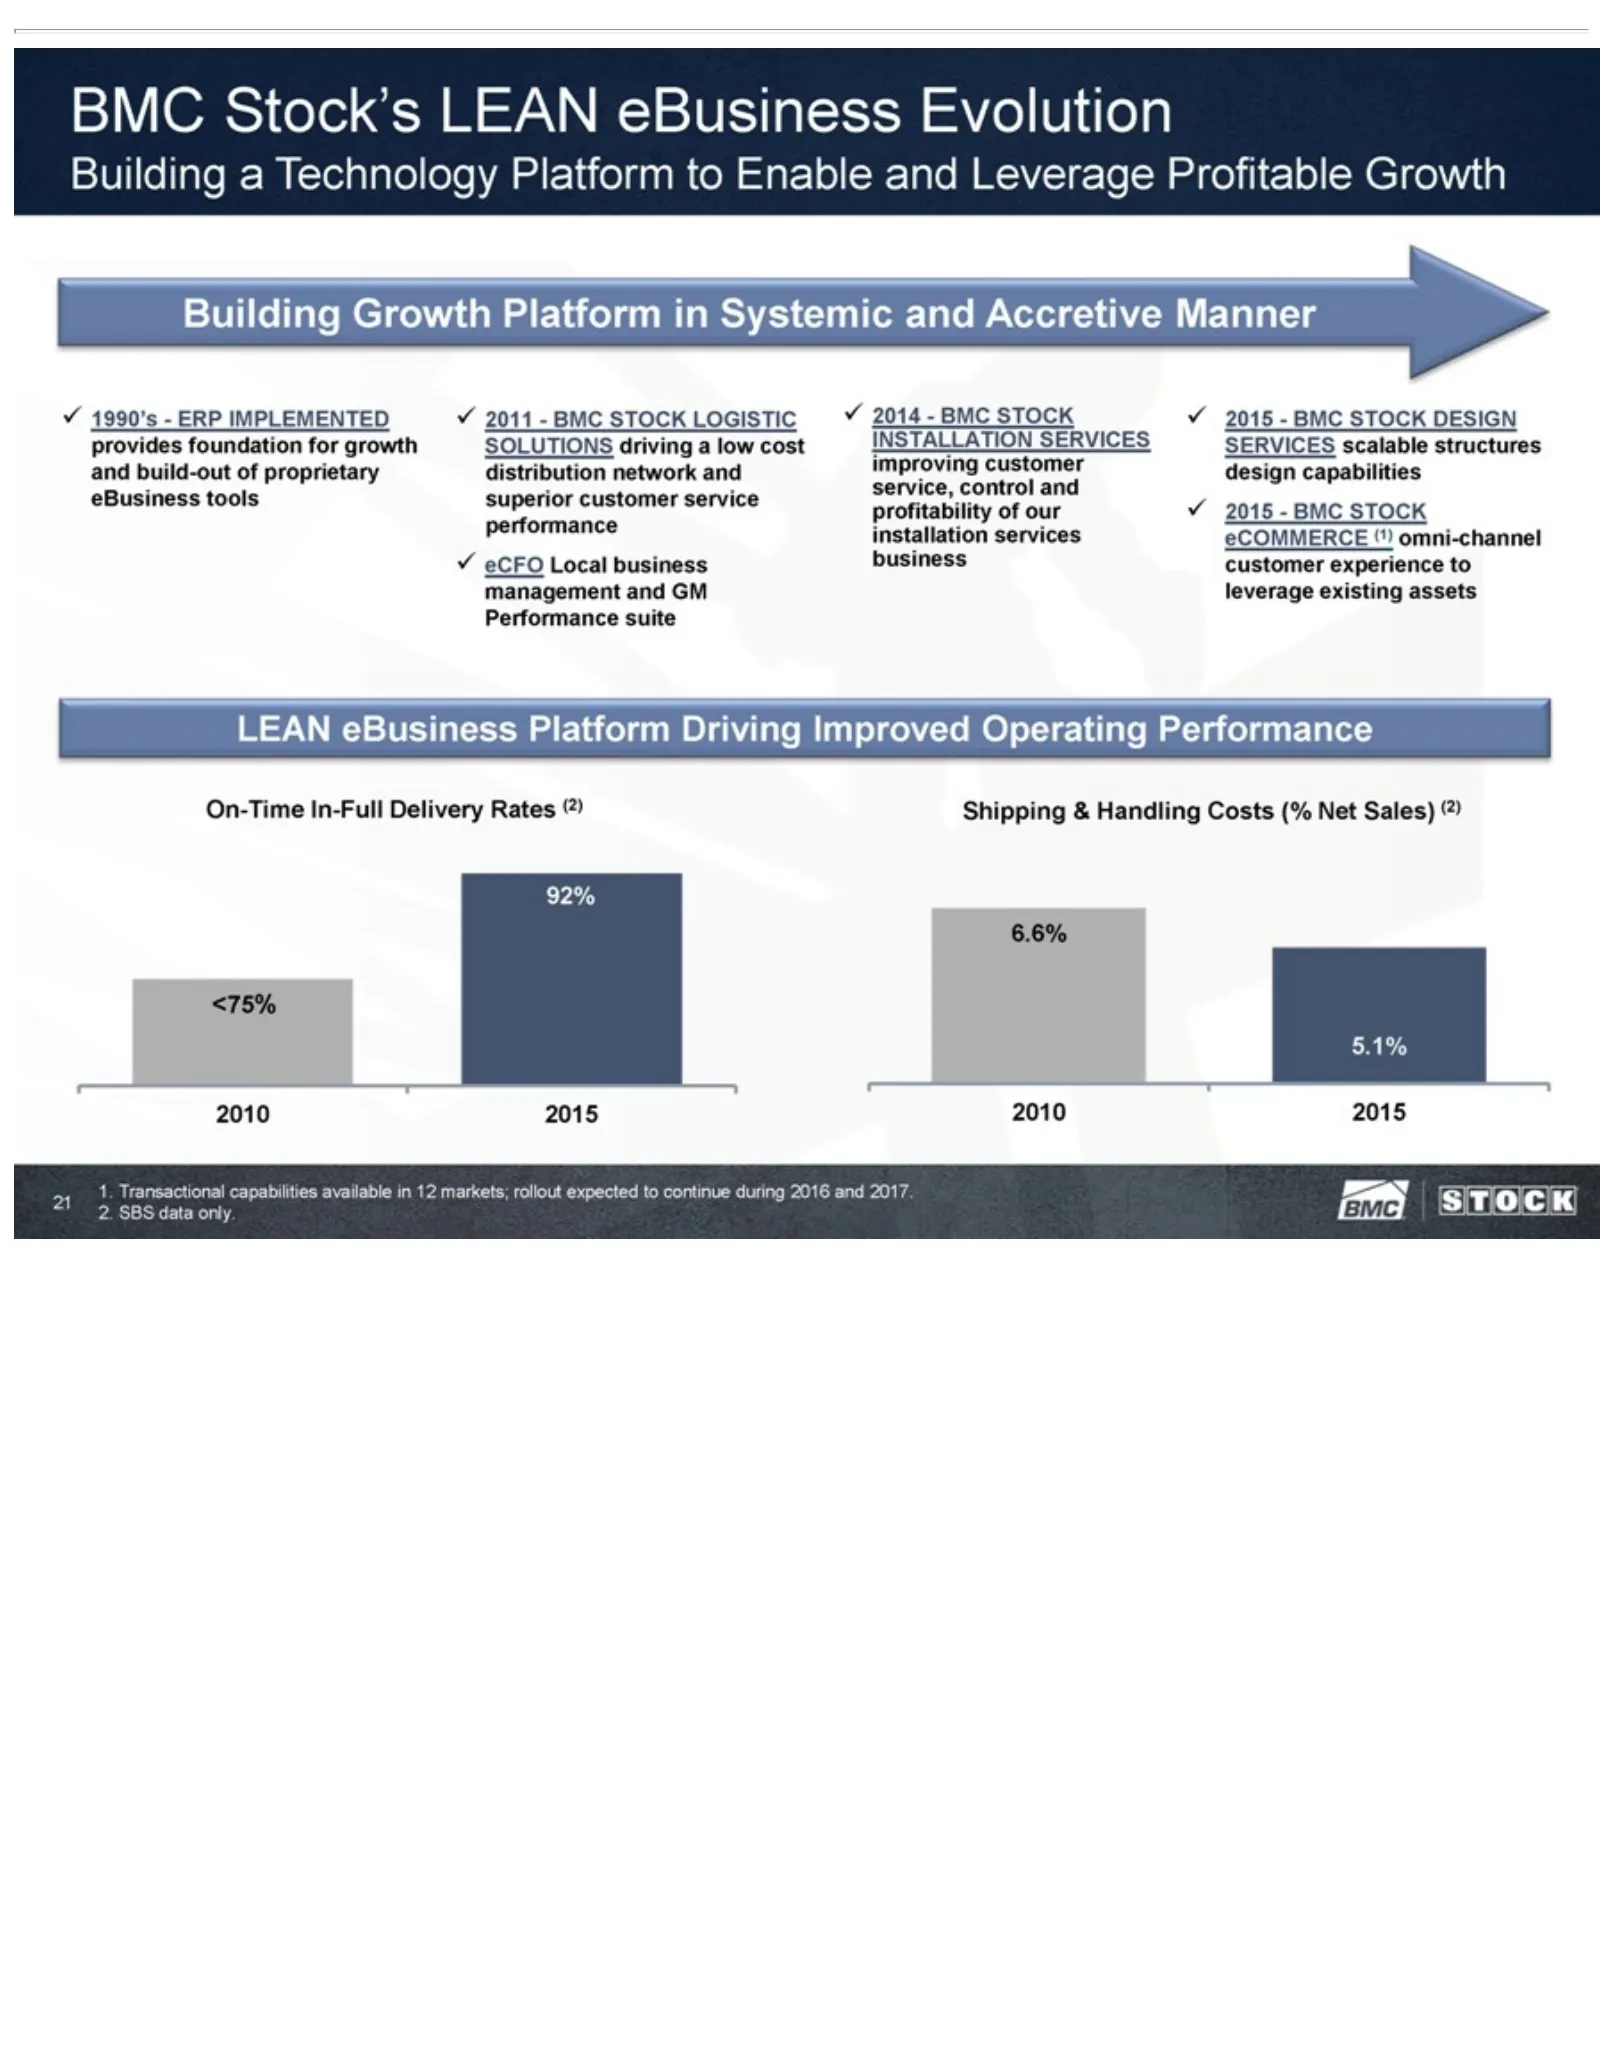
Slide 21: eBusiness and Technology Platform
BMC Stock’s provides Local DESIGN Performance continue business during foundation SERVICES On-Time LEAN management 2016for eBusiness and scalable In-Full growth 2017. and Delivery structures and Evolution 2. GMSBS build-out Performance Rates data design Building only. of (2)capabilities proprietary
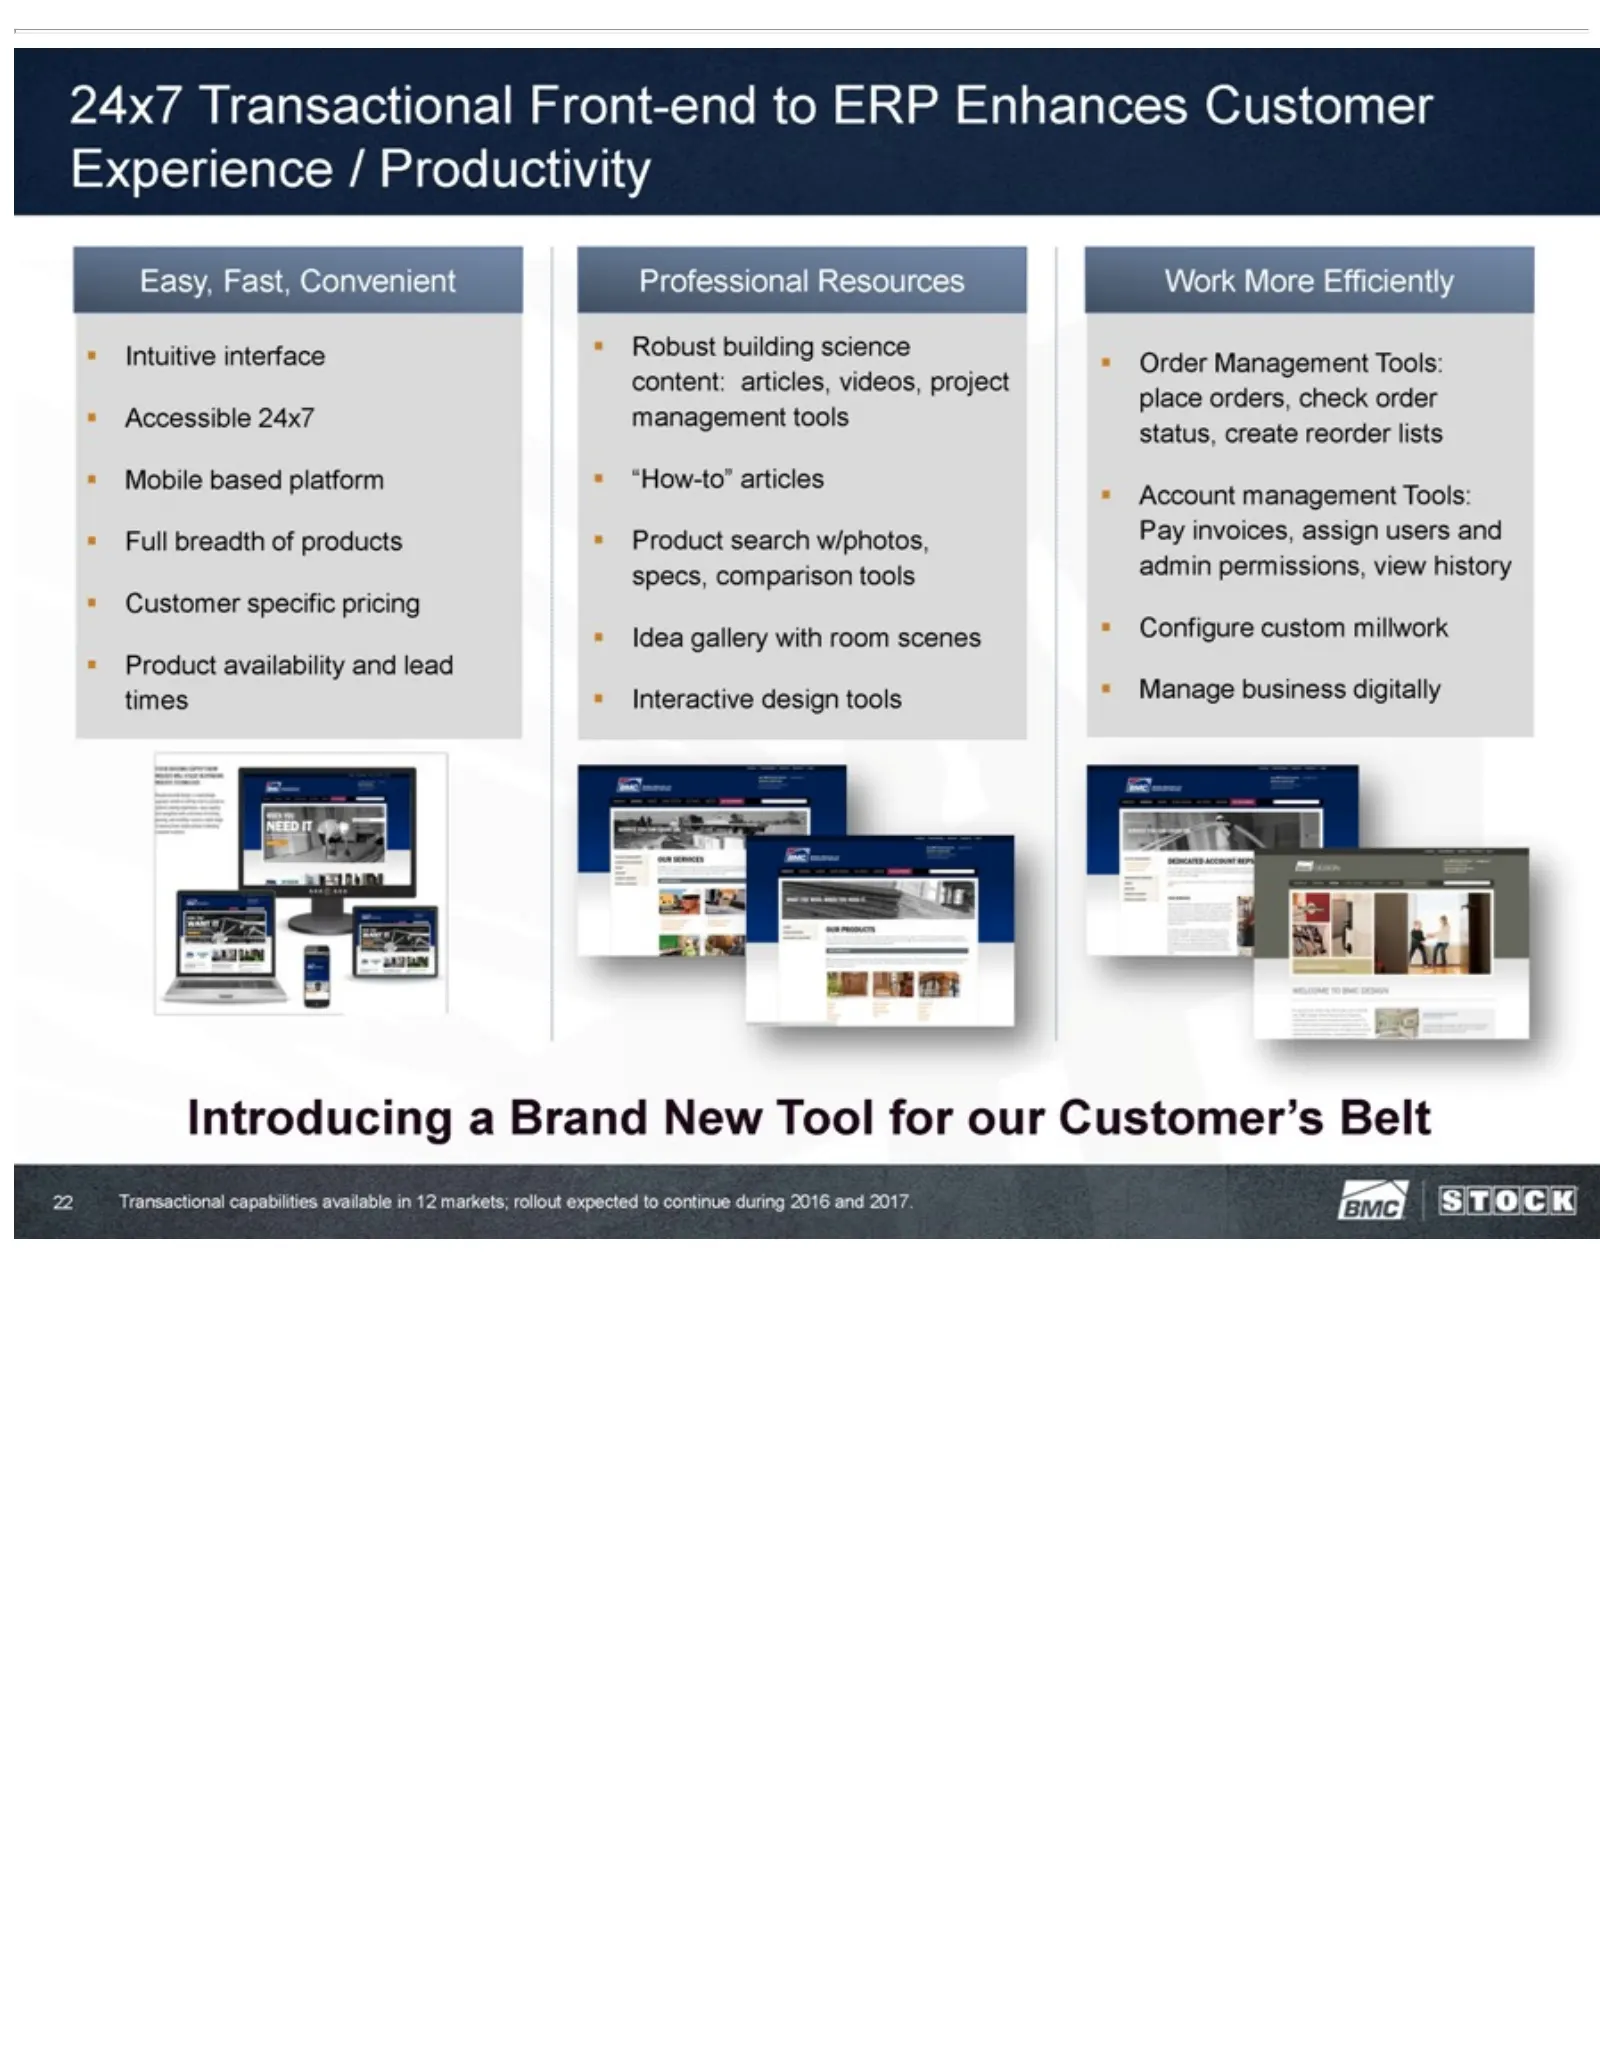
Slide 22: eBusiness Transactional Tools
24x7 pricing Idea and to continue admin gallery Transactional • Product permissions, during with room availability 2016 Front-end scenes view and 2017. and history to • Interactive ERP lead 22•Enhances times Configure design Professional Customer custom tools Work millwork Resources Experience More•
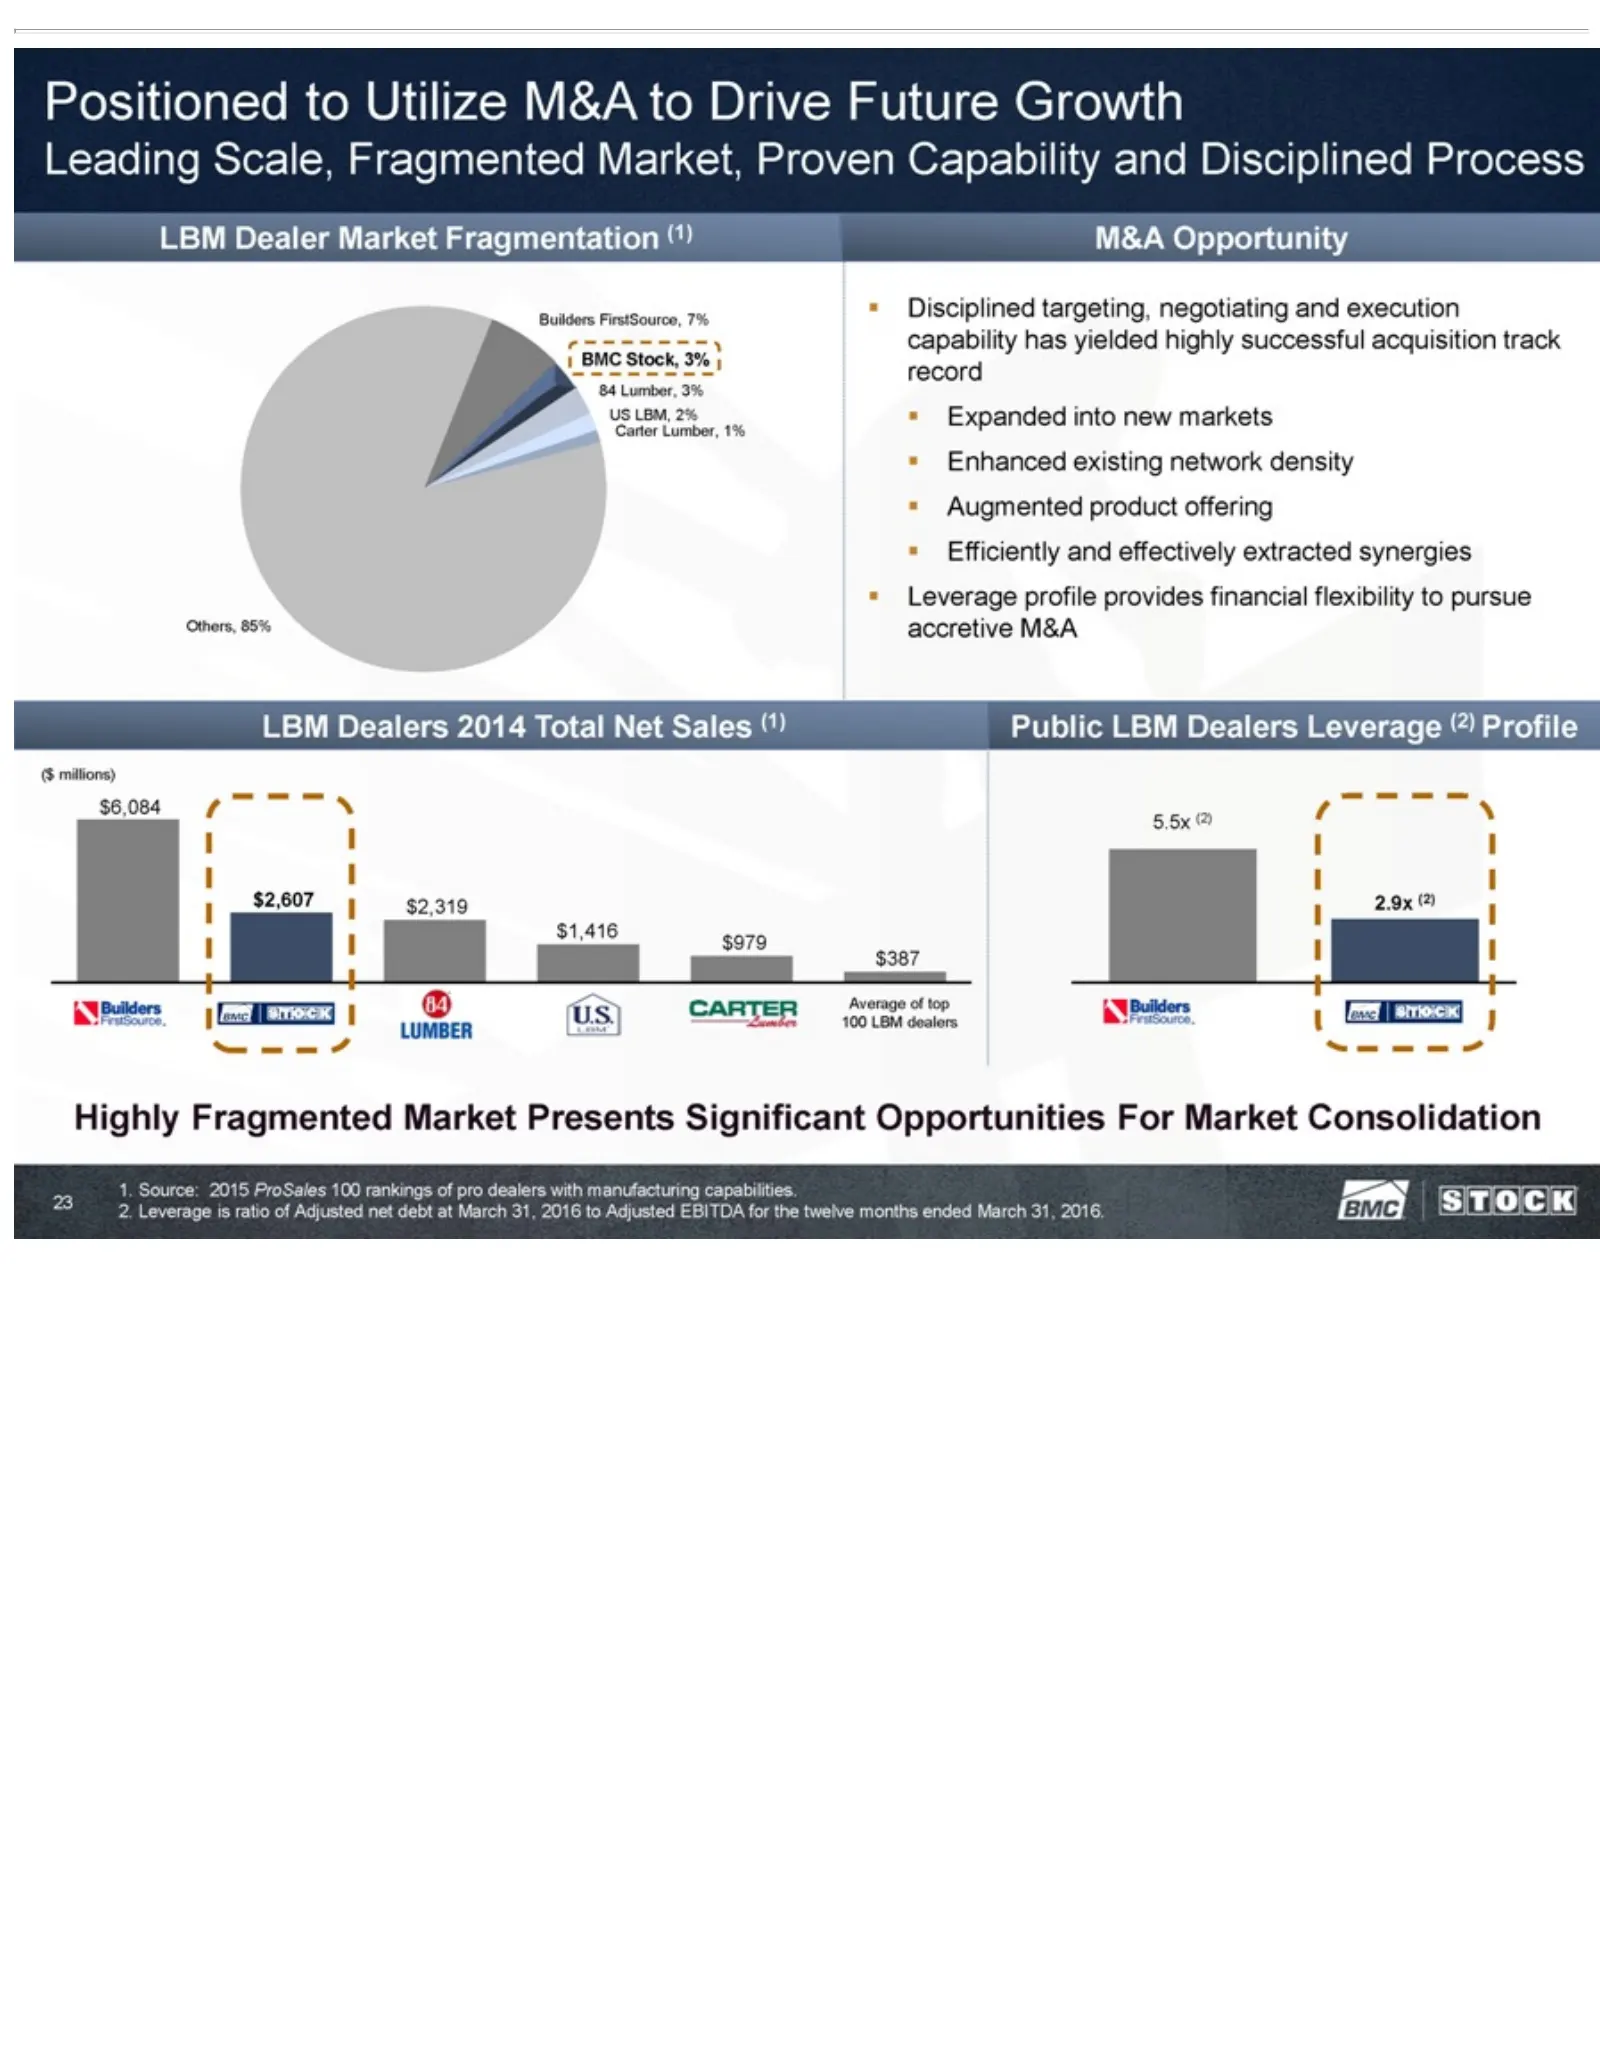
Slide 23: Positioned for Disciplined M&A in Fragmented Markets
Positioned Lumber, markets Total Opportunities twelveNet months •3% Sales Enhanced toUS Utilize For ended (1) Carter Market ($existing M&A March millions) LBM, Consolidation to31, network Drive Lumber, $6,084 2016. Future density 23 $2,607 2%1. 1% Source: Growth • $2,319 Augmented Others, 2015 Leadi
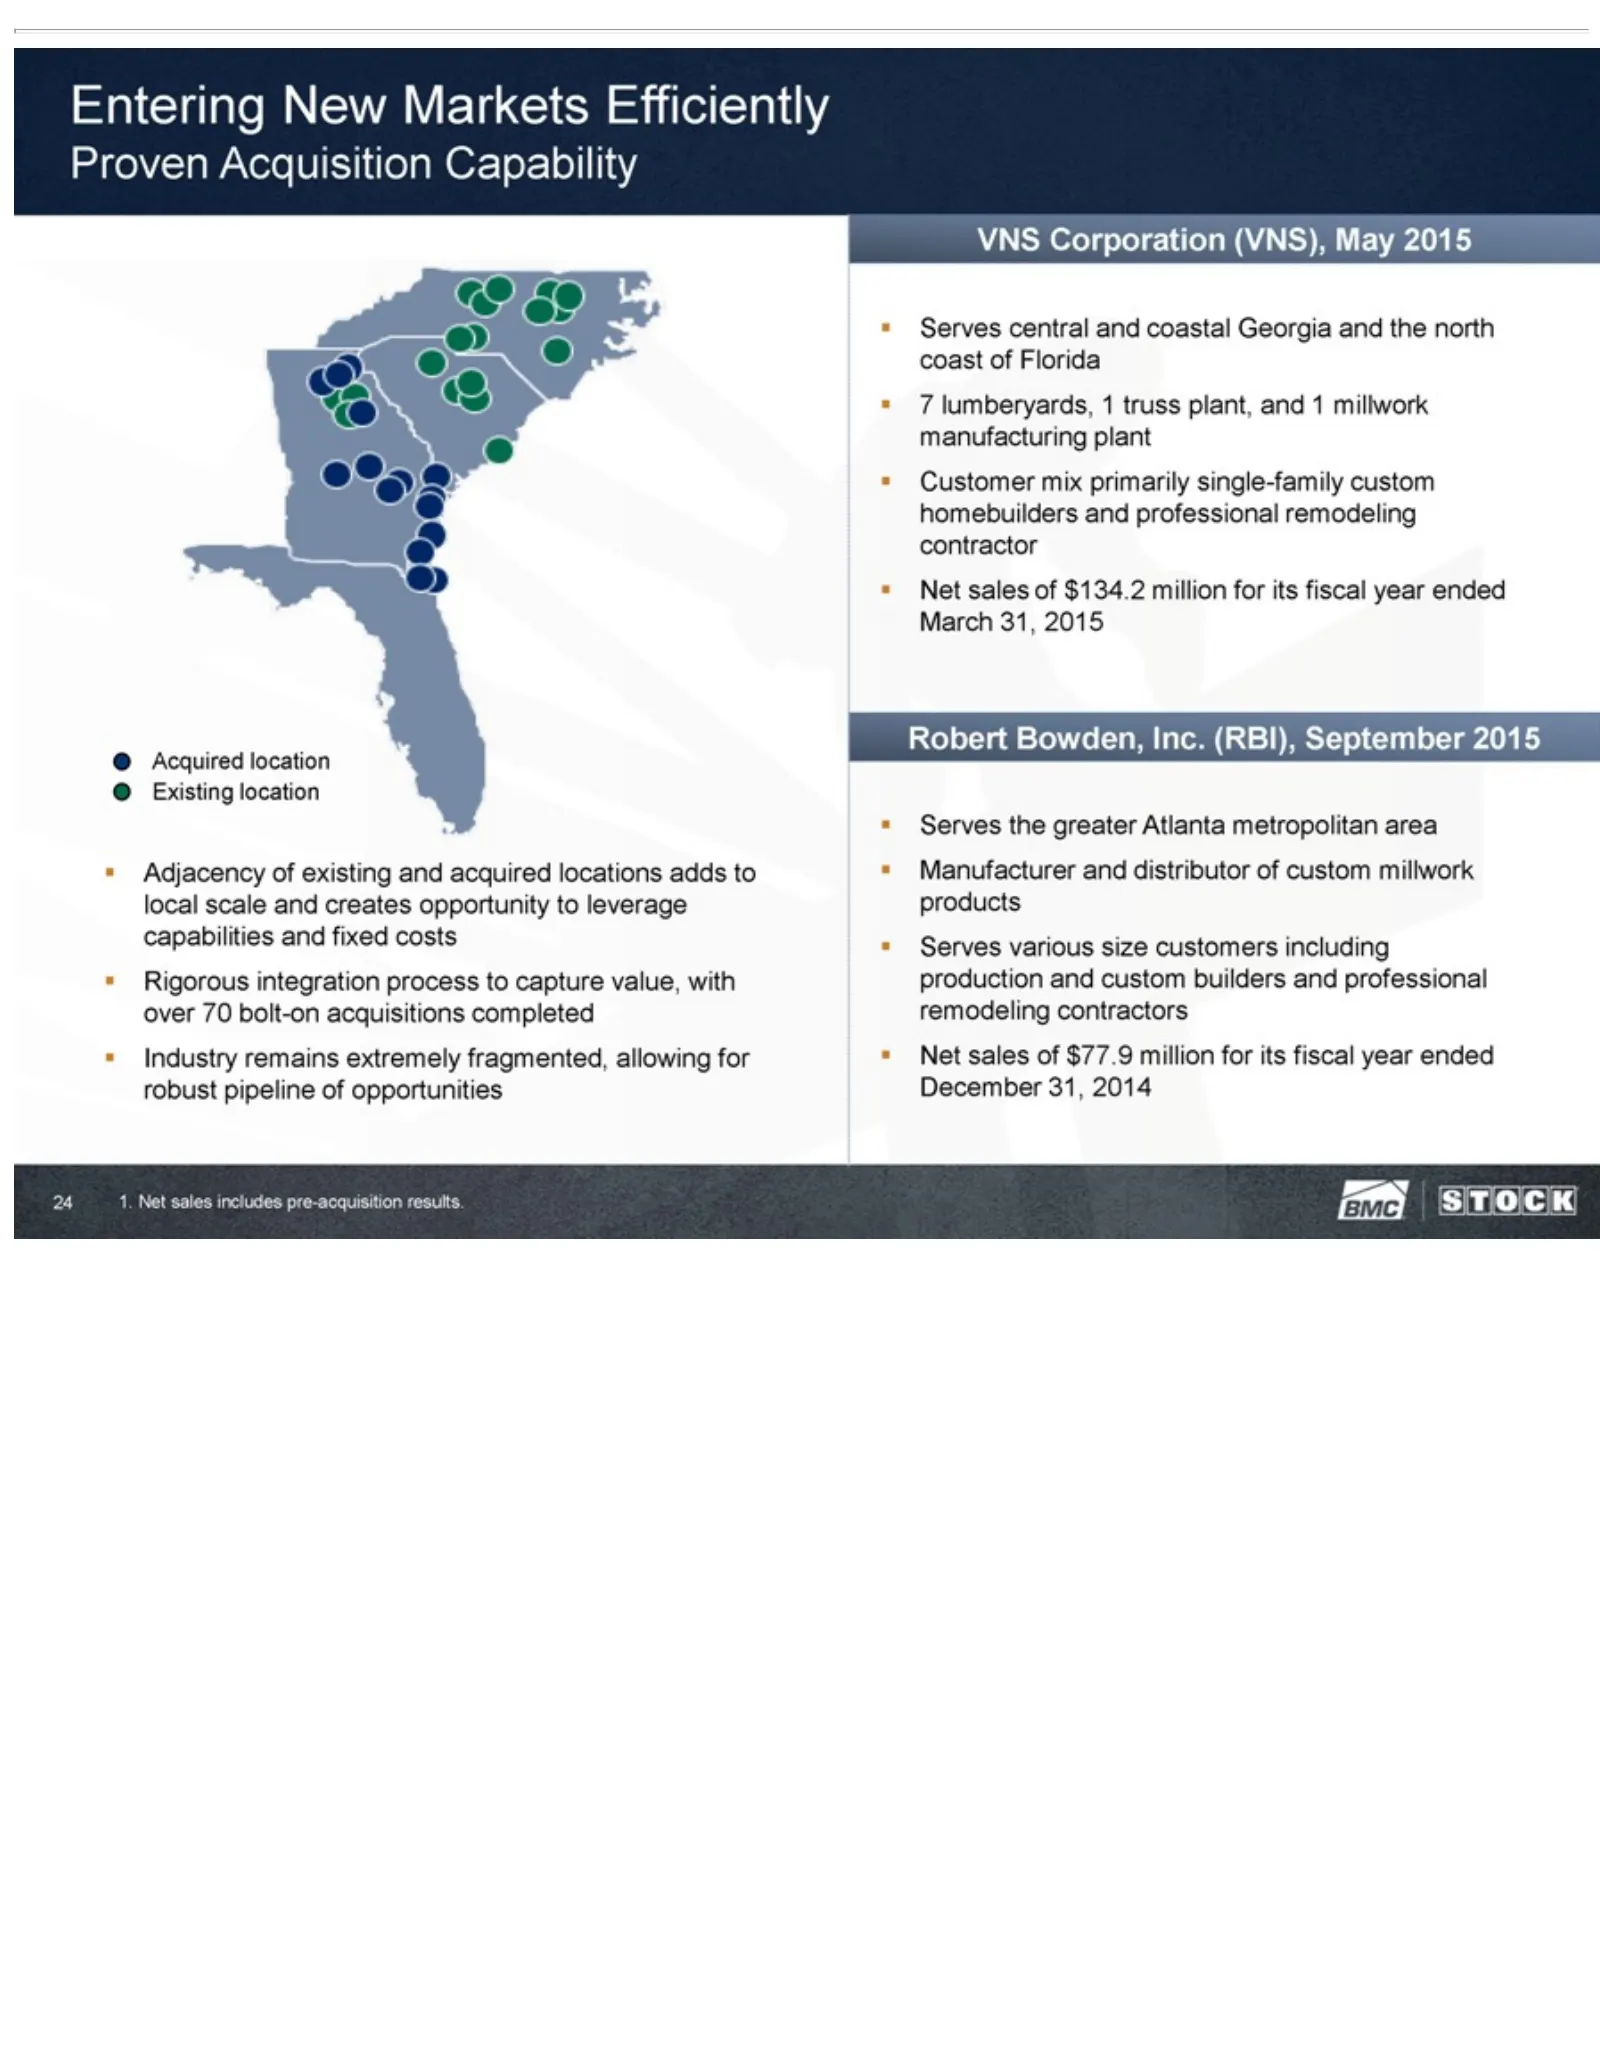
Slide 24: Entering New Markets: Proven Acquisition Capability
Entering fixed May professional distributor December 2015 costs New •31, of •Serves remodeling Rigorous custom Markets 2014central 1.millwork integration Net Efficiently contractor sales and coastal products includes process Proven • Net Georgia •sales pre-acquisition Serves Acquisition to capture o
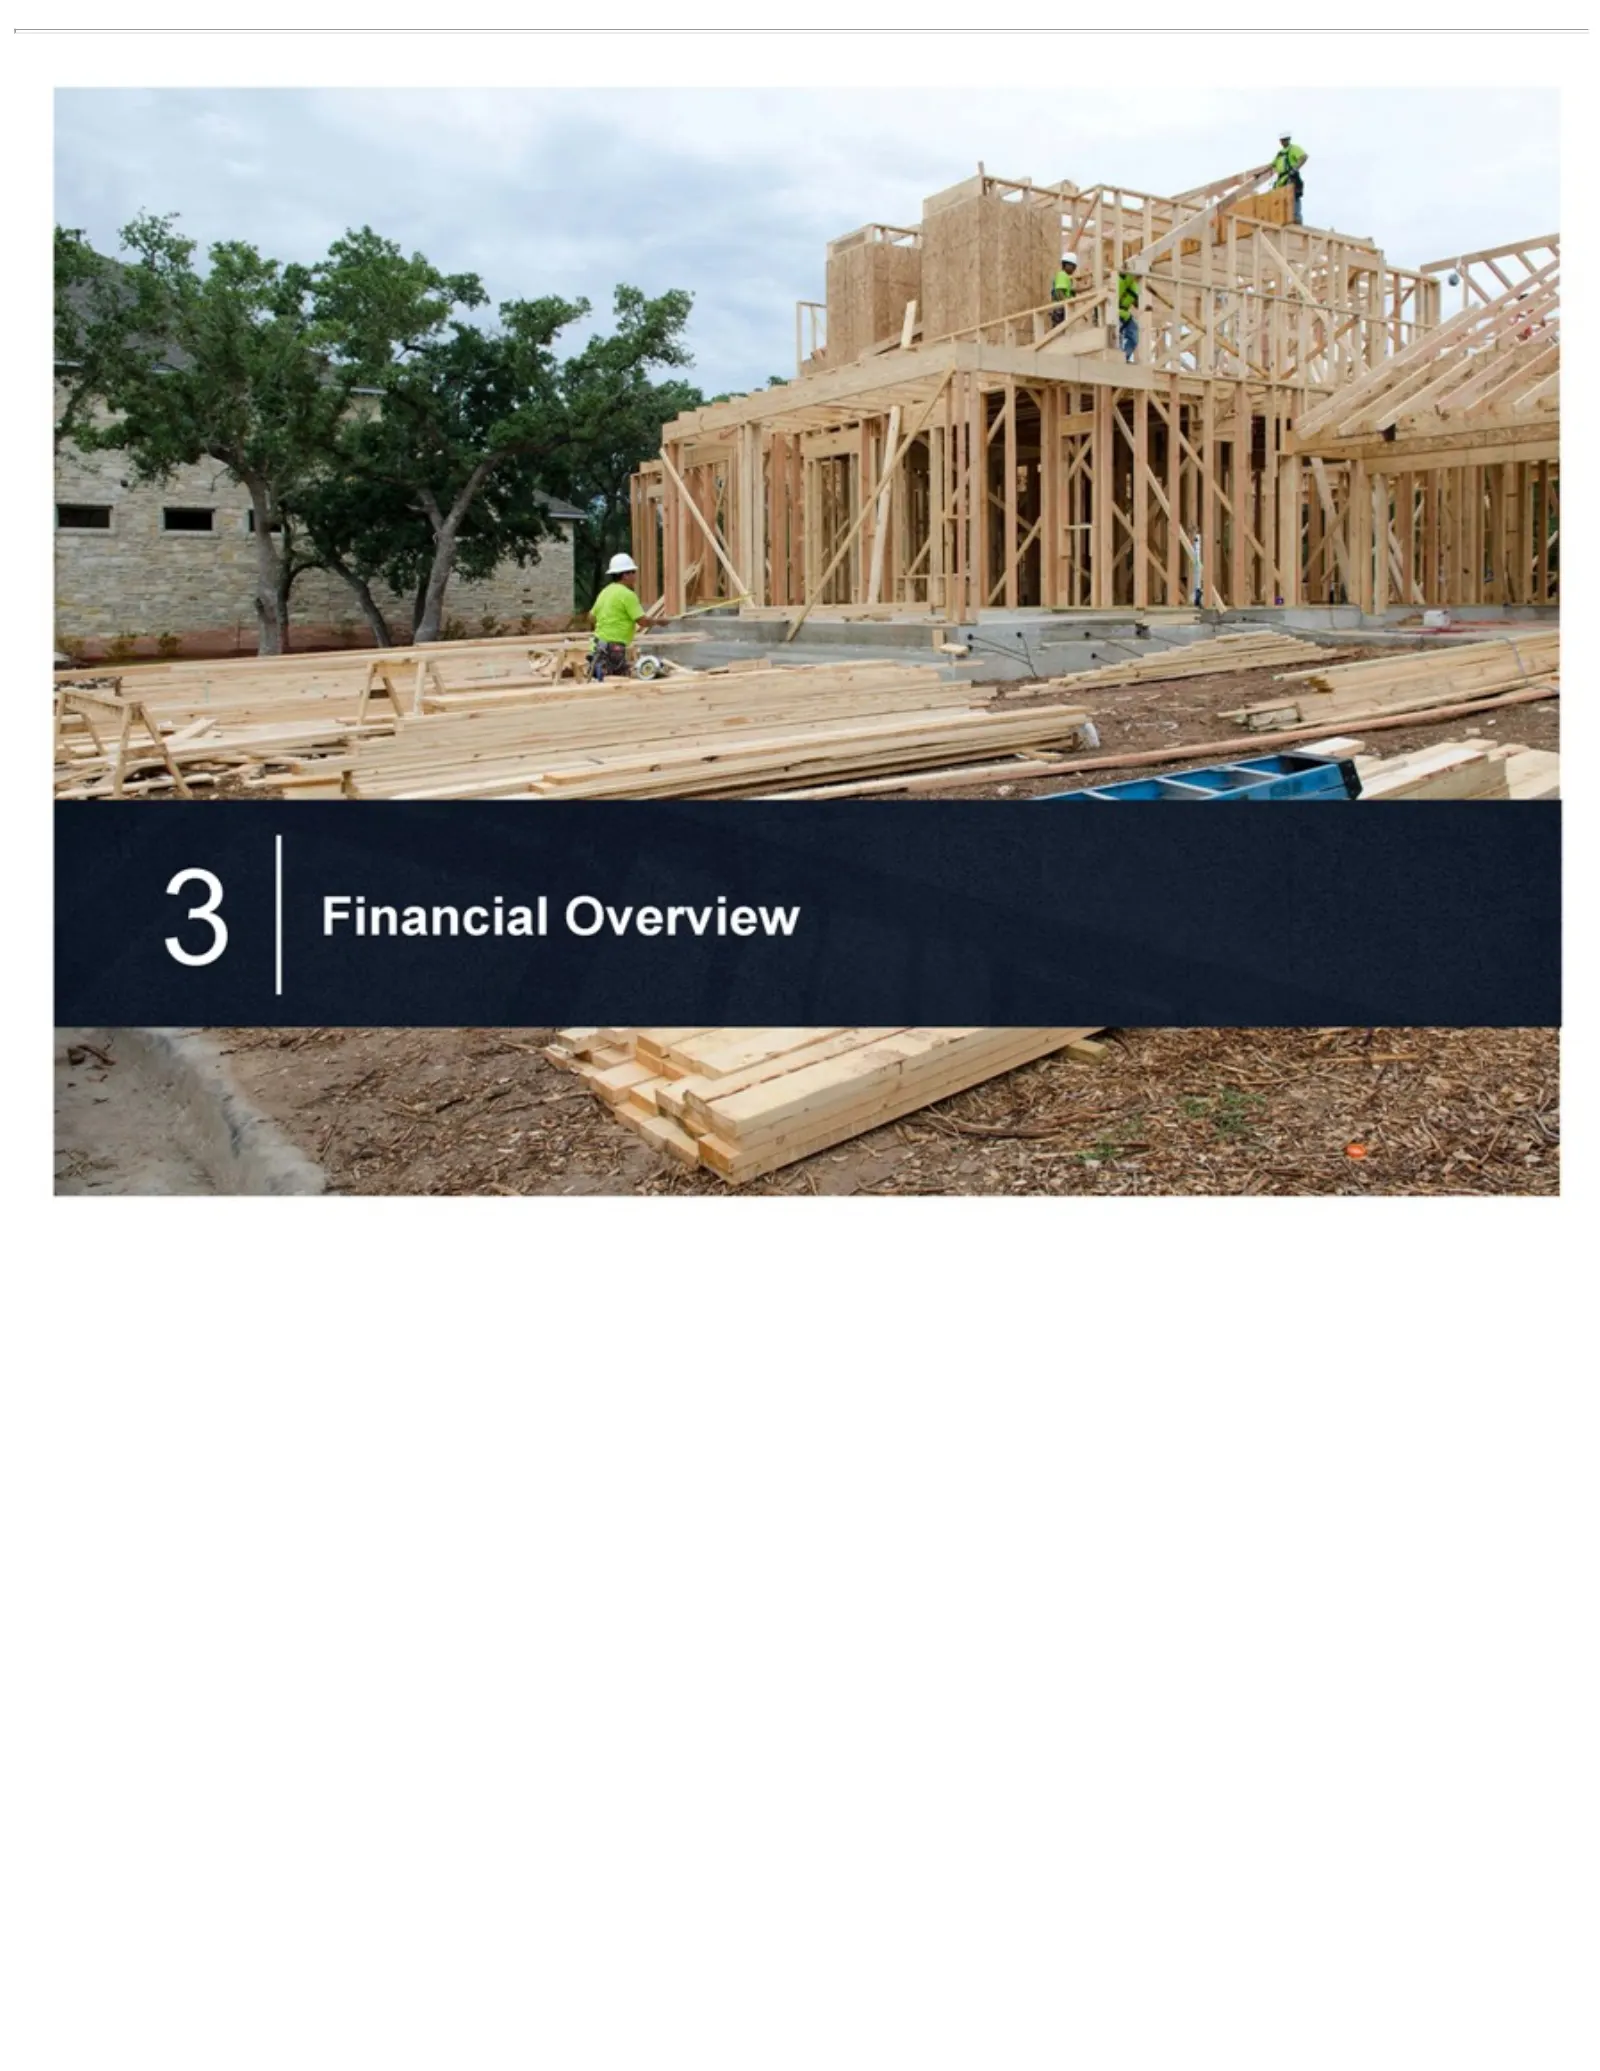
Slide 25: Financial Overview
3 Financial Overview
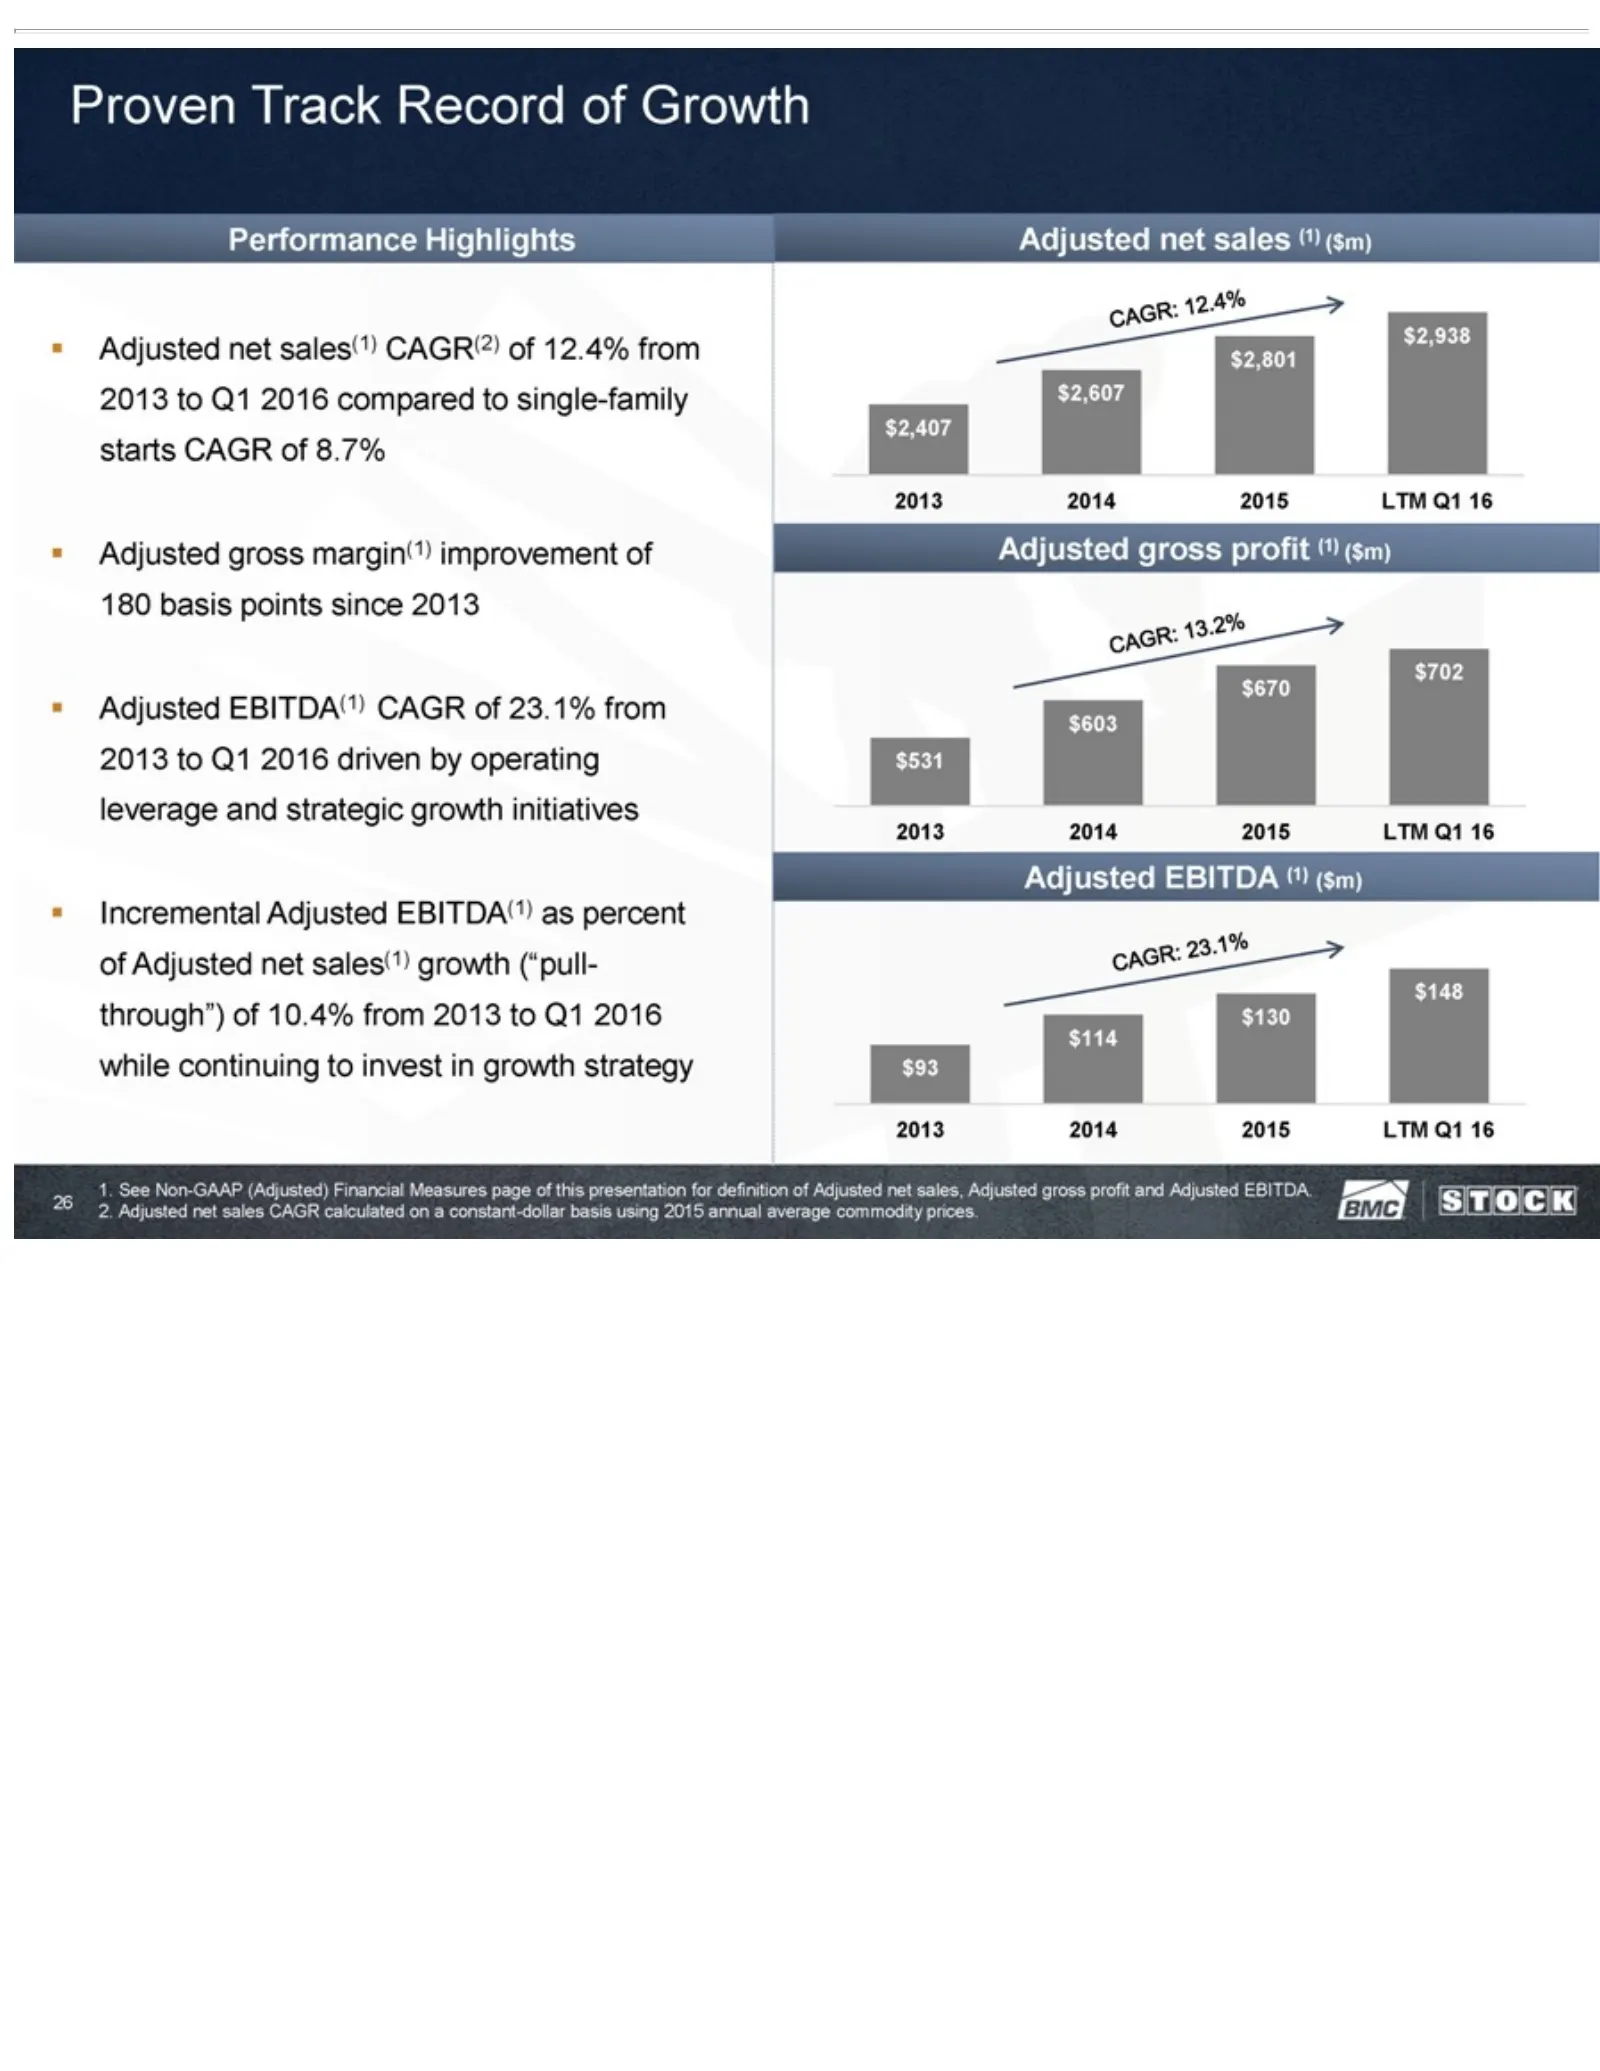
Slide 26: Proven Track Record of Growth
Proven of sales(1) (1) definition 180 ($m)basis Track growth $702 of points Adjusted Record $670 (“pull- since $603 of net through”) Growth 2013 $531 sales,•2013 Adjusted Performance of 10.4% 2014EBITDA(1) gross 2015 from Highlights profit LTM 2013and Q1 CAGR to Q1 •16 Adjusted Adjusted Adjusted 201
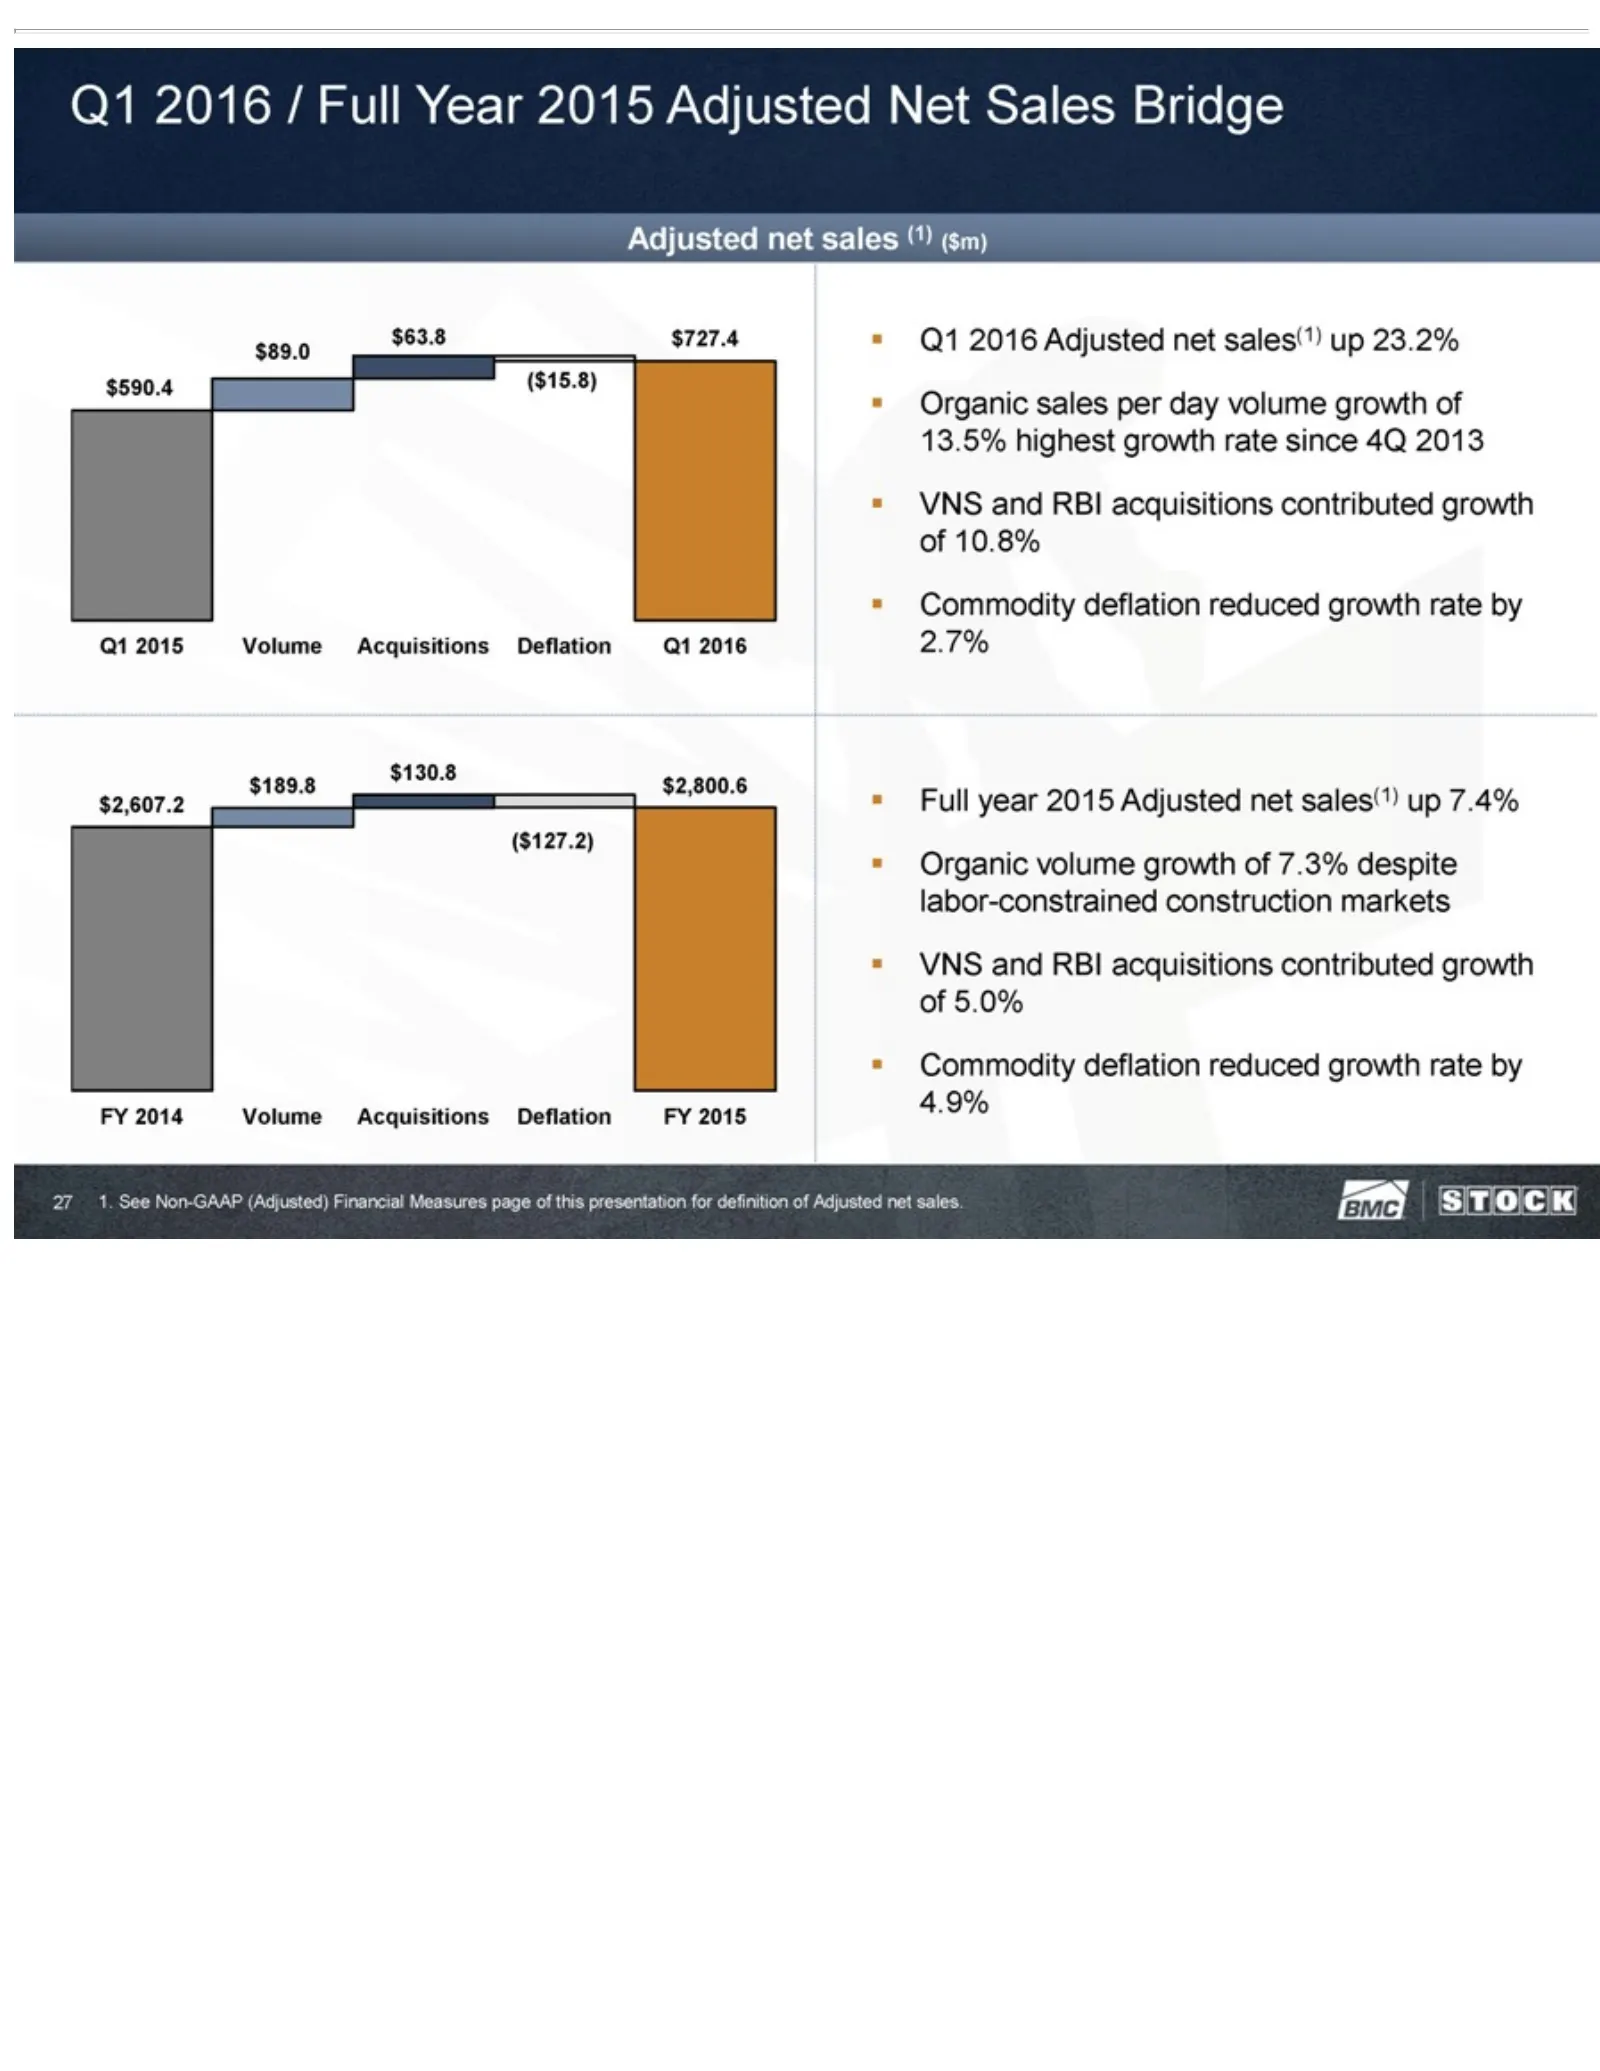
Slide 27: Net Sales Bridge
Q1 2016 sales ($127.2) contributed per FY day / Full growth 2014 volume Year Volume of 2015 growth 5.0% Adjusted Acquisitions • of Commodity 13.5% Nethighest Sales Deflation deflation Bridge growth FYreduced Adjusted 2015 rate since • growth Full net4Q year sales rate 2013 2015 (1) by• ($m) 4.9% VNS
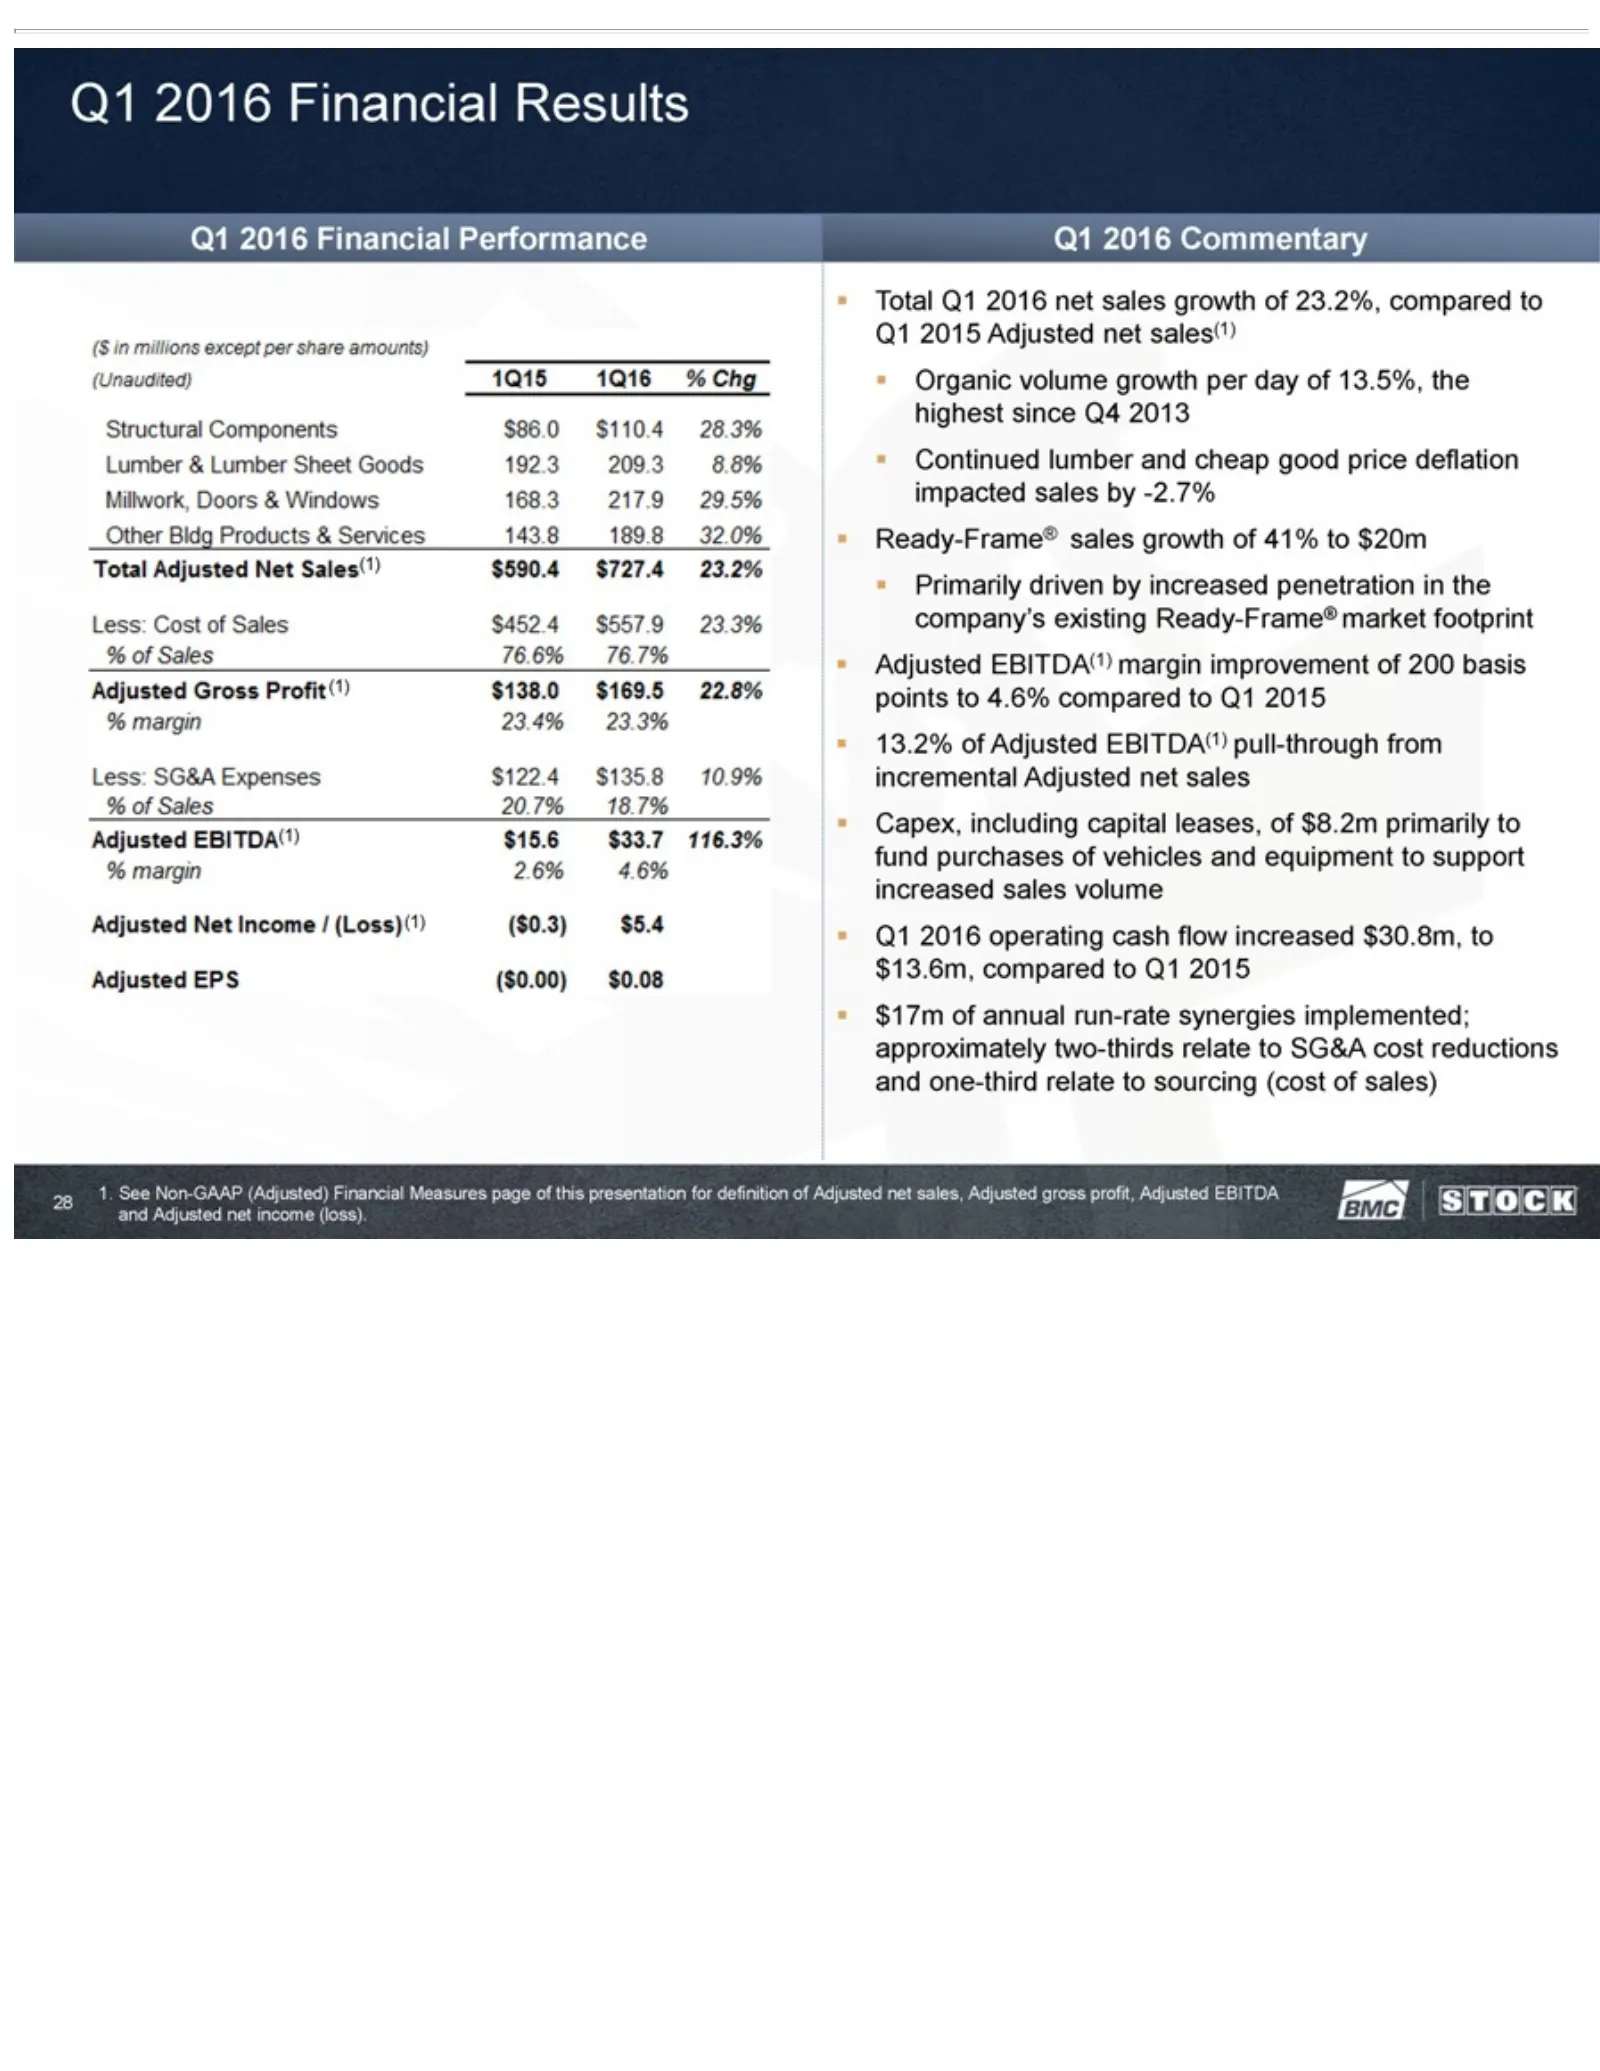
Slide 28: Q1 2016 Financial Performance
Q1 2016 209.3 76.6% 4.6% day company’s Adjusted compared Measures ofAdjusted 8.8% 13.5%, 76.7% Financial net page toexisting Millwork. Q1 sales Adjusted the Net of2015 this highest •Results Income Ready-Frame® Capex, •presentation Doors Gross $17m since Q1 /including (Loss) & Profit(1) of 2016 Q4 Wi
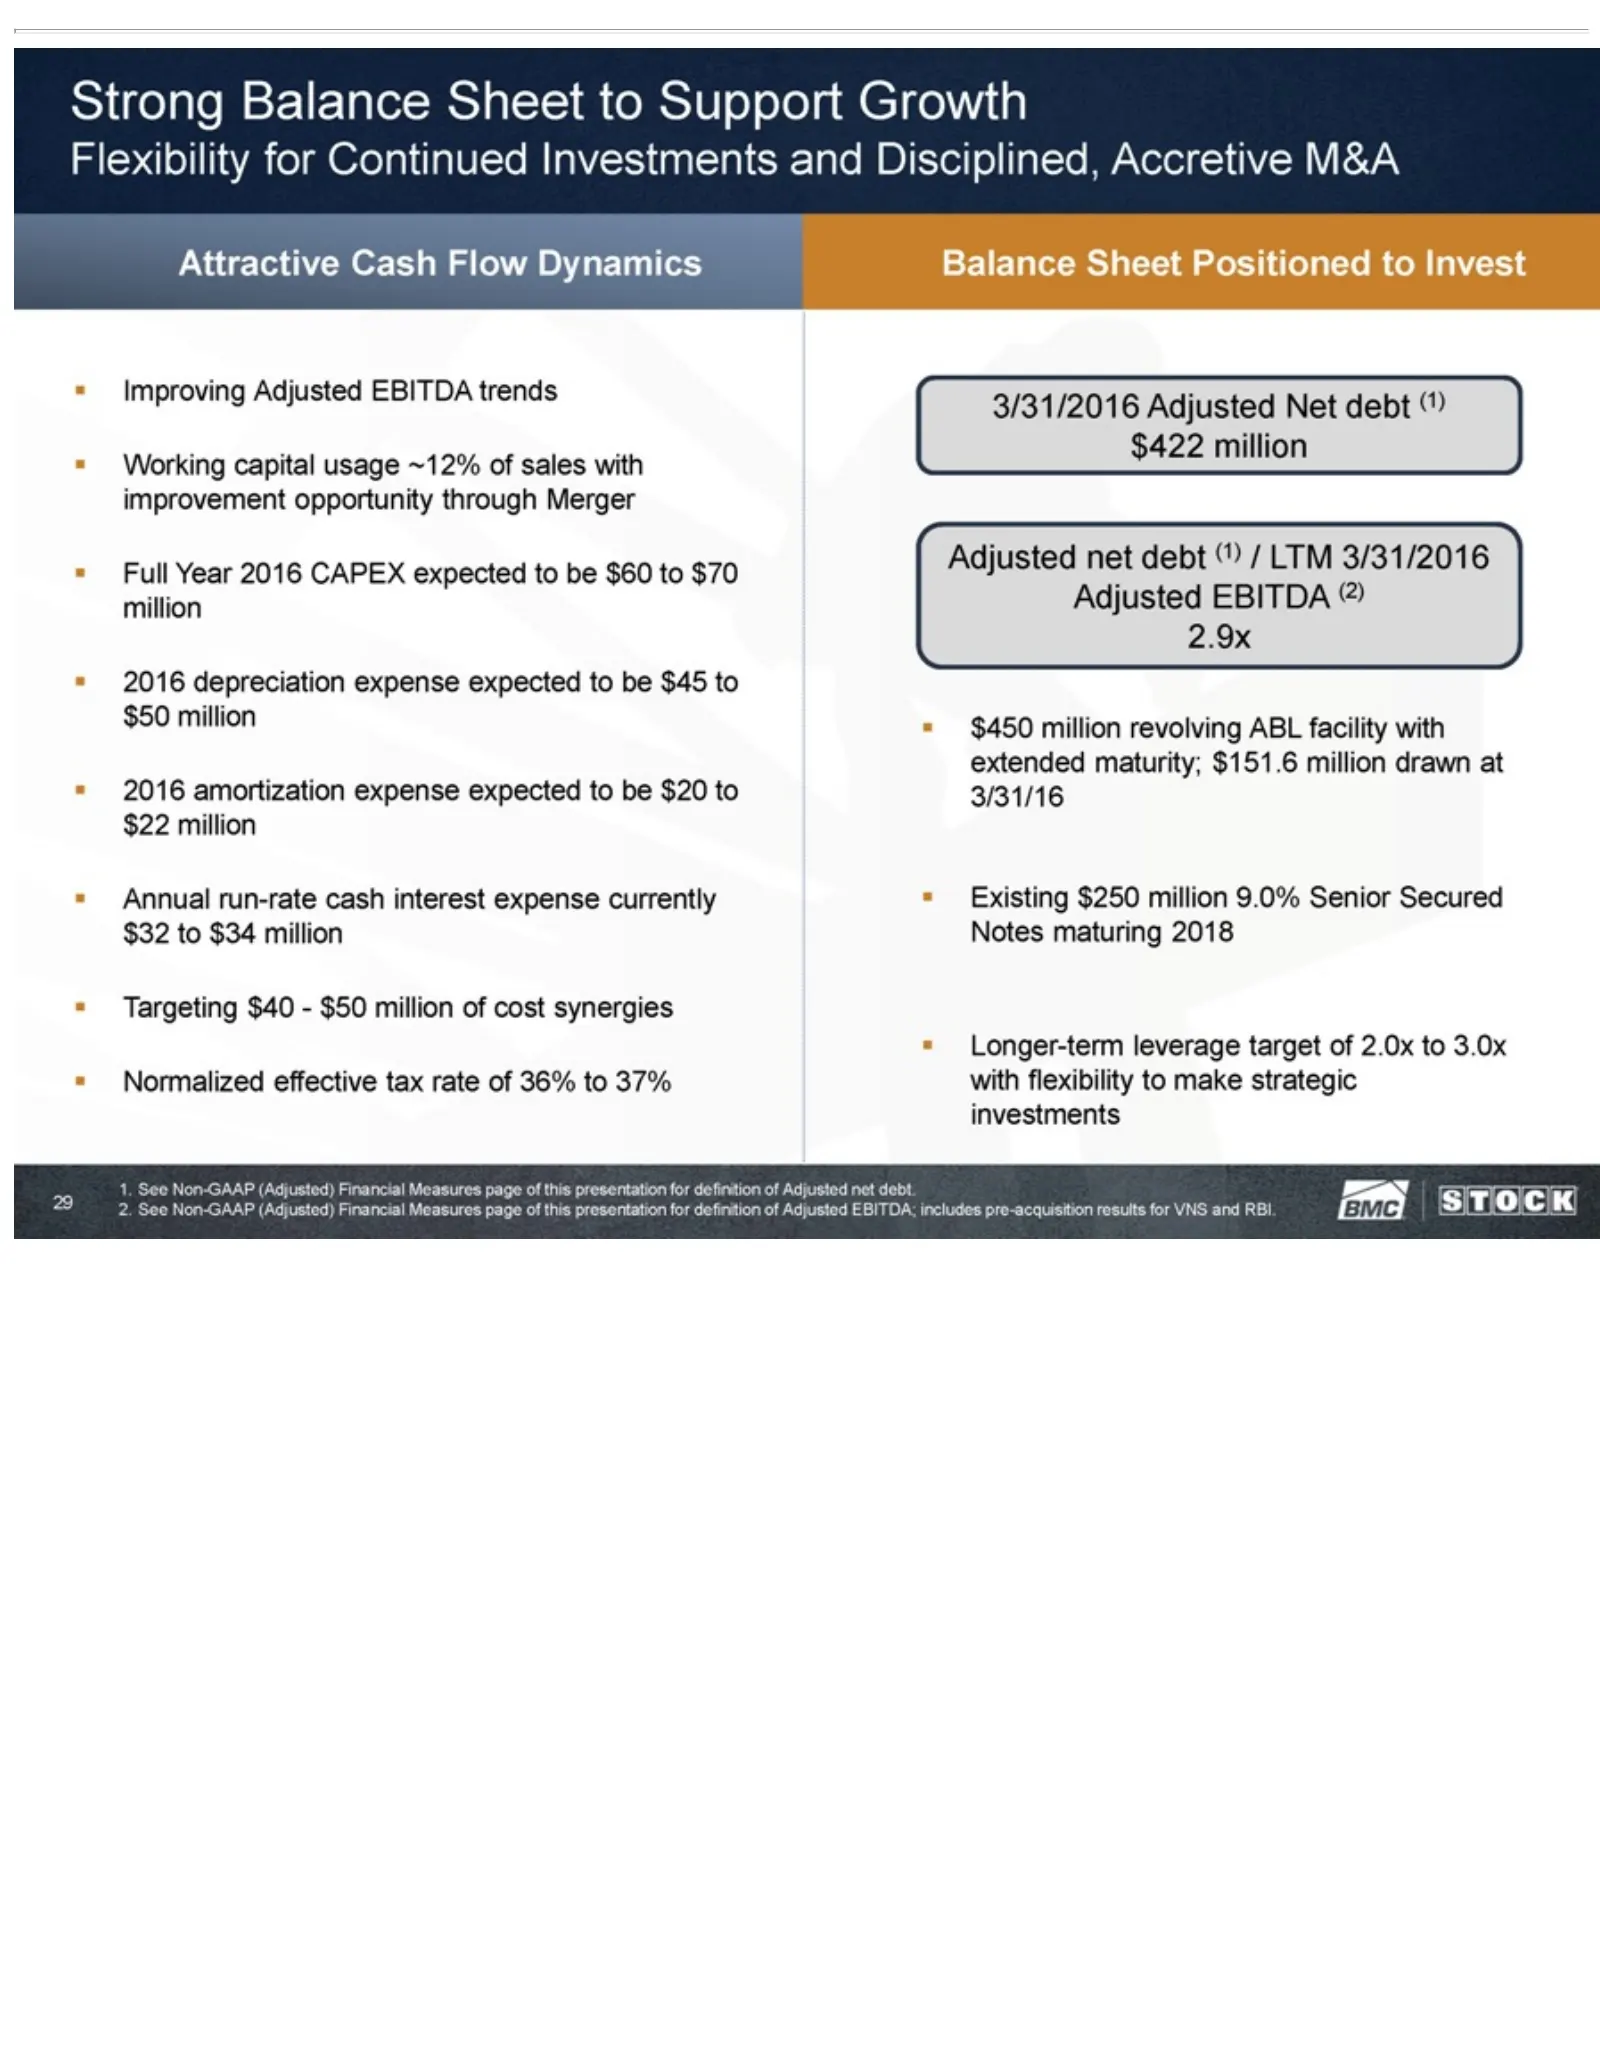
Slide 29: Balance Sheet and Cash Flow Flexibility
Strong sales $20 3/31/2016 $250 presentation towith million $22 Balance improvement Adjusted million for 9.0% Sheet definition •Senior Net Annual to opportunity debt Support Secured ofrun-rate Adjusted (1) $422 Growth Notes through cash million netFlexibility maturing interest debt. Merger Adjusted
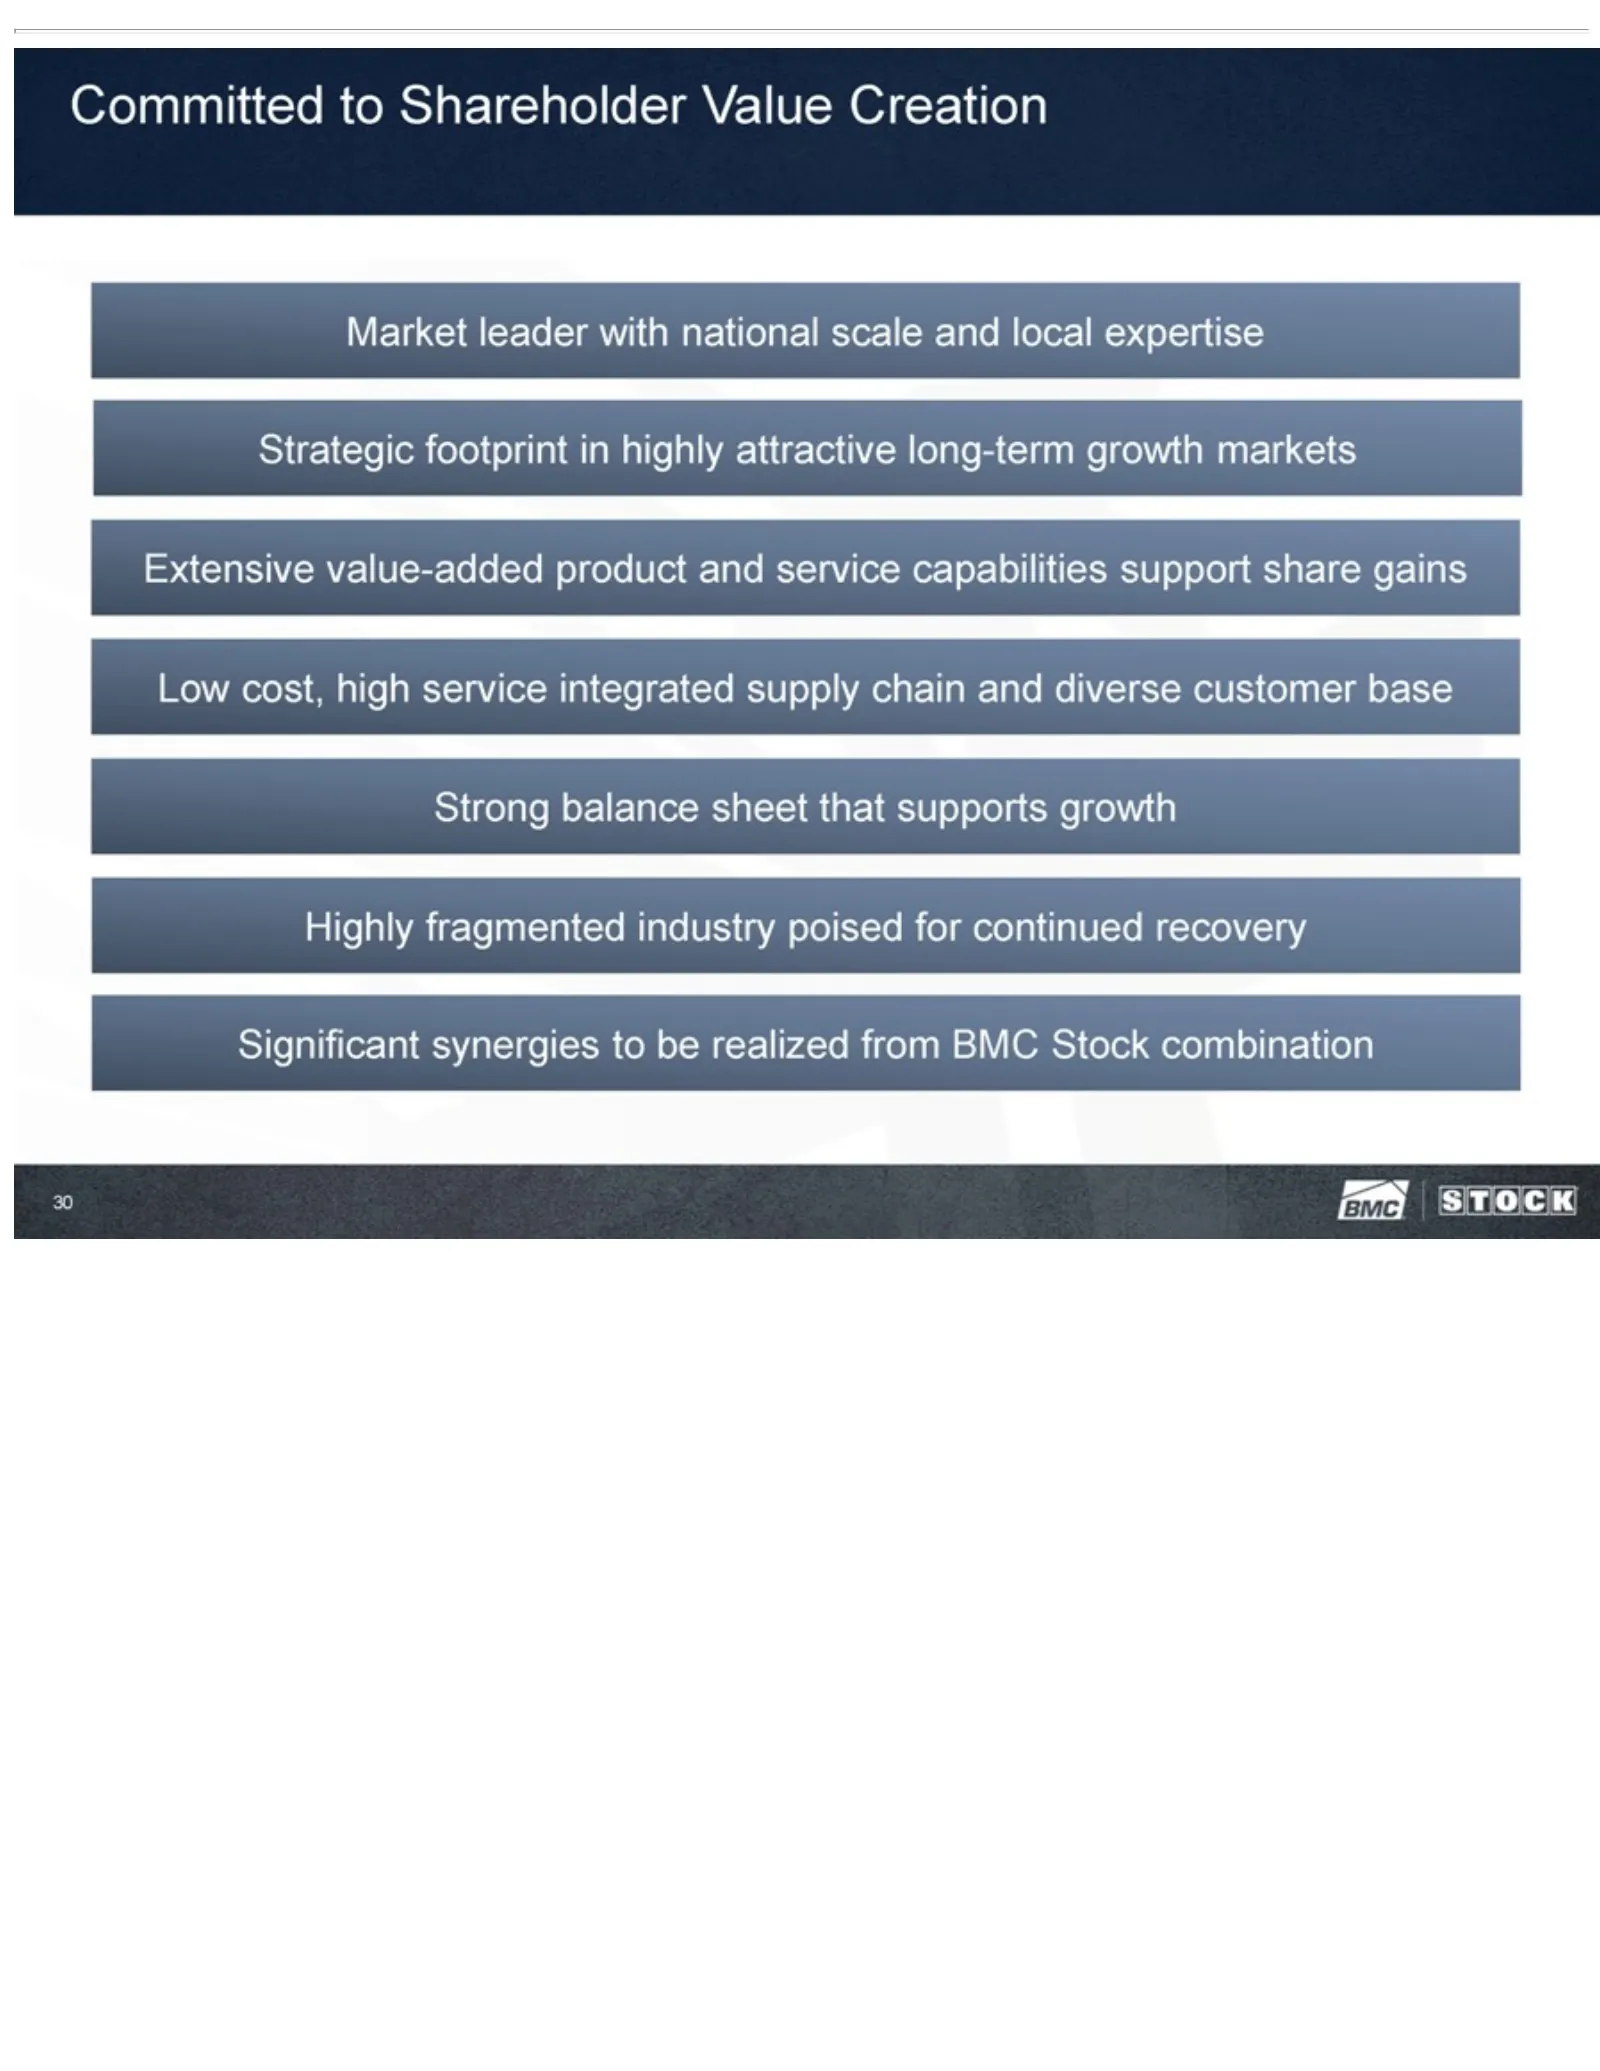
Slide 30: Committed to Shareholder Value Creation
Committed support be realized share from to gains Shareholder BMCLow Stock cost, Value combination high Creation service30 Market integrated leader supply withchain national and scale diverse andcustomer local expertise base Strong Strategic balance footprint sheet in that highly supports attractive

Slide 31: Appendix
APPENDIX
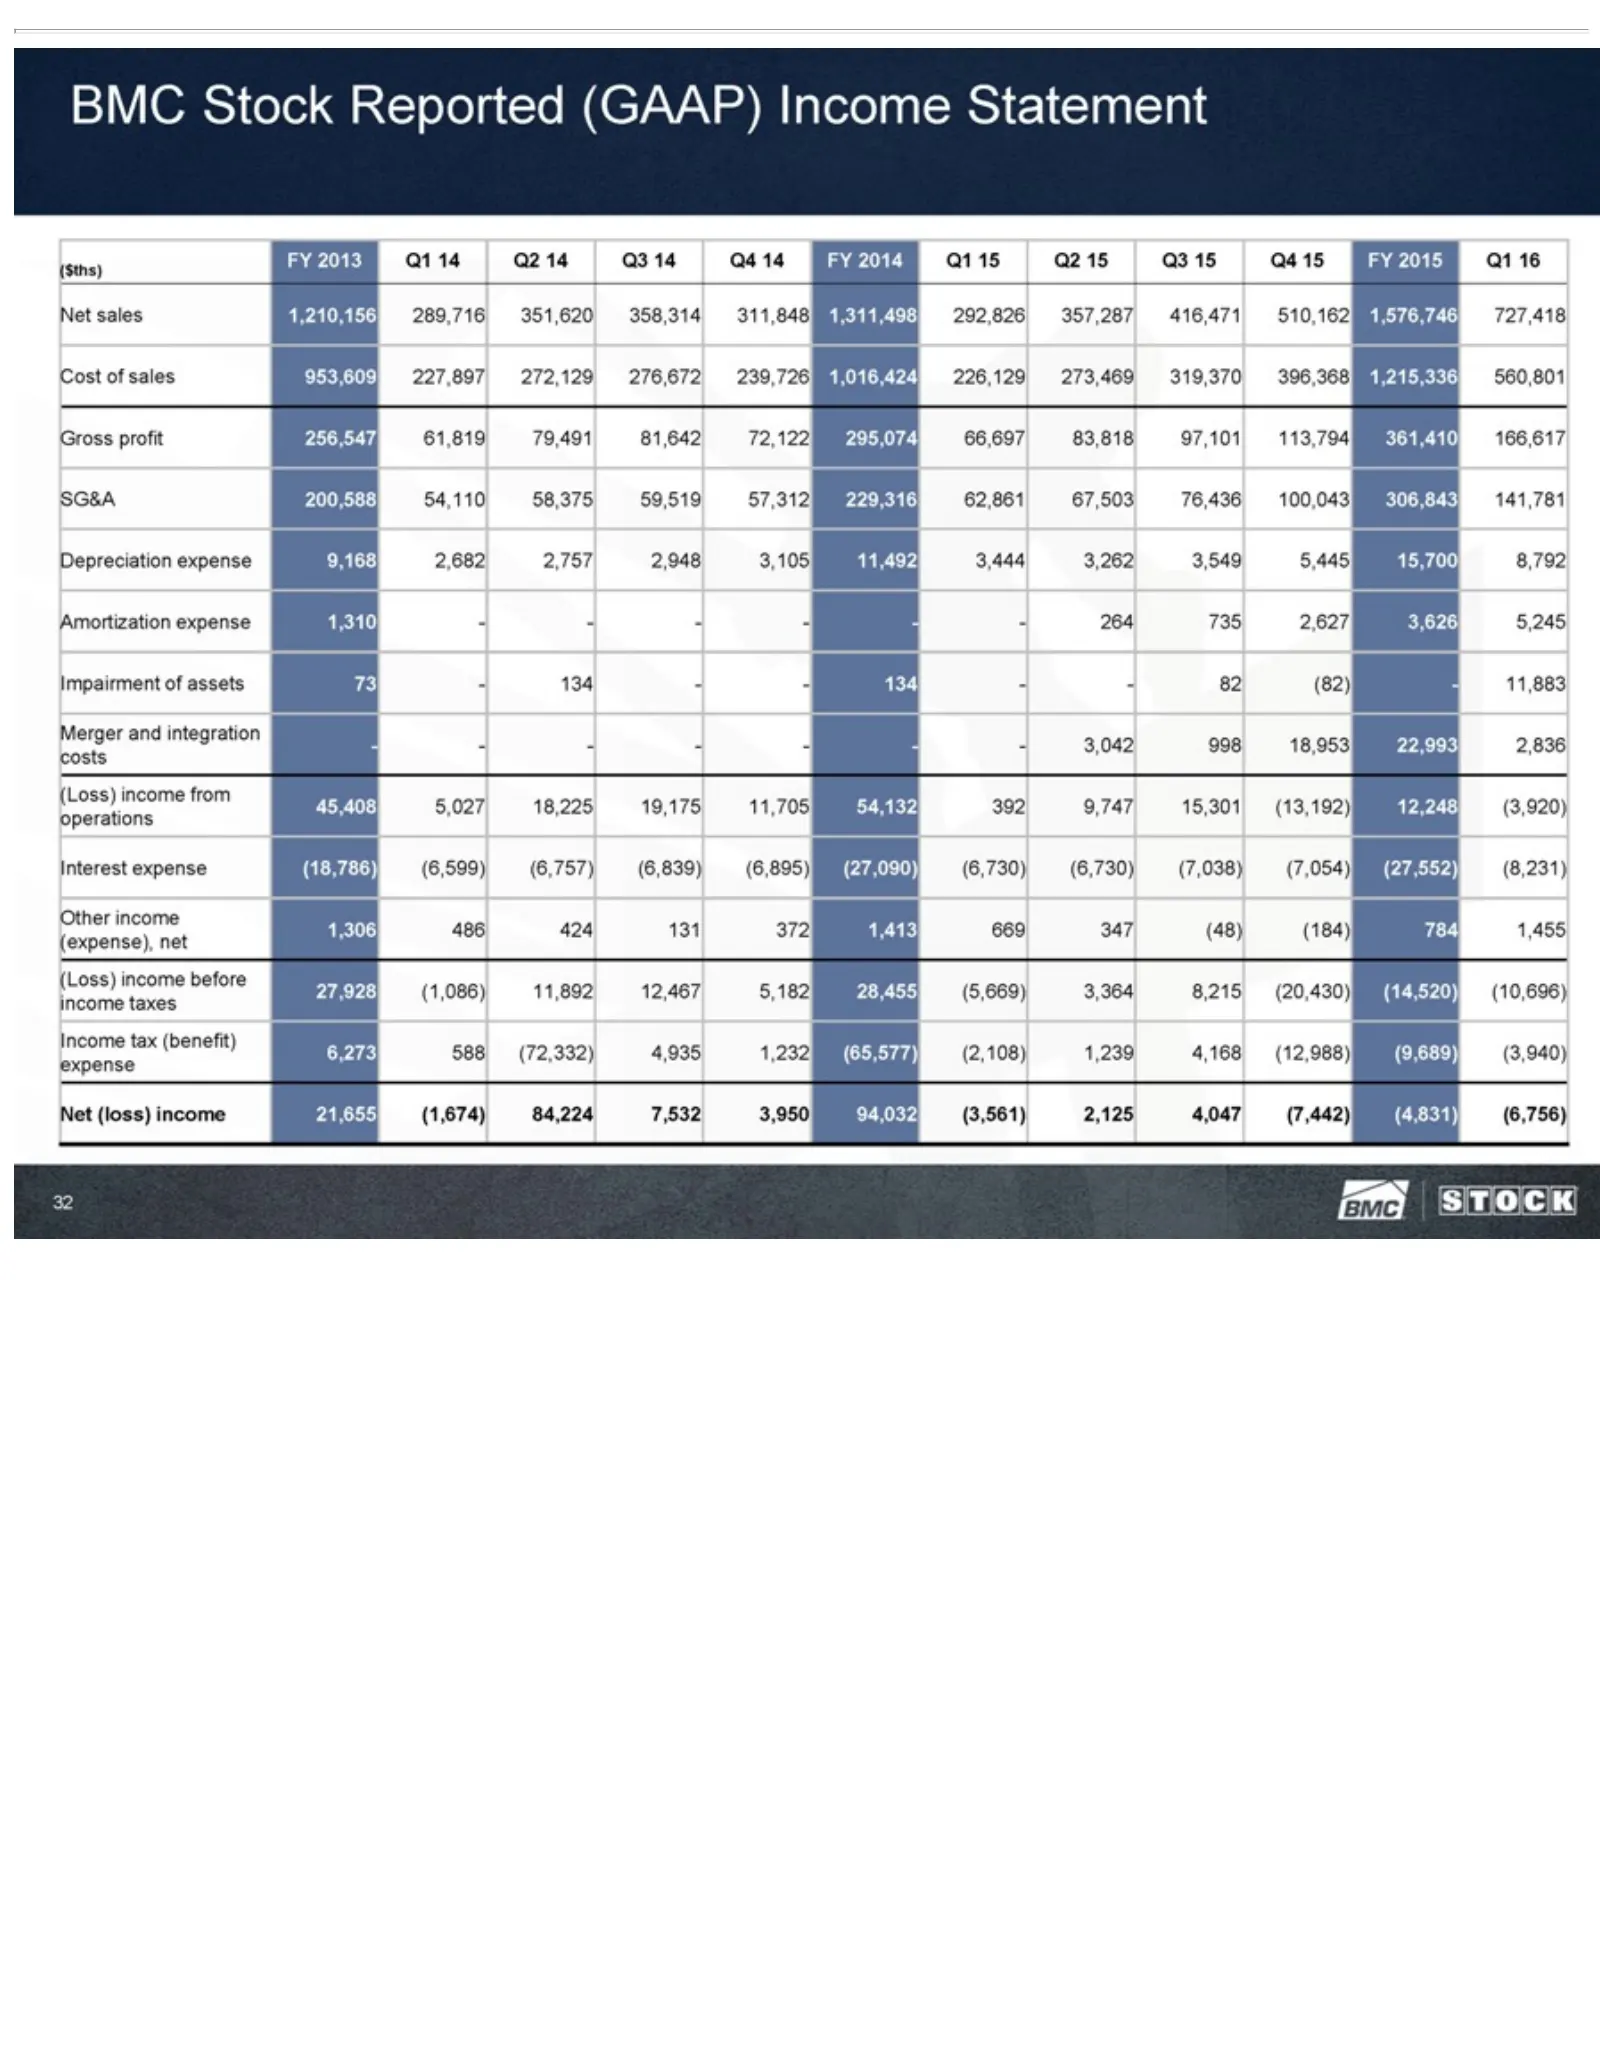
Slide 32: BMC Stock Reported Income Statement
BMC income 357,287 295,074 11,492 22,993 (18,786) (1,086) (loss) Stock 3,444 2,836 11,892 416,471 66,697 (6,599) Reported 3,262 costs 21,655 12,467 83,818 (6,757) 510,162 (Loss) 3,549 (1,674) (GAAP) 5,182 97,101 (6,839) 5,445 1,576,746 income 28,455 84,224 113,794 Income 15,700 (6,895) from (5,669)
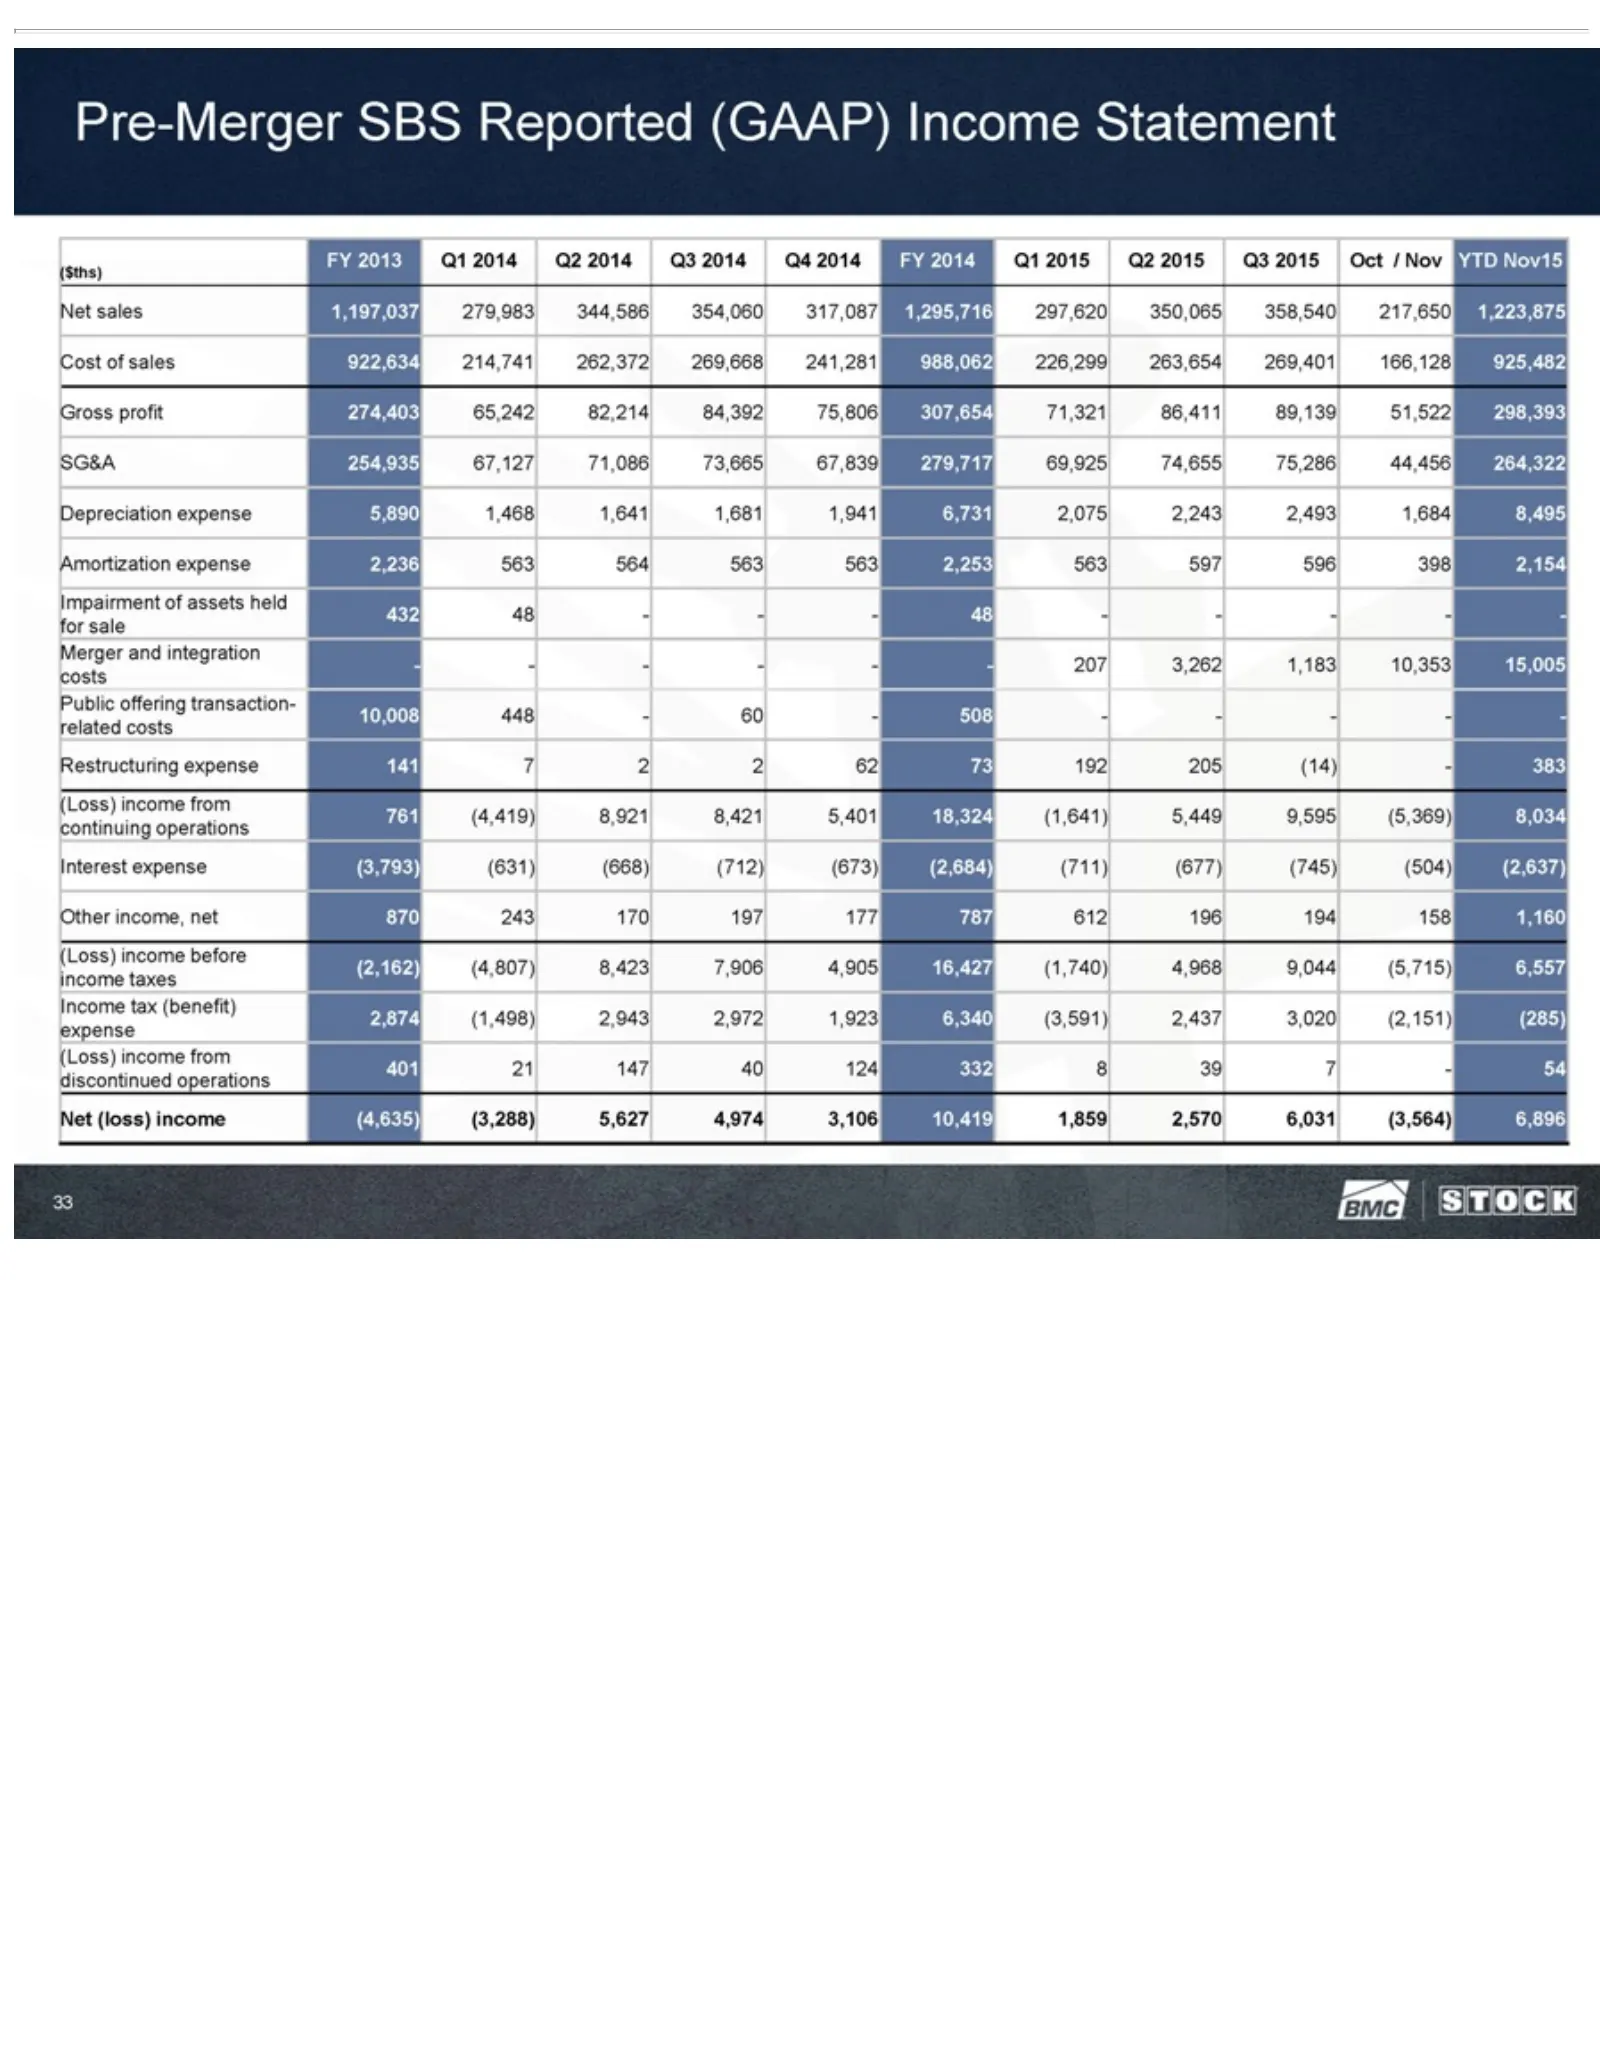
Slide 33: Pre-Merger SBS Reported Income Statement
Pre-Merger 317,087 75,806 2,493 Public (5,369) (2,162) 21 1471,684 offering 307,654 40 8,034 (4,807) 1,295,716 124 SBS 8,495 continuing 332 transaction-10,008 8,423 71,321 Reported Amortization 297,620 8 39 7,906 86,411 7operations -(GAAP) 54 350,065 4,905 discontinued 89,139 expense 16,427 448 Inco
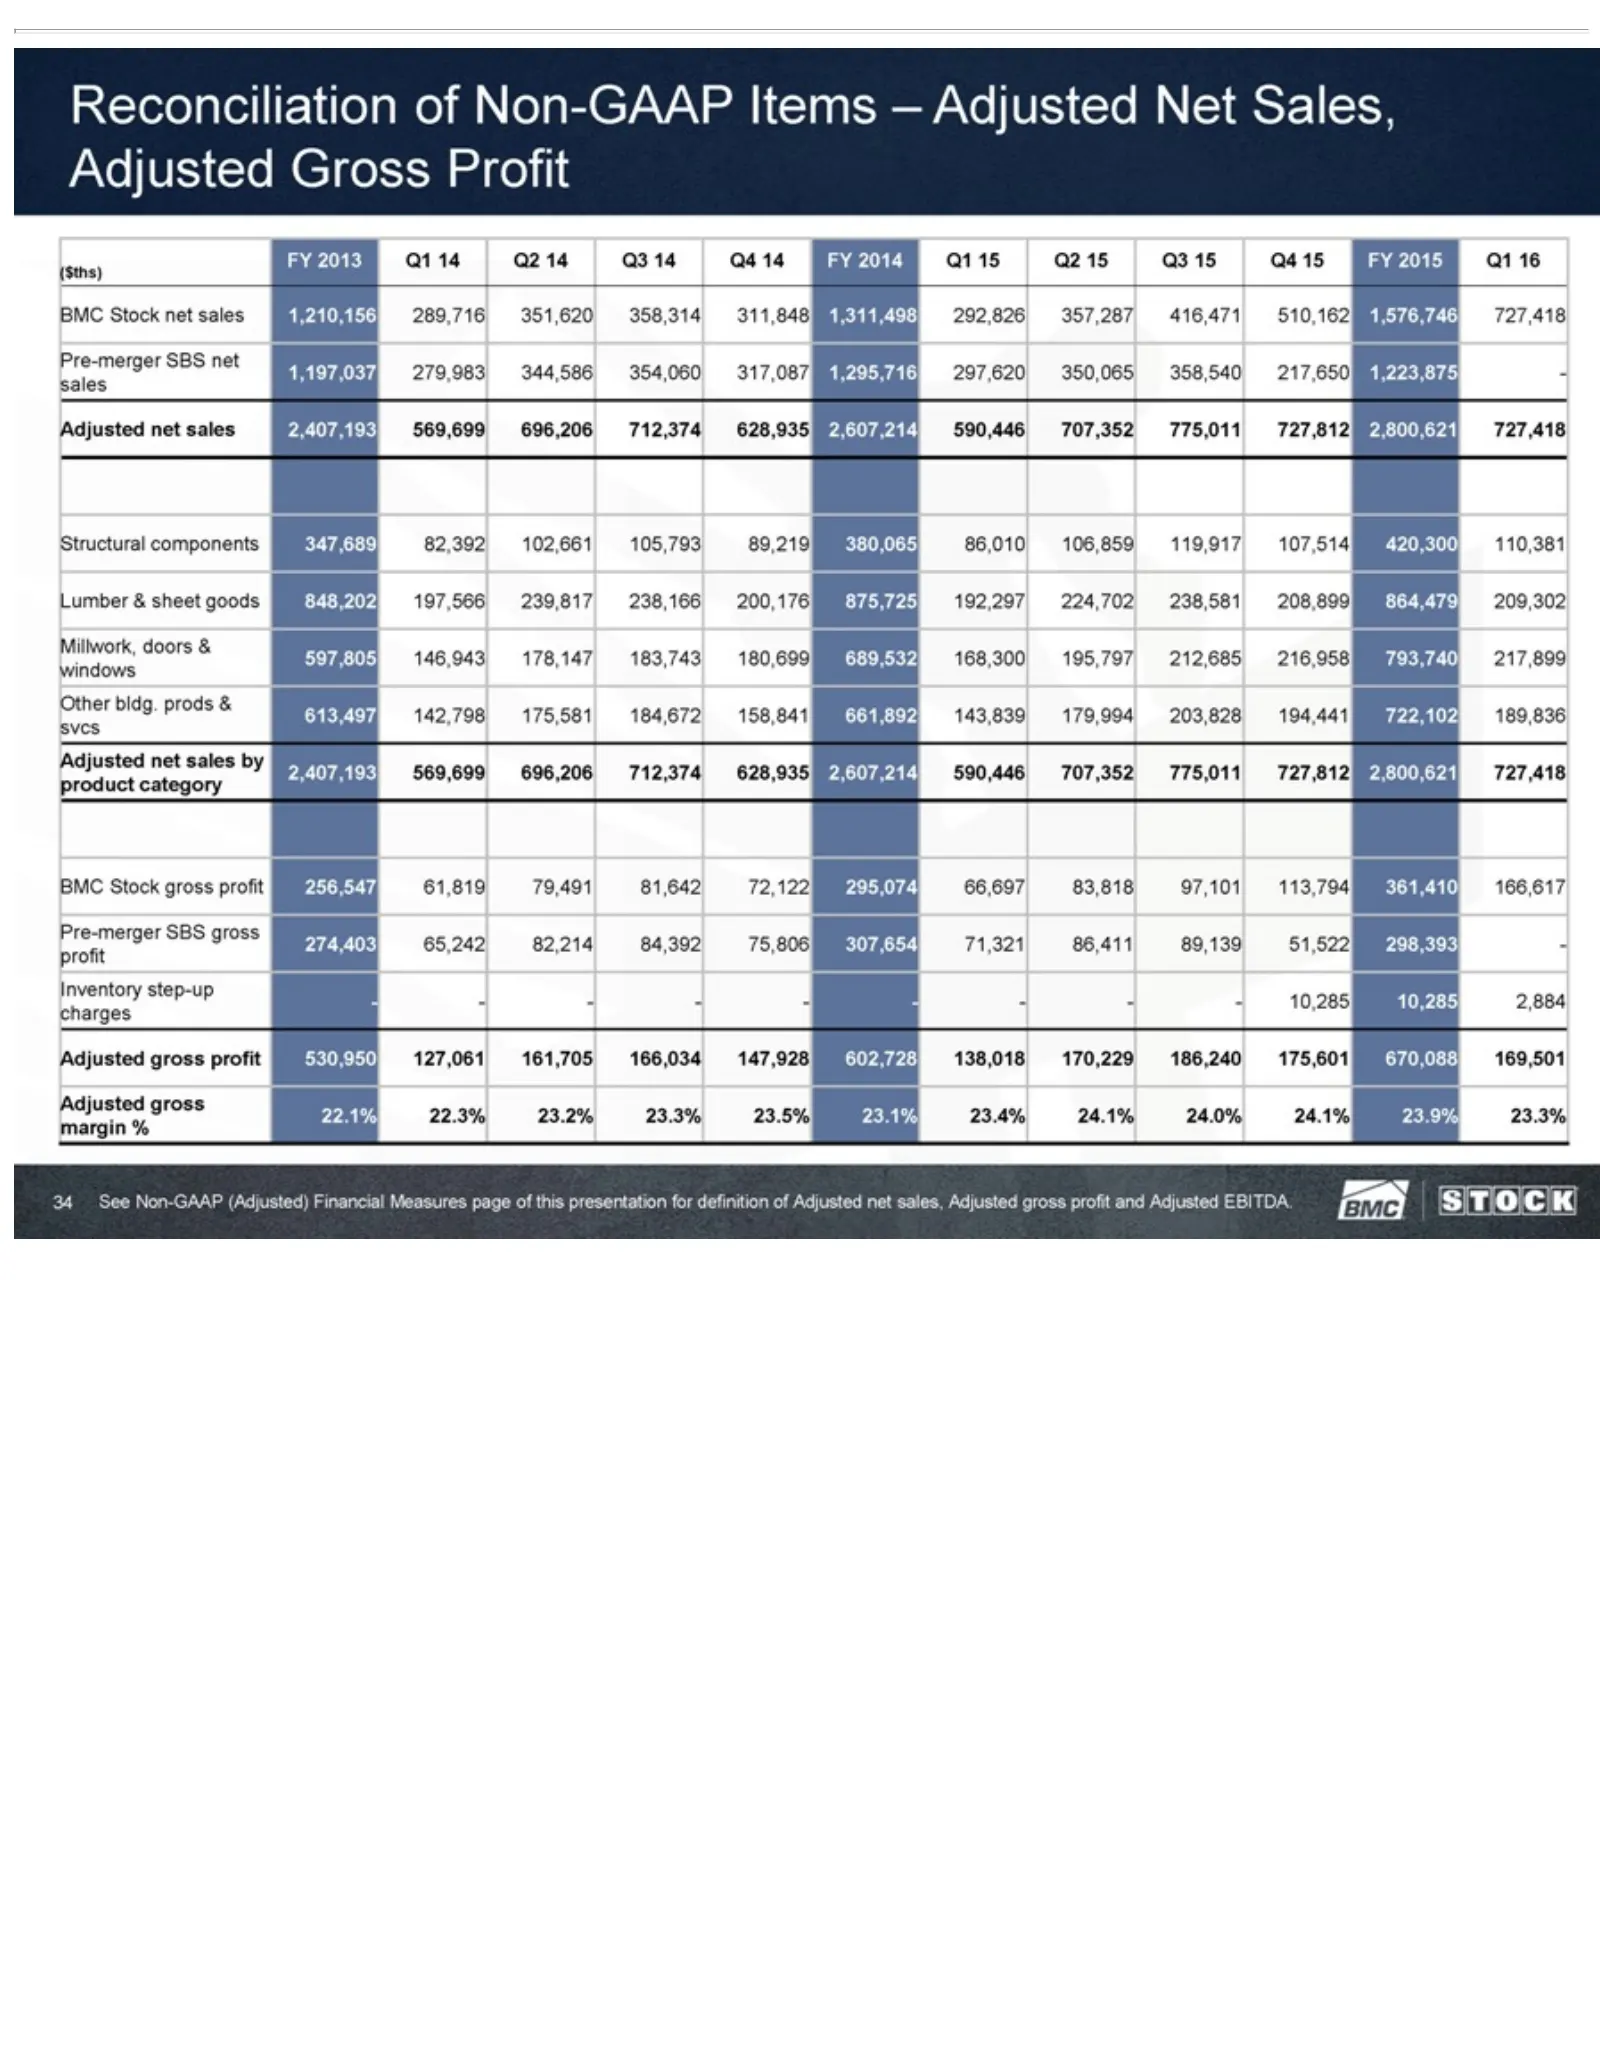
Slide 34: Reconciliation of Adjusted Net Sales and Gross Profit
Reconciliation 351,620 119,917 180,699 net 83,818 Adjusted 23.3% sales margin 97,101 107,514 358,314 689,532 by net2,407,193 gross sales %113,794 of profit 420,300 See 311,848 168,300 Non-GAAP 2,407,193 Non-GAAP 530,950 569,699 361,410 1,311,498 110,381 195,797 569,699 Items 127,061 696,206 166,617
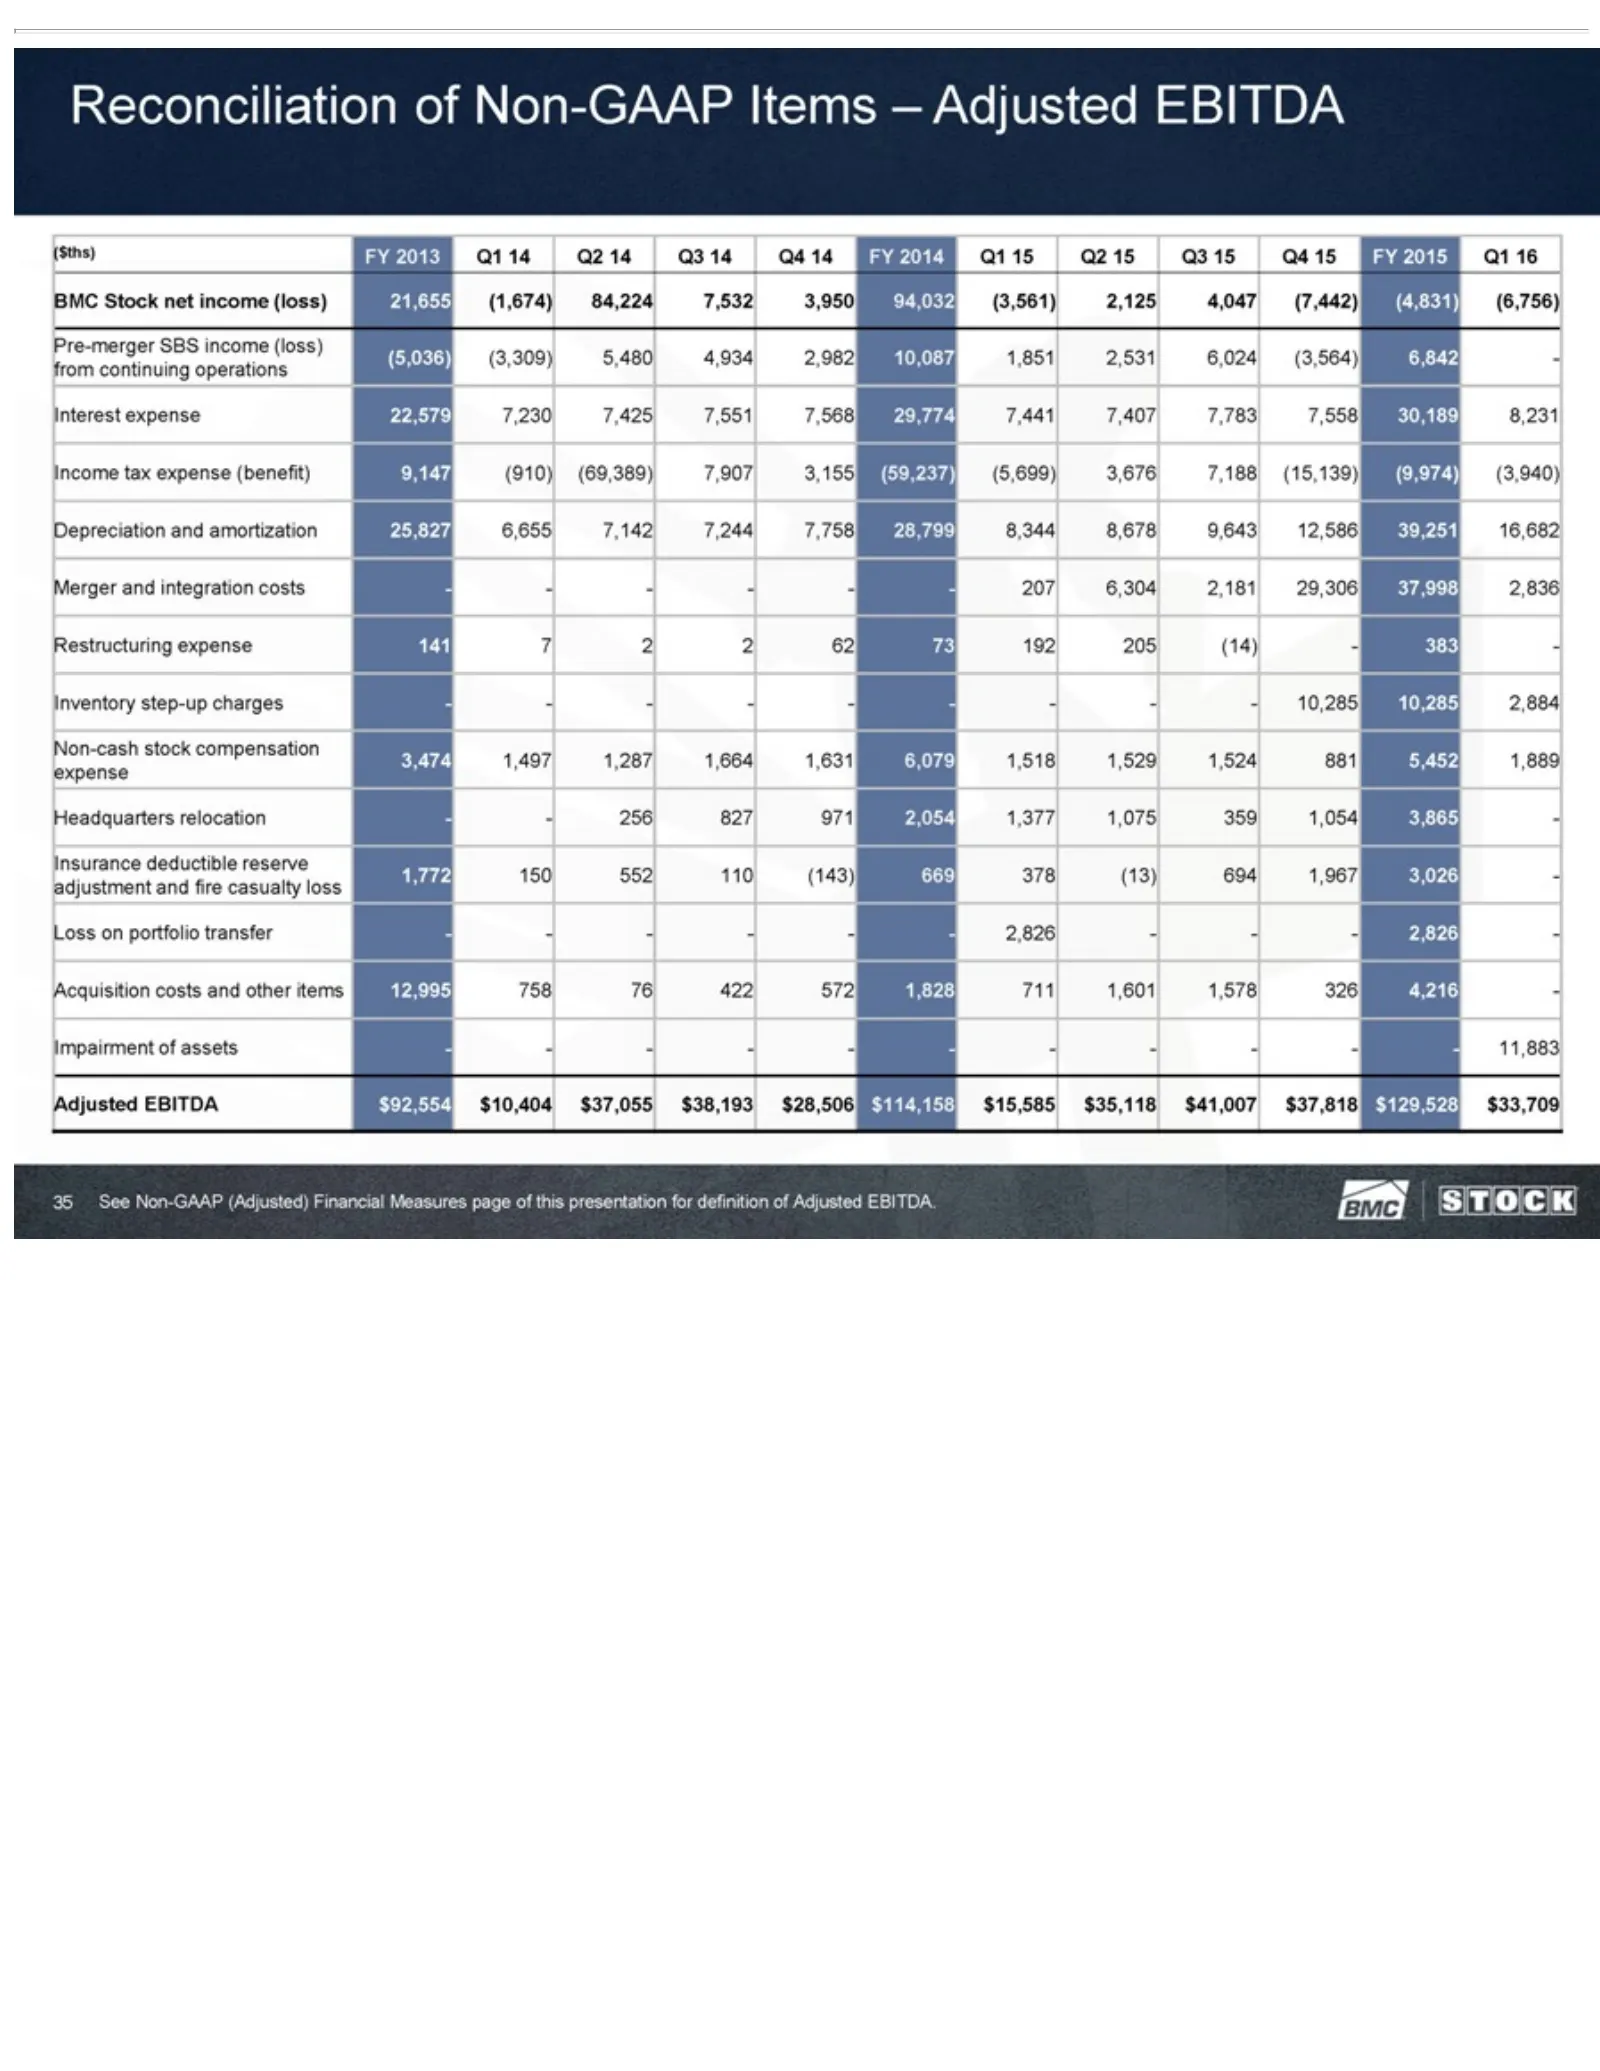
Slide 35: Reconciliation to Adjusted EBITDA
Reconciliation 94,032 7,425 25,827 Inventory 1,377 and $37,818 other 7,551 1,075 (3,561) 6,655 $129,528 items step-up 7,568 359 7,142 of 2,125 12,995 1,054 Non-GAAP charges 29,774 $33,709 7,244 4,047 3,865 7587,758 7,441 - See 76 (7,442) - -Insurance - Items -422 Non-GAAP -28,799 7,407 - -572 (4,831
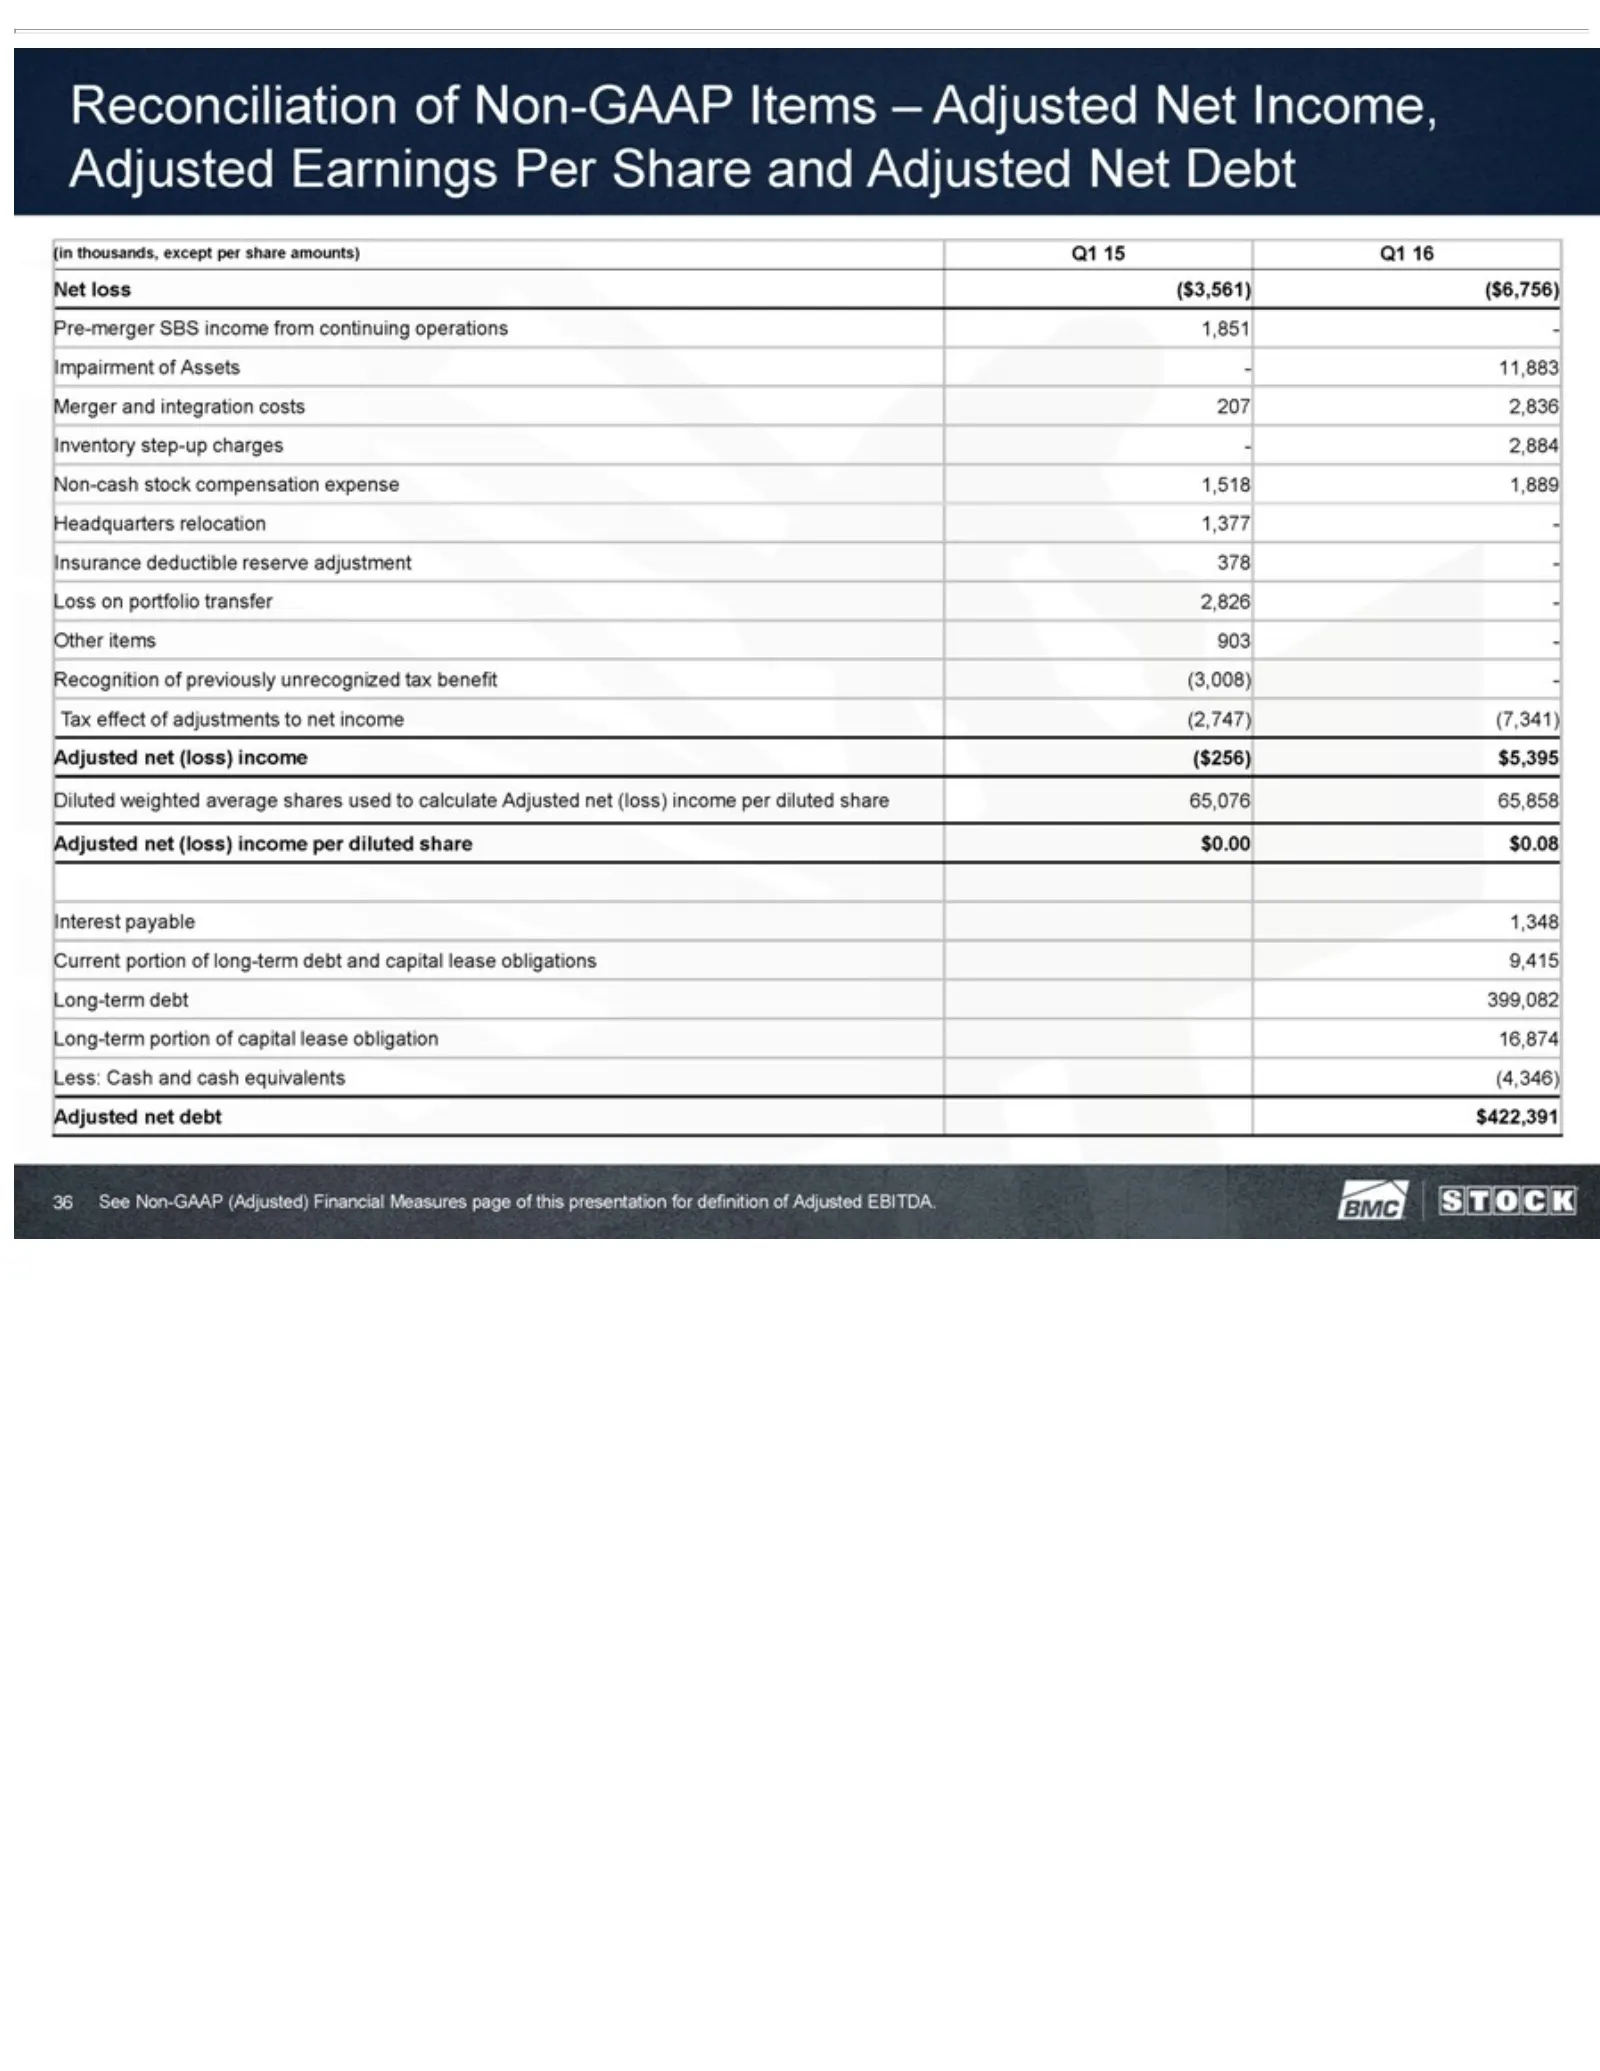
Slide 36: Reconciliation of Adjusted Net Income and Net Debt
Reconciliation from 1,377 (2,747) $0.08 (4,346) continuing -Insurance Interest Adjusted (7,341)payable of Adjusted operations deductible net Non-GAAP debt 1,348 net $422,391 1,851 reserve Current (loss) Items -Impairment income See adjustment –portion Adjusted Non-GAAP ($256) ofof long-term 378 Net
Source: SEC EDGAR · 8-K filed May 16, 2016
More decks from BMC Stock Holdings Inc
 Merger or Acquisition (November 2020)7 slides · Nov 25, 2020
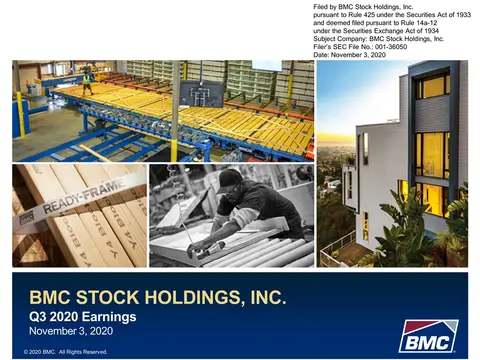 Q3 2020 Earnings Presentation13 slides · Nov 3, 2020
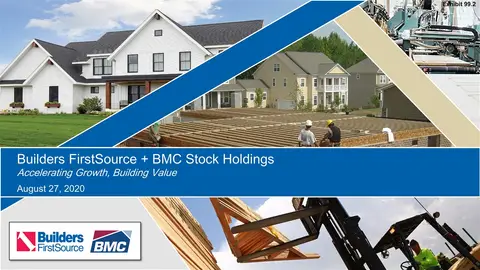 Merger or Acquisition (August 2020)21 slides · Aug 27, 2020
 Investor Presentation (August 2017)29 slides · Aug 4, 2017
 Investor Presentation (May 2017)29 slides · May 8, 2017
 Investor Presentation (March 2017)32 slides · Mar 1, 2017