Triton International Ltd. · NYSE:TRTN/PA
Triton International — Investor Presentation (May 2021)
27 slides from Triton International's investor presentation, May 2021
Slide 1: Investor Presentation May 2021
INVESTOR PRESENTATION May 2021 1
Slide 2: Disclaimer
DISCLAIMER Forward-Looking Statements Certain statements in this presentation, other than statements of historical facts, including statements regarding our strategy, future operations, future financial position, future revenues, future costs, prospects, plans and objectives of management are "forwa
Slide 3: Highlights
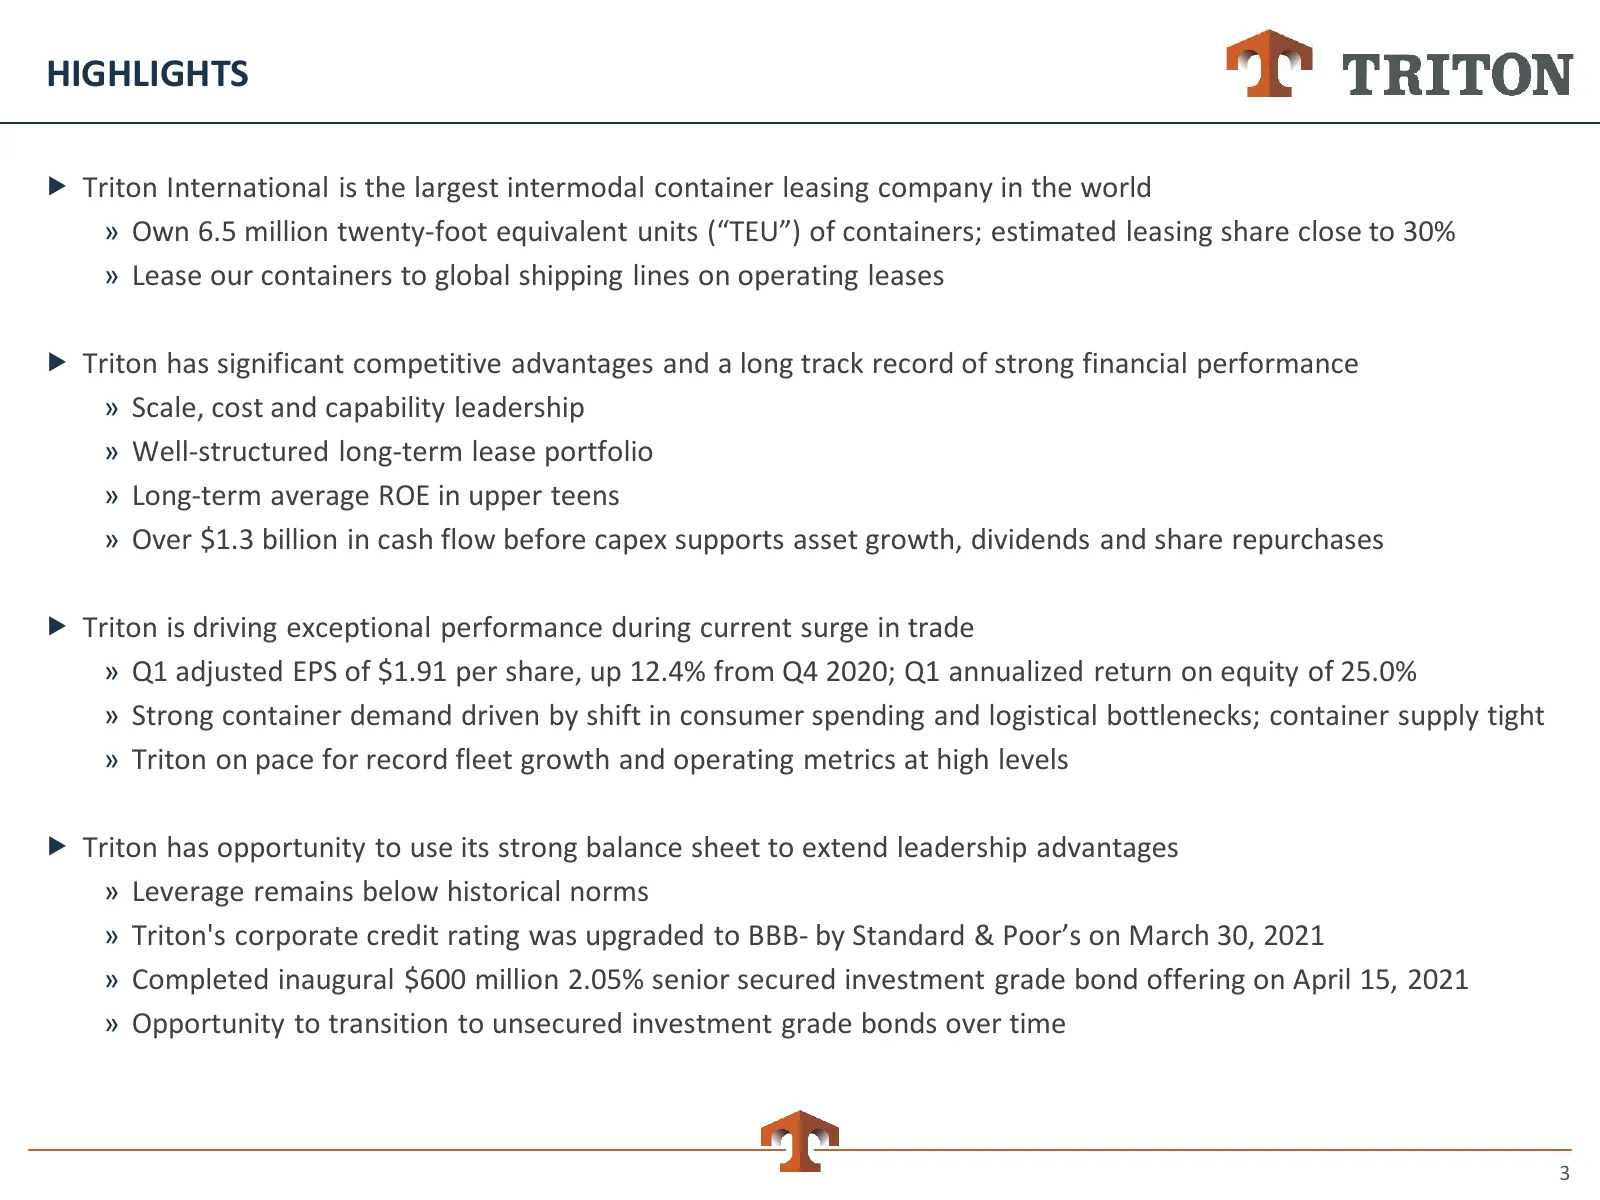
HIGHLIGHTS Triton International is the largest intermodal container leasing company in the world » Own 6.5 million twenty-foot equivalent units (“TEU”) of containers; estimated leasing share close to 30% » Lease our containers to global shipping lines on operating leases Triton has significant c
Slide 4: #1 Position in Key Product Lines and Strong Lease Portfolio
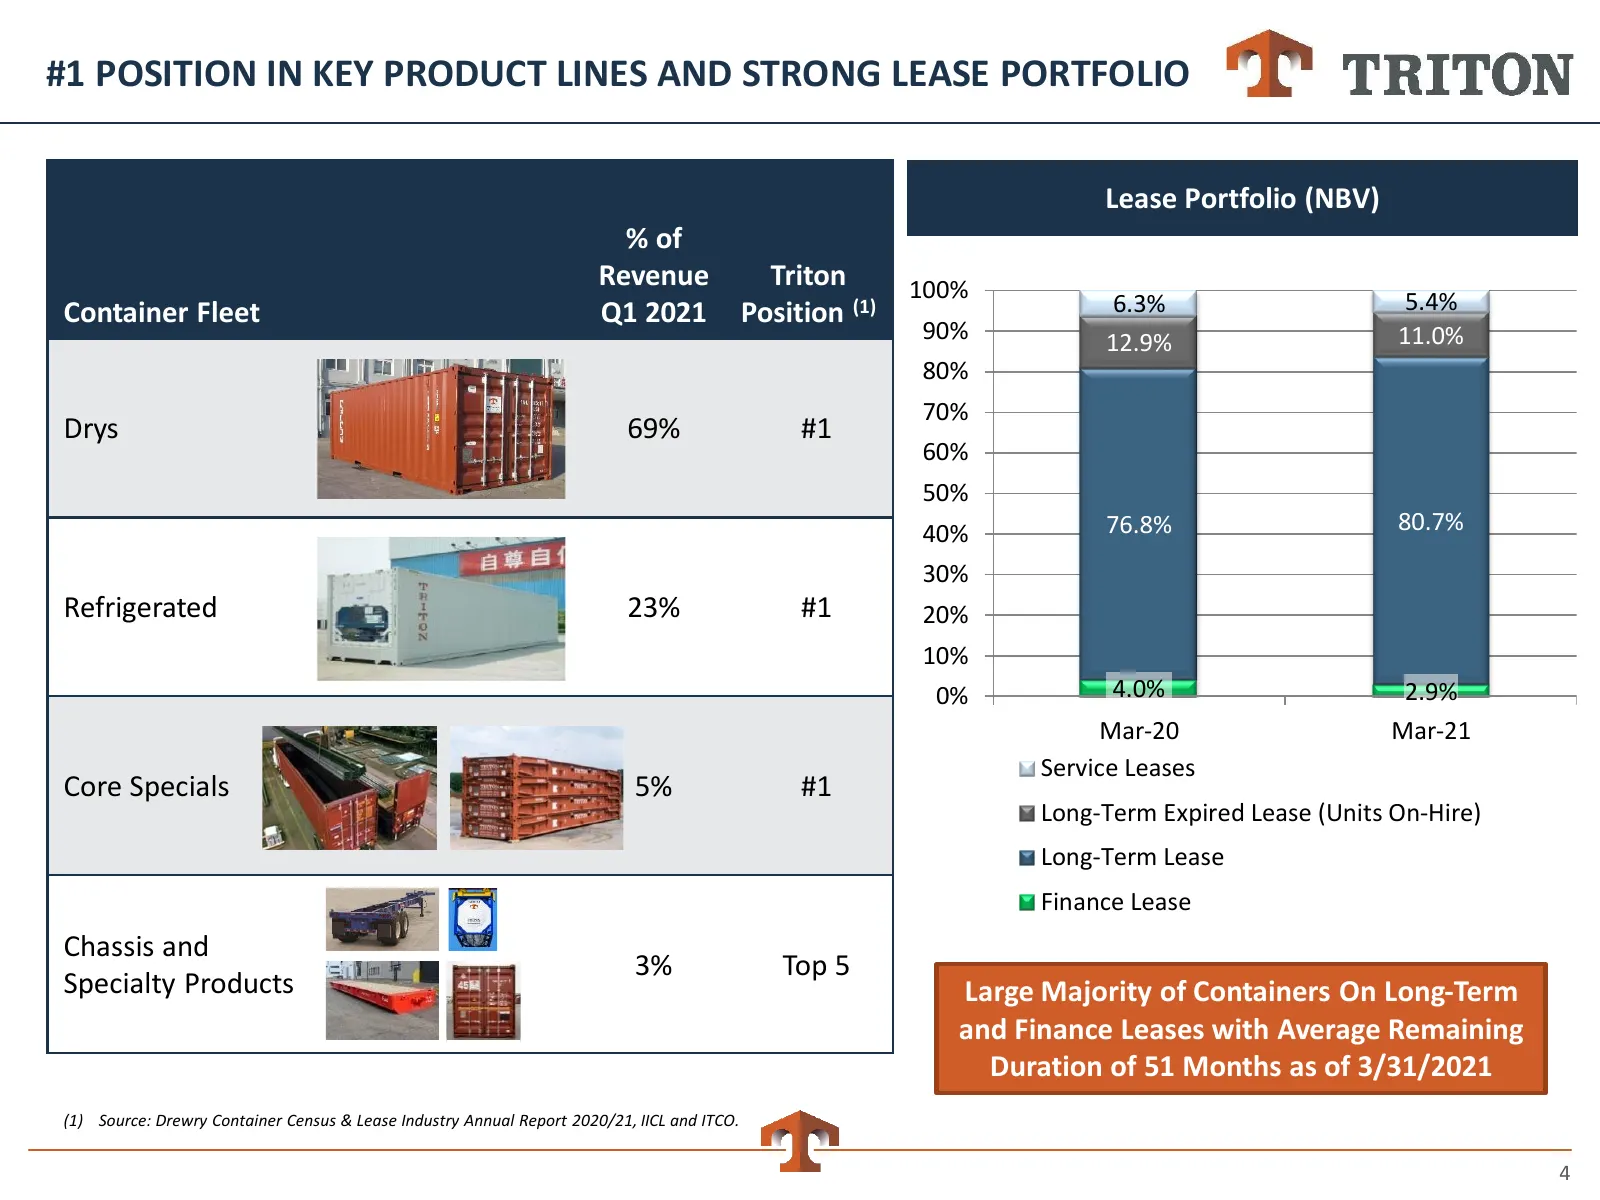
#1 POSITION IN KEY PRODUCT LINES AND STRONG LEASE PORTFOLIO Lease Portfolio (NBV) % of Revenue Triton 100% Container Fleet Q1 2021 Position (1) 6.3% 5.4% 90% 12.9% 11.0% 80% 70% Drys 69% #1 60% 50% 40% 76.8% 80.7% 30% Refrigerated 23% #1 20% 10% 0% 4.0% 2.9% Mar-20 Mar-21 Service Leases Core Special
Slide 5: Strong Position in Growing Market
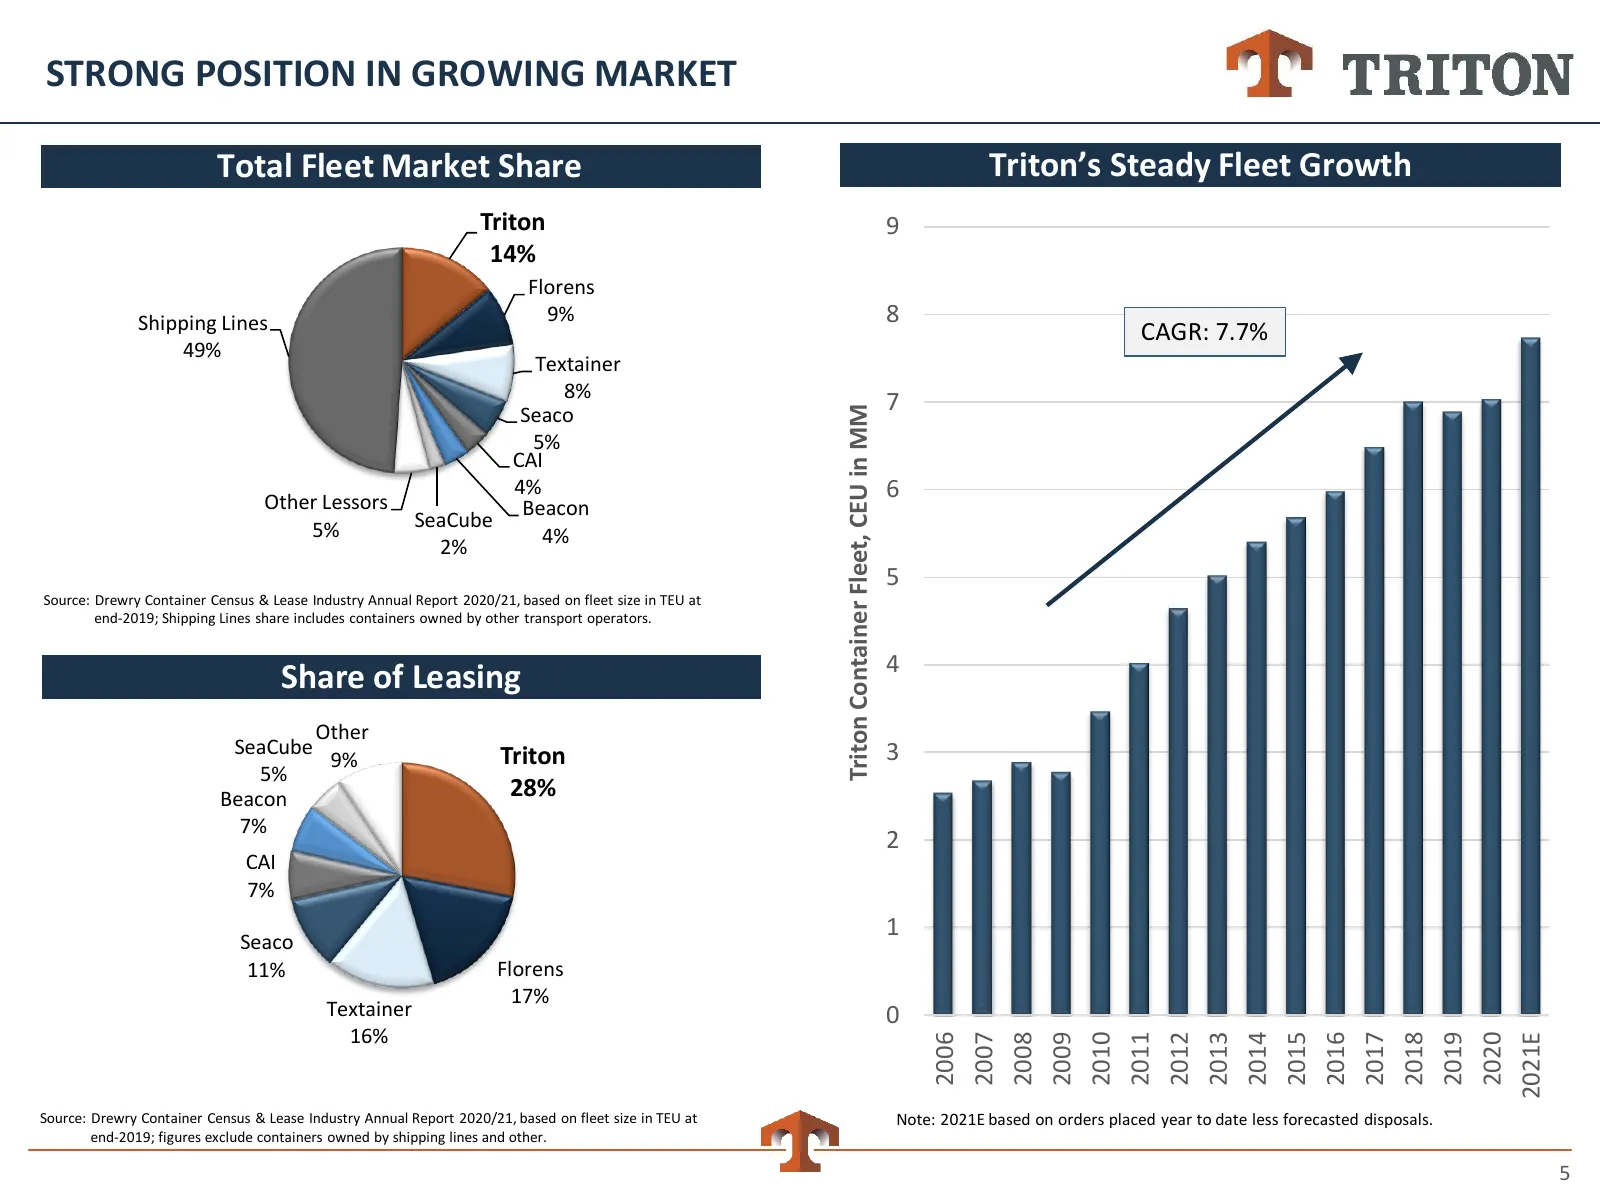
STRONG POSITION IN GROWING MARKET Total Fleet Market Share Triton’s Steady Fleet Growth Triton 9 14% Florens Shipping Lines 9% 8 CAGR: 7.7% 49% Textainer 8% 7 Triton Container Fleet, CEU in MM Seaco 5% CAI 4% 6 Other Lessors Beacon 5% SeaCube 4% 2% 5 Source: Drewry Container Census & Lease Industry
Slide 6: Current Market Overview
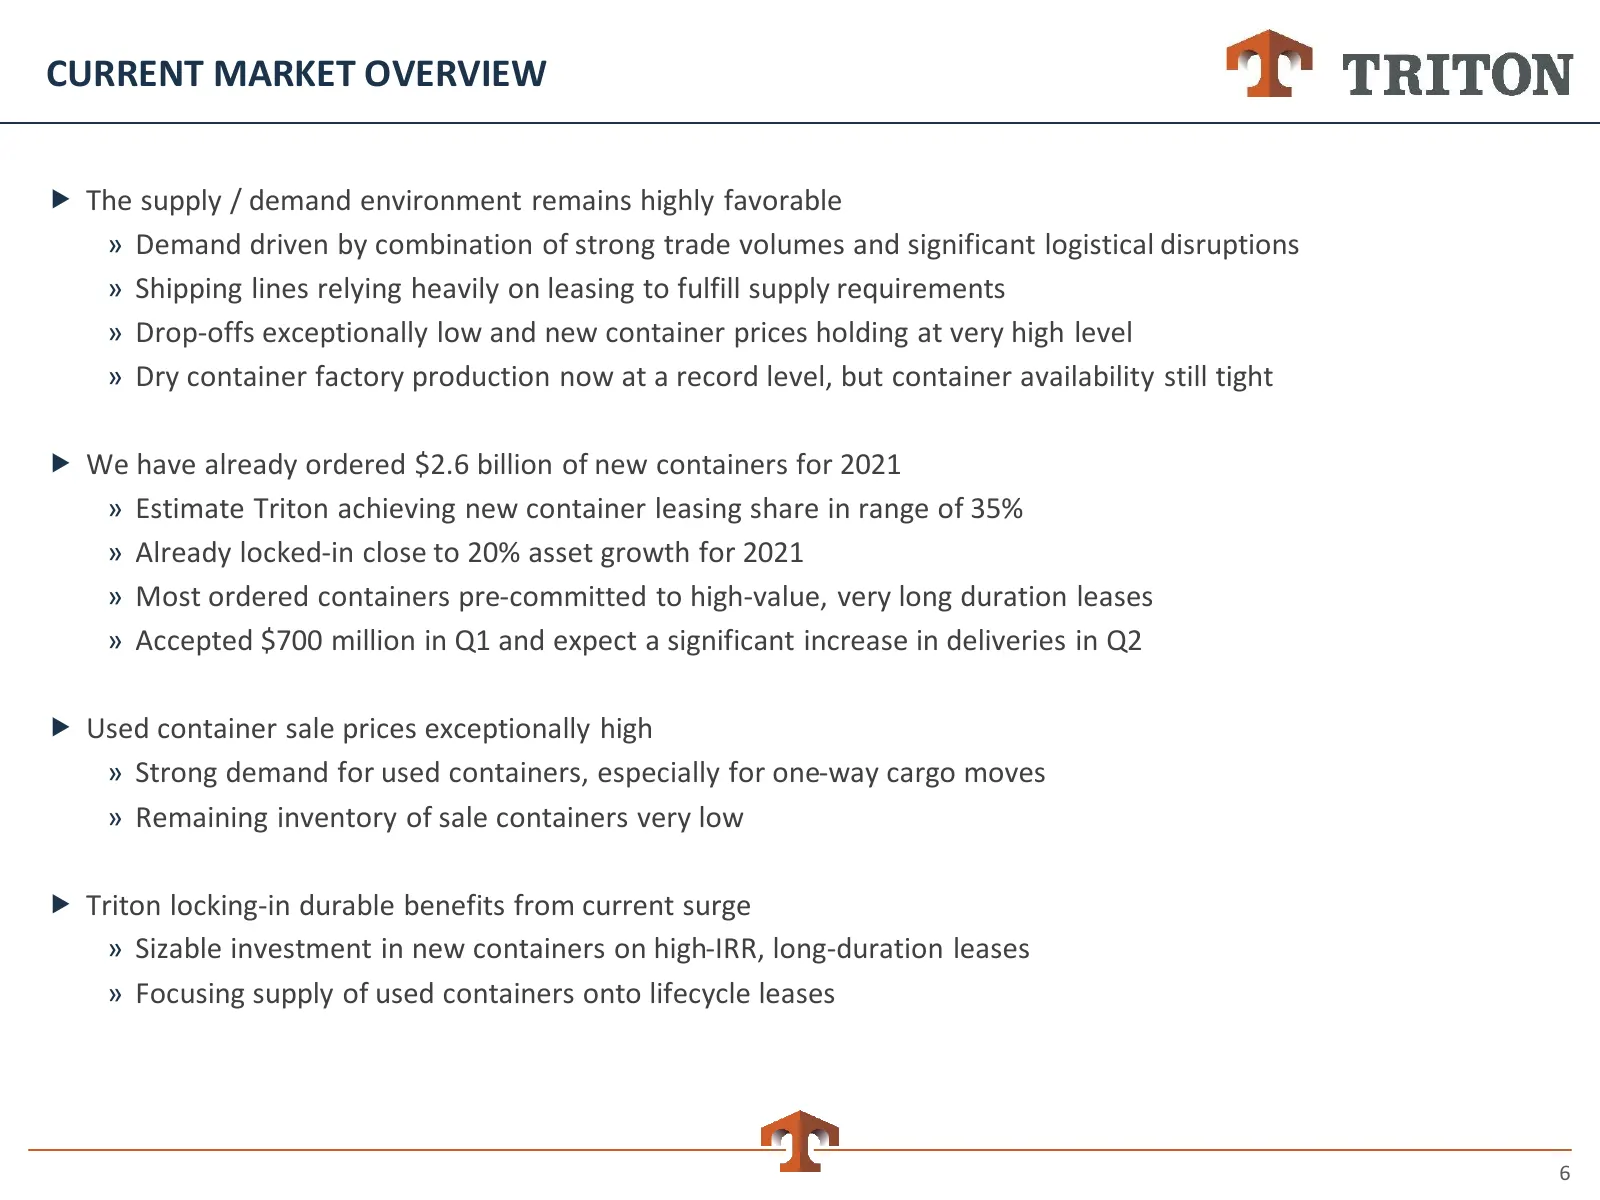
CURRENT MARKET OVERVIEW The supply / demand environment remains highly favorable » Demand driven by combination of strong trade volumes and significant logistical disruptions » Shipping lines relying heavily on leasing to fulfill supply requirements » Drop-offs exceptionally low and new container
Slide 7: Trade Volumes Well Above Pre-Pandemic Levels
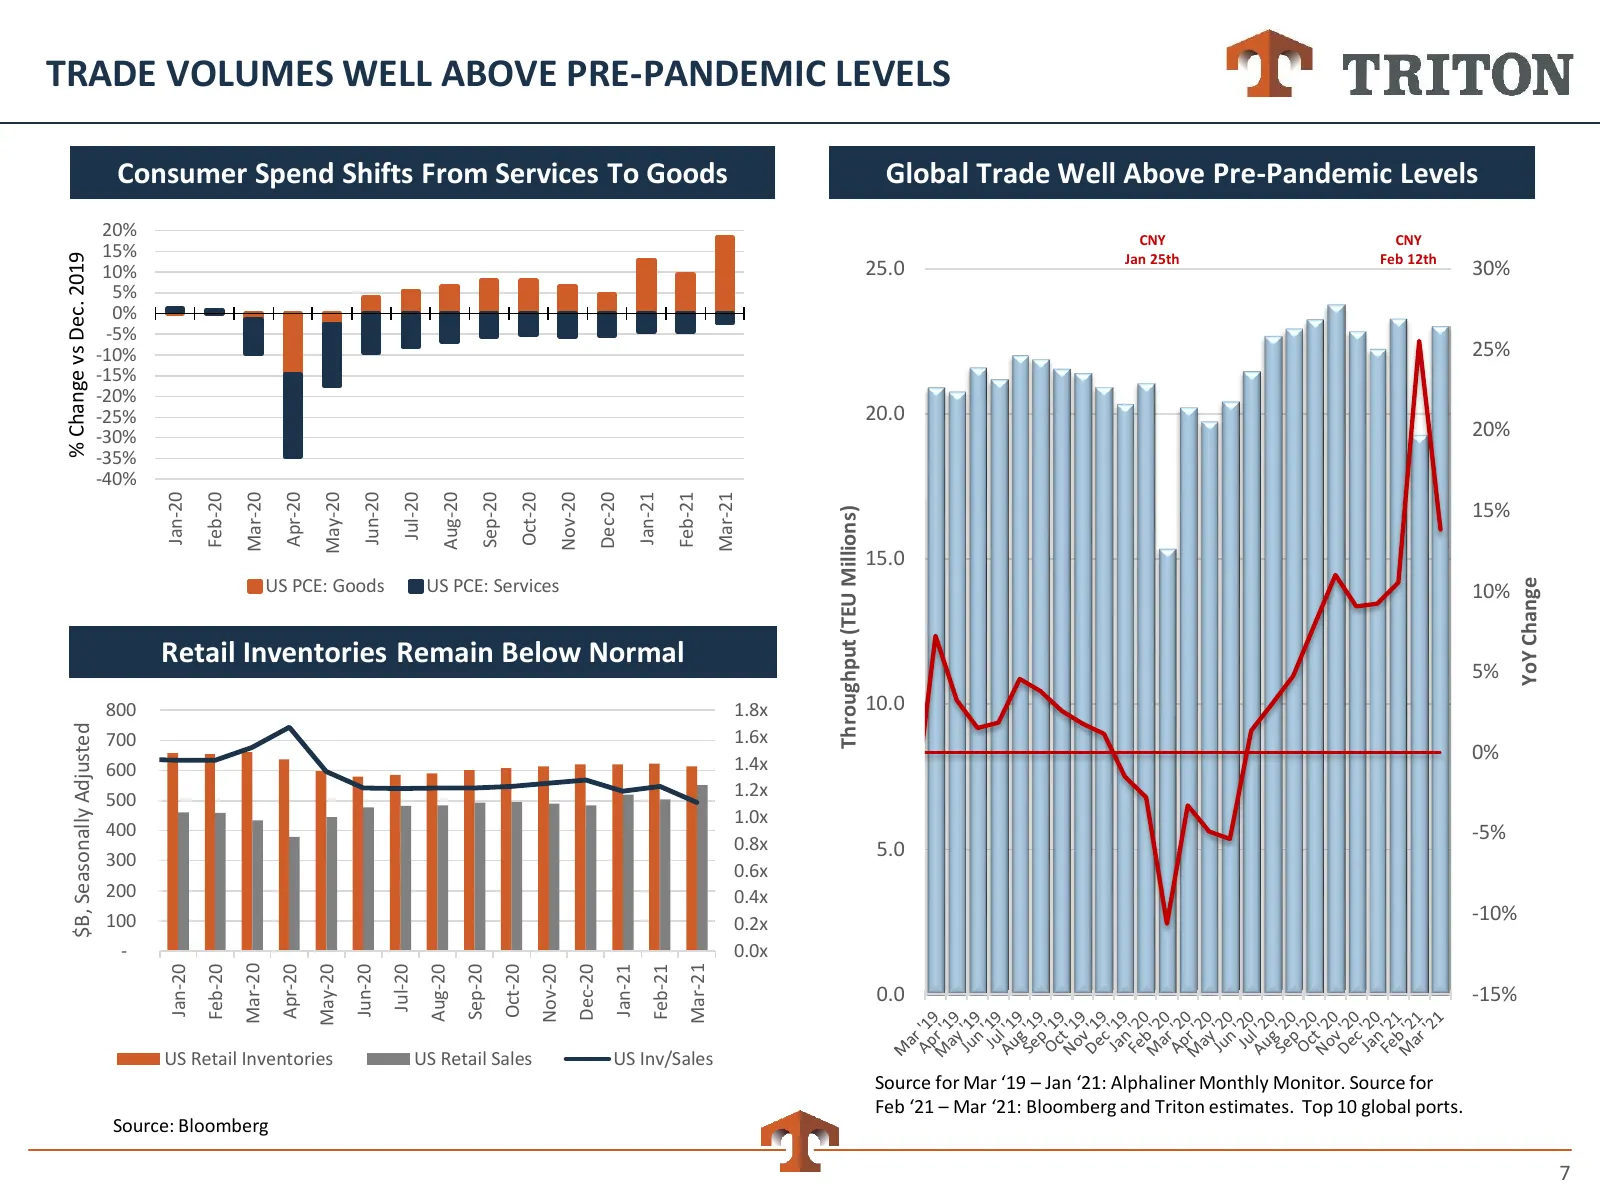
TRADE VOLUMES WELL ABOVE PRE-PANDEMIC LEVELS Consumer Spend Shifts From Services To Goods Global Trade Well Above Pre-Pandemic Levels 20% CNY CNY 15% % Change vs Dec. 2019 Jan 25th Feb 12th 10% 25.0 30% 5% 0% -5% -10% 25% -15% -20% -25% 20.0 -30% 20% -35% -40% Mar-20 Aug-20 Mar-21 Jul-20 Oct-20 Jun-
Slide 8: Vessel and Container Shortages Driving Record Freight Rates and Container Prices
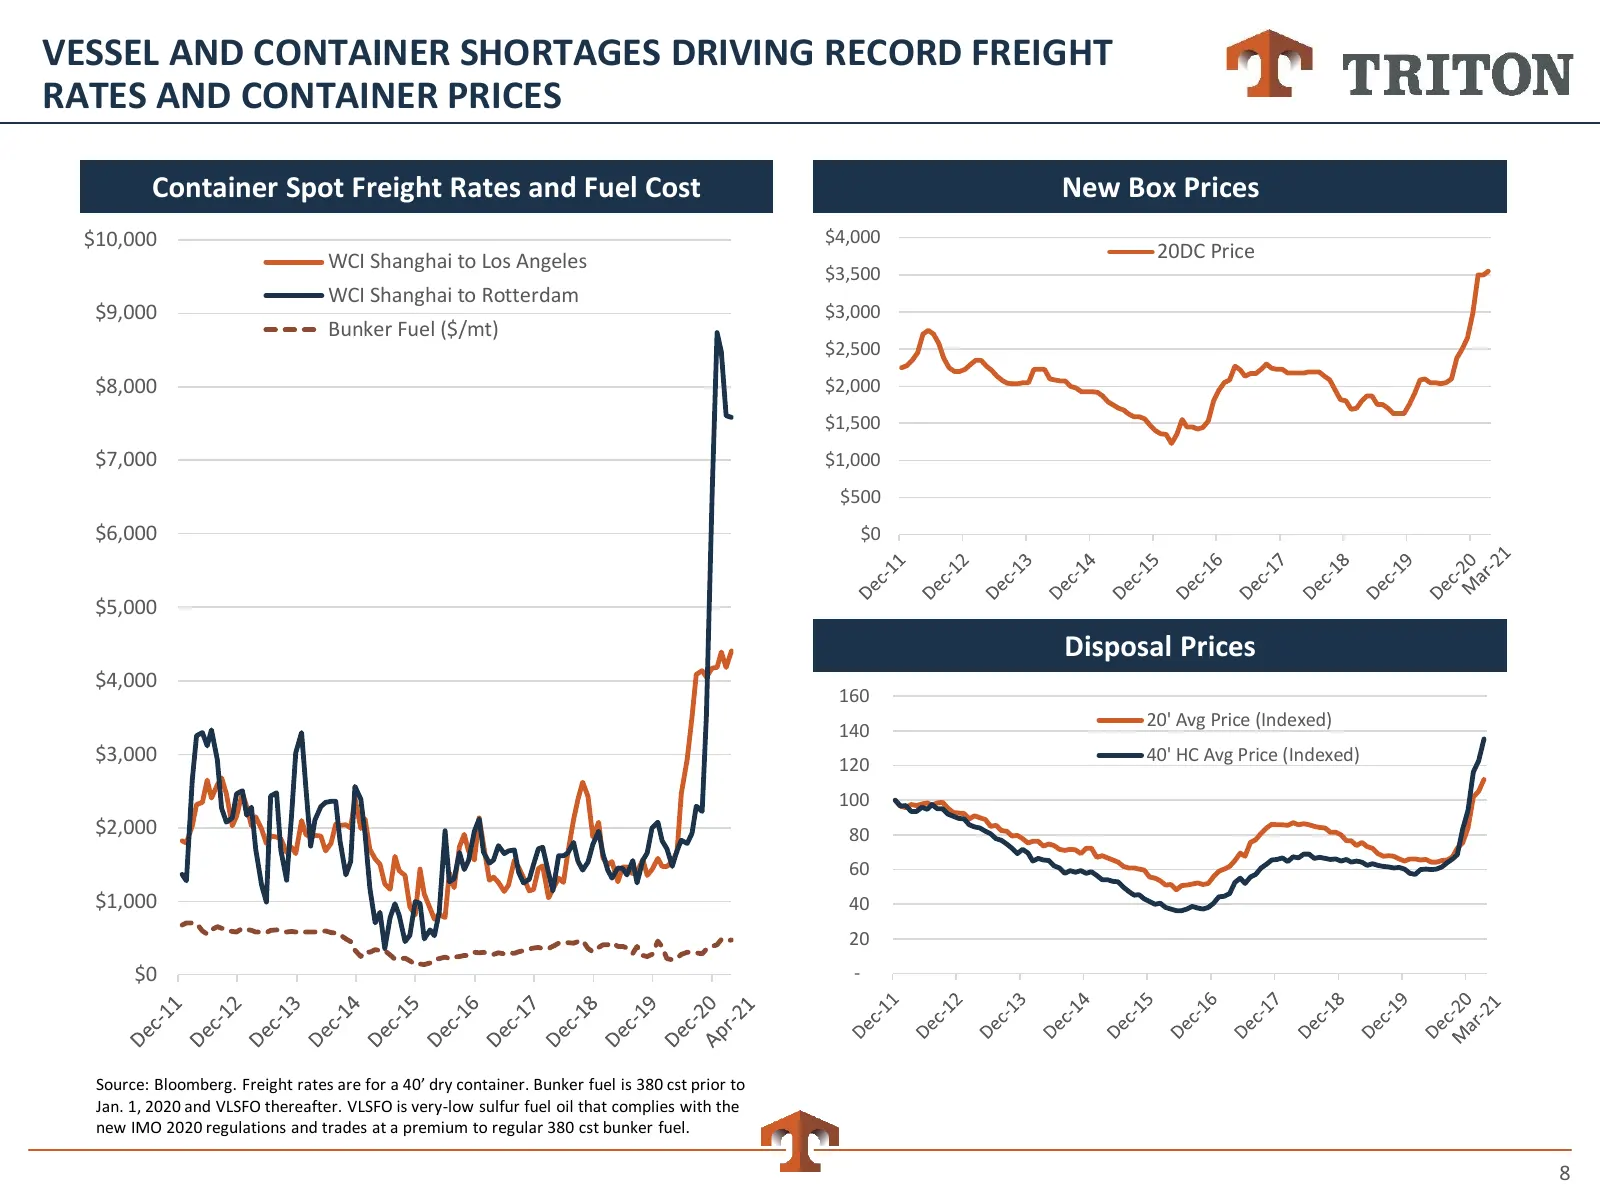
VESSEL AND CONTAINER SHORTAGES DRIVING RECORD FREIGHT RATES AND CONTAINER PRICES Container Spot Freight Rates and Fuel Cost New Box Prices $10,000 $4,000 WCI Shanghai to Los Angeles 20DC Price $3,500 WCI Shanghai to Rotterdam $9,000 $3,000 Bunker Fuel ($/mt) $2,500 $8,000 $2,000 $1,500 $7,000 $1,000
Slide 9: Triton's Key Operating Metrics Very Strong
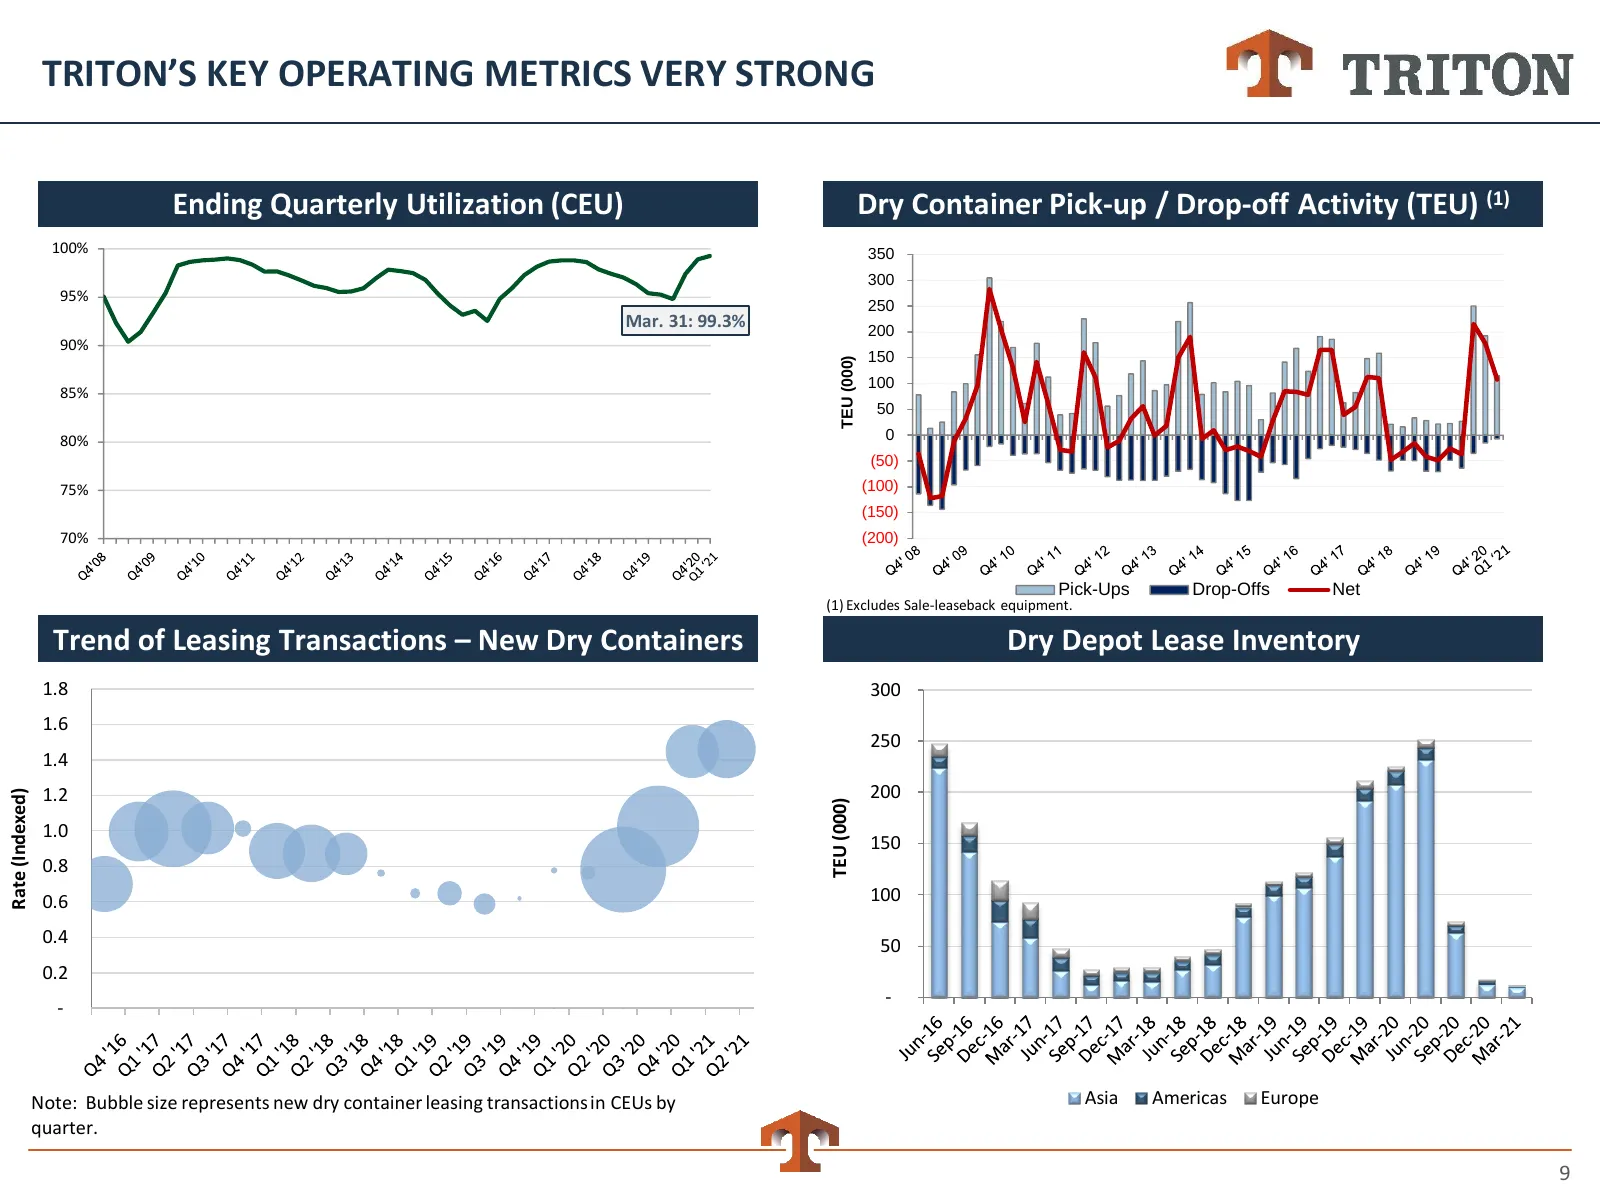
TRITON’S KEY OPERATING METRICS VERY STRONG Ending Quarterly Utilization (CEU) Ending Quarterly Utilization (CEU) Dry Container Pick-up / Drop-off Activity (TEU) (1) 100% 350 300 95% 250 Mar. 31: 99.3% 200 90% 150 TEU (000) 100 85% 50 80% 0 (50) 75% (100) (150) 70% (200) Pick-Ups Drop-Offs Net (1) Ex
Slide 10: Container Supply Still Tight Despite Increased Production; Leasing Share Remains High
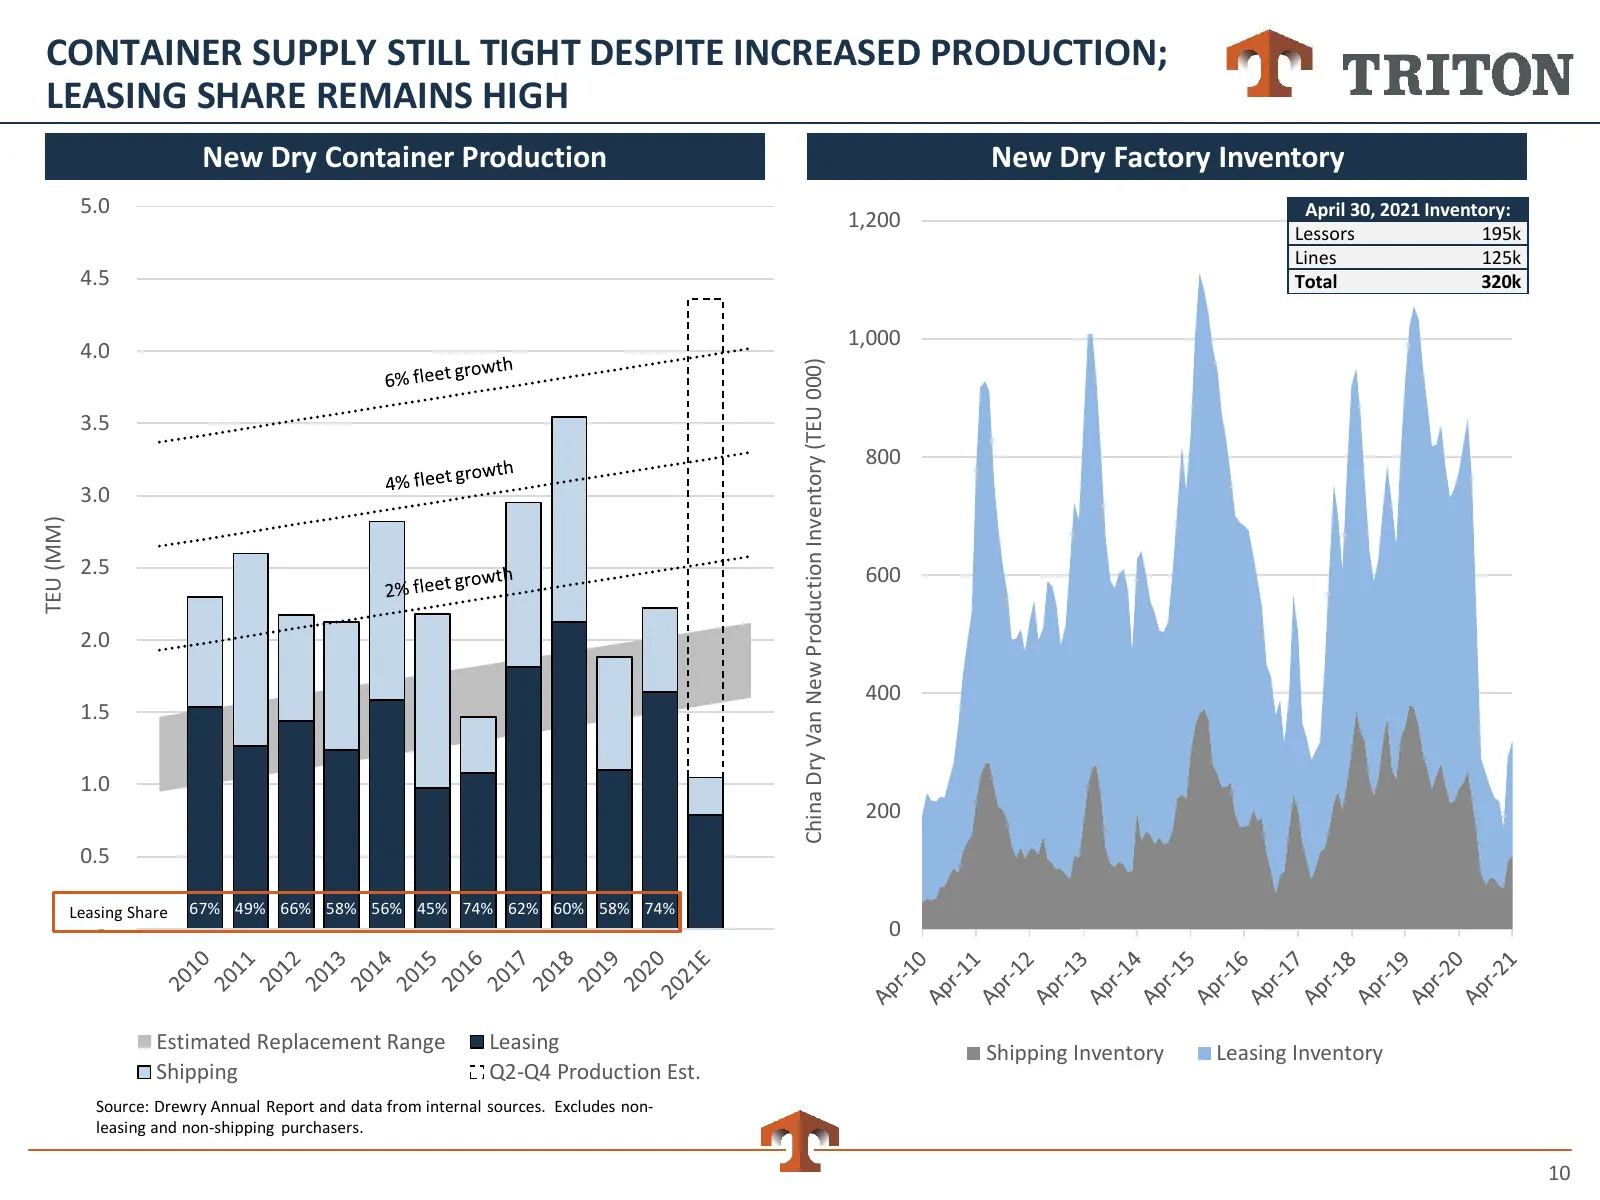
CONTAINER SUPPLY STILL TIGHT DESPITE INCREASED PRODUCTION; LEASING SHARE REMAINS HIGH New Dry Container Production New Dry Factory Inventory 5.0 April 30, 2021 Inventory: 1,200 Lessors 195k Lines 125k 4.5 Total 320k 1,000 4.0 China Dry Van New Production Inventory (TEU 000) 3.5 800 3.0 TEU (MM) 2.5
Slide 11: Strong Fleet Growth and Enhanced Lease Protections
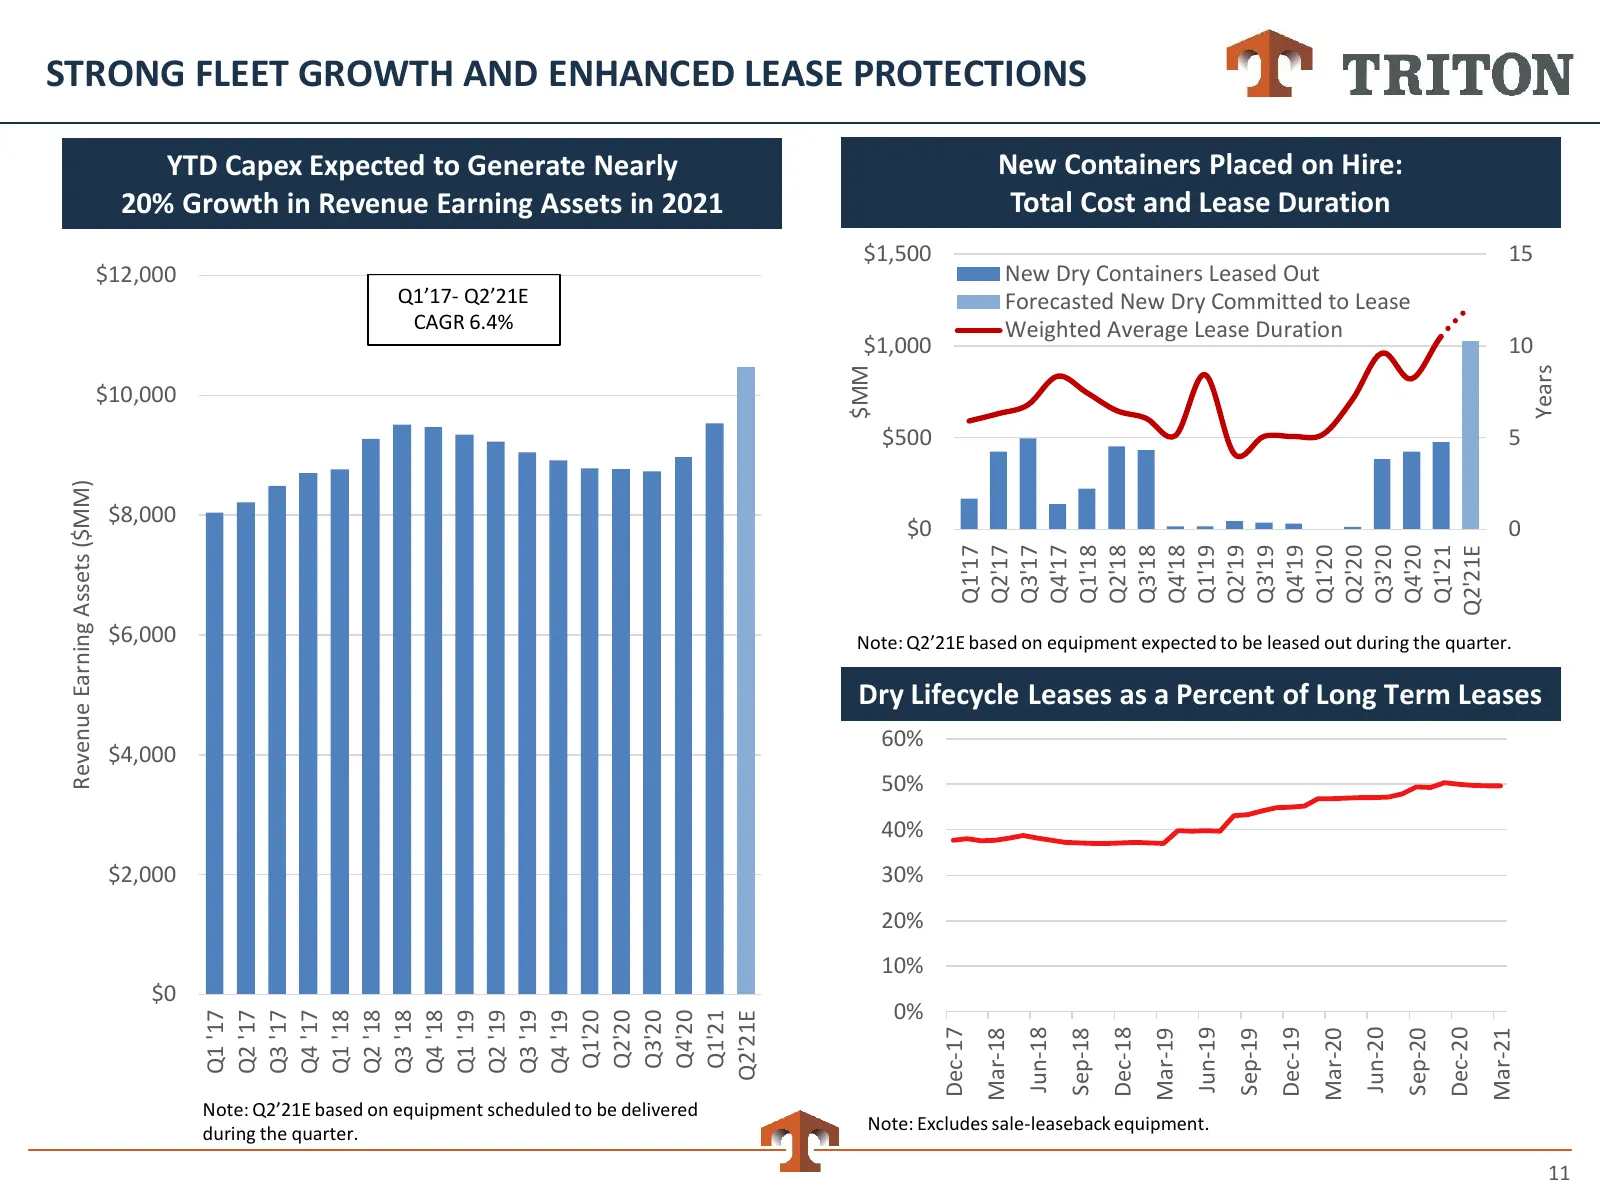
STRONG FLEET GROWTH AND ENHANCED LEASE PROTECTIONS YTD Capex Expected to Generate Nearly New Containers Placed on Hire: 20% Growth in Revenue Earning Assets in 2021 Total Cost and Lease Duration $1,500 15 $12,000 New Dry Containers Leased Out Q1’17- Q2’21E Forecasted New Dry Committed to Lease CAGR
Slide 12: Consolidated Statements of Adjusted Net Income
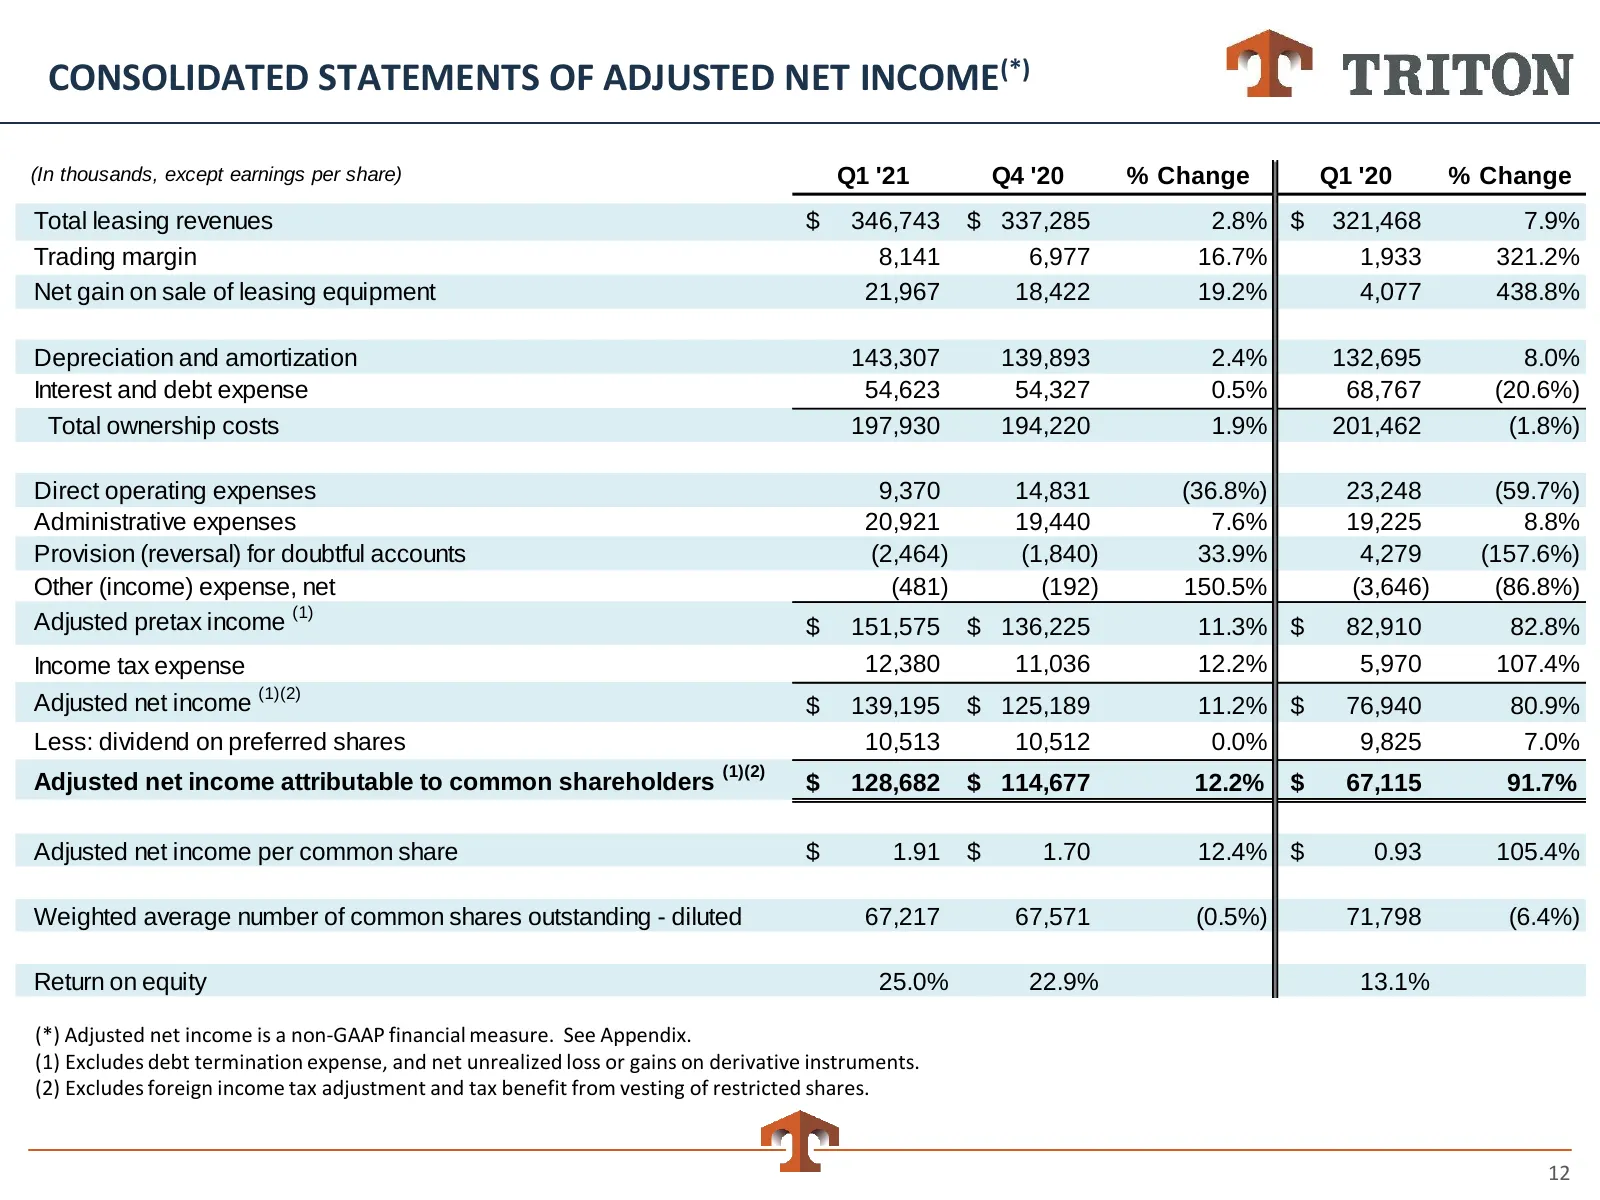
CONSOLIDATED STATEMENTS OF ADJUSTED NET INCOME(*) (In thousands, except earnings per share) Q1 '21 Q4 '20 % Change Q1 '20 % Change Total leasing revenues $ 346,743 $ 337,285 2.8% $ 321,468 7.9% Trading margin 8,141 6,977 16.7% 1,933 321.2% Net gain on sale of leasing equipment 21,967 18,422 19.2% 4,
Slide 13: Strong Balance Sheet and Liquidity
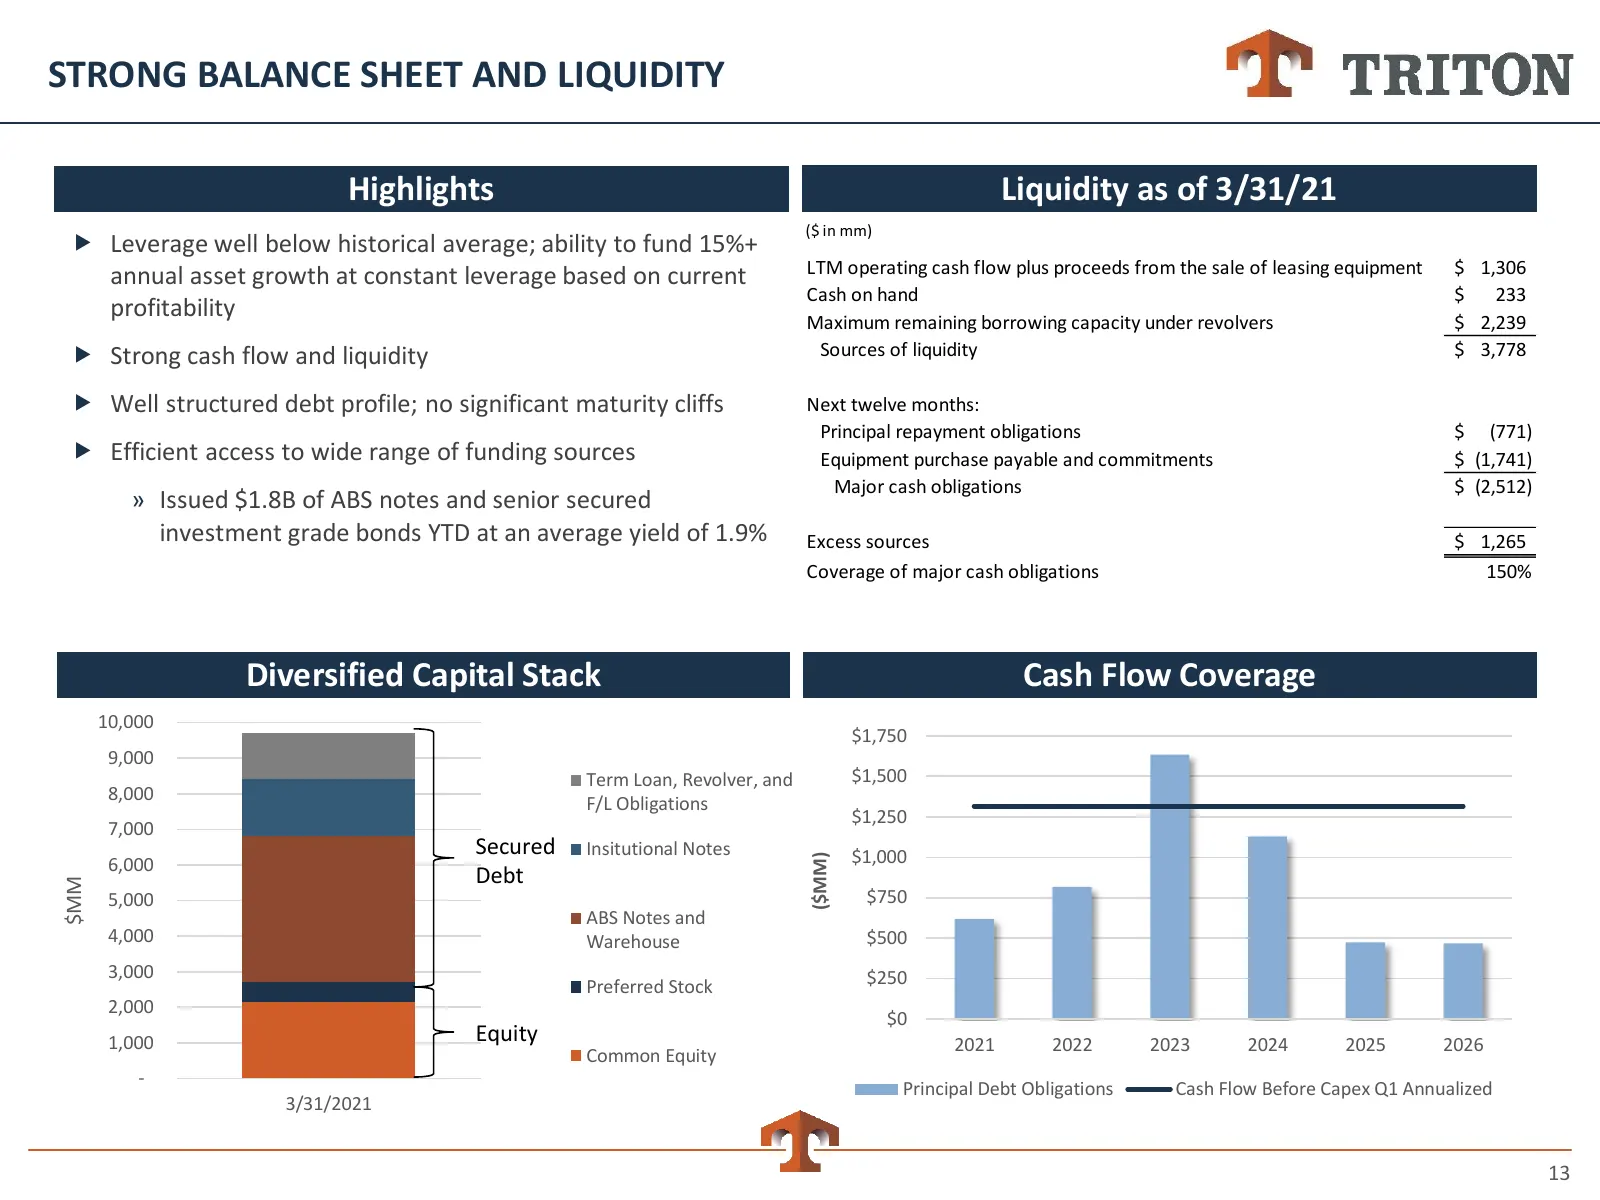
STRONG BALANCE SHEET AND LIQUIDITY Highlights Liquidity as of 3/31/21 ($ in mm) Leverage well below historical average; ability to fund 15%+ LTM operating cash flow plus proceeds from the sale of leasing equipment $ 1,306 annual asset growth at constant leverage based on current Cash on hand $ 233
Slide 14: Stable Cash Flows and Steady Shareholder Value Creation
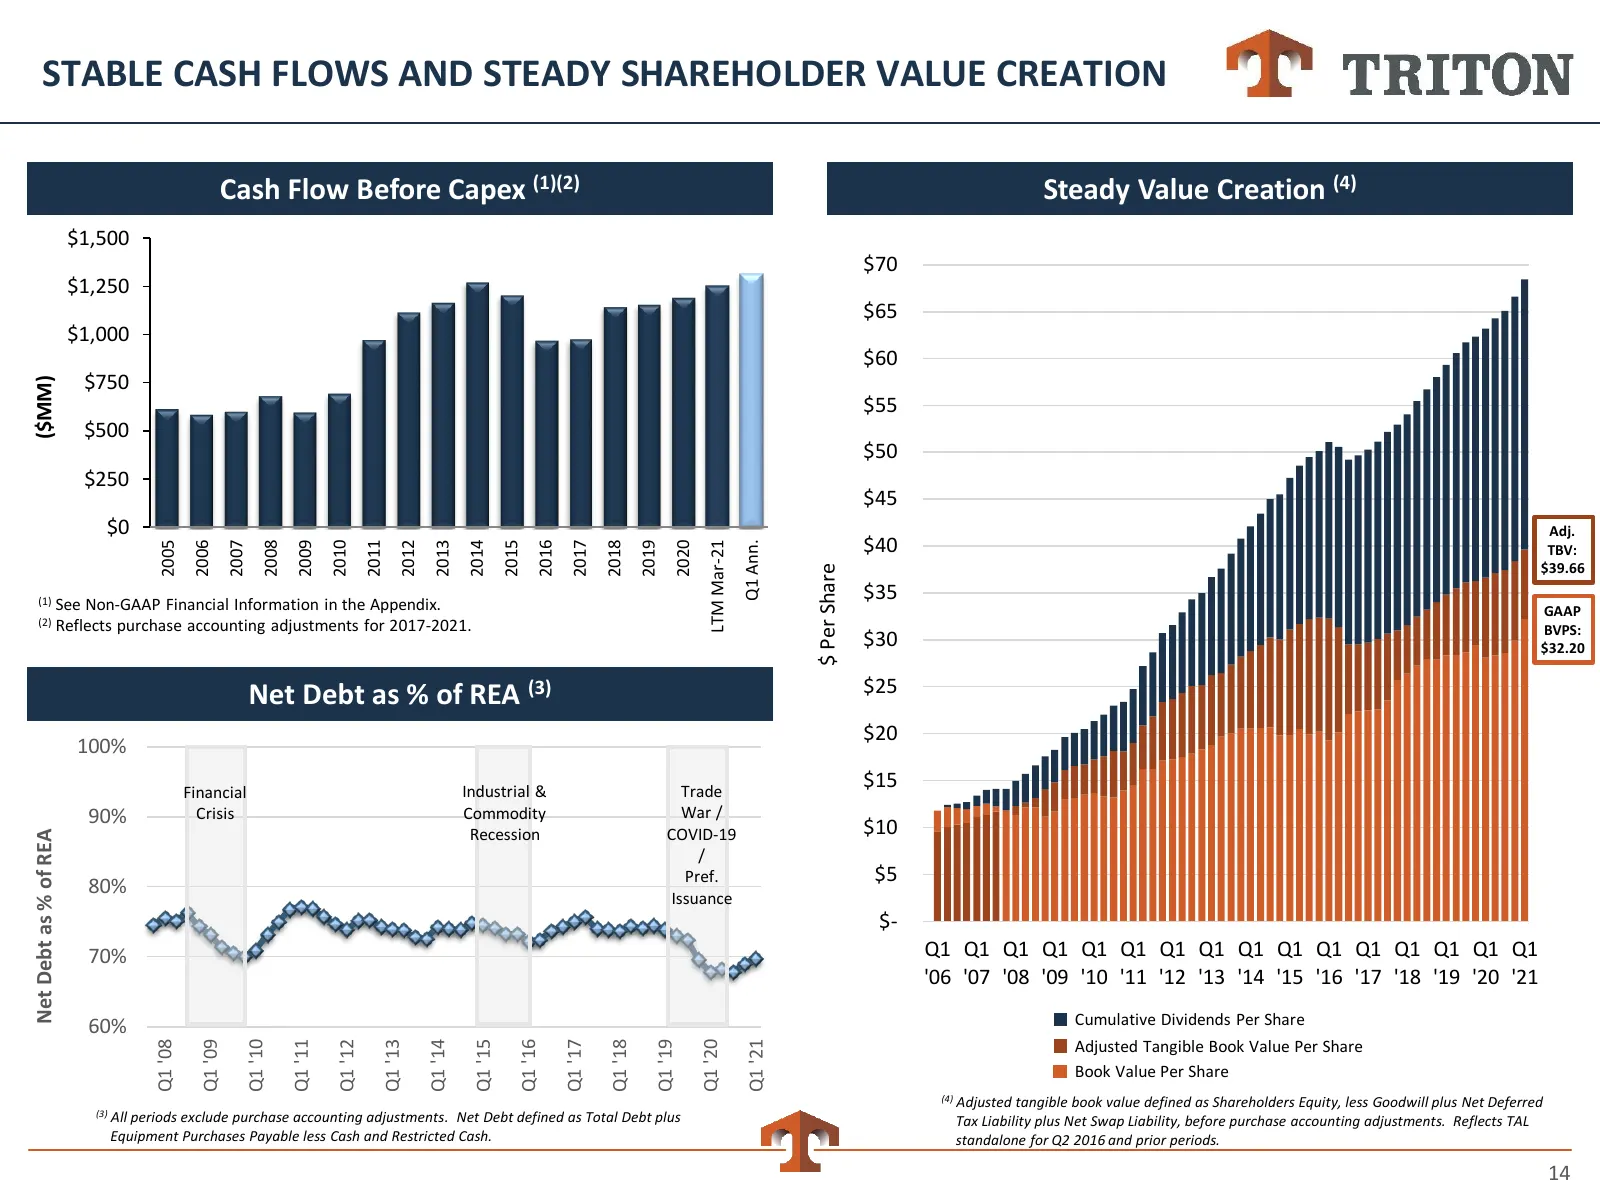
STABLE CASH FLOWS AND STEADY SHAREHOLDER VALUE CREATION Cash Flow Before Capex (1)(2) Steady Value Creation (4) $1,500 $70 $1,250 $65 $1,000 $60 $750 ($MM) $55 $500 $50 $250 $45 $0 Adj. $40 Q1 Ann. 2008 2017 2005 2006 2007 2009 2010 2011 2012 2013 2014 2015 2016 2018 2019 2020 LTM Mar-21 TBV: $39.66
Slide 15: Flexible and Strategic Approach to Capital Allocation
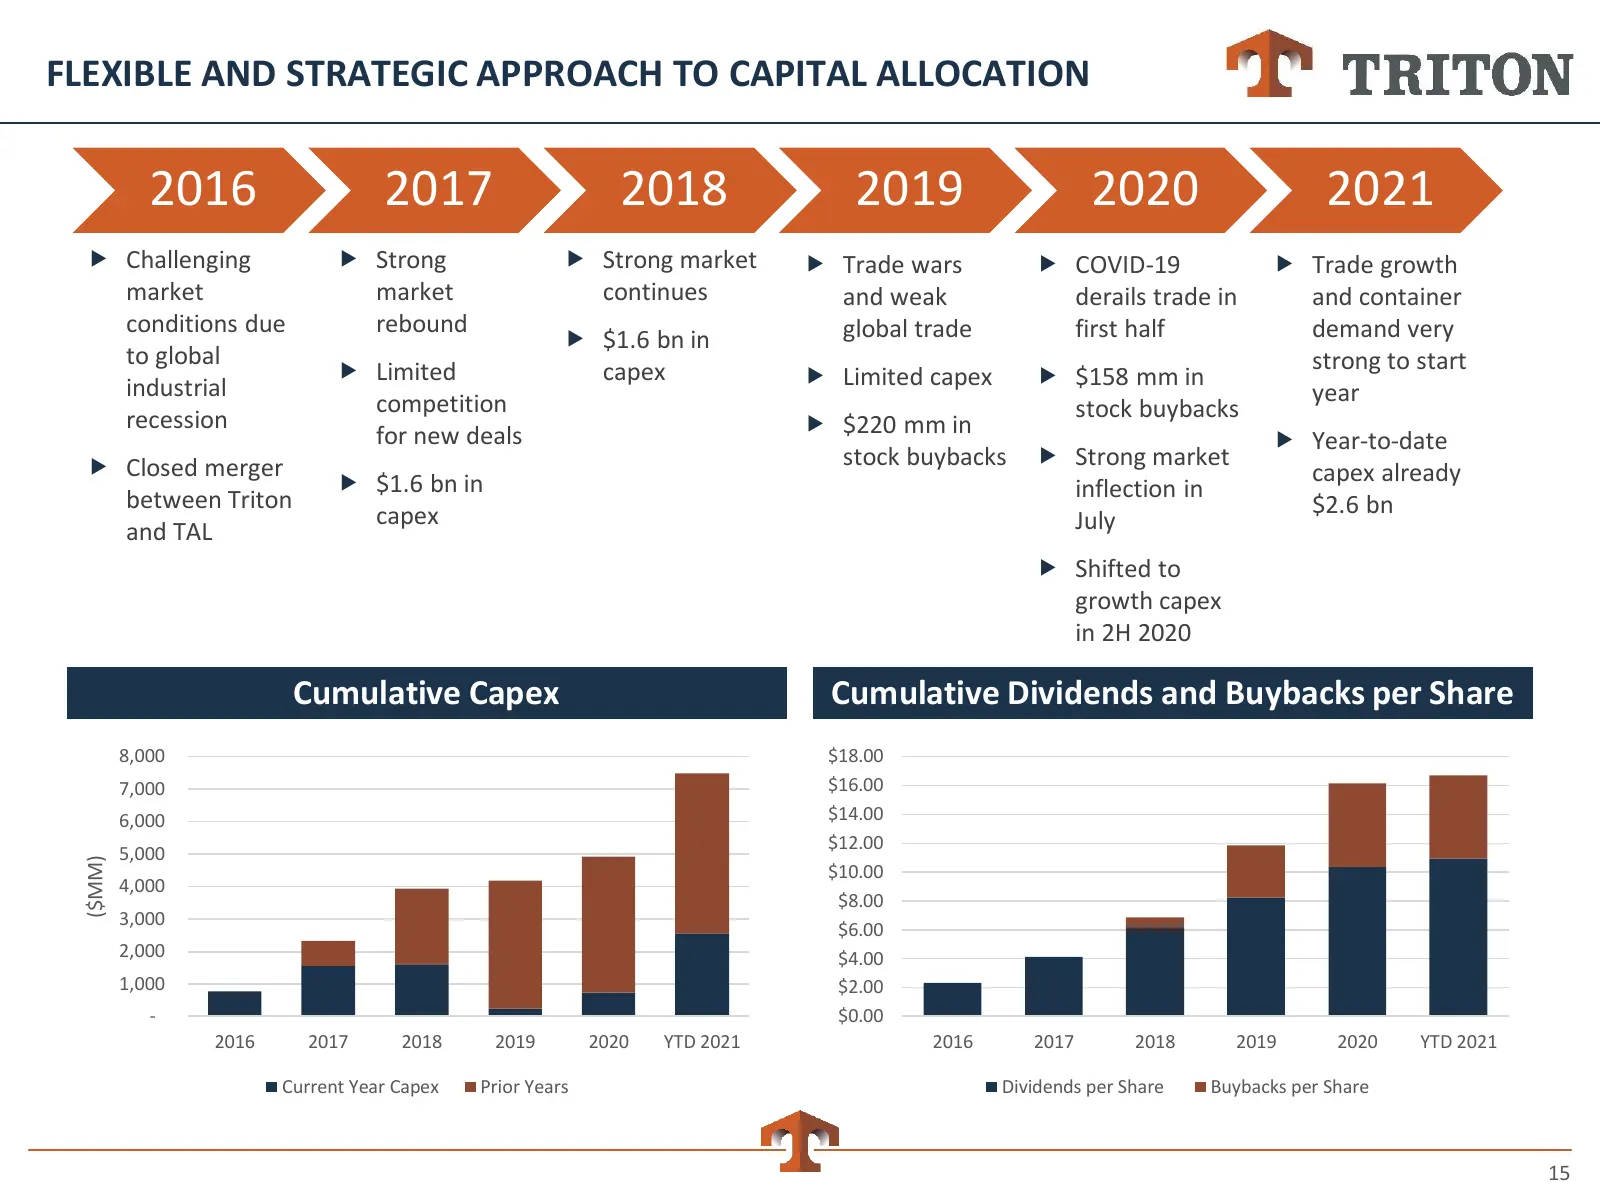
FLEXIBLE AND STRATEGIC APPROACH TO CAPITAL ALLOCATION 2016 2017 2018 2019 2020 2021 Challenging Strong Strong market Trade wars COVID-19 Trade growth market market continues and weak derails trade in and container conditions due rebound global trade first half demand very $1.6 bn in to
Slide 16: Triton's Scale Provides Cost and Capability Advantages
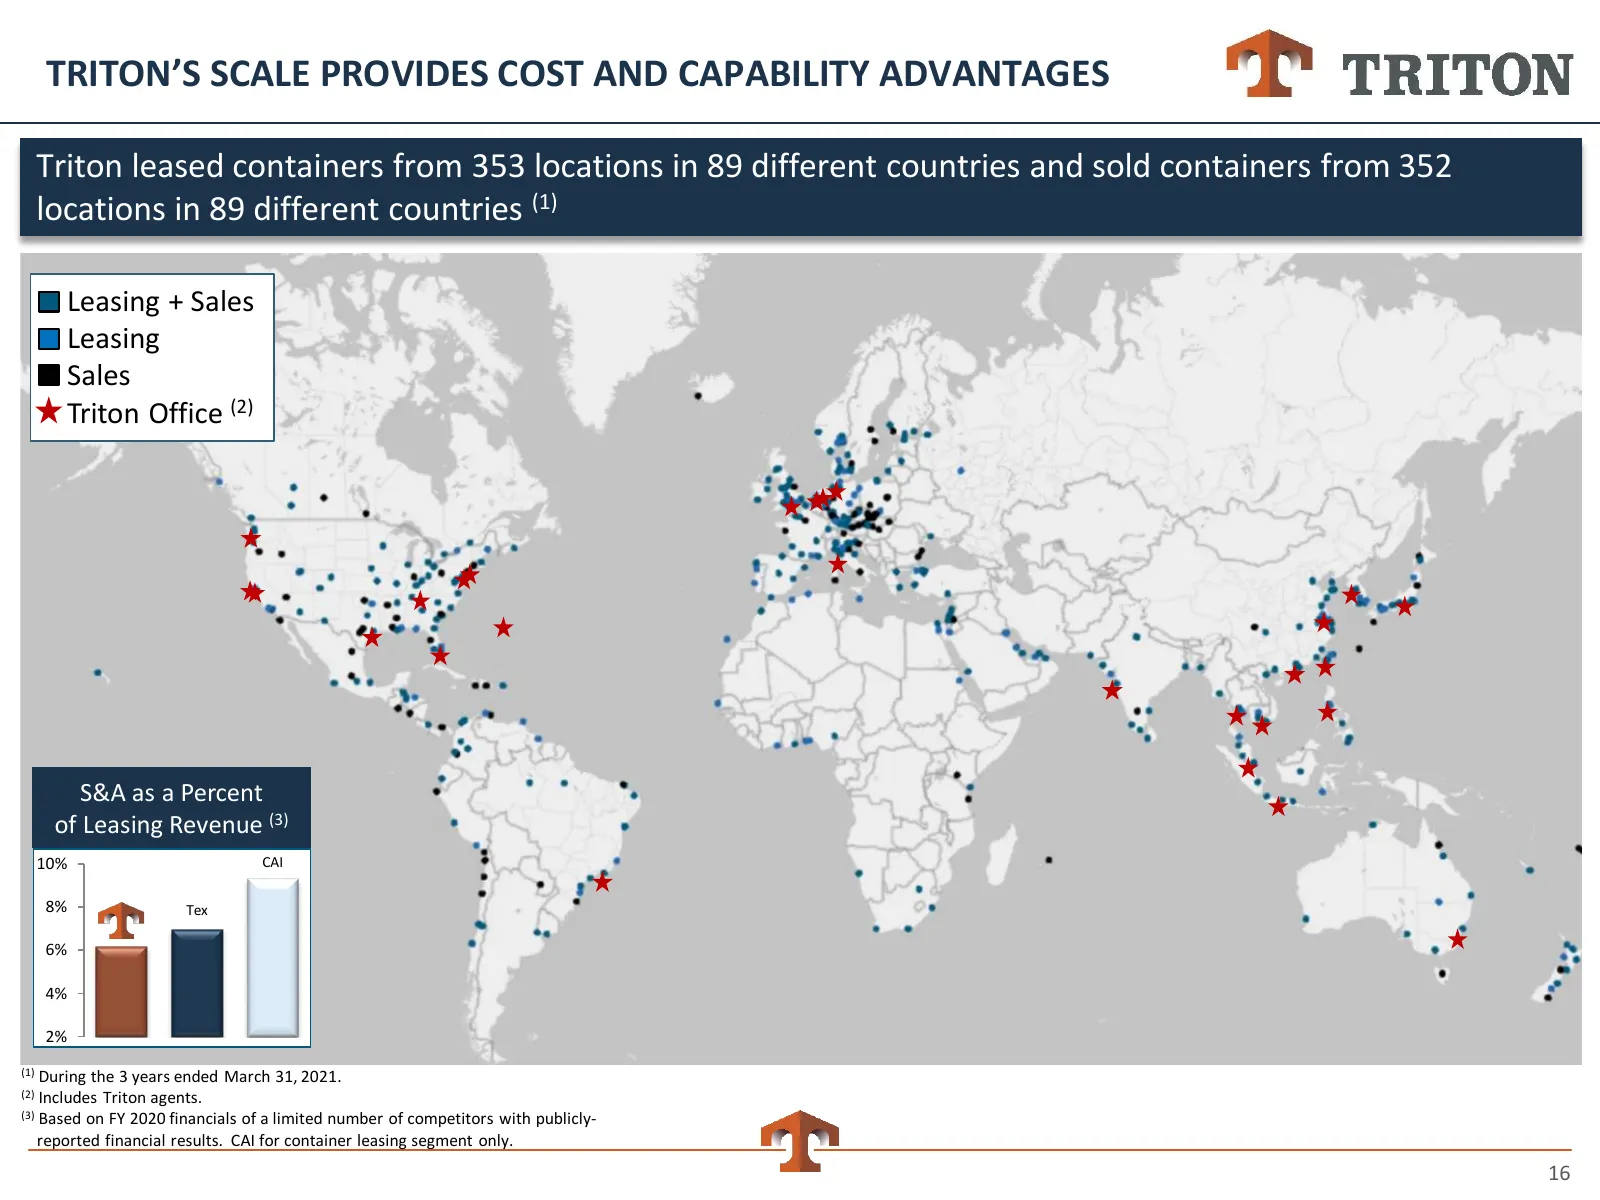
TRITON’S SCALE PROVIDES COST AND CAPABILITY ADVANTAGES Triton leased containers from 353 locations in 89 different countries and sold containers from 352 locations in 89 different countries (1) Leasing + Sales Leasing Sales Triton Office (2) S&A as a Percent of Leasing Revenue (3) 10% CAI 8% Tex 6%
Slide 17: Customer Consolidation Favors Largest Suppliers
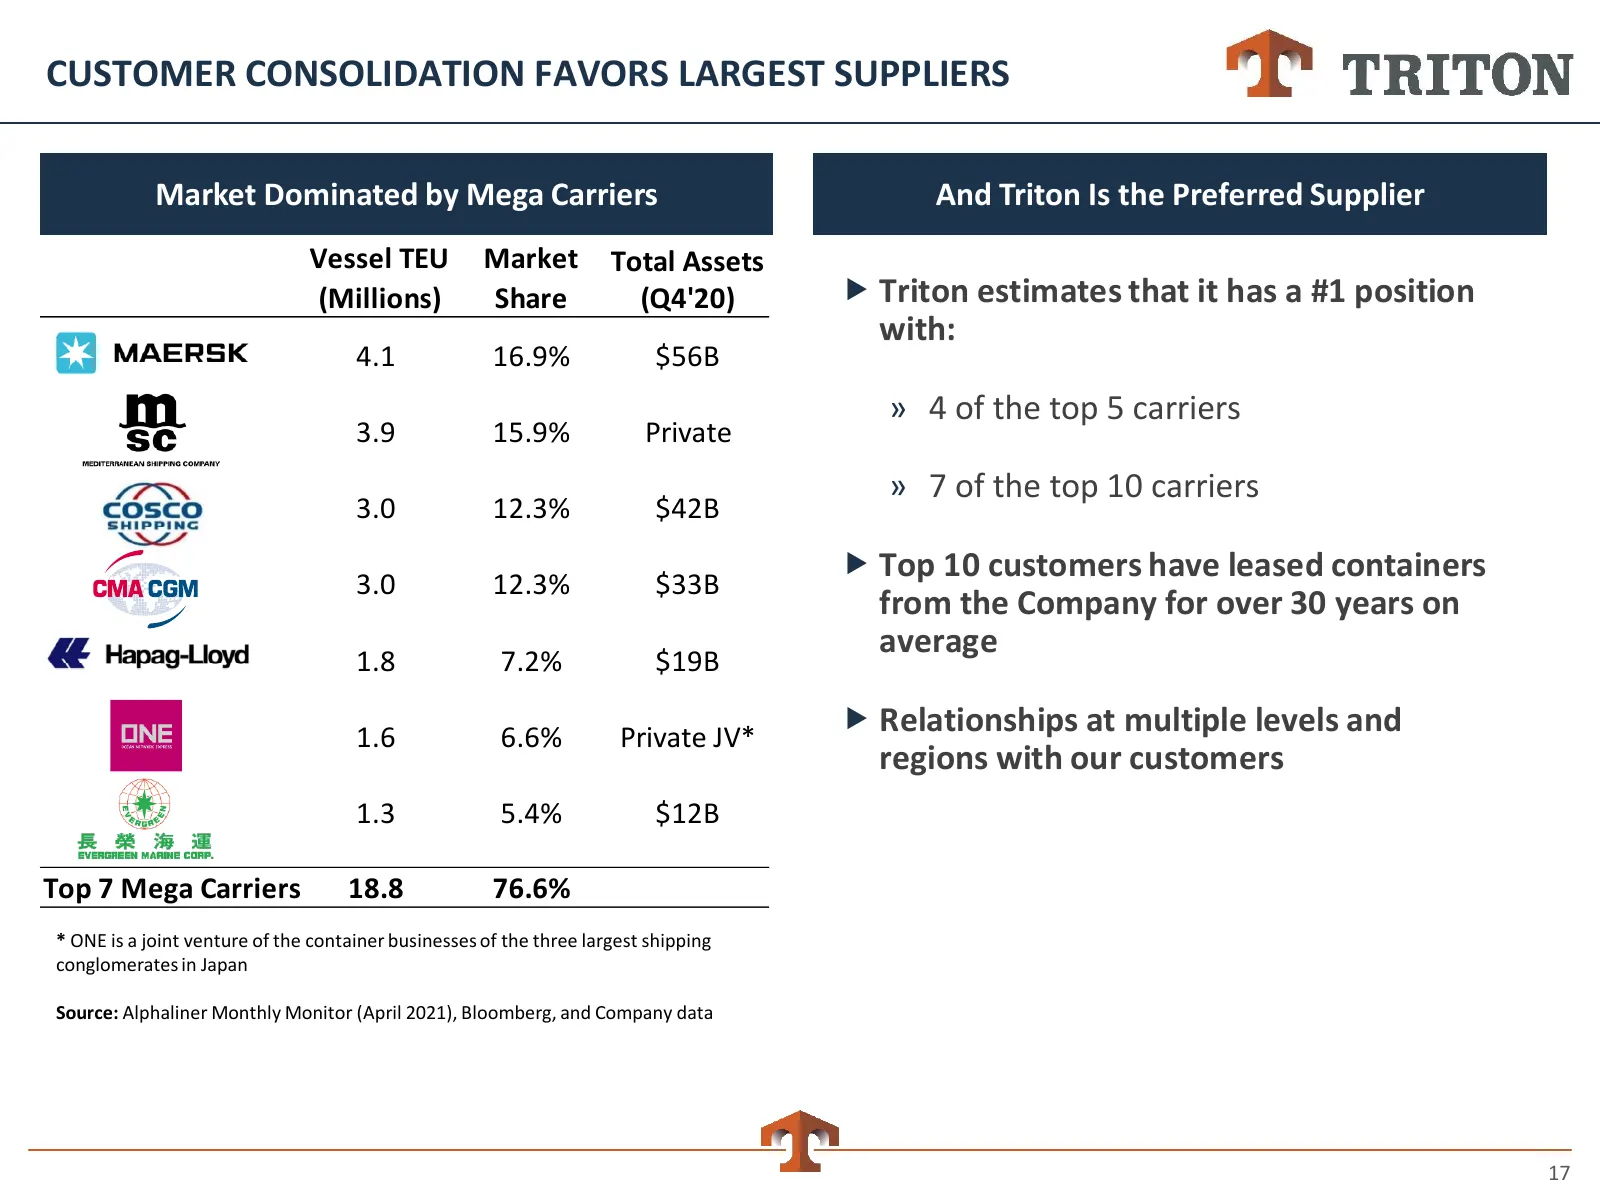
CUSTOMER CONSOLIDATION FAVORS LARGEST SUPPLIERS Market Dominated by Mega Carriers And Triton Is the Preferred Supplier Vessel TEU Market Total Assets (Millions) Share (Q4'20) Triton estimates that it has a #1 position with: 4.1 16.9% $56B » 4 of the top 5 carriers 3.9 15.9% Private » 7 of the top
Slide 18: Well-Positioned to Create Long-Term Value
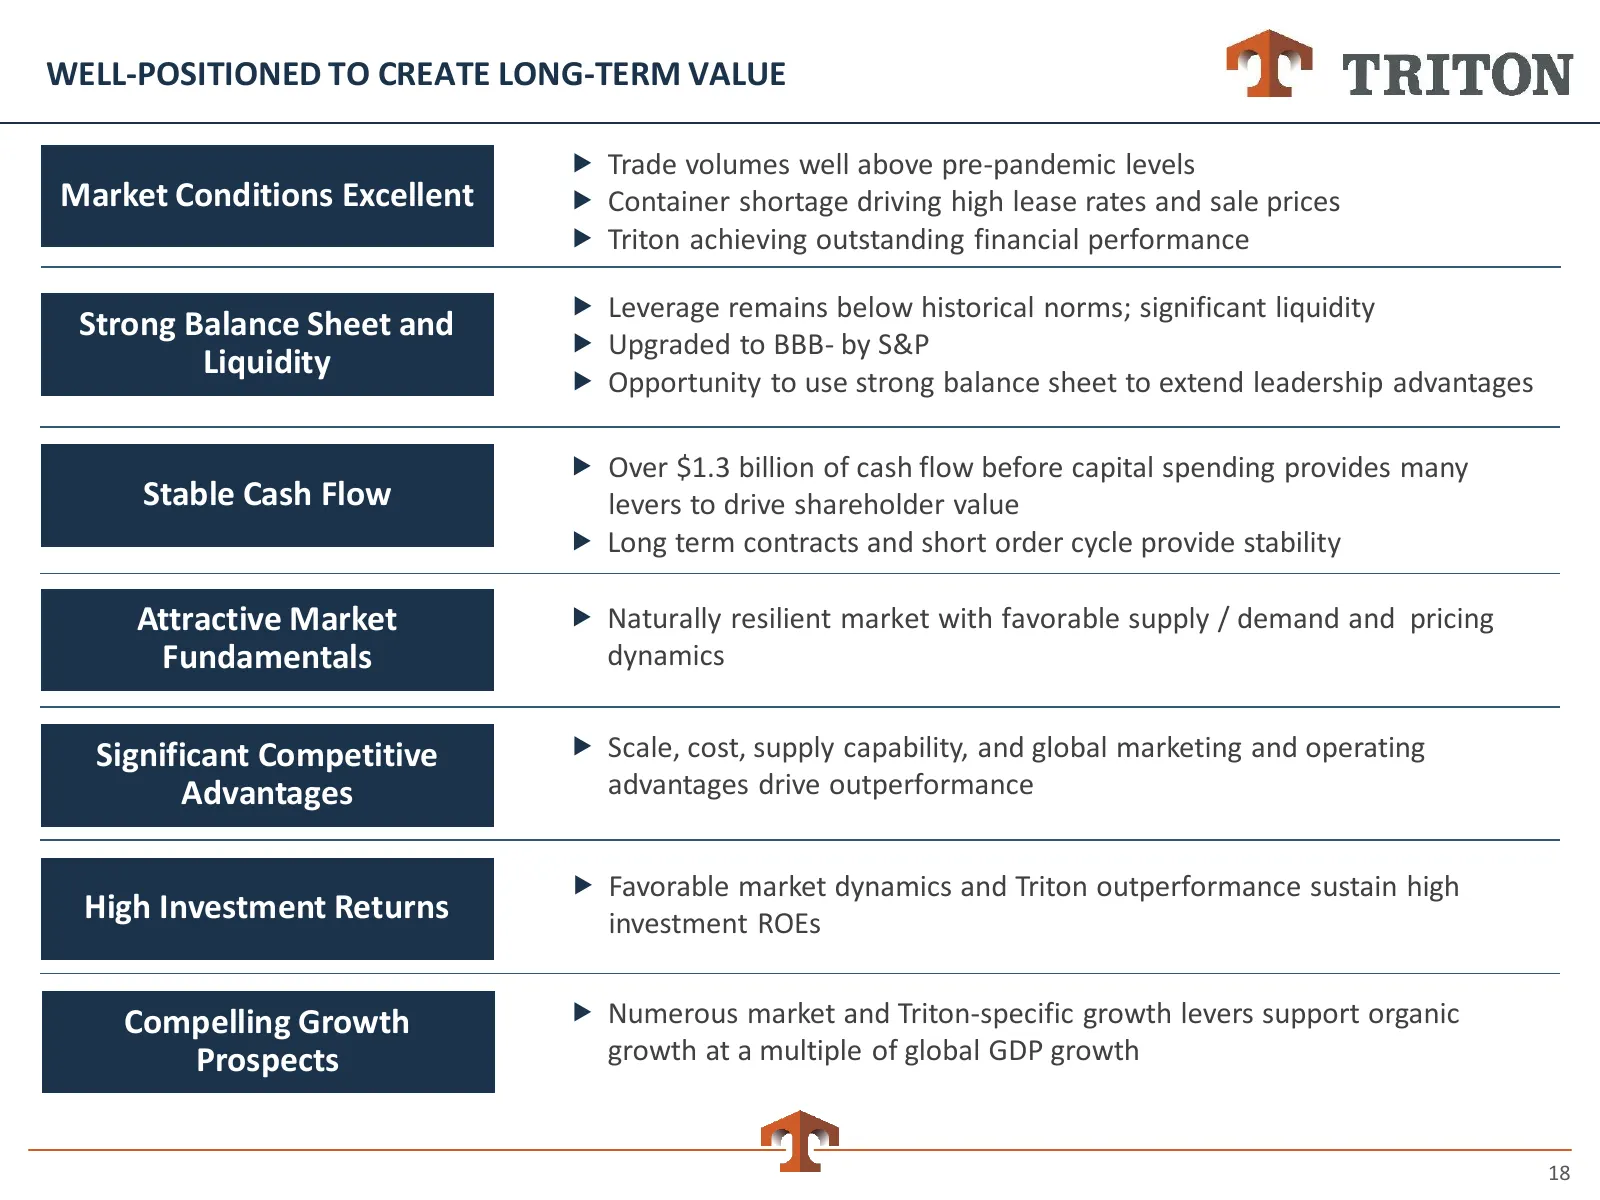
WELL-POSITIONED TO CREATE LONG-TERM VALUE Trade volumes well above pre-pandemic levels Market Conditions Excellent Container shortage driving high lease rates and sale prices Triton achieving outstanding financial performance Leverage remains below historical norms; significant liquidity Str
Slide 19: Appendix
Appendix 19
Slide 20: Attractive Fundamentals Reinforced by Triton Advantages
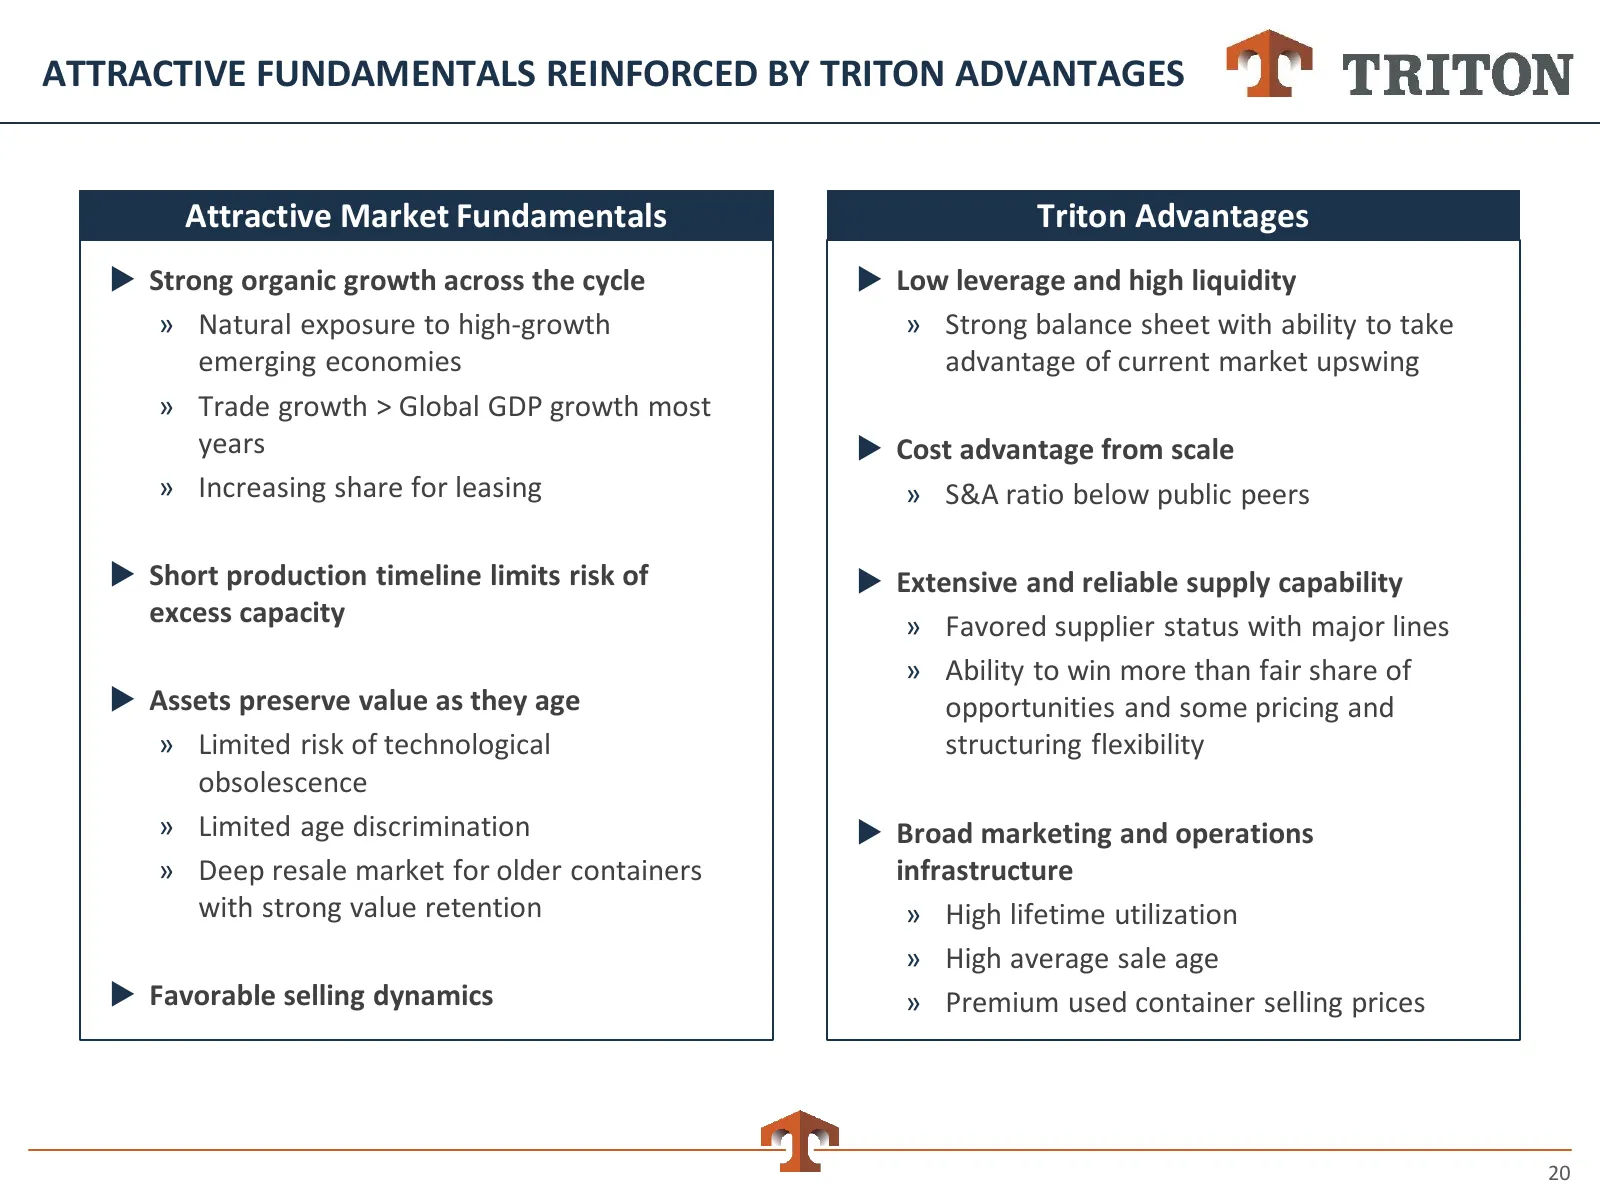
ATTRACTIVE FUNDAMENTALS REINFORCED BY TRITON ADVANTAGES Attractive Market Fundamentals Triton Advantages Strong organic growth across the cycle Low leverage and high liquidity » Natural exposure to high-growth » Strong balance sheet with ability to take emerging economies advantage of current ma
Slide 21: Equity Cash Flow
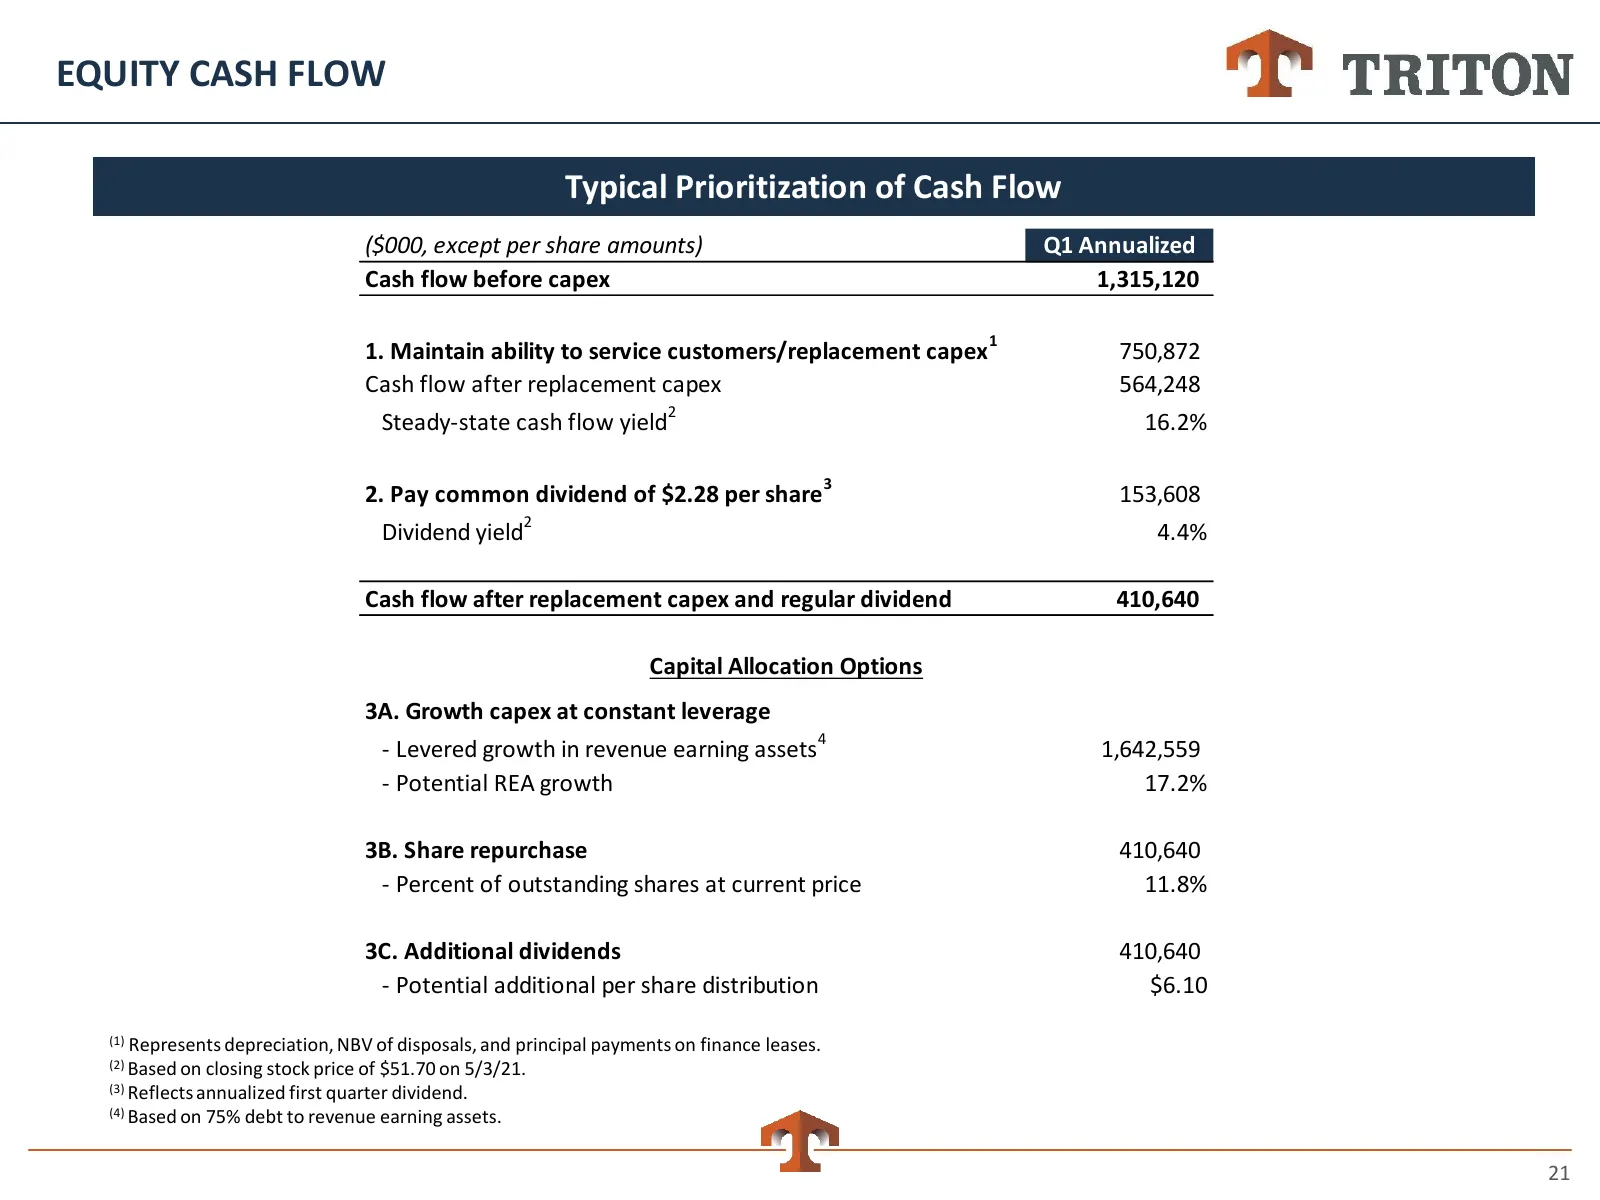
EQUITY CASH FLOW Typical Prioritization of Cash Flow ($000, except per share amounts) Q1 Annualized Cash flow before capex 1,315,120 1. Maintain ability to service customers/replacement capex 1 750,872 Cash flow after replacement capex 564,248 Steady-state cash flow yield2 16.2% 3 2. Pay common divi
Slide 22: Long Term Lease Expirations
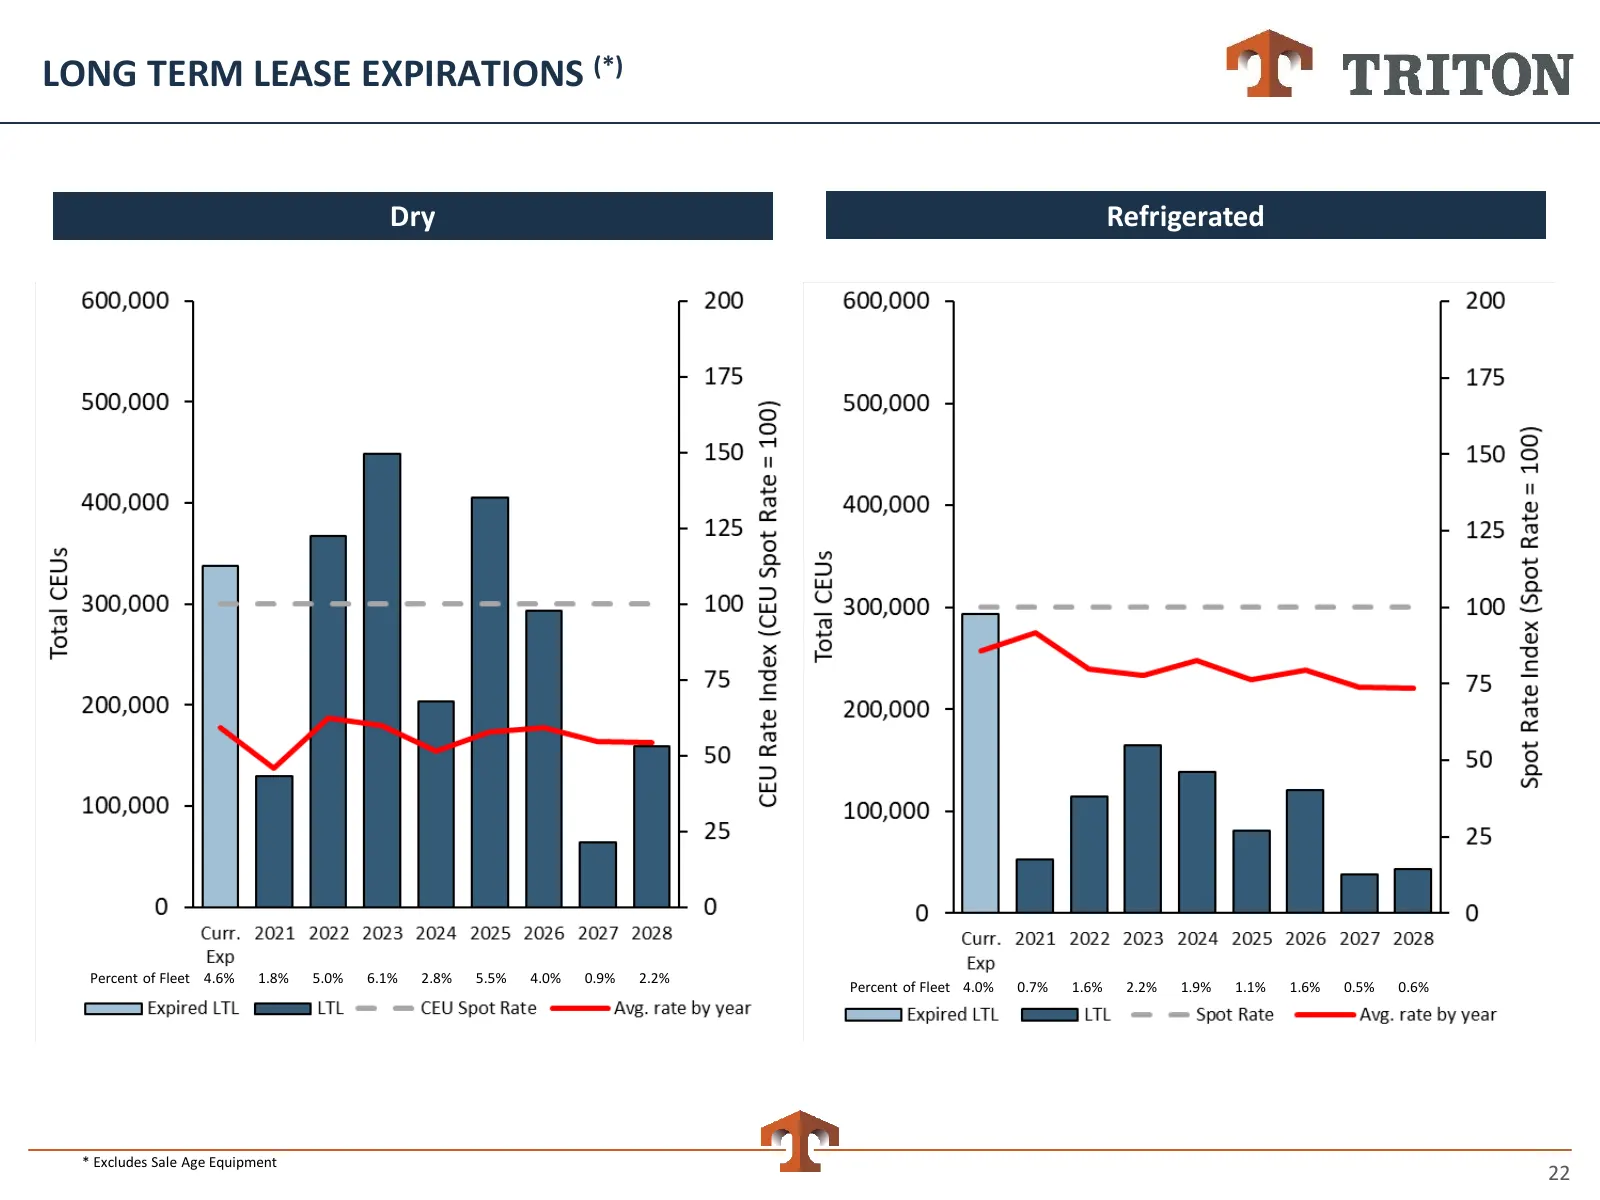
LONG TERM LEASE EXPIRATIONS (*) Dry Refrigerated Percent of Fleet 4.6% 1.8% 5.0% 6.1% 2.8% 5.5% 4.0% 0.9% 2.2% Percent of Fleet 4.0% 0.7% 1.6% 2.2% 1.9% 1.1% 1.6% 0.5% 0.6% * Excludes Sale Age Equipment 22
Slide 23: Adjusted Tangible Book Value Per Share as of 03/31/21
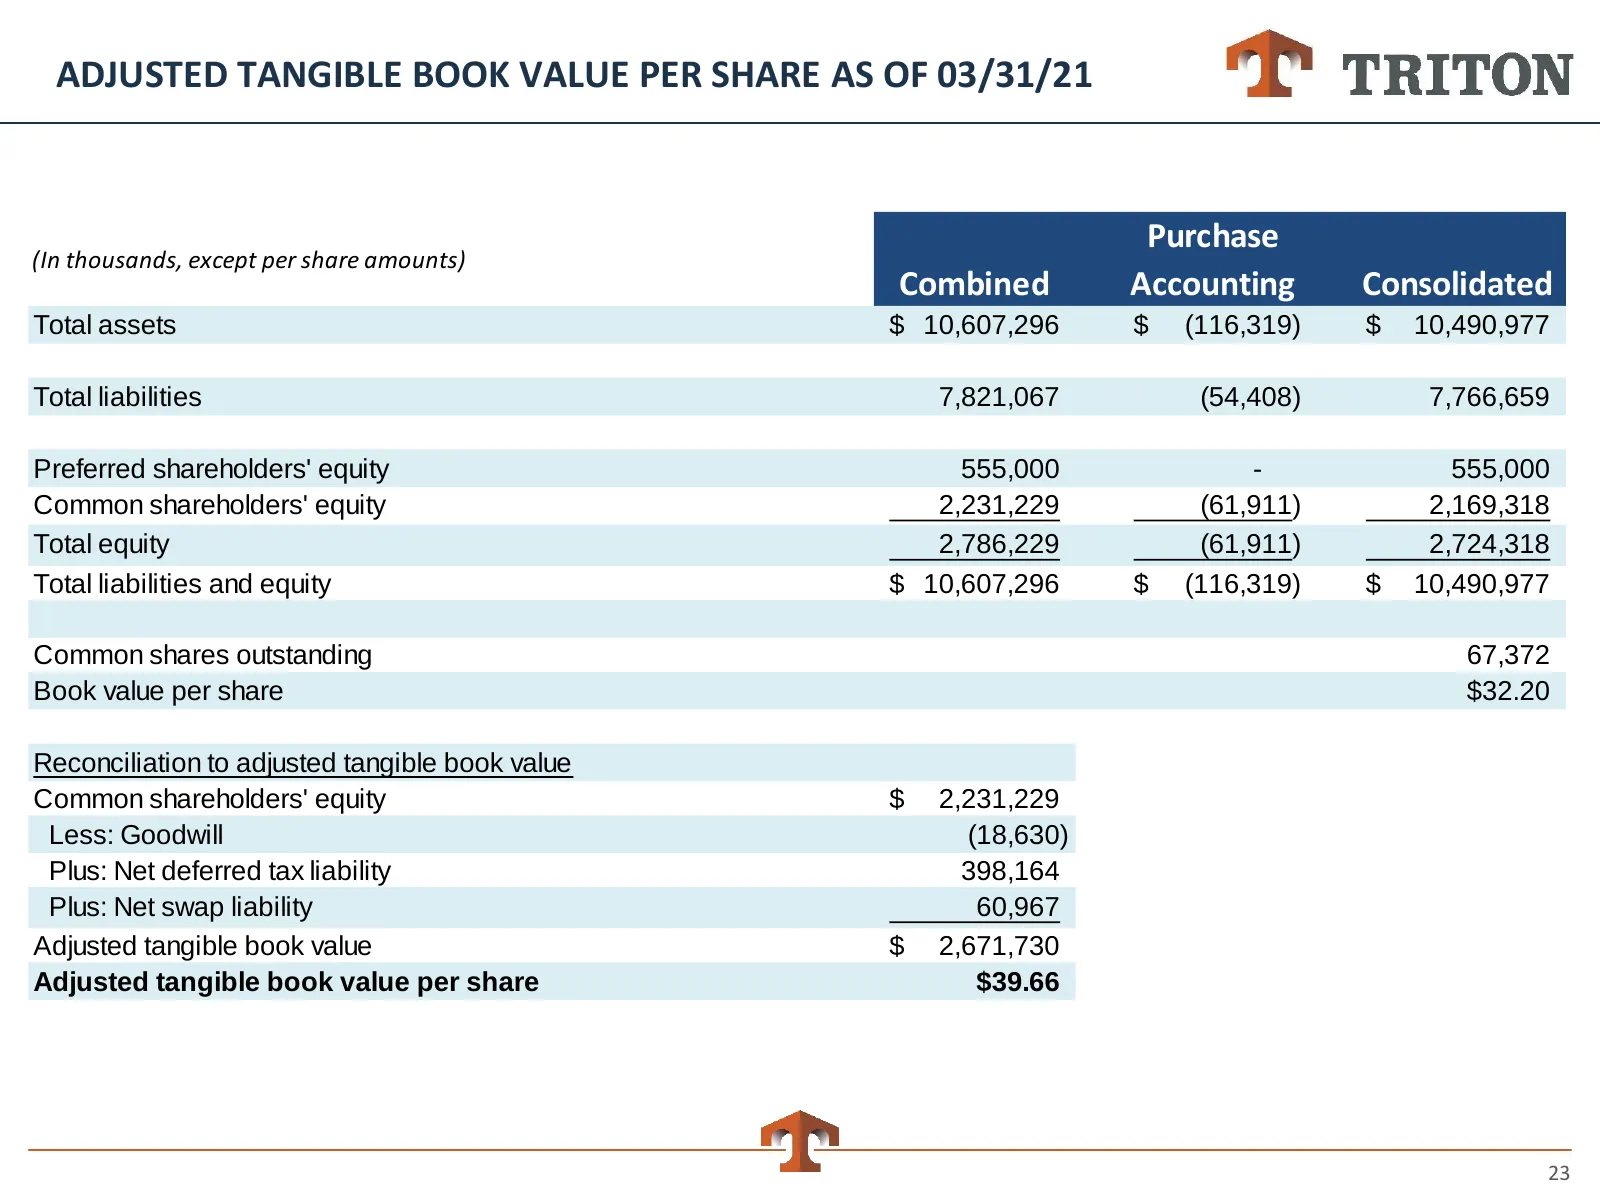
ADJUSTED TANGIBLE BOOK VALUE PER SHARE AS OF 03/31/21 Purchase (In thousands, except per share amounts) Combined Accounting Consolidated Total assets $ 10,607,296 $ (116,319) $ 10,490,977 Total liabilities 7,821,067 (54,408) 7,766,659 Preferred shareholders' equity 555,000 - 555,000 Common sharehold
Slide 24: Reconciliation of Non-GAAP Financial Information
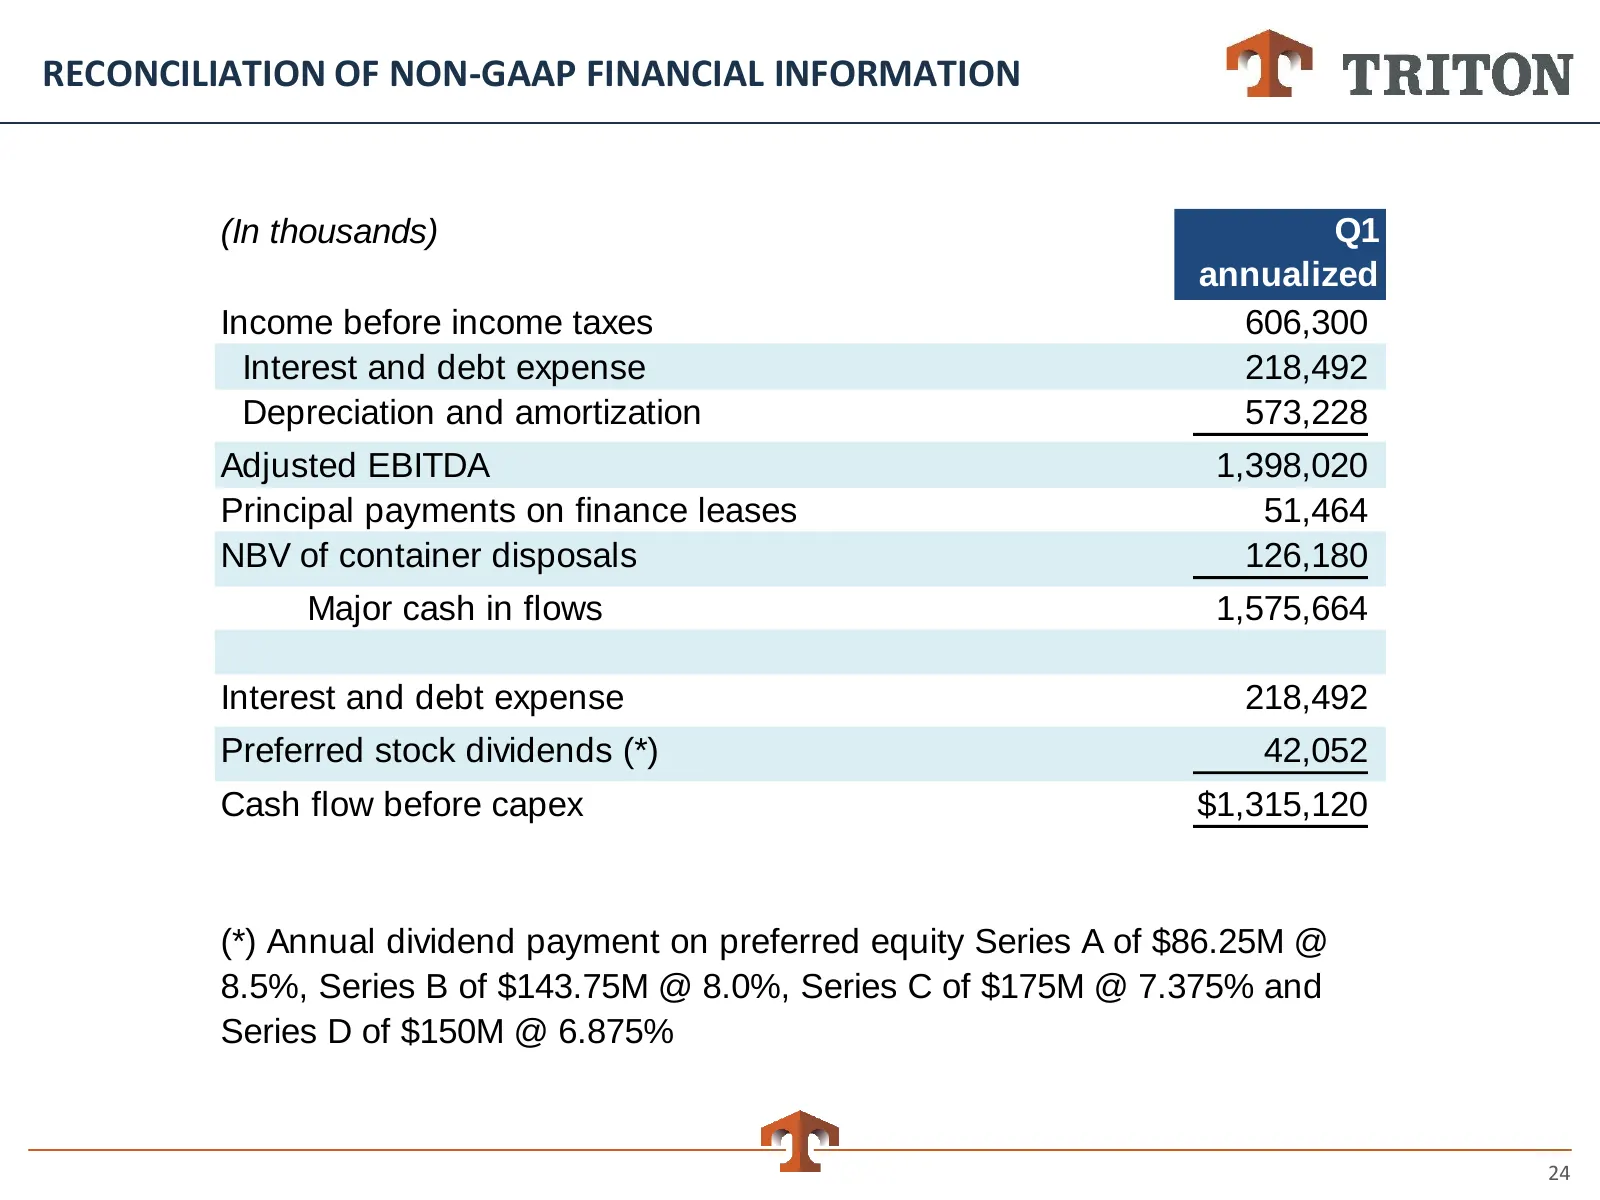
RECONCILIATION OF NON-GAAP FINANCIAL INFORMATION (In thousands) Q1 annualized Income before income taxes 606,300 Interest and debt expense 218,492 Depreciation and amortization 573,228 Adjusted EBITDA 1,398,020 Principal payments on finance leases 51,464 NBV of container disposals 126,180 Major cash
Slide 25: Consolidated Statements of Income
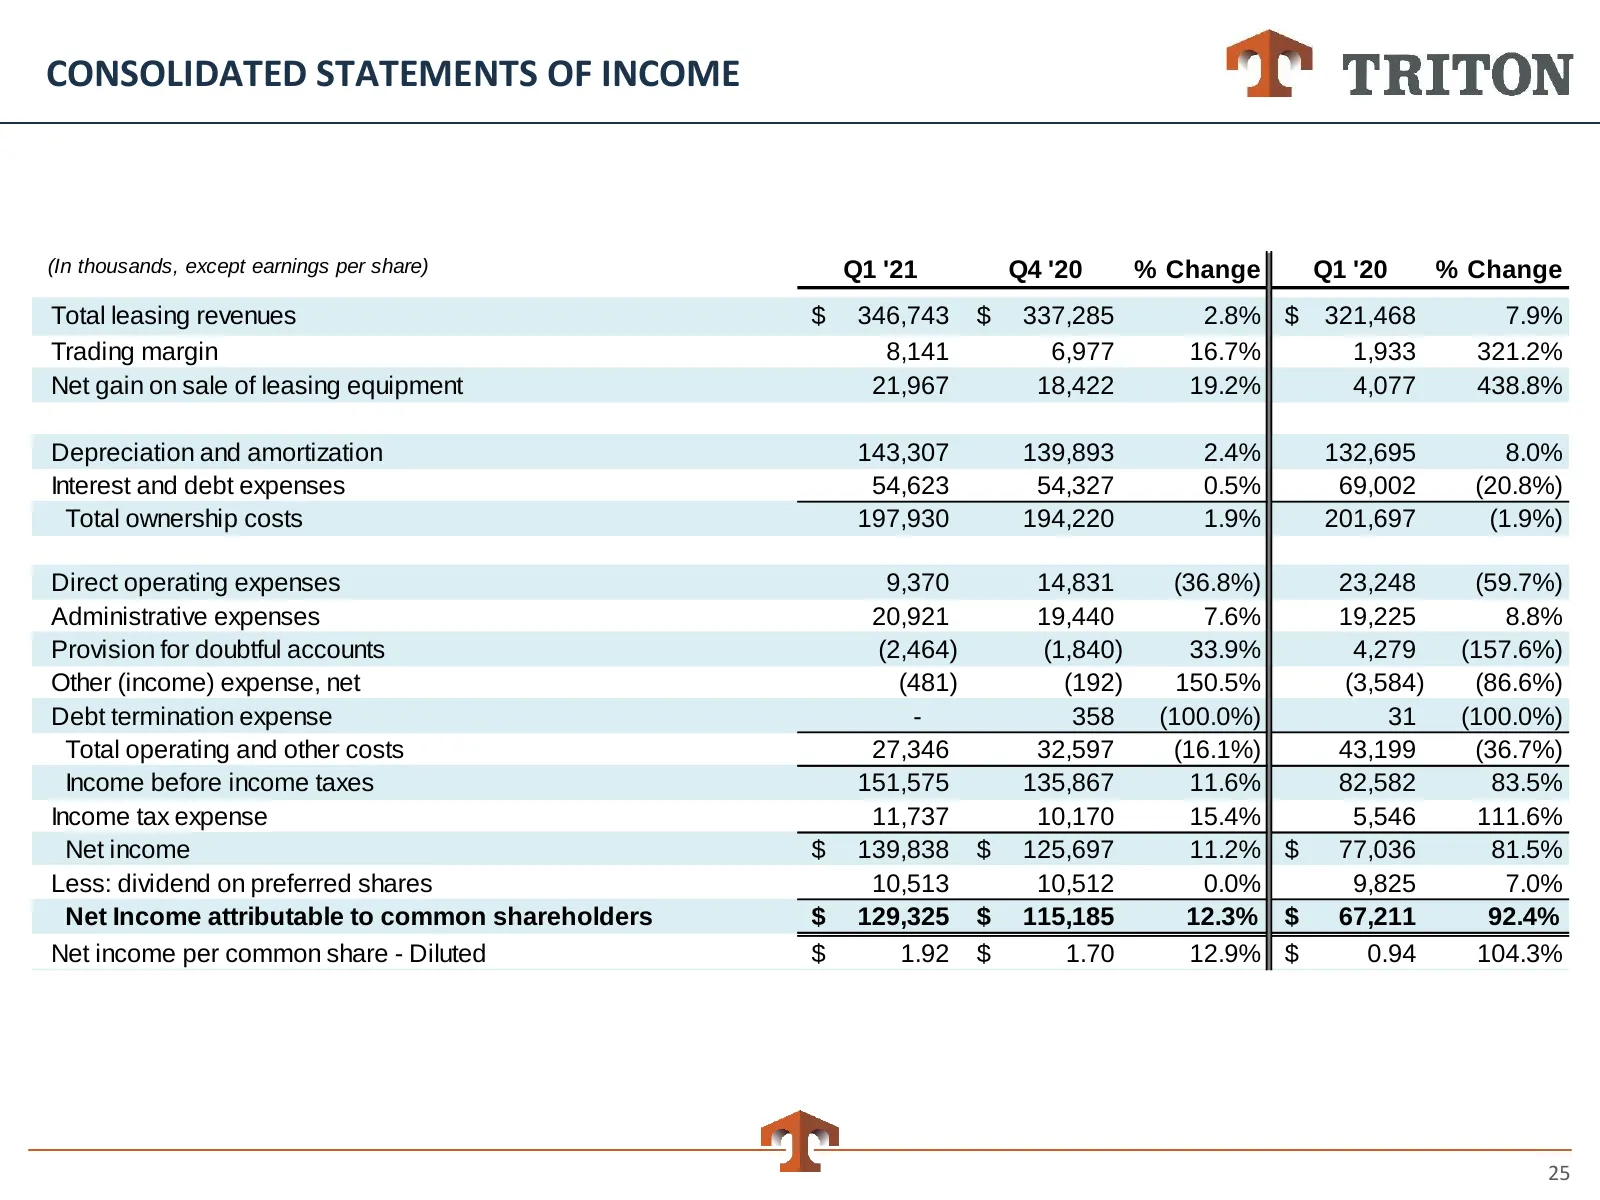
CONSOLIDATED STATEMENTS OF INCOME (In thousands, except earnings per share) Q1 '21 Q4 '20 % Change Q1 '20 % Change Total leasing revenues $ 346,743 $ 337,285 2.8% $ 321,468 7.9% Trading margin 8,141 6,977 16.7% 1,933 321.2% Net gain on sale of leasing equipment 21,967 18,422 19.2% 4,077 438.8% Depre
Slide 26: Reconciliation of Non-GAAP Financial Information
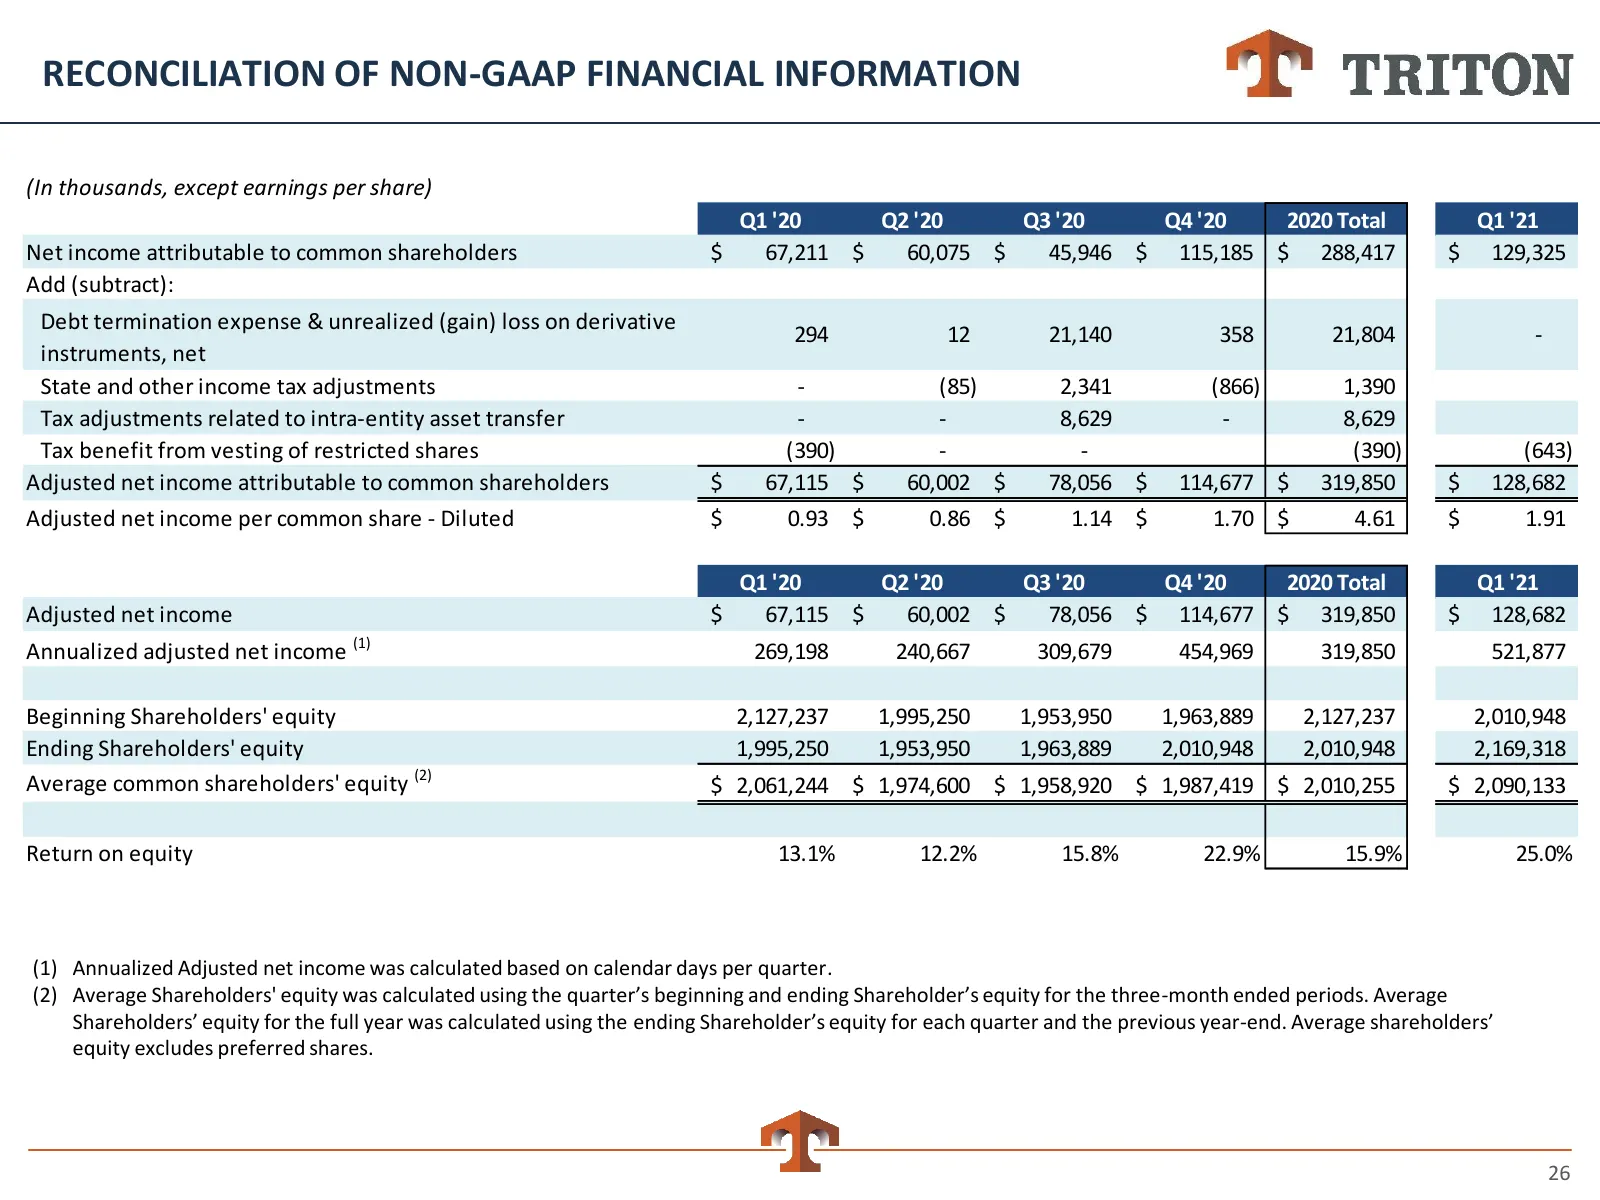
RECONCILIATION OF NON-GAAP FINANCIAL INFORMATION (In thousands, except earnings per share) Q1 '20 Q2 '20 Q3 '20 Q4 '20 2020 Total Q1 '21 Net income attributable to common shareholders $ 67,211 $ 60,075 $ 45,946 $ 115,185 $ 288,417 $ 129,325 Add (subtract): Debt termination expense & unrealized (gain
Slide 27: Non-GAAP Financial Information
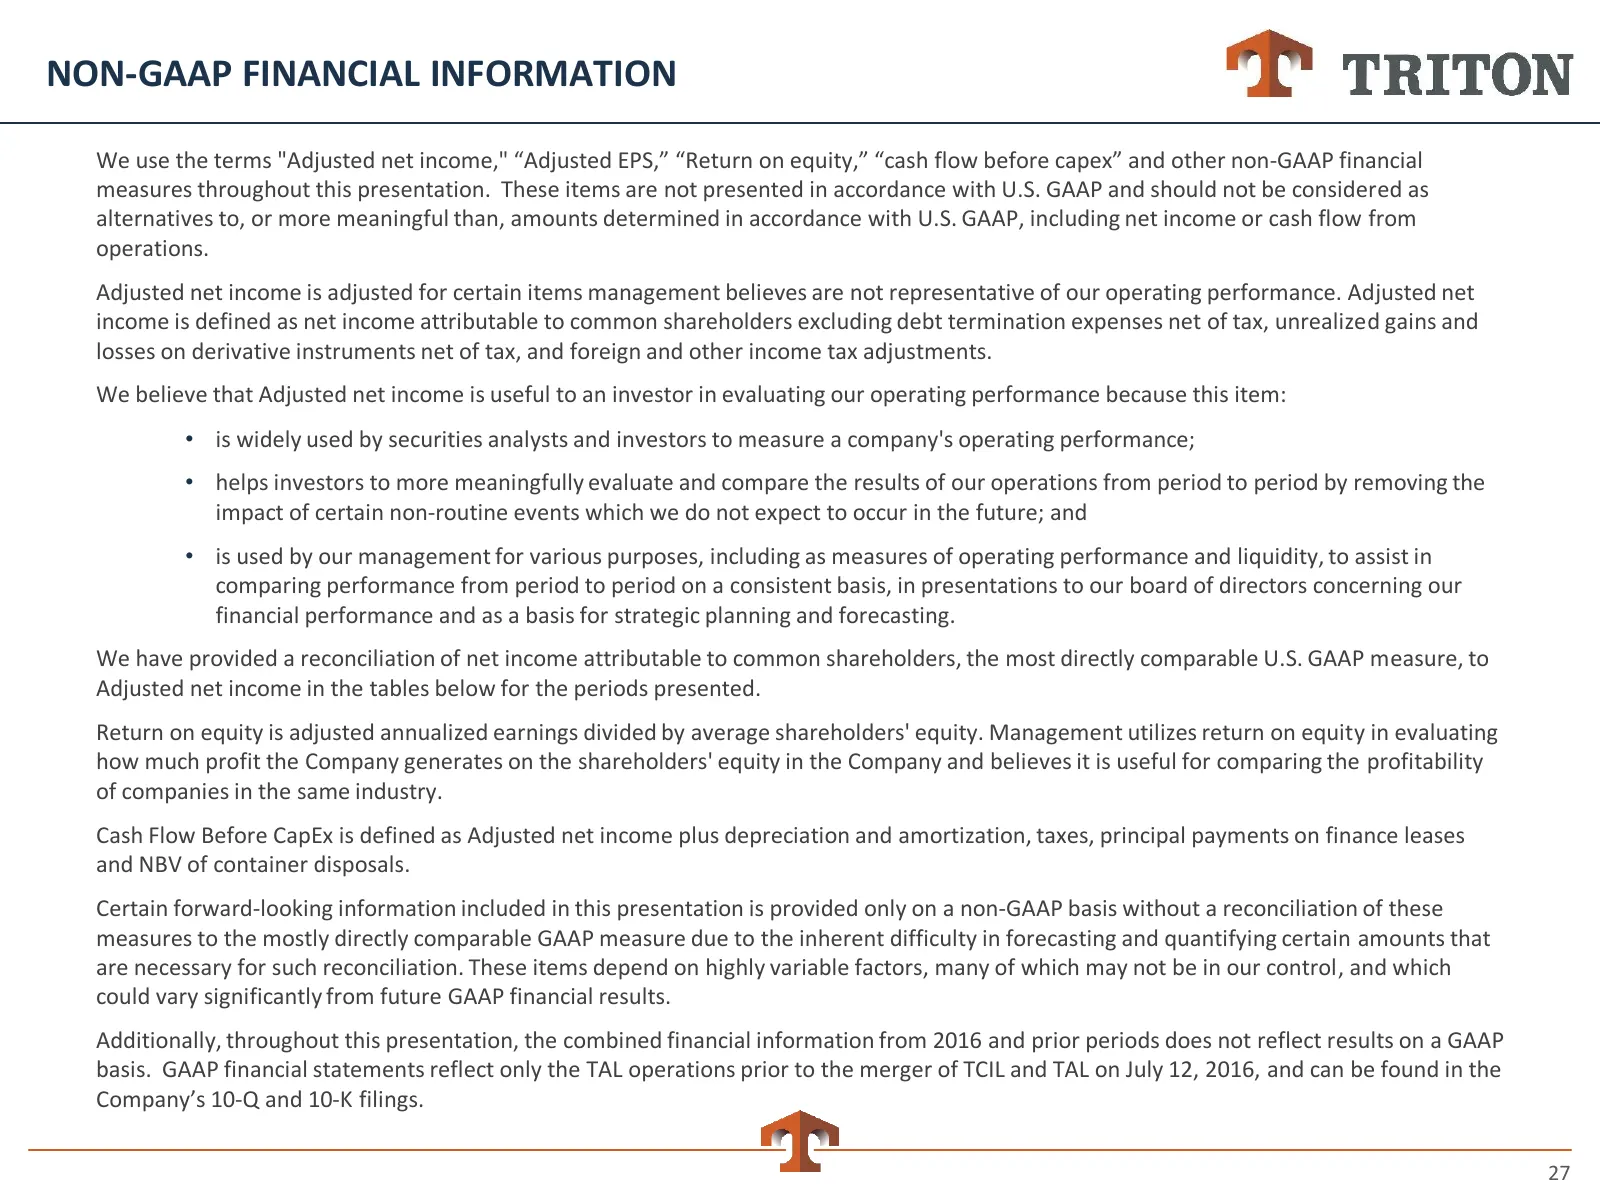
NON-GAAP FINANCIAL INFORMATION We use the terms "Adjusted net income," “Adjusted EPS,” “Return on equity,” “cash flow before capex” and other non-GAAP financial measures throughout this presentation. These items are not presented in accordance with U.S. GAAP and should not be considered as alternati
Source: Internet Archive copy of tritoninternational.com
More decks from Triton International Ltd.
 Q3 2026 Earnings Presentation14 slides · November 2026
 Q2 2026 Earnings Presentation14 slides · August 2026
 Q1 2026 Earnings Presentation14 slides · May 2026
 Q4 2025 Earnings Presentation12 slides · February 2026
 Investor Presentation (January 2026)12 slides · January 2026
 Q2 2025 Earnings Presentation13 slides · September 2025