MA Financial Group Limited · ASX:MAF
MA Financial — Moelis Australia — H1 2017 Earnings Presentation
24 slides from MA Financial's earnings presentation, August 2017
Slide 1: First Half 2017 Results
DRAFT First Half 2017 Results MOELIS AUSTRALIA
Slide 2: First Half 2017 Results Highlights
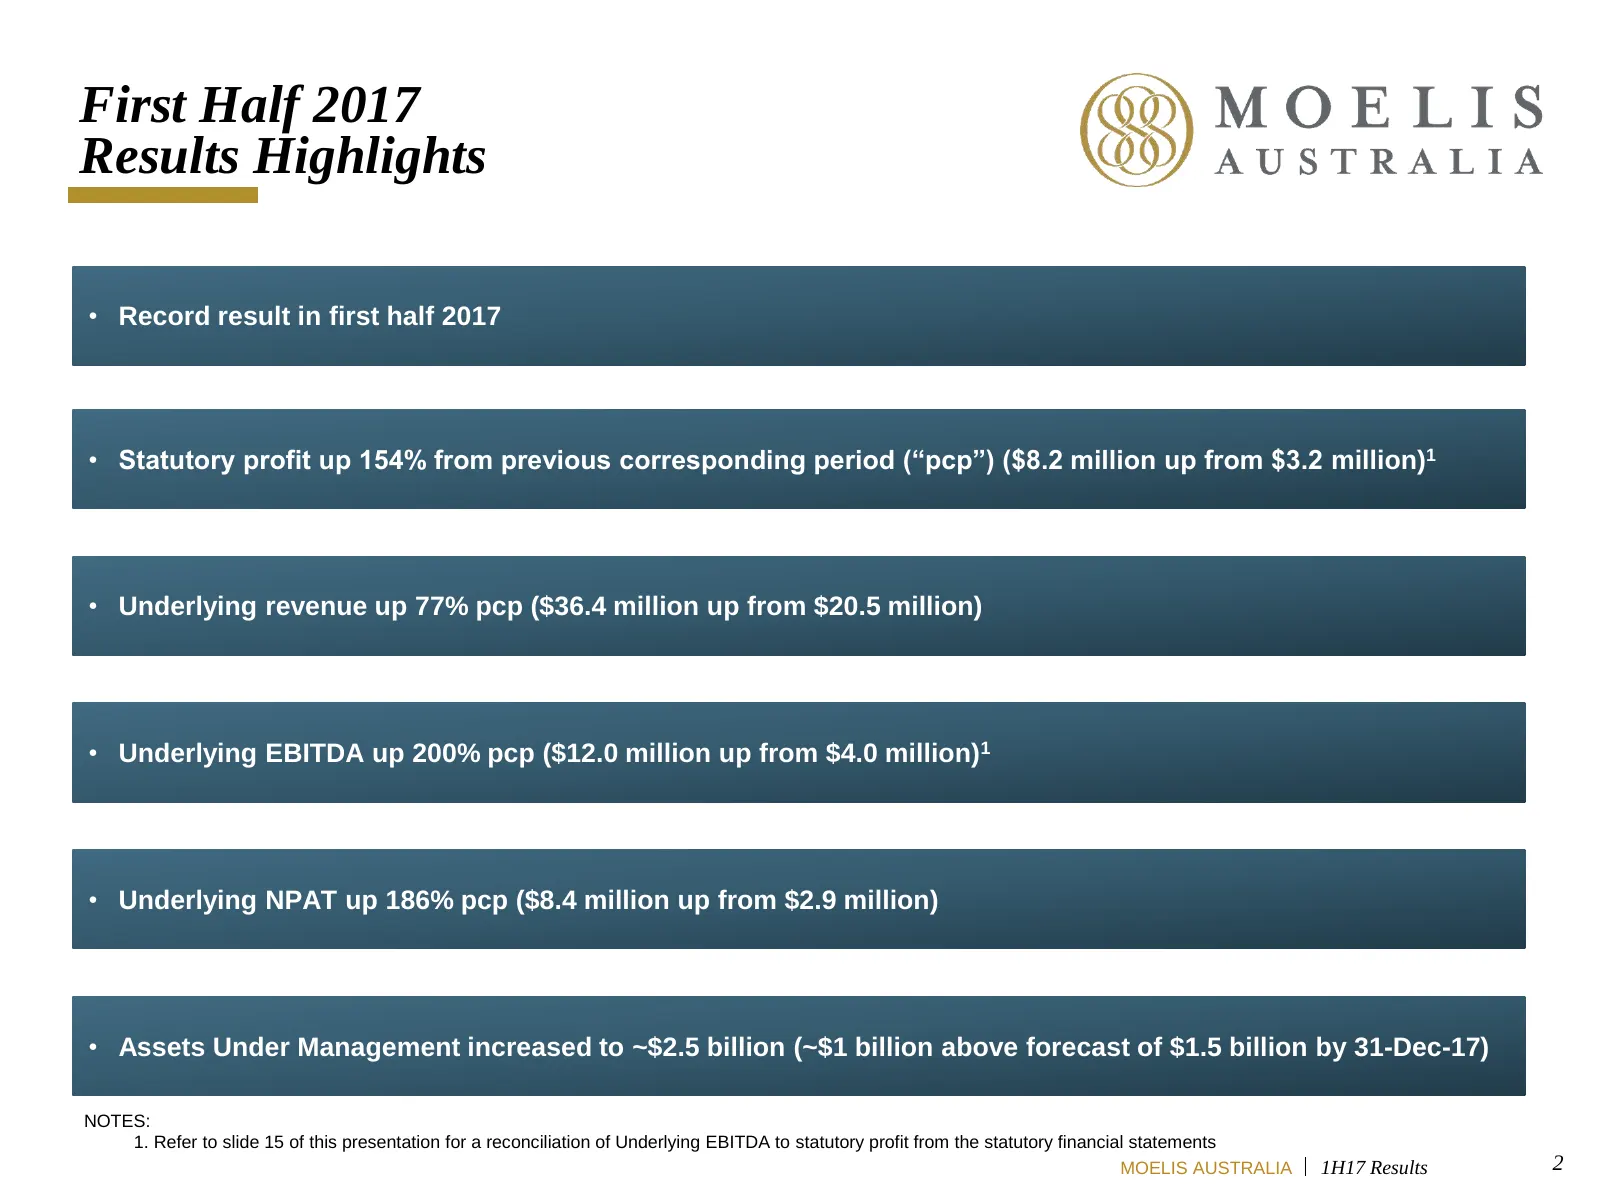
First Half 2017 Results Highlights • Record result in first half 2017 • Statutory profit up 154% from previous corresponding period (“pcp”) ($8.2 million up from $3.2 million)1 • Underlying revenue up 77% pcp ($36.4 million up from $20.5 million) • Underlying EBITDA up 200% pcp ($12.0 million up fro
Slide 3: First Half 2017 Summary
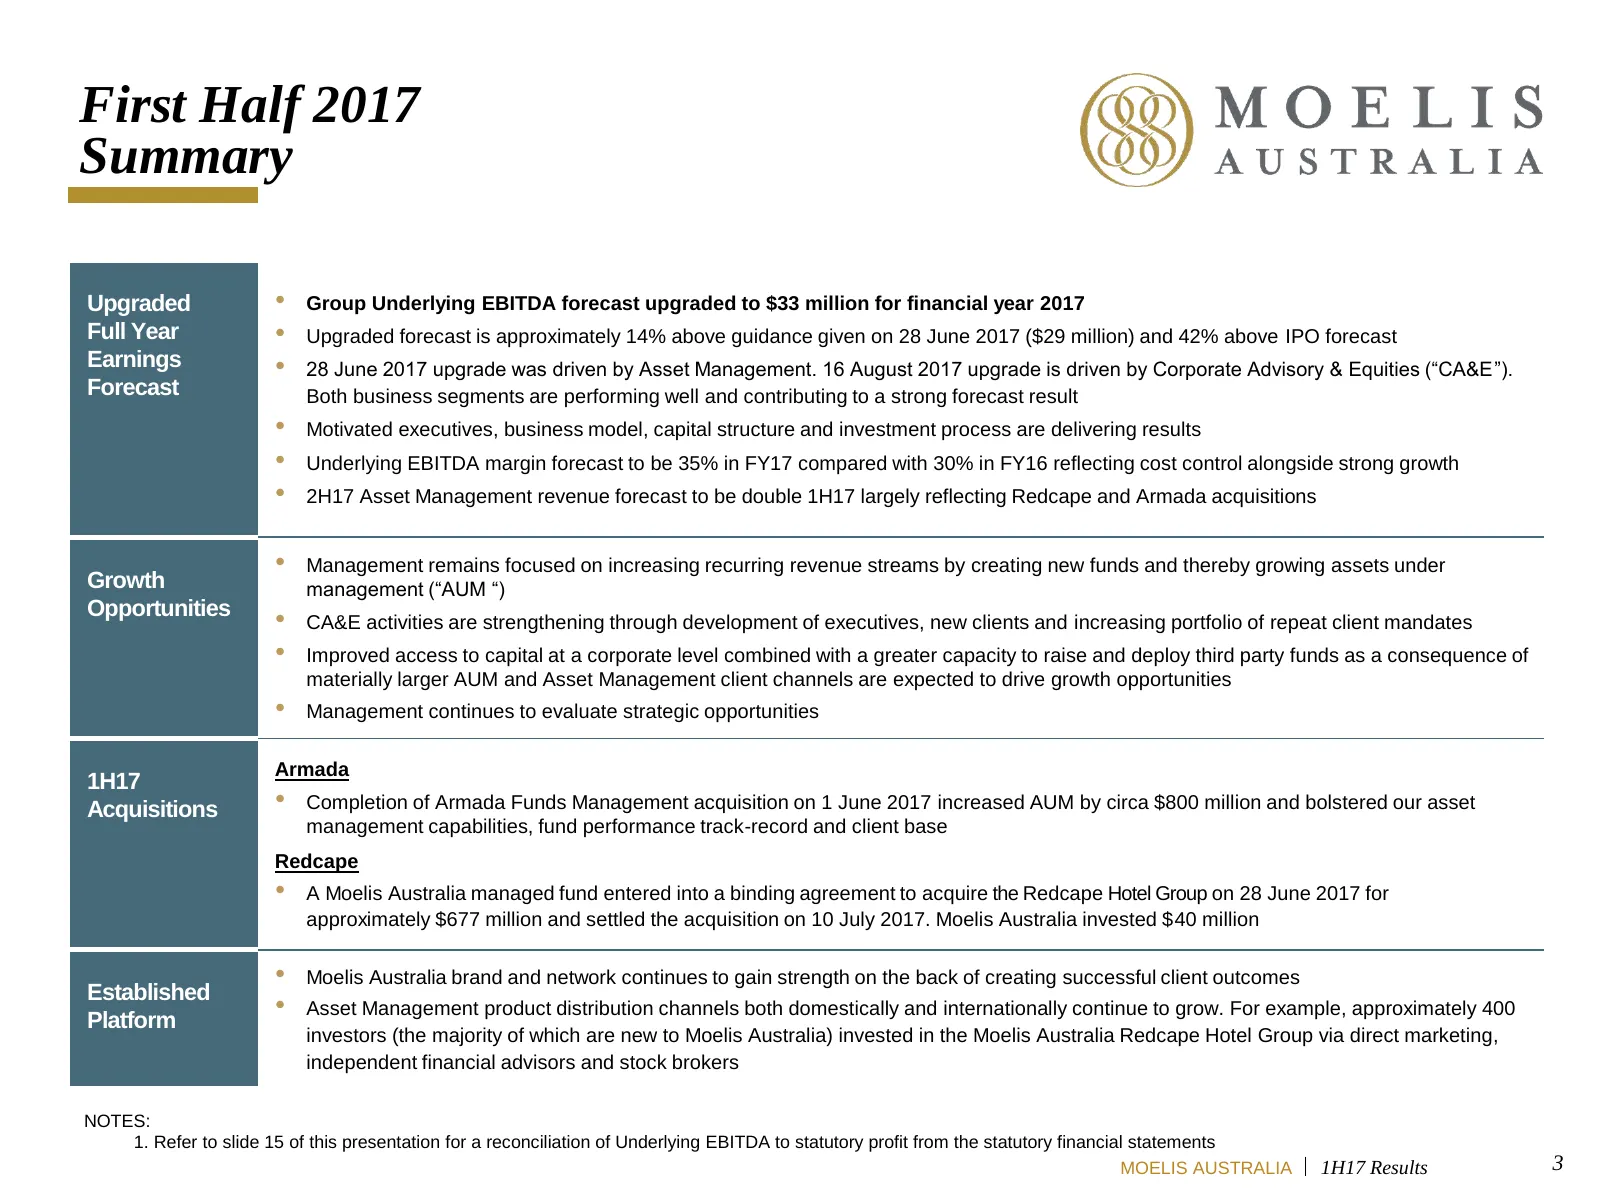
First Half 2017 Summary Upgraded • Group Underlying EBITDA forecast upgraded to $33 million for financial year 2017 Full Year • Upgraded forecast is approximately 14% above guidance given on 28 June 2017 ($29 million) and 42% above IPO forecast Earnings • 28 June 2017 upgrade was driven by Asset Man
Slide 4: First Half 2017 Result Overview
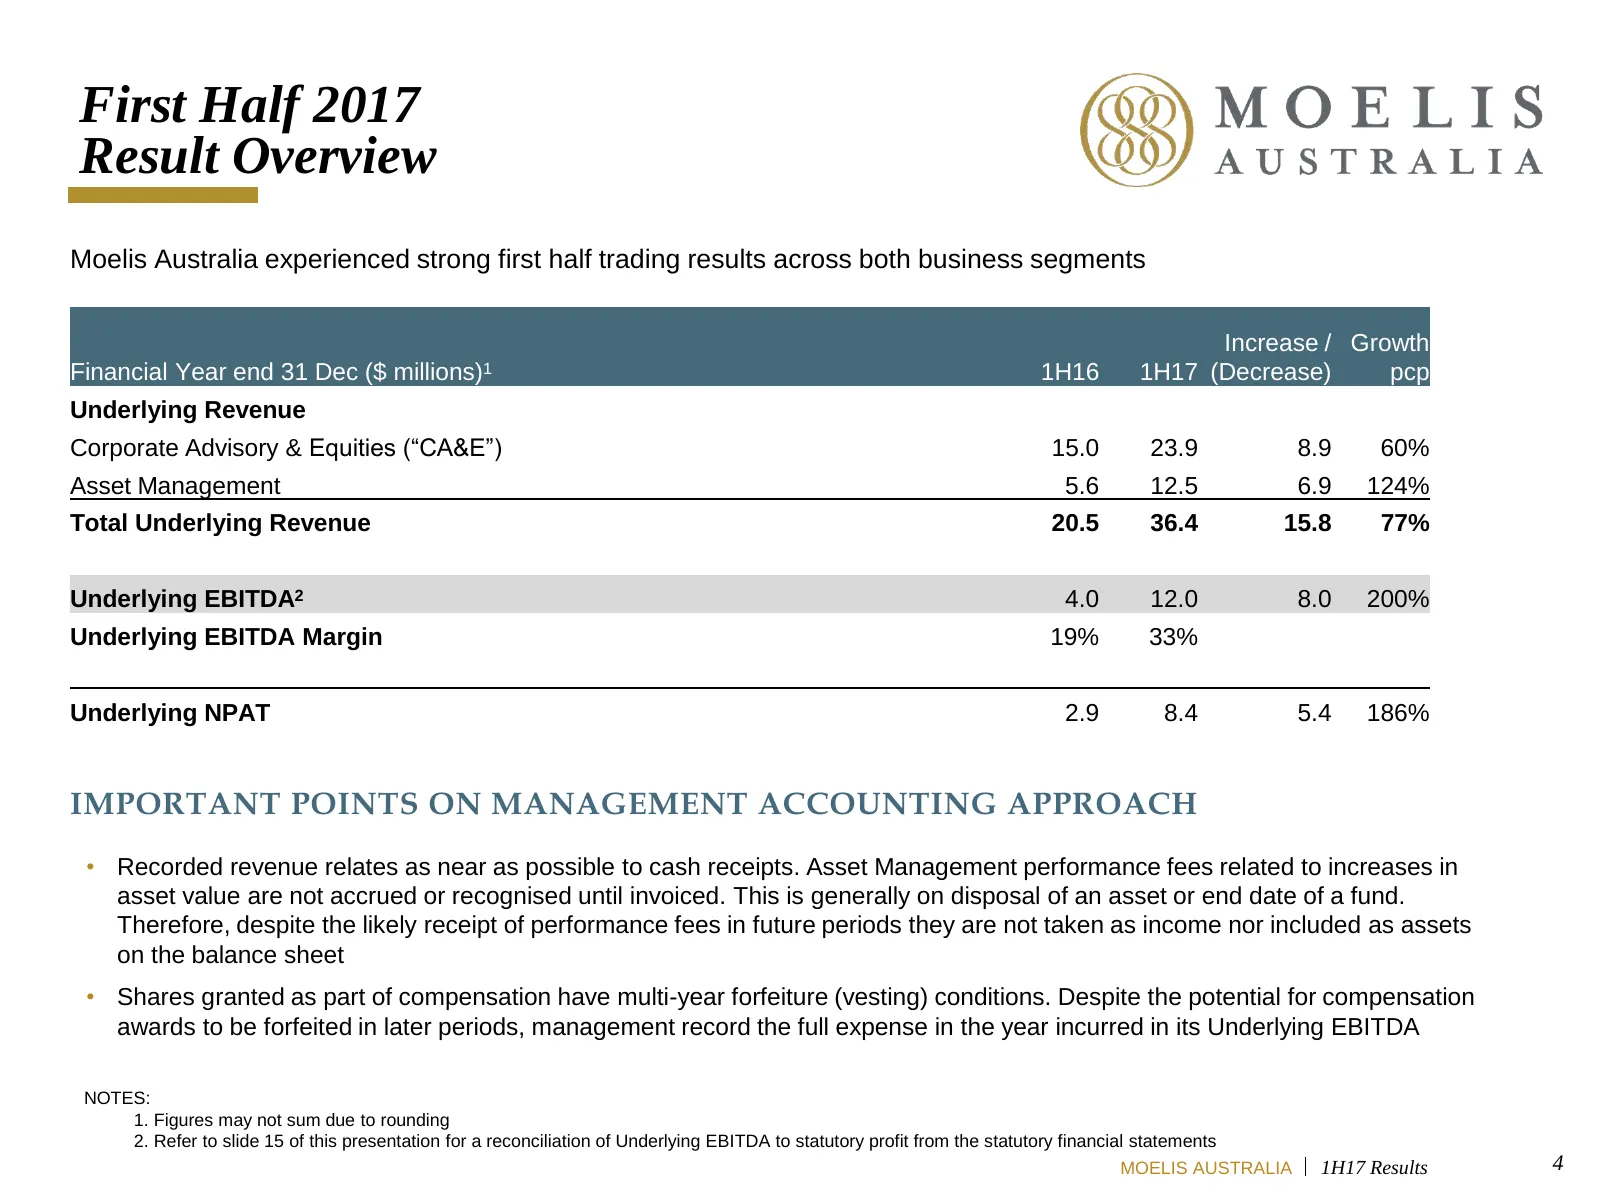
First Half 2017 Result Overview Moelis Australia experienced strong first half trading results across both business segments Increase / Growth Financial Year end 31 Dec ($ millions)1 1H16 1H17 (Decrease) pcp Underlying Revenue Corporate Advisory & Equities (“CA&E”) 15.0 23.9 8.9 60% Asset Management
Slide 5: Trading Update post June 2017
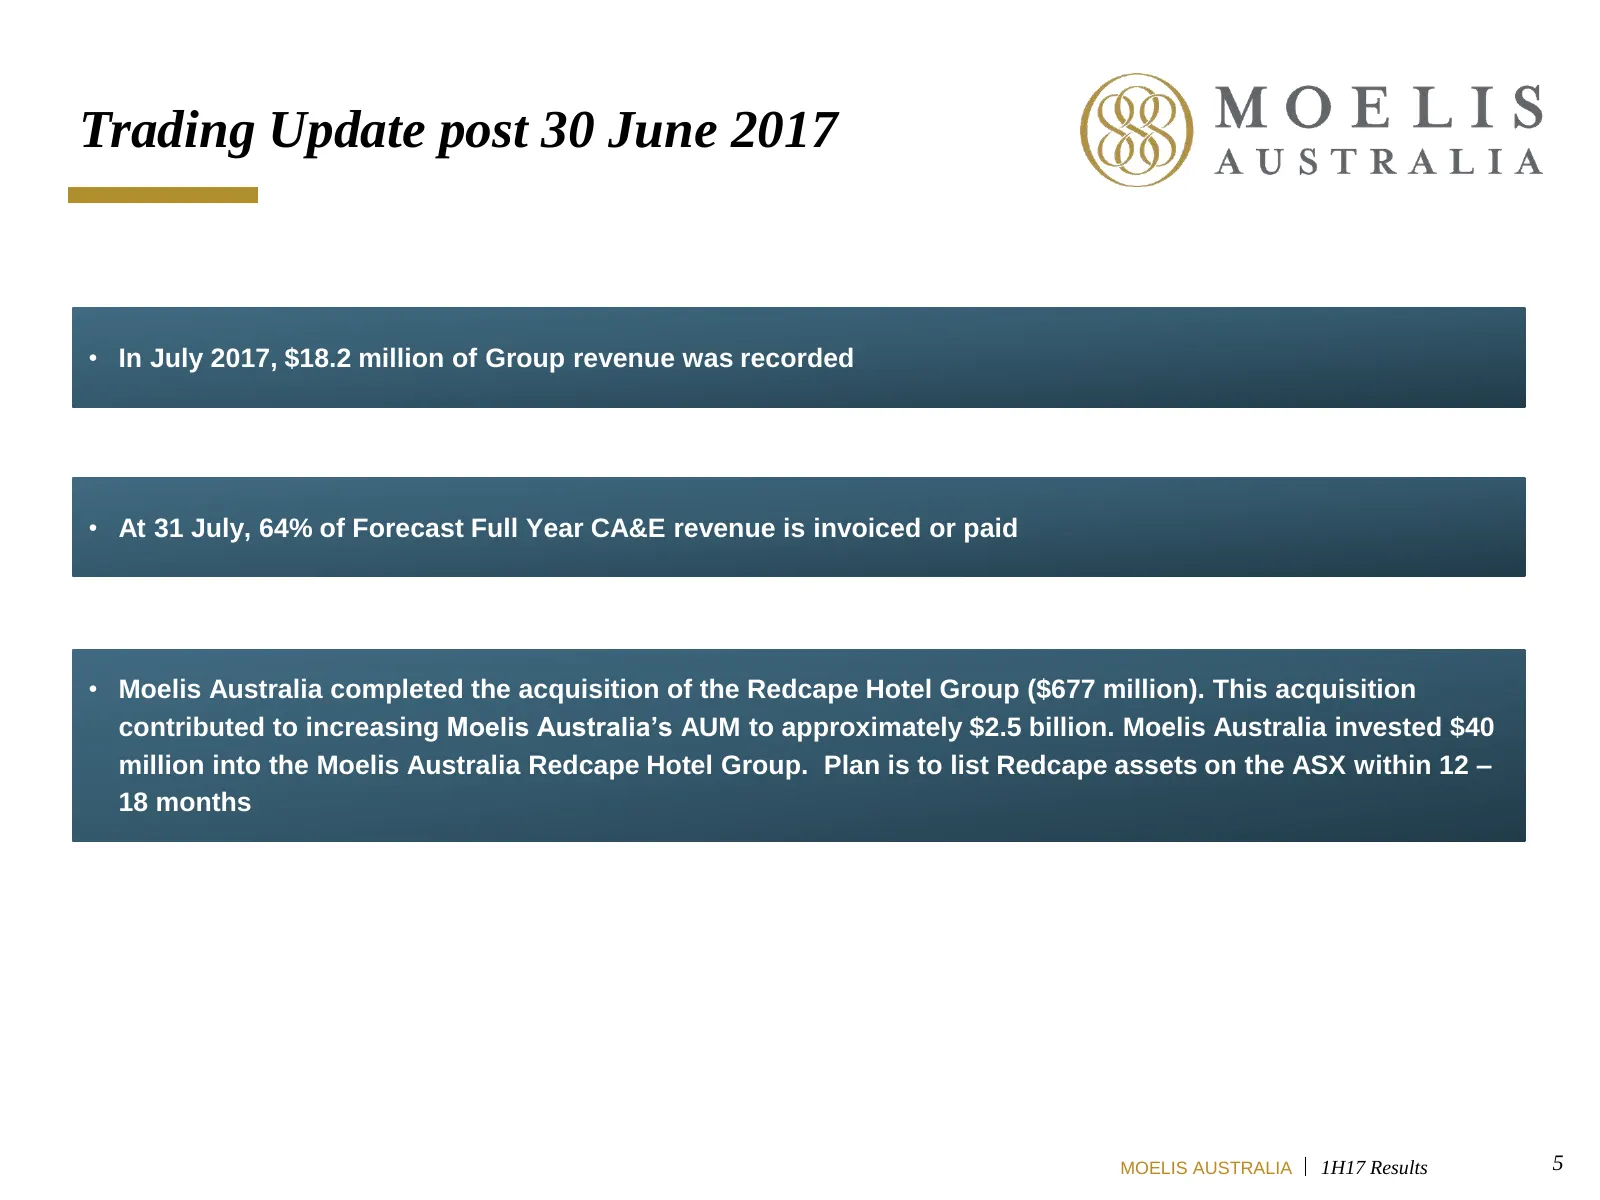
Trading Update post 30 June 2017 • In July 2017, $18.2 million of Group revenue was recorded • At 31 July, 64% of Forecast Full Year CA&E revenue is invoiced or paid • Moelis Australia completed the acquisition of the Redcape Hotel Group ($677 million). This acquisition contributed to increasing Moe
Slide 6: Asset Management Positive EBITDA and Margin Influence
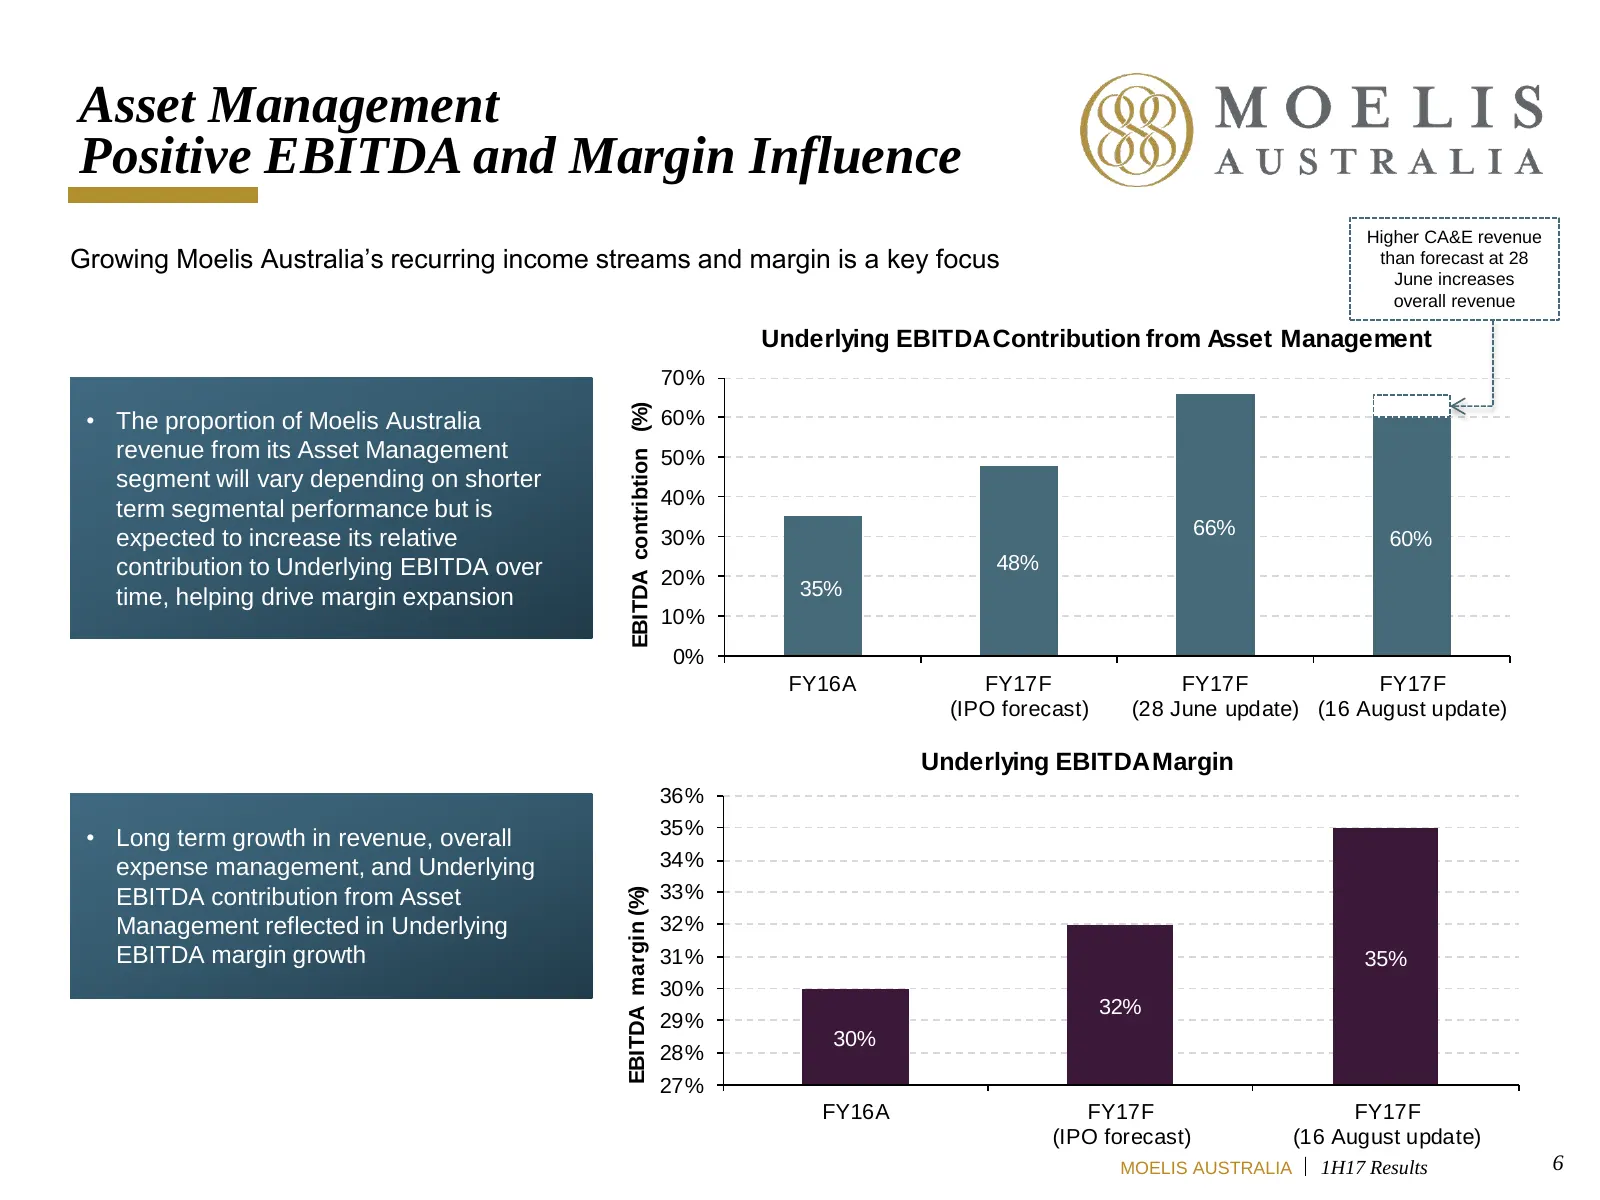
Asset Management Positive EBITDA and Margin Influence Higher CA&E revenue Growing Moelis Australia’s recurring income streams and margin is a key focus than forecast at 28 June increases overall revenue Underlying EBITDA Contribution from Asset Management 70% EBITDA contribtion (%) • The proportion
Slide 7: First Half 2017 Segment Overview
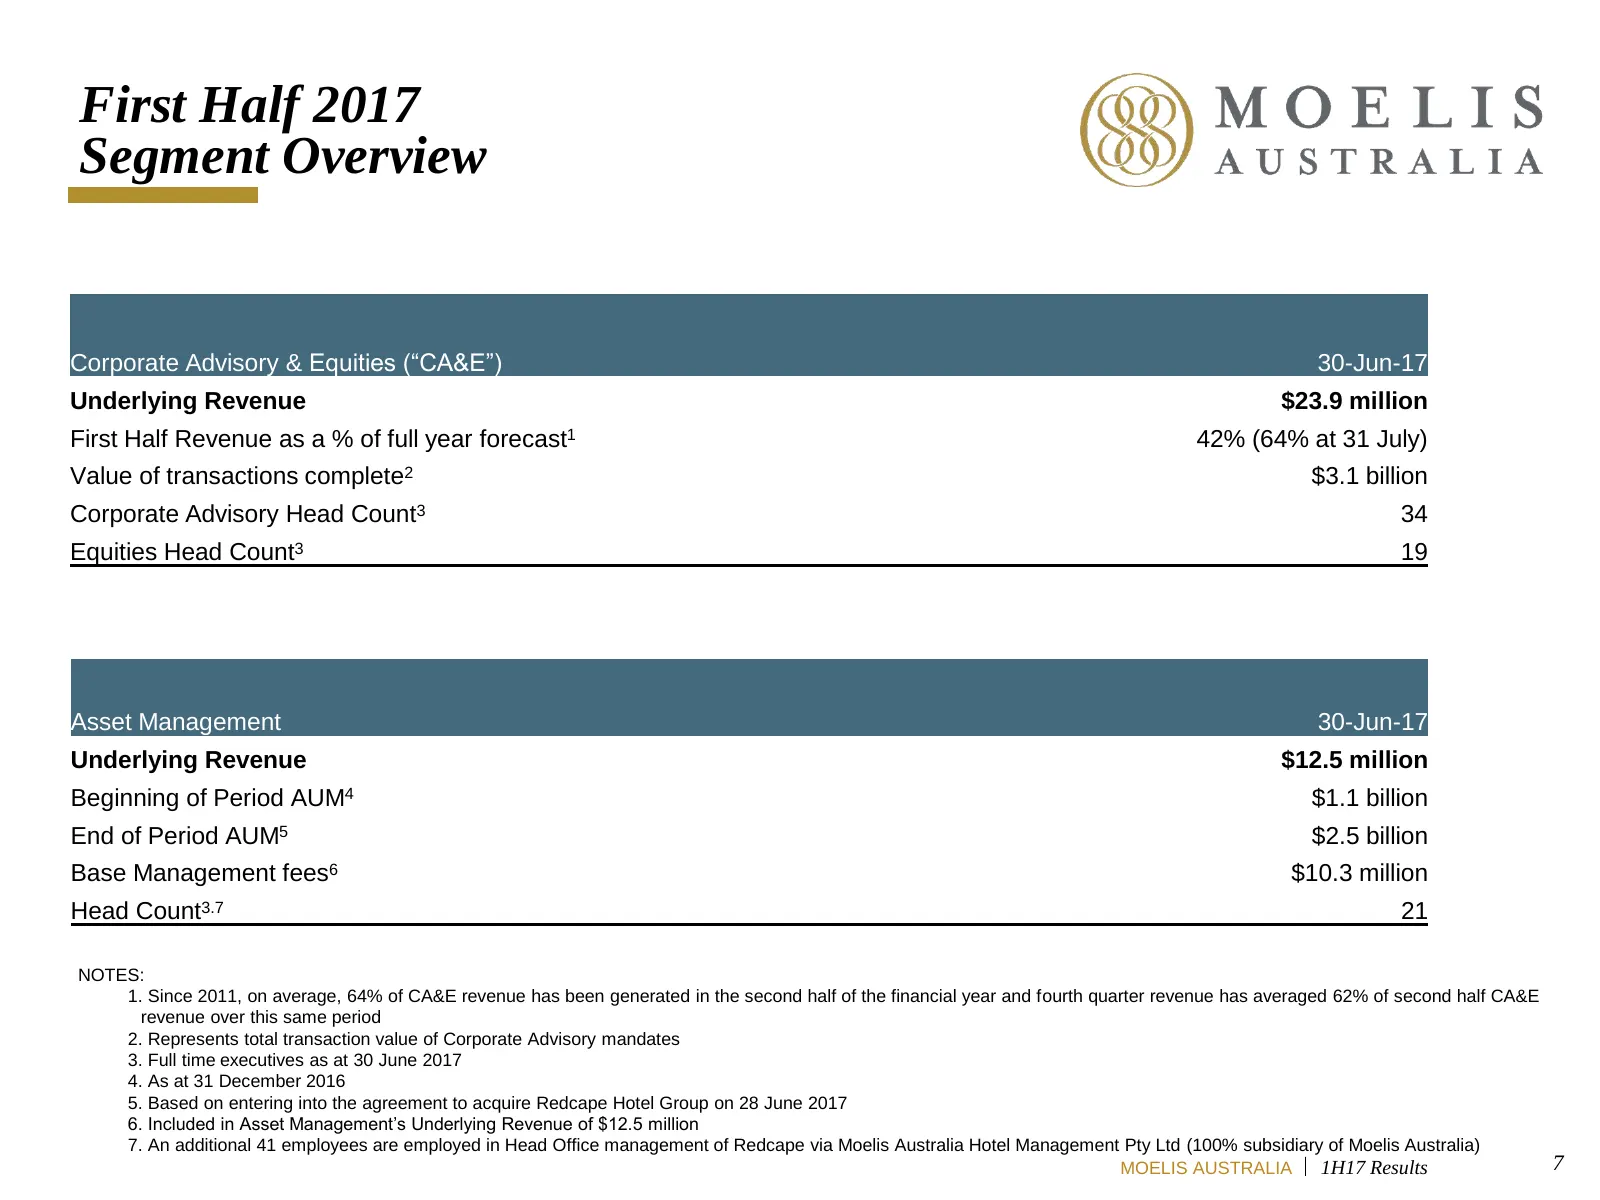
First Half 2017 Segment Overview Corporate Advisory & Equities (“CA&E”) 30-Jun-17 Underlying Revenue $23.9 million First Half Revenue as a % of full year forecast1 42% (64% at 31 July) Value of transactions complete2 $3.1 billion Corporate Advisory Head Count3 34 Equities Head Count3 19 Asset Manage
Slide 8: Financial Year 2017 Strong Growth Continues
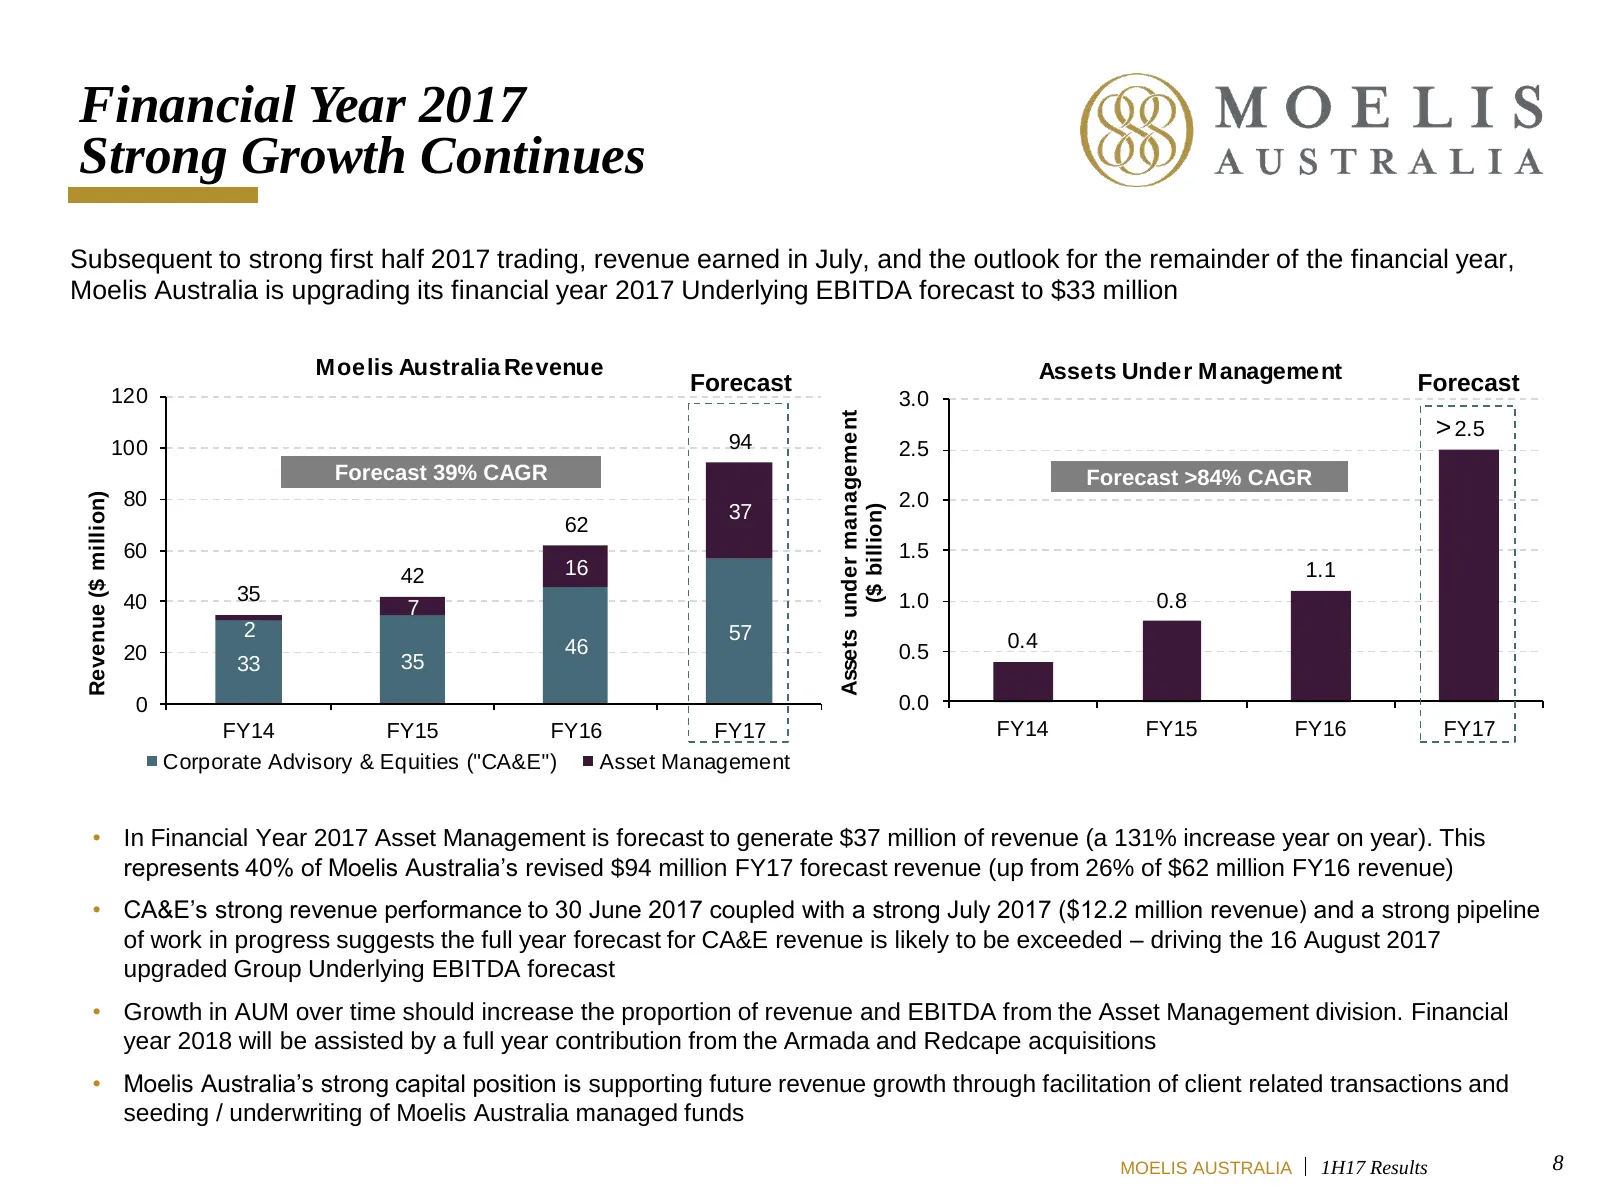
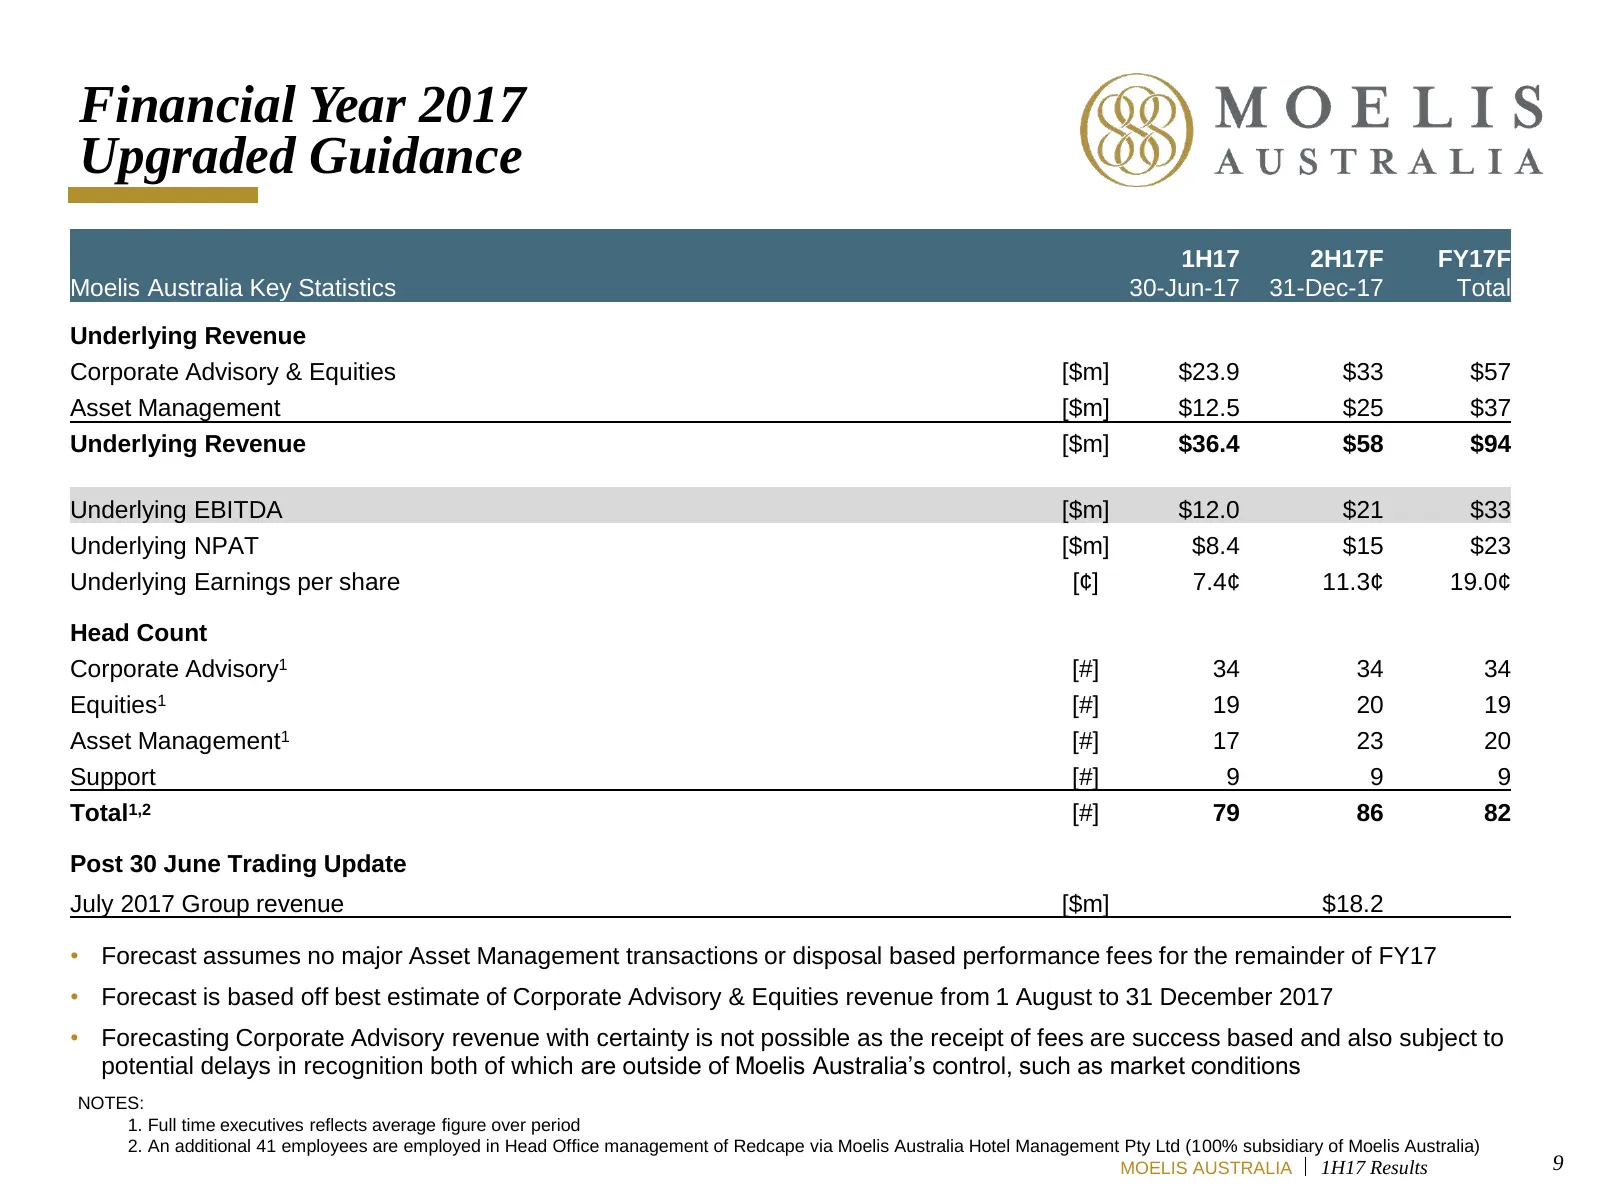
Financial Year 2017 Strong Growth Continues Subsequent to strong first half 2017 trading, revenue earned in July, and the outlook for the remainder of the financial year, Moelis Australia is upgrading its financial year 2017 Underlying EBITDA forecast to $33 million Moelis Australia Revenue Assets U
Slide 9: Financial Year 2017 Upgraded Guidance
Financial Year 2017 Upgraded Guidance 1H17 2H17F FY17F Moelis Australia Key Statistics 30-Jun-17 31-Dec-17 Total Underlying Revenue Corporate Advisory & Equities [$m] $23.9 $33 $57 Asset Management [$m] $12.5 $25 $37 Underlying Revenue [$m] $36.4 $58 $94 Underlying EBITDA [$m] $12.0 $21 $33 Underlyi
Slide 10: CA&E Revenue Historically Back-ended
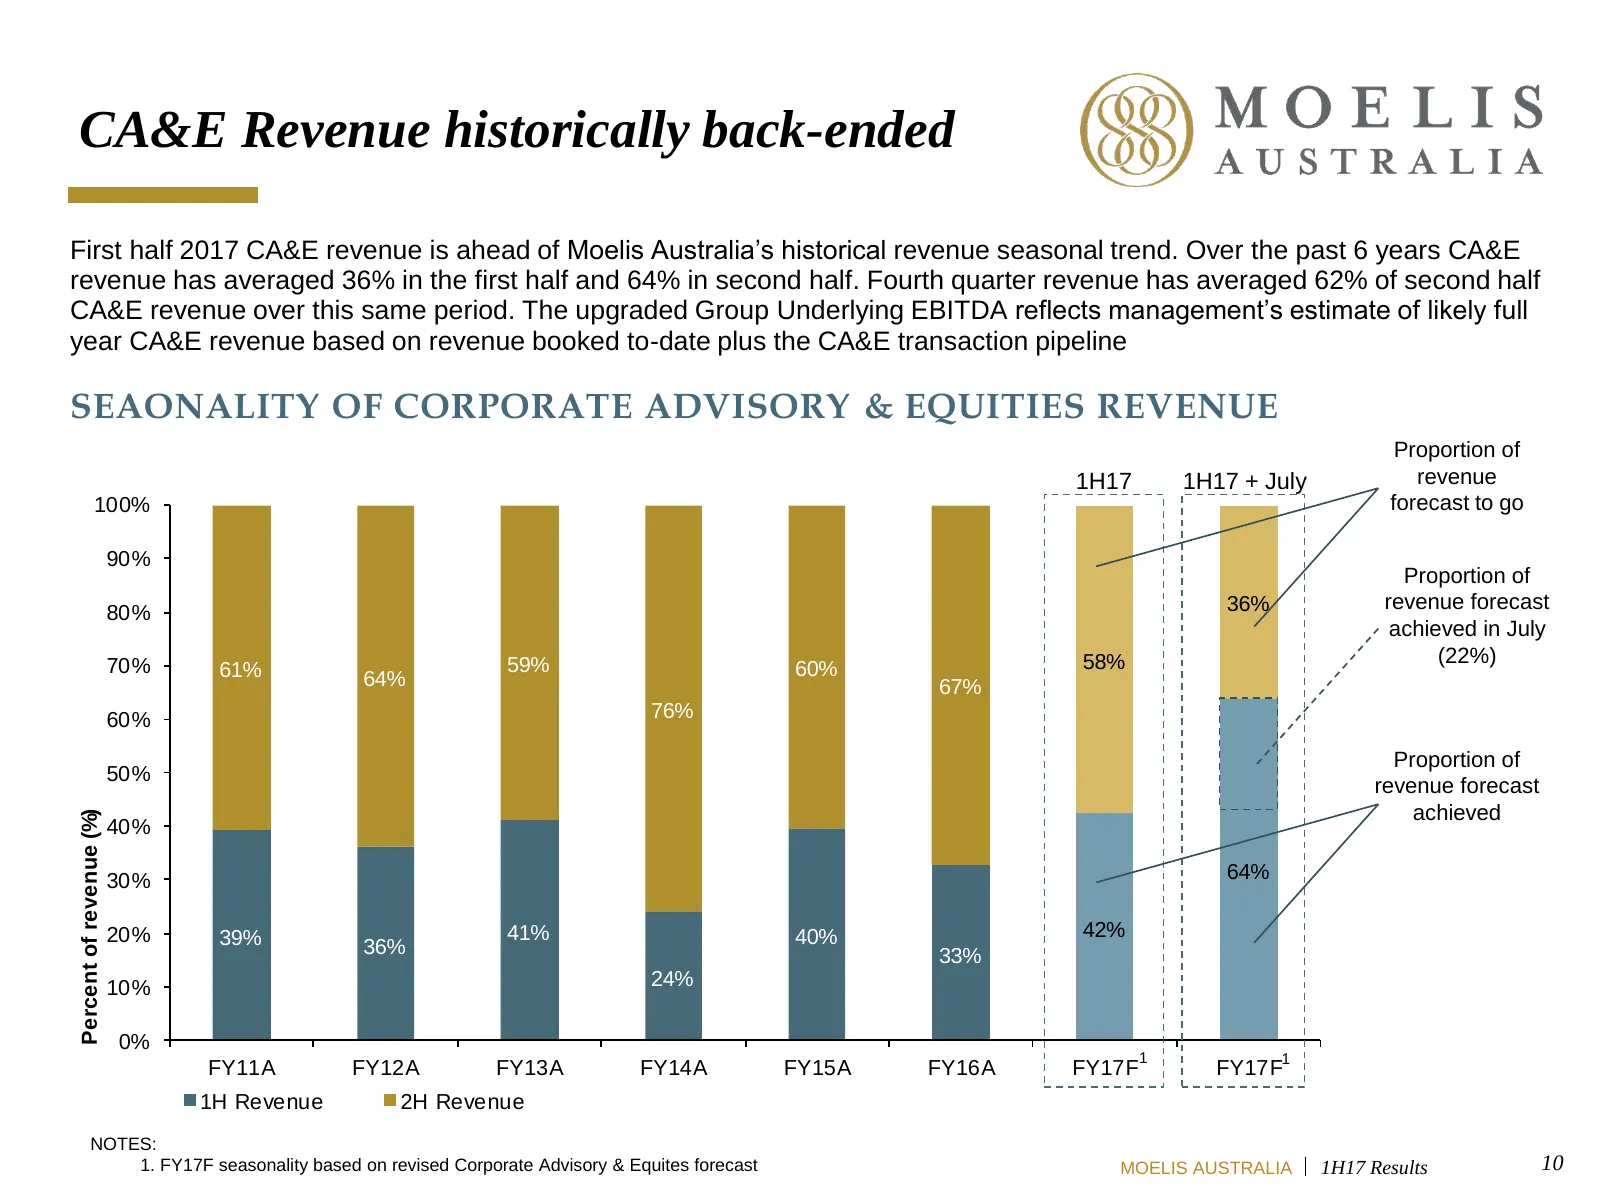
CA&E Revenue historically back-ended First half 2017 CA&E revenue is ahead of Moelis Australia’s historical revenue seasonal trend. Over the past 6 years CA&E revenue has averaged 36% in the first half and 64% in second half. Fourth quarter revenue has averaged 62% of second half CA&E revenue over t
Slide 11: Corporate Advisory & Equities Year to Date 2017 Transactions
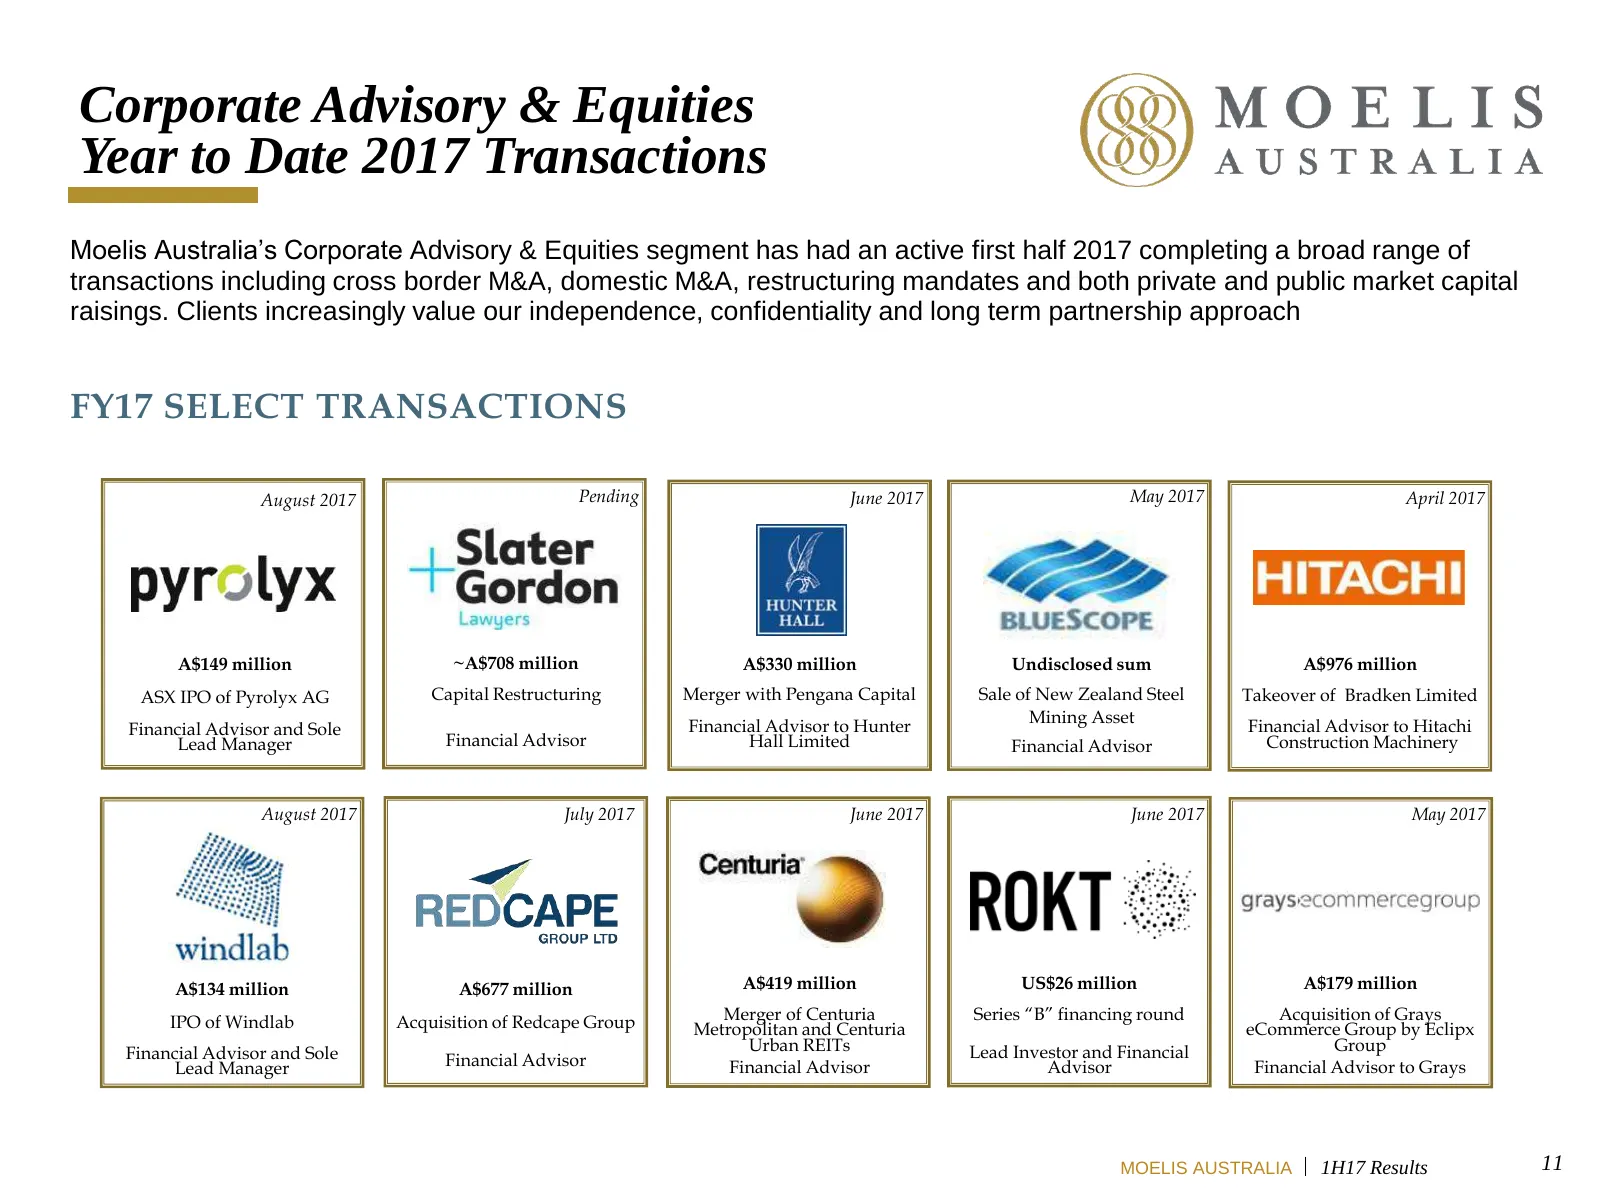
Corporate Advisory & Equities Year to Date 2017 Transactions Moelis Australia’s Corporate Advisory & Equities segment has had an active first half 2017 completing a broad range of transactions including cross border M&A, domestic M&A, restructuring mandates and both private and public market capital
Slide 12: Asset Management Building a Powerful AUM Platform
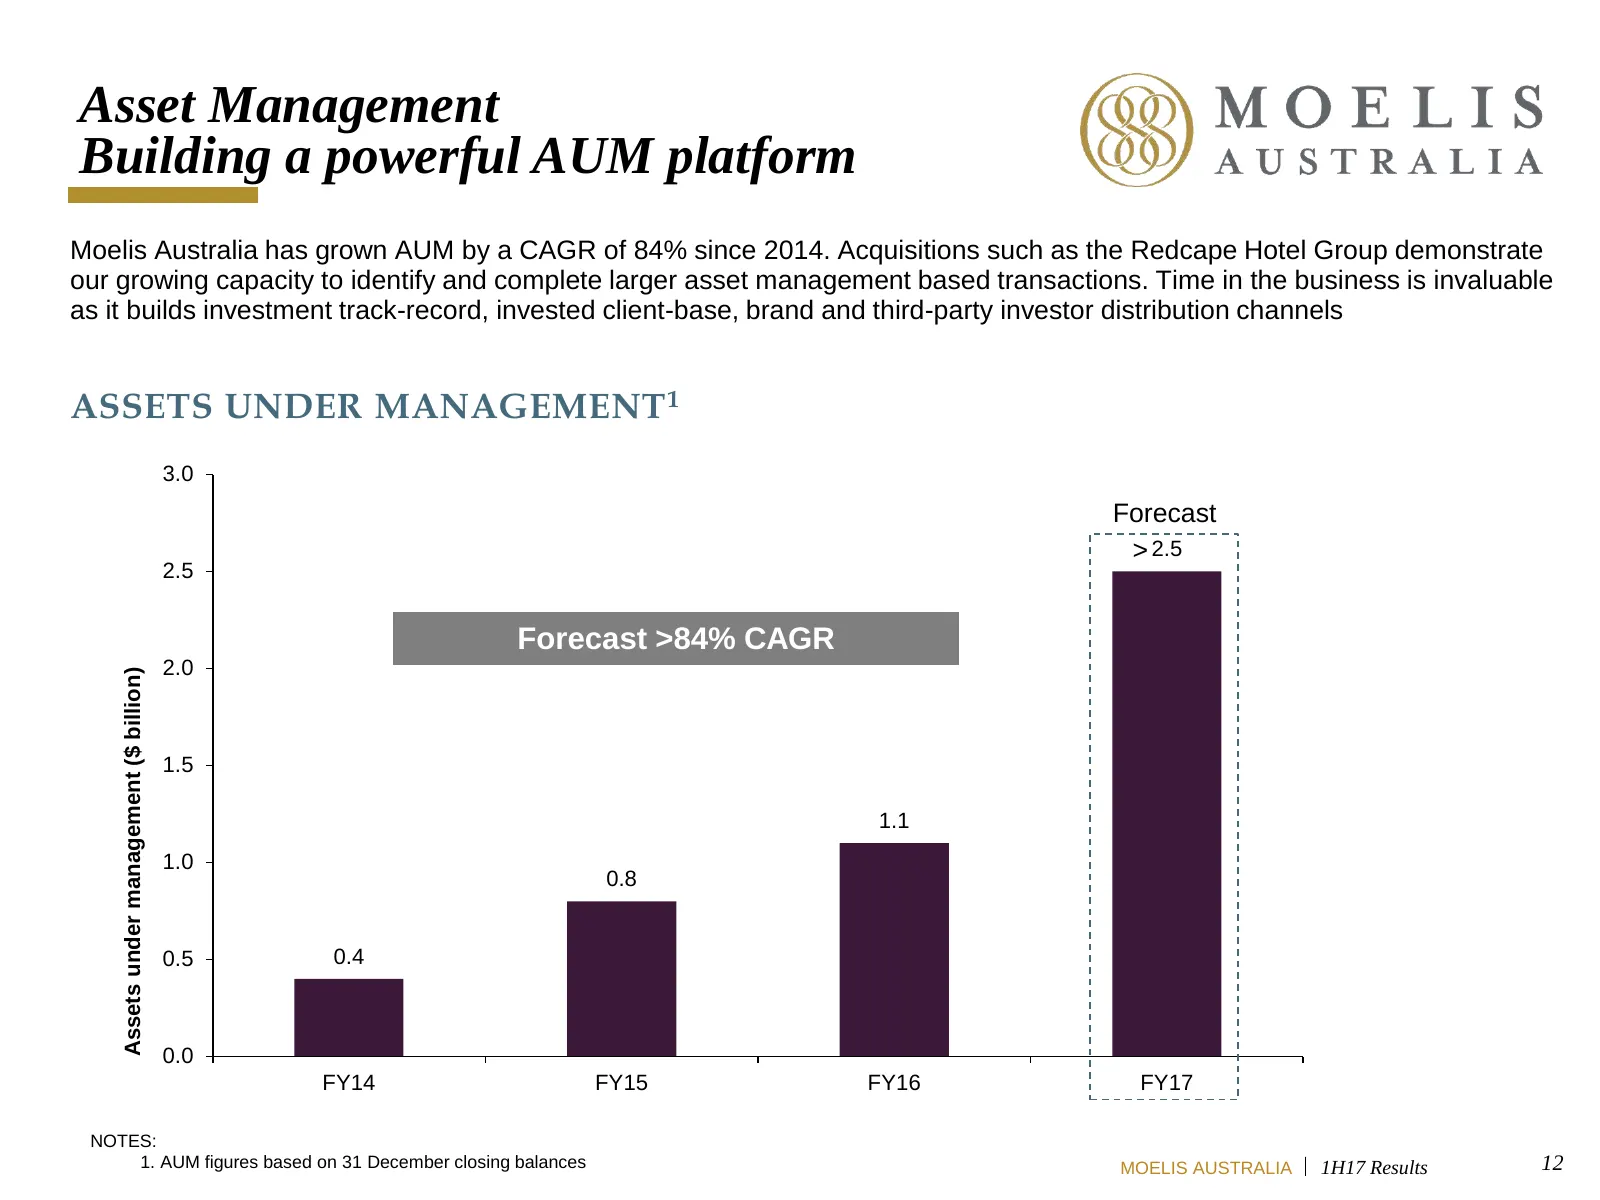
Asset Management Building a powerful AUM platform Moelis Australia has grown AUM by a CAGR of 84% since 2014. Acquisitions such as the Redcape Hotel Group demonstrate our growing capacity to identify and complete larger asset management based transactions. Time in the business is invaluable as it bu
Slide 13: Significant Asset Management Initiatives
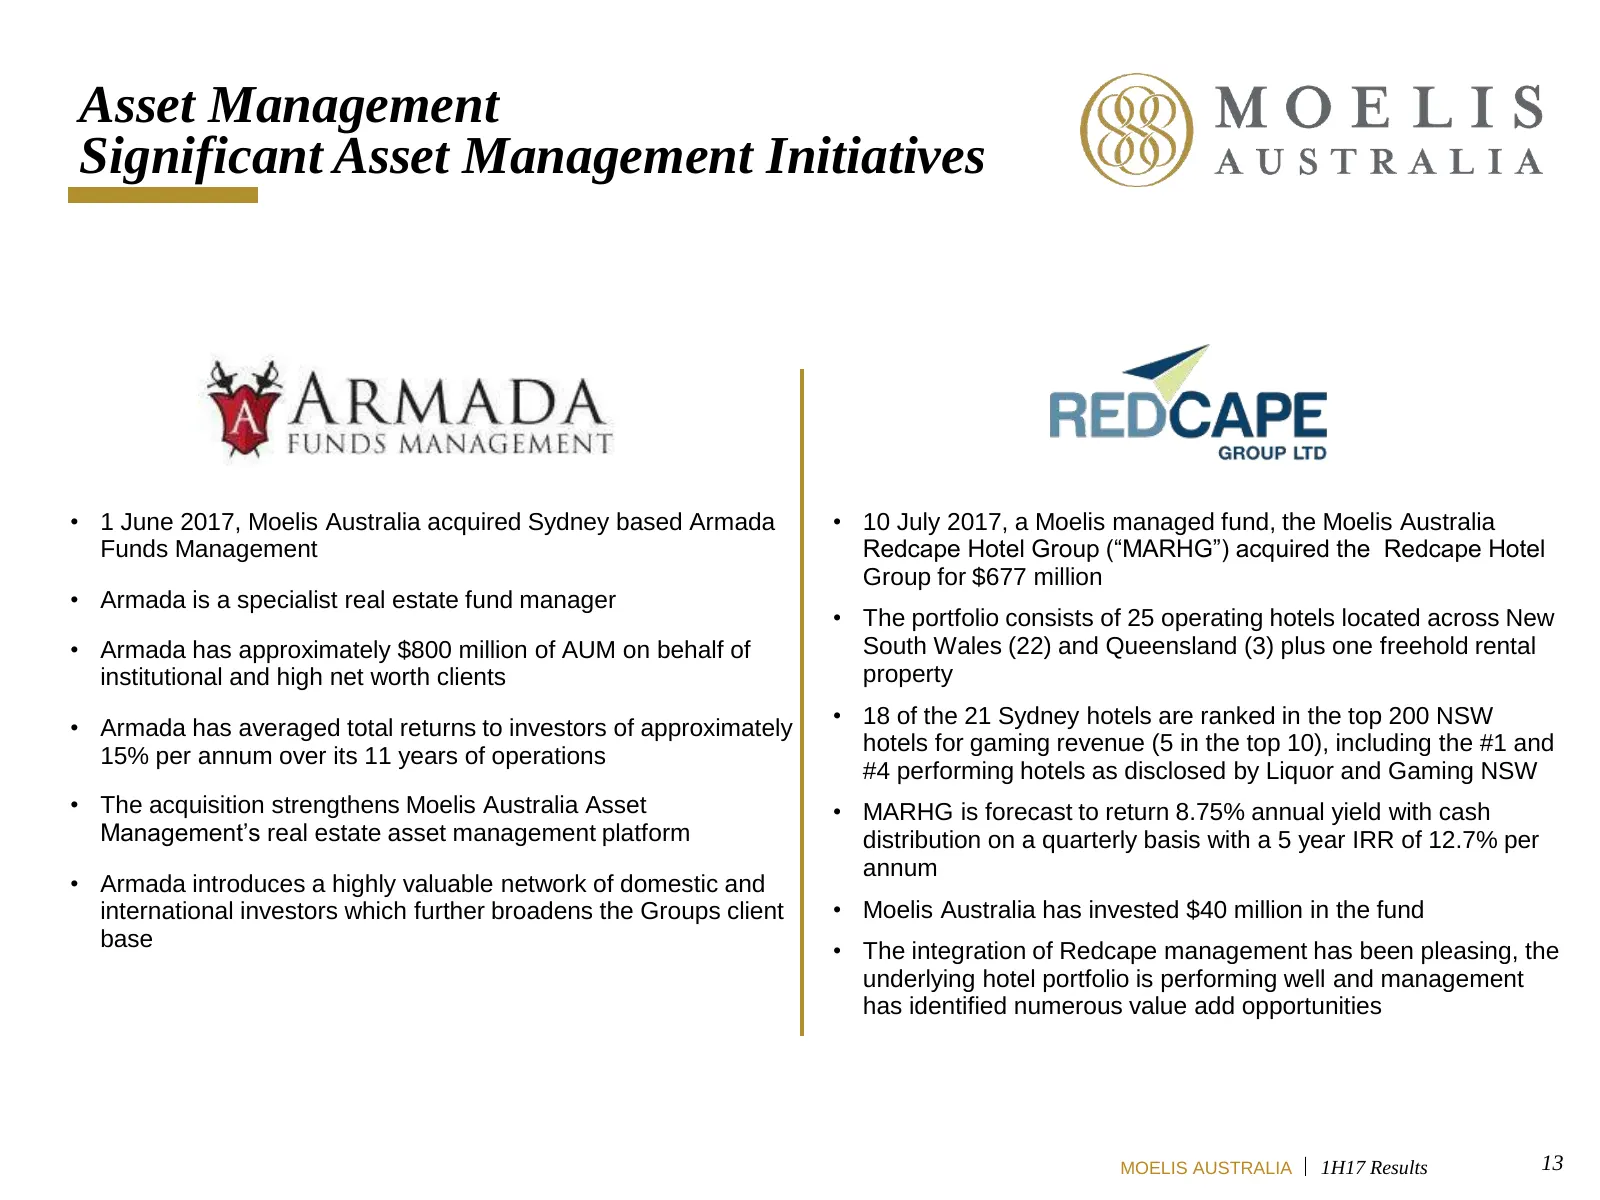
Asset Management Significant Asset Management Initiatives • 1 June 2017, Moelis Australia acquired Sydney based Armada • 10 July 2017, a Moelis managed fund, the Moelis Australia Funds Management Redcape Hotel Group (“MARHG”) acquired the Redcape Hotel Group for $677 million • Armada is a specialist
Slide 14: Key Financials First Half 2017 Profit & Loss
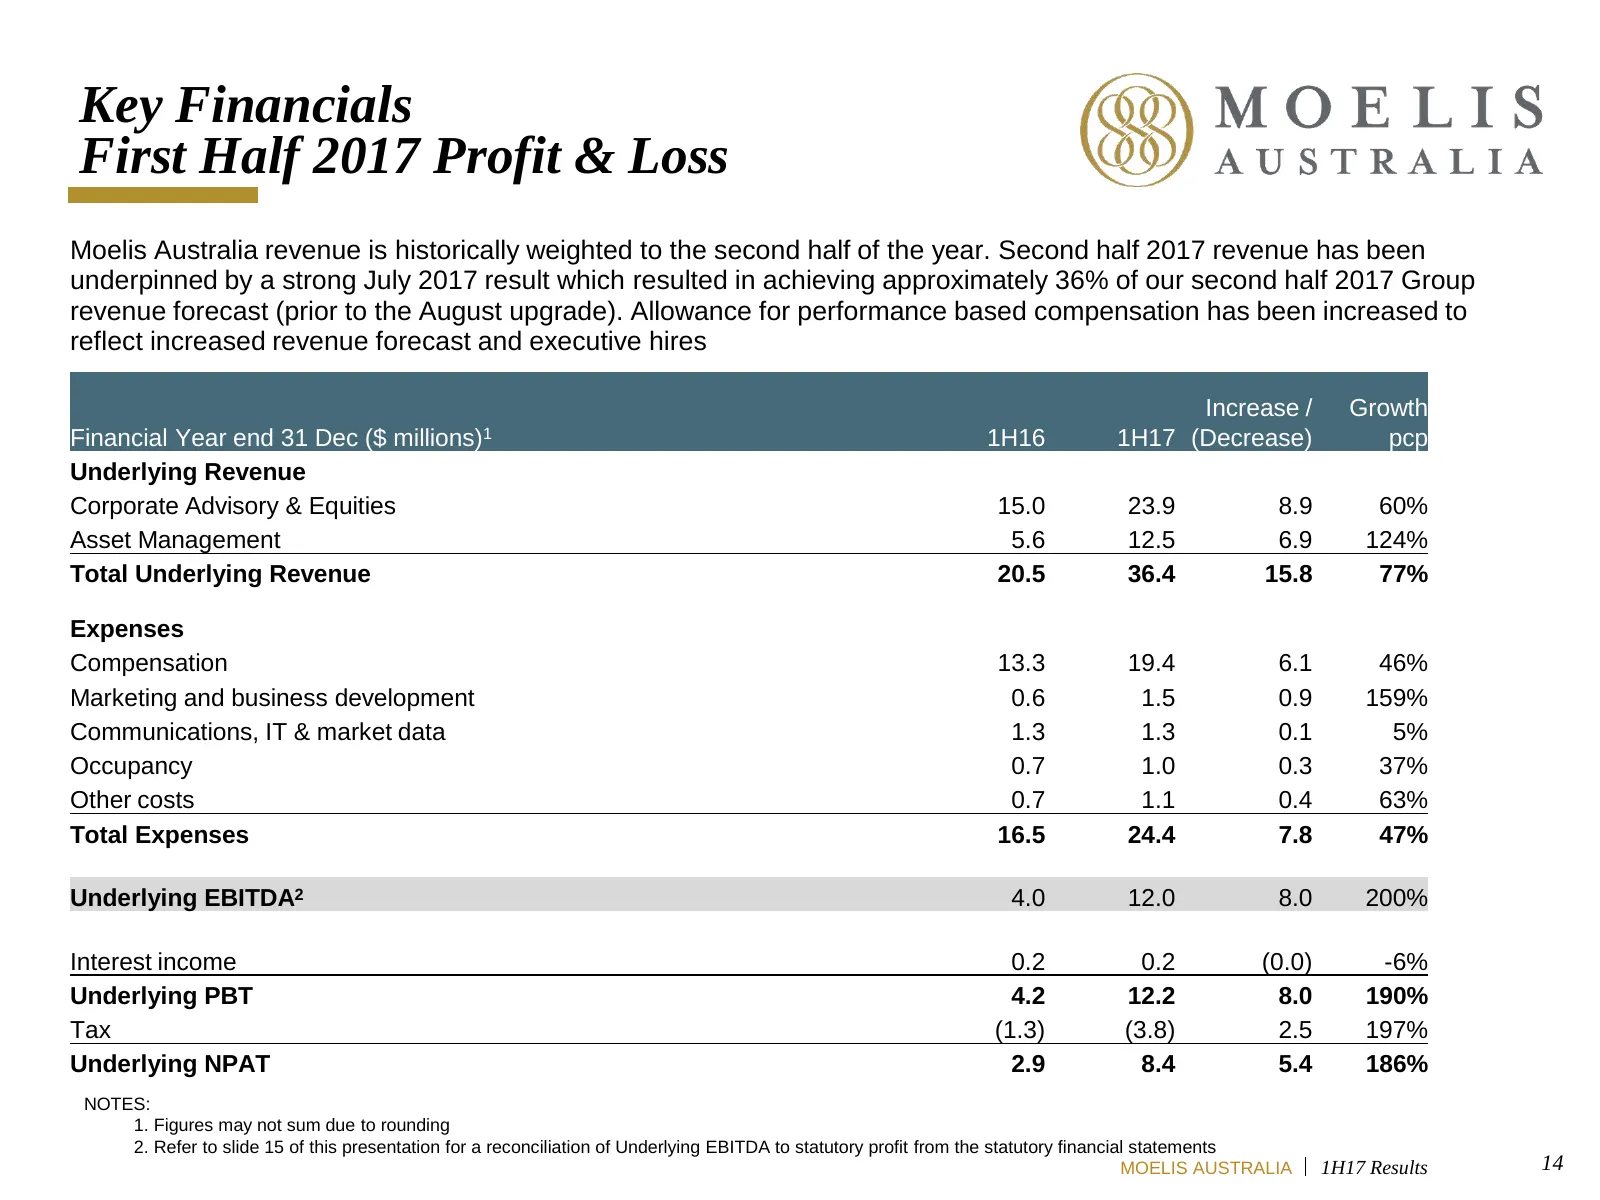
Key Financials First Half 2017 Profit & Loss Moelis Australia revenue is historically weighted to the second half of the year. Second half 2017 revenue has been underpinned by a strong July 2017 result which resulted in achieving approximately 36% of our second half 2017 Group revenue forecast (prio
Slide 15: First Half 2017 Underlying EBITDA Reconciliation
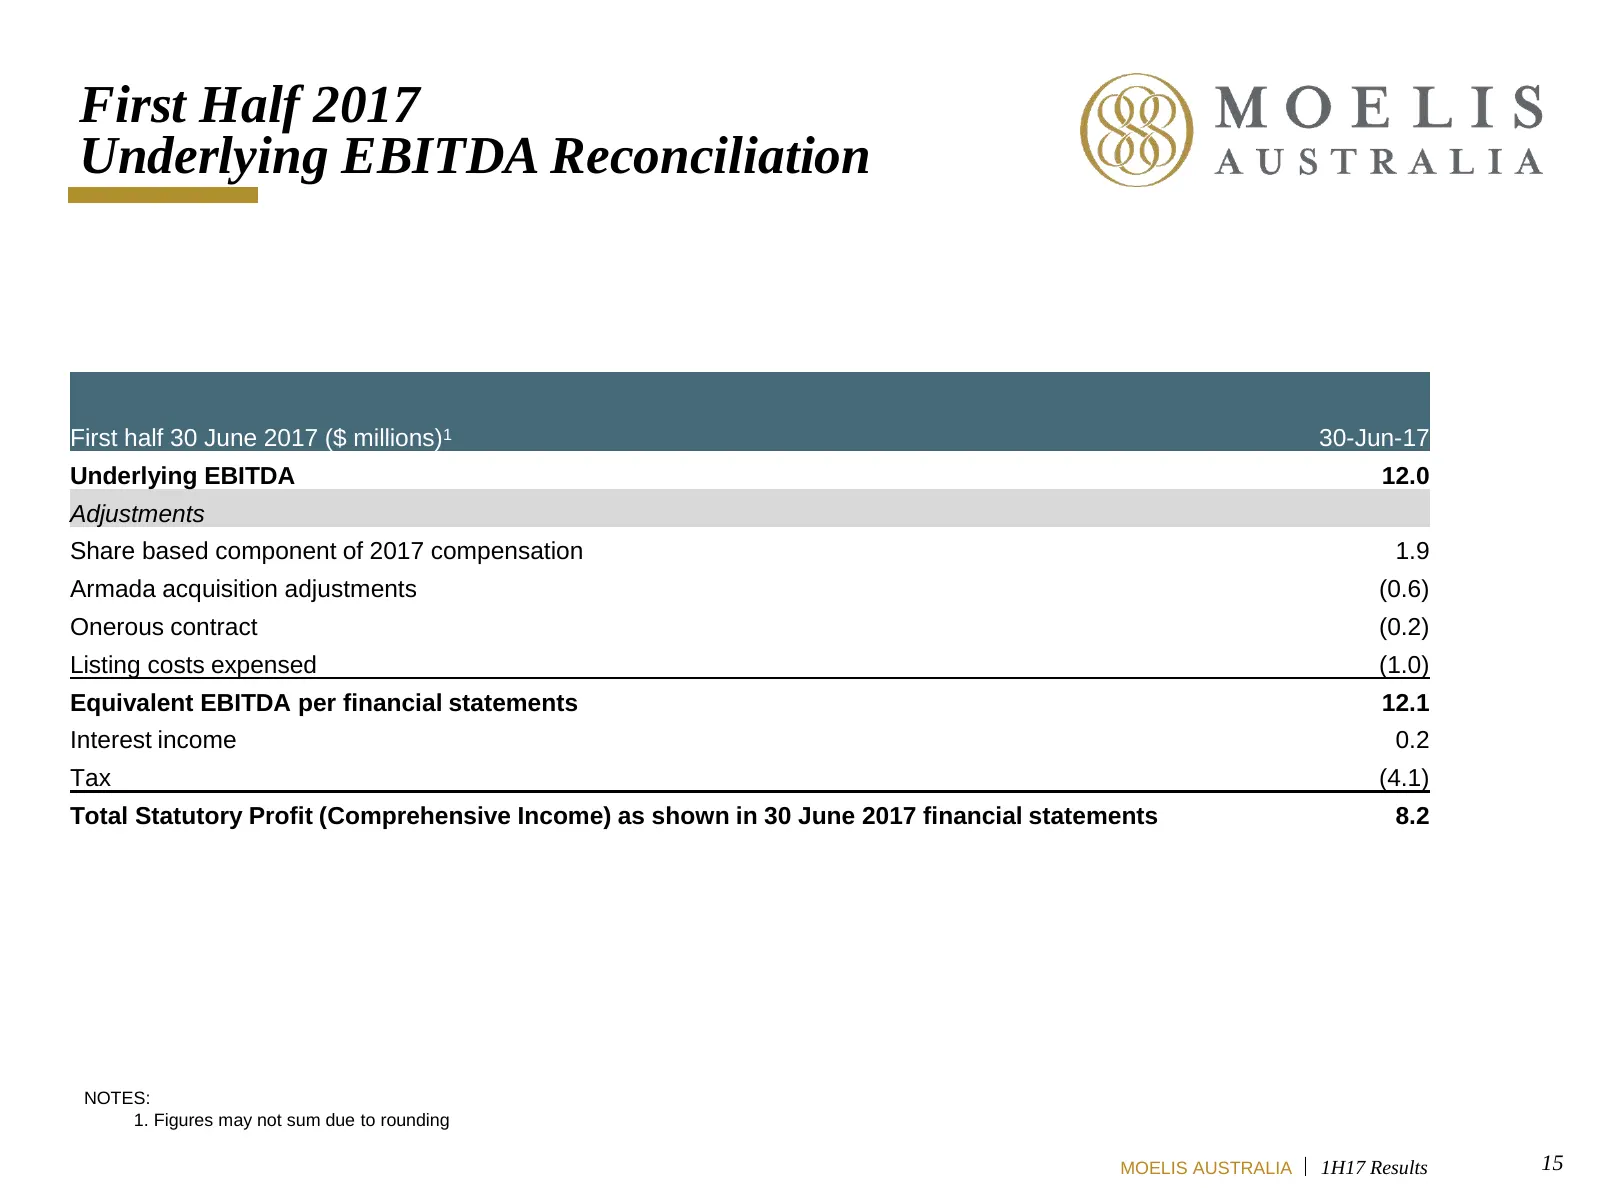
First Half 2017 Underlying EBITDA Reconciliation First half 30 June 2017 ($ millions)1 30-Jun-17 Underlying EBITDA 12.0 Adjustments Share based component of 2017 compensation 1.9 Armada acquisition adjustments (0.6) Onerous contract (0.2) Listing costs expensed (1.0) Equivalent EBITDA per financial
Slide 16: Balance Sheet at June + July '17
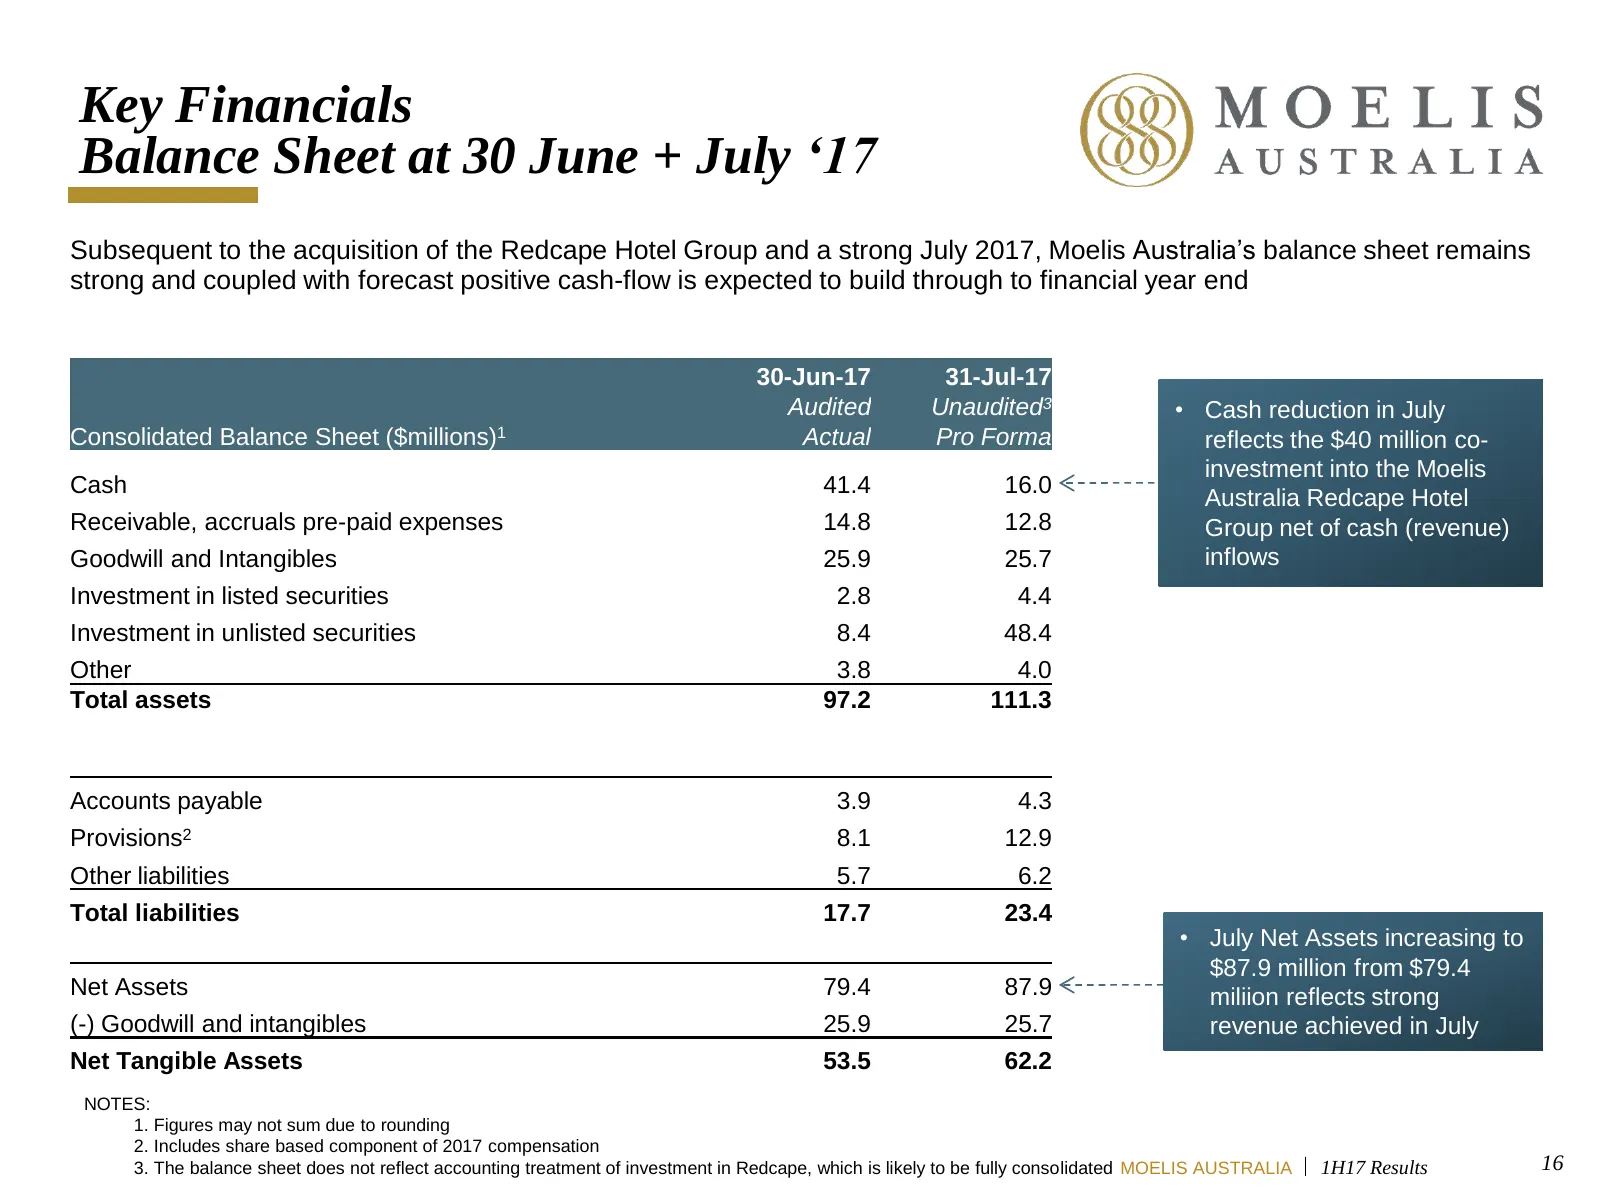
Key Financials Balance Sheet at 30 June + July ‘17 Subsequent to the acquisition of the Redcape Hotel Group and a strong July 2017, Moelis Australia’s balance sheet remains strong and coupled with forecast positive cash-flow is expected to build through to financial year end 30-Jun-17 31-Jul-17 Audi
Slide 17: Financial Year 2017 Outlook
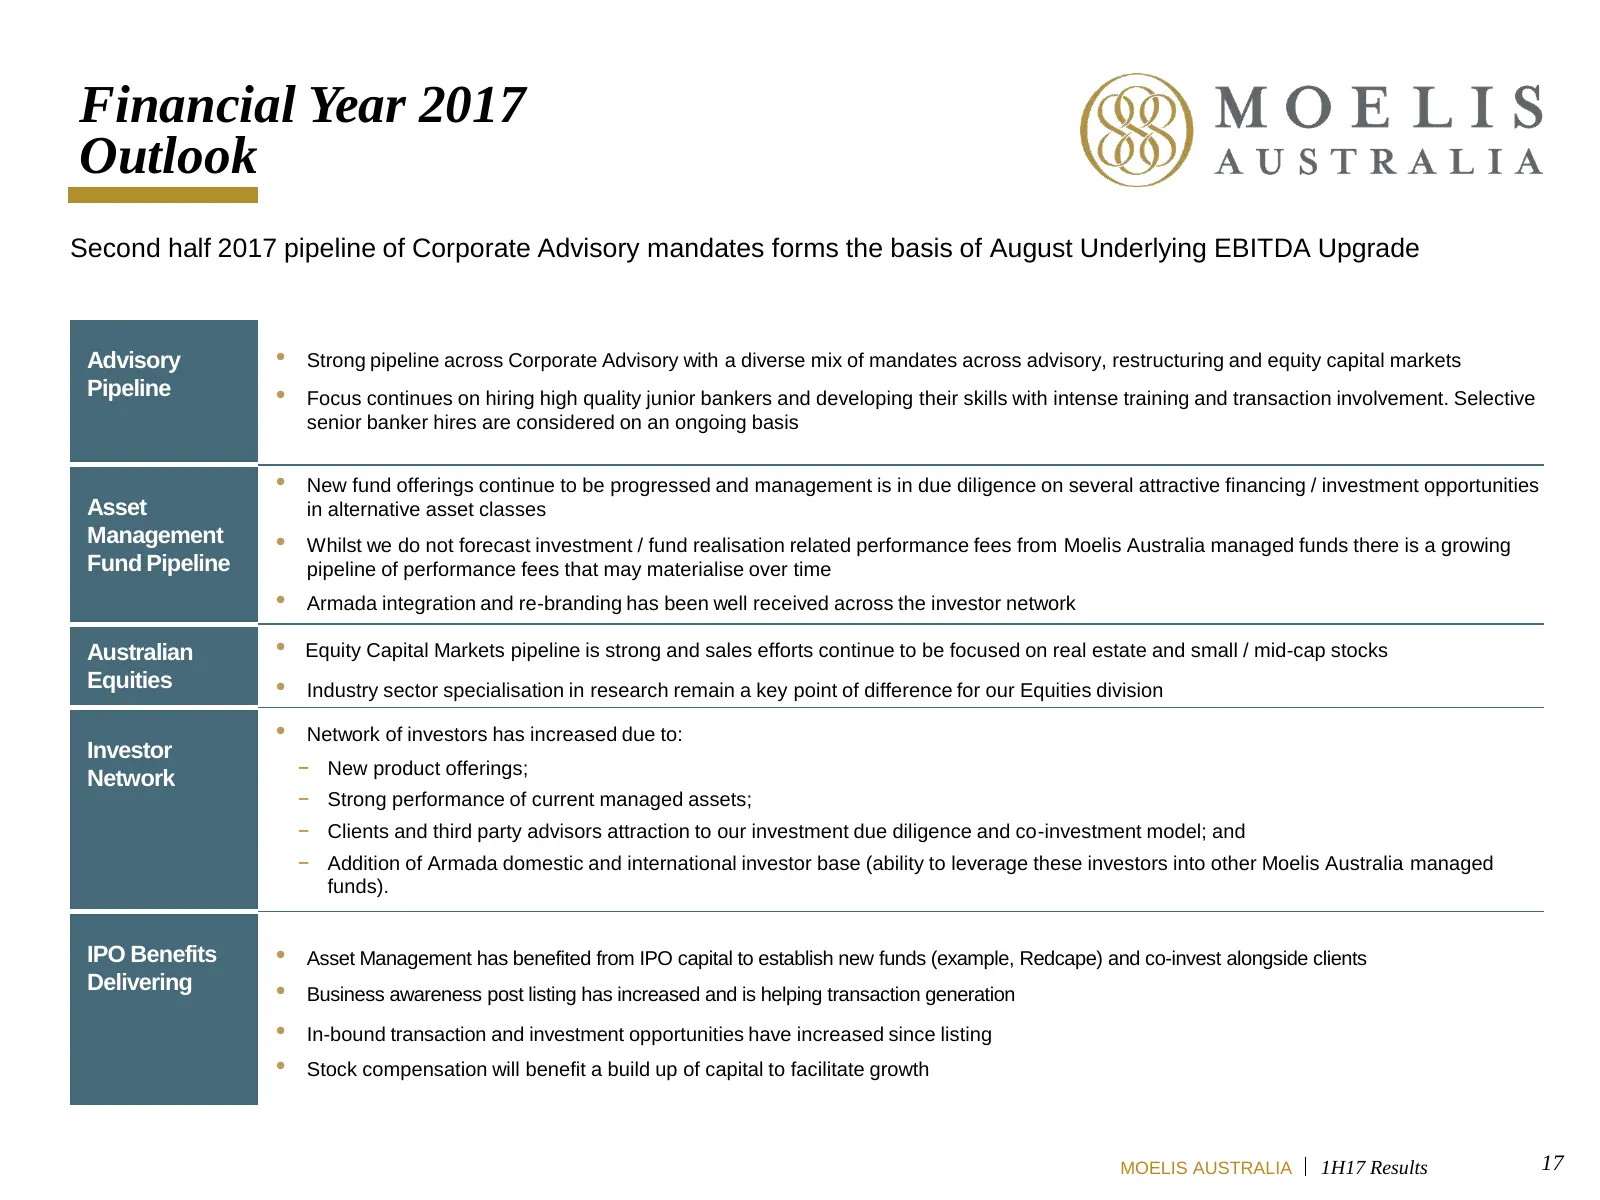
Financial Year 2017 Outlook Second half 2017 pipeline of Corporate Advisory mandates forms the basis of August Underlying EBITDA Upgrade Advisory • Strong pipeline across Corporate Advisory with a diverse mix of mandates across advisory, restructuring and equity capital markets Pipeline • Focus cont
Slide 18: A. Moelis Australia Overview
A. Moelis Australia Overview MOELIS AUSTRALIA
Slide 19: Business Overview
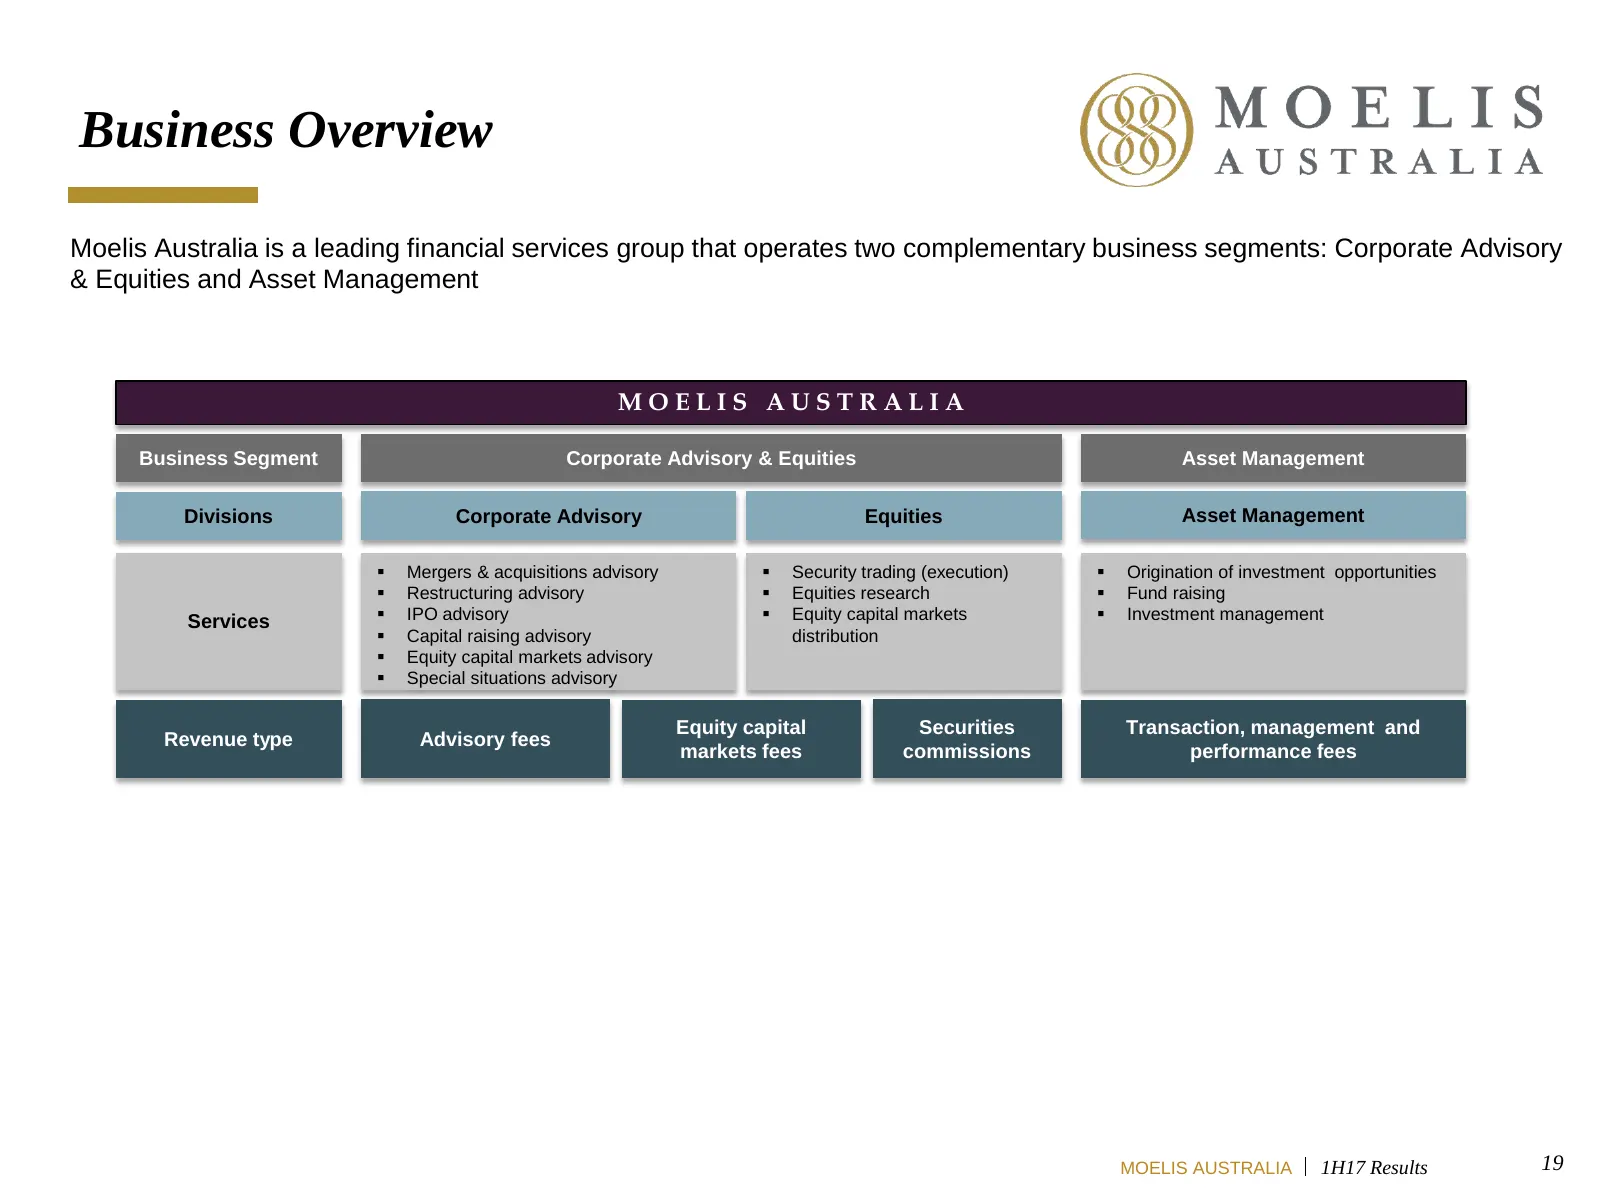
Business Overview Moelis Australia is a leading financial services group that operates two complementary business segments: Corporate Advisory & Equities and Asset Management MOELIS AUSTRALIA Business Segment Corporate Advisory & Equities Asset Management Divisions Corporate Advisory Equities Asset
Slide 20: Our History and Vision
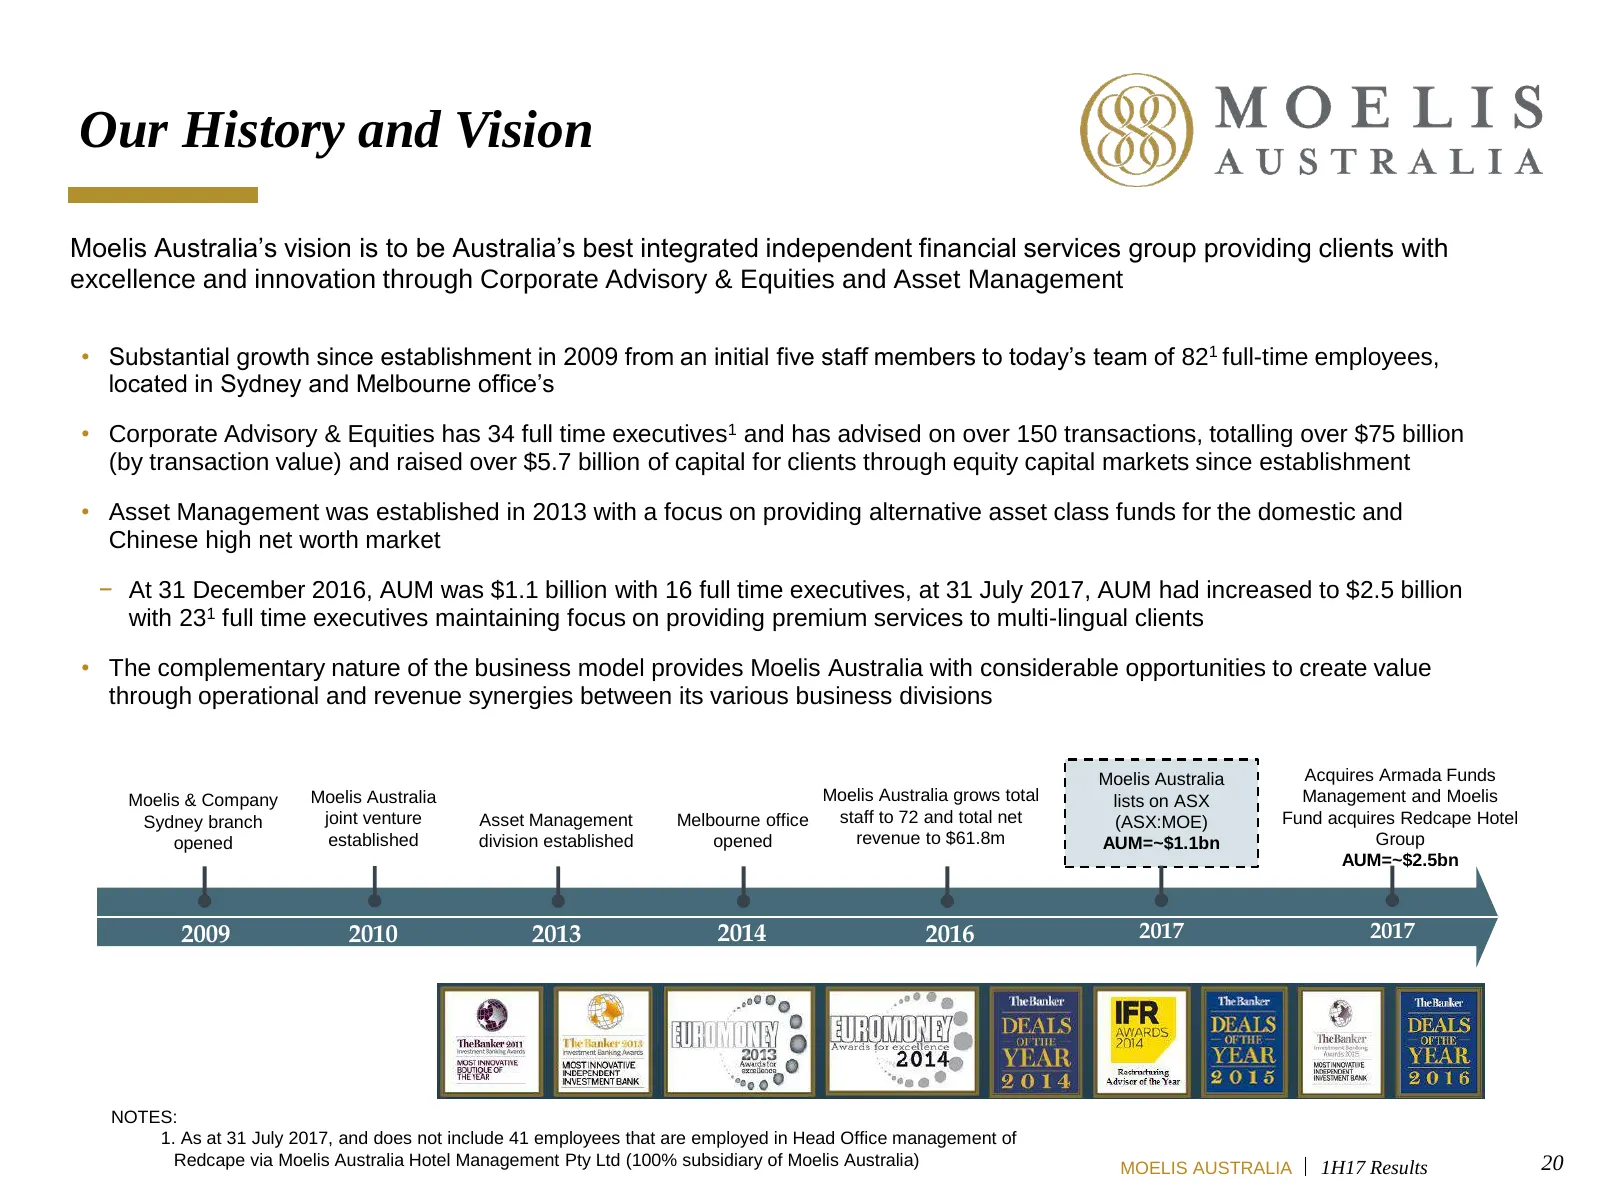
Our History and Vision Moelis Australia’s vision is to be Australia’s best integrated independent financial services group providing clients with excellence and innovation through Corporate Advisory & Equities and Asset Management • Substantial growth since establishment in 2009 from an initial five
Slide 21: Synergies Between Business Divisions
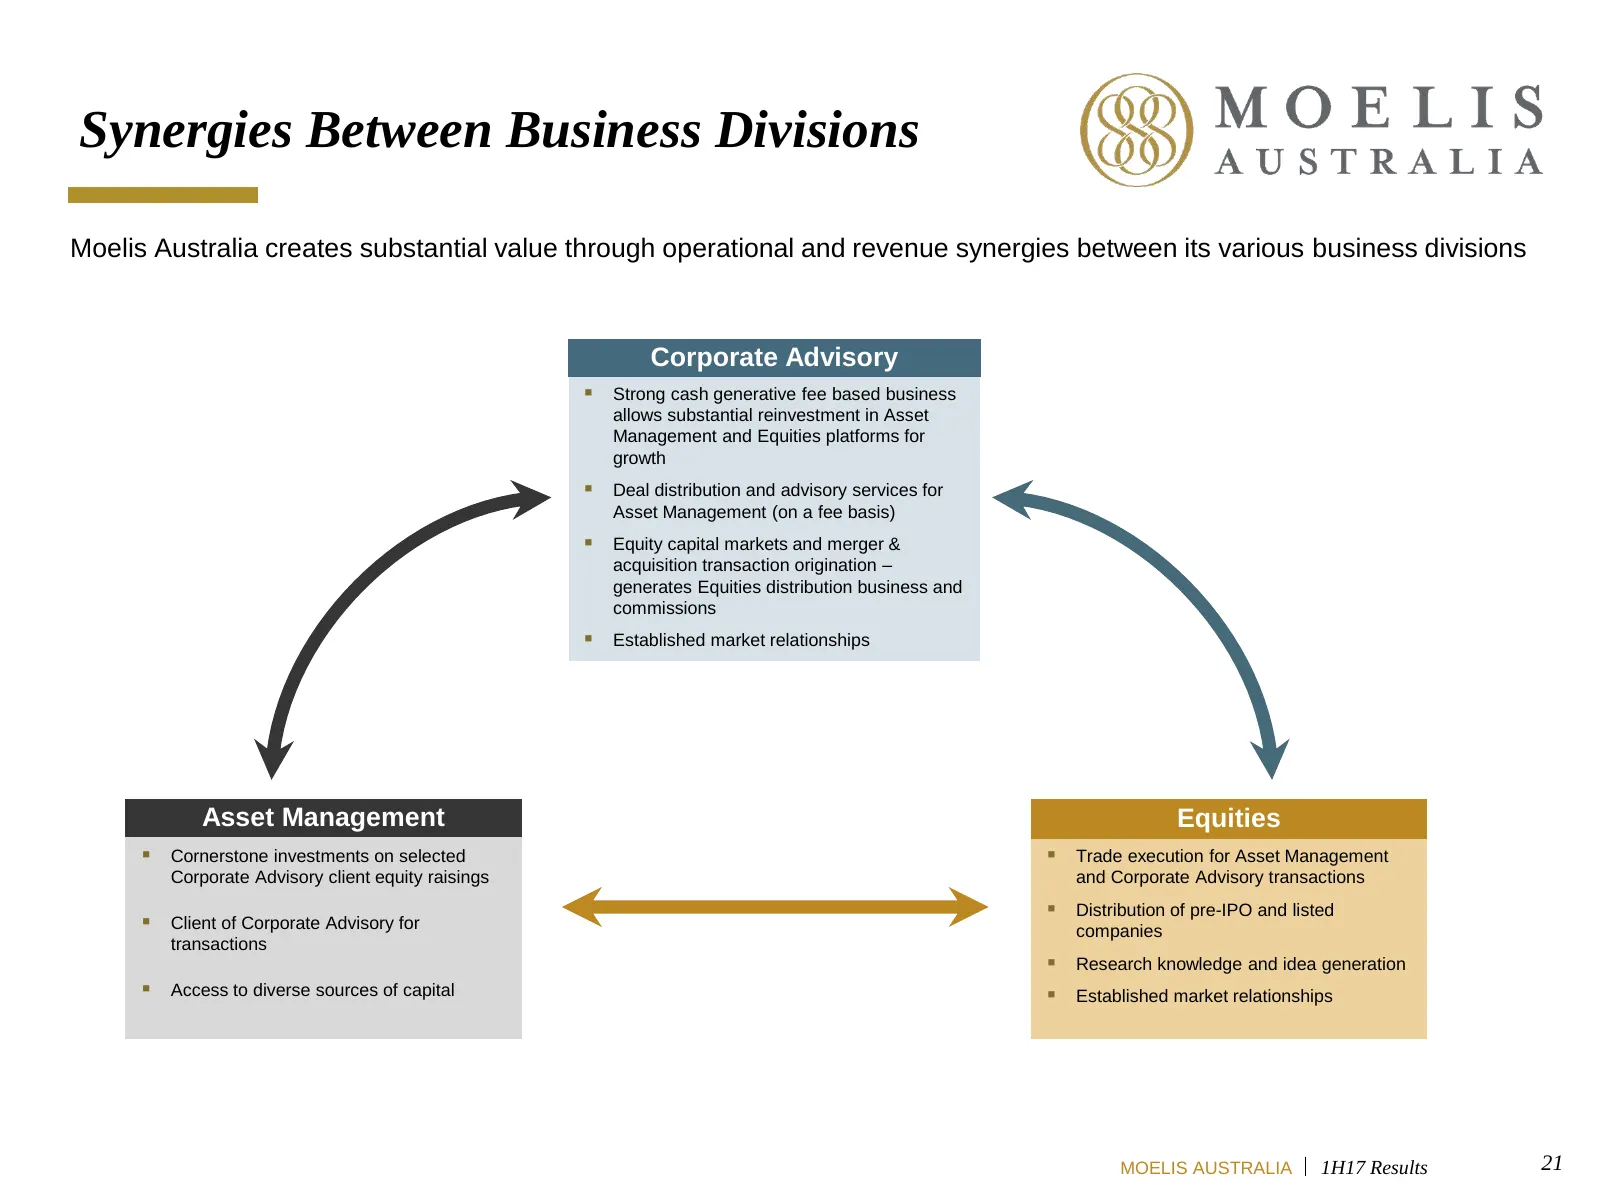
Synergies Between Business Divisions Moelis Australia creates substantial value through operational and revenue synergies between its various business divisions Corporate Advisory Strong cash generative fee based business allows substantial reinvestment in Asset Management and Equities platforms f
Slide 22: Clients
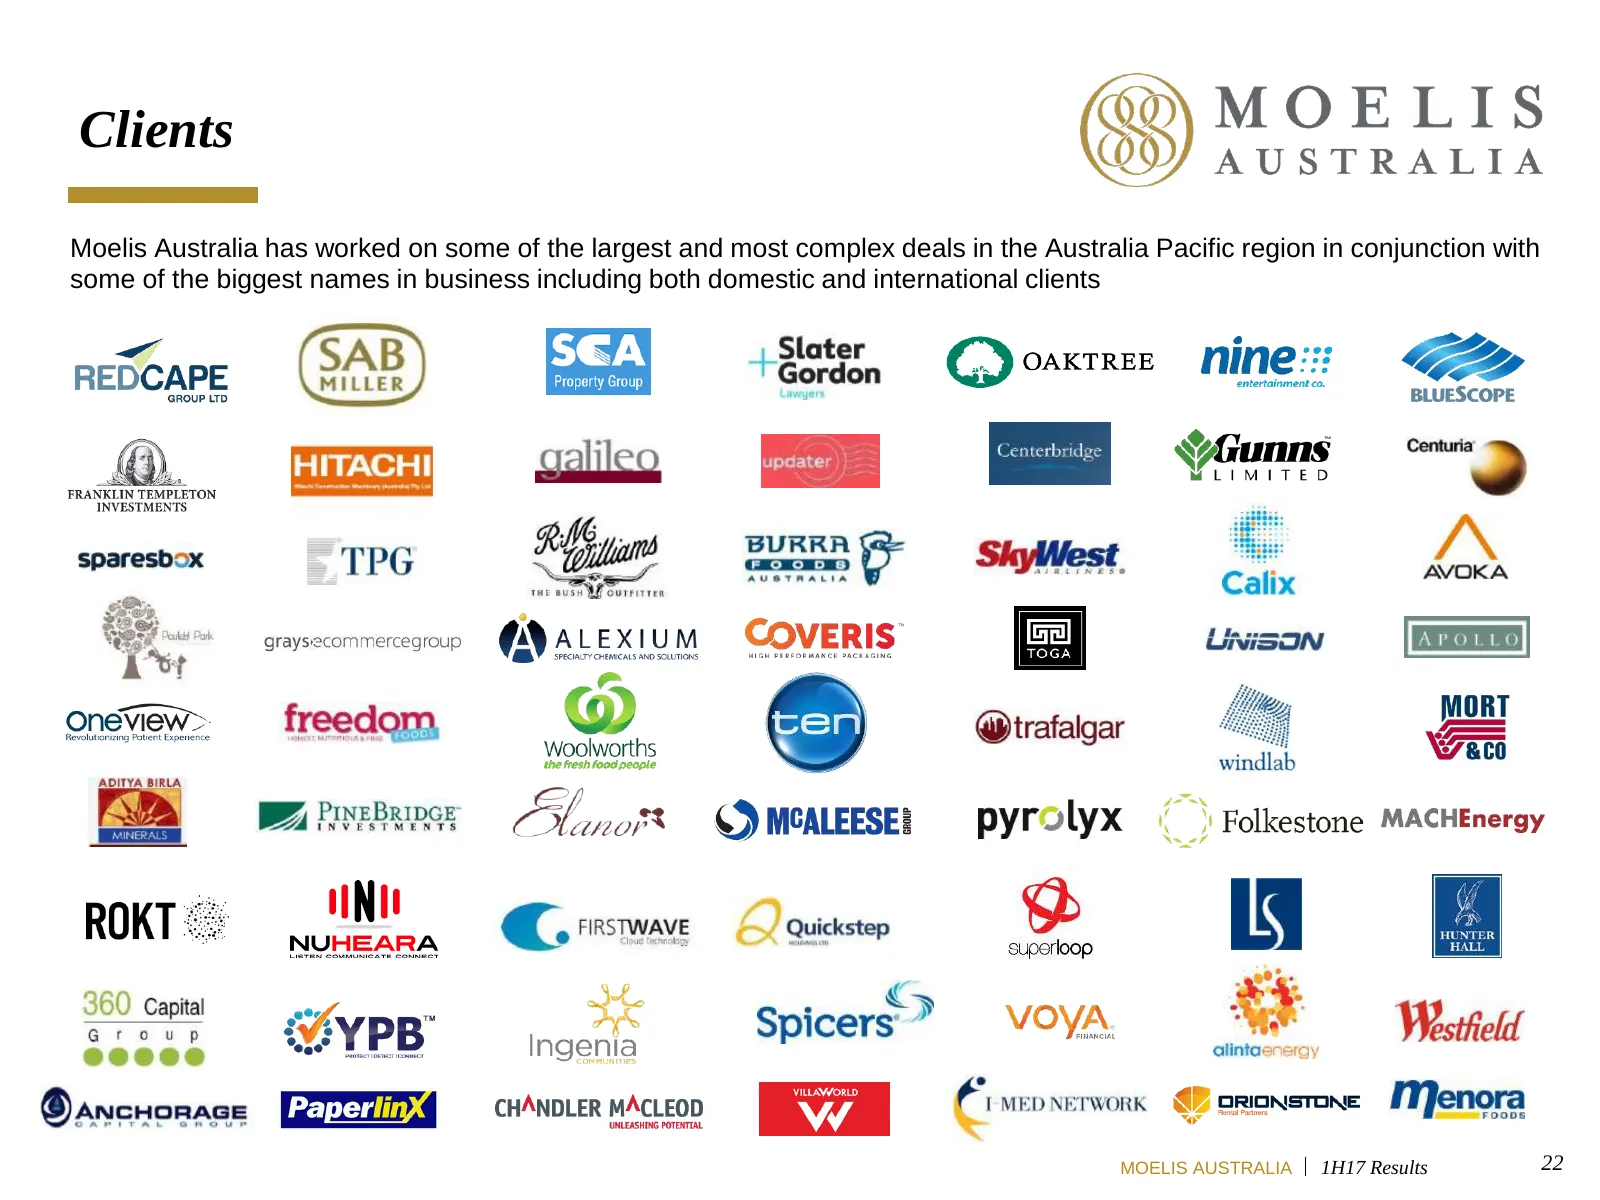
Clients Moelis Australia has worked on some of the largest and most complex deals in the Australia Pacific region in conjunction with some of the biggest names in business including both domestic and international clients MOELIS AUSTRALIA 1H17 Results 22
Slide 23: Moelis and Company Strategic Alliance
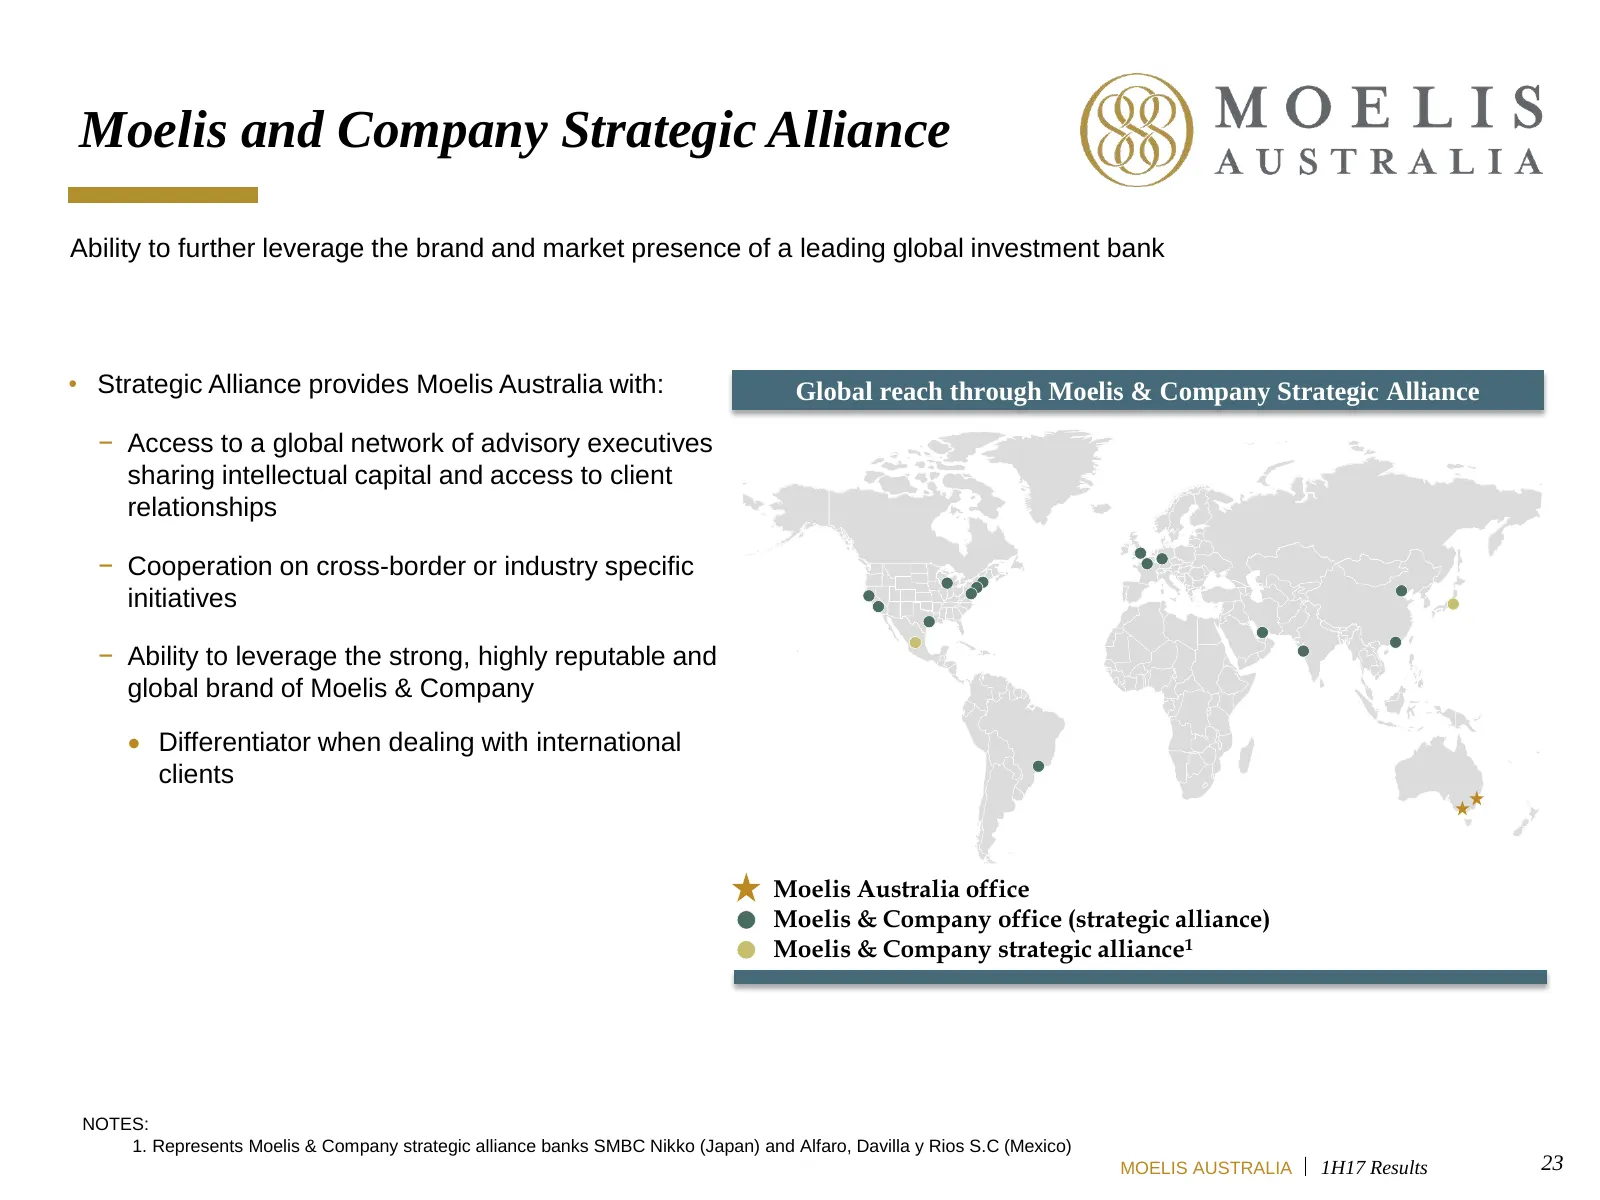
Moelis and Company Strategic Alliance Ability to further leverage the brand and market presence of a leading global investment bank • Strategic Alliance provides Moelis Australia with: Global reach through Moelis & Company Strategic Alliance − Access to a global network of advisory executives sharin
Slide 24: Disclaimer
Disclaimer The material in this presentation has been prepared by Moelis Australia Limited ABN 68 142 008 428 (Moelis Australia) and is general background information about Moelis Australia activities current as at the date of this presentation. This information is given in summary form and does not
Source: Internet Archive copy of investors.moelisaustralia.com.au
More decks from MA Financial Group Limited
 H1 2026 Earnings Presentation60 slides · Aug 20, 2026
 FY2025 Earnings Presentation60 slides · Feb 19, 2026
 1H25 Earnings Presentation57 slides · Aug 21, 2025
 FY2024 Earnings Presentation63 slides · Feb 20, 2025
 1H24 Earnings Presentation60 slides · Aug 22, 2024
 FY2023 Earnings Presentation65 slides · Feb 22, 2024