Radware Ltd. · NASDAQ:RDWR
Radware — Q3 2021 Earnings Presentation
28 slides from Radware's earnings presentation, November 2021
Slide 1: Investor Presentation
Investor Presentation November 2021 1
Slide 2: Safe Harbor
SAFE HARBOR This presentation includes “forward-looking statements” within the meaning of the Private Securities Litigation Reform Act of 1995. Any statements made herein that are not statements of historical fact, including statements about Radware’s plans, outlook, beliefs or opinions, are forward
Slide 3: Radware in a Snapshot
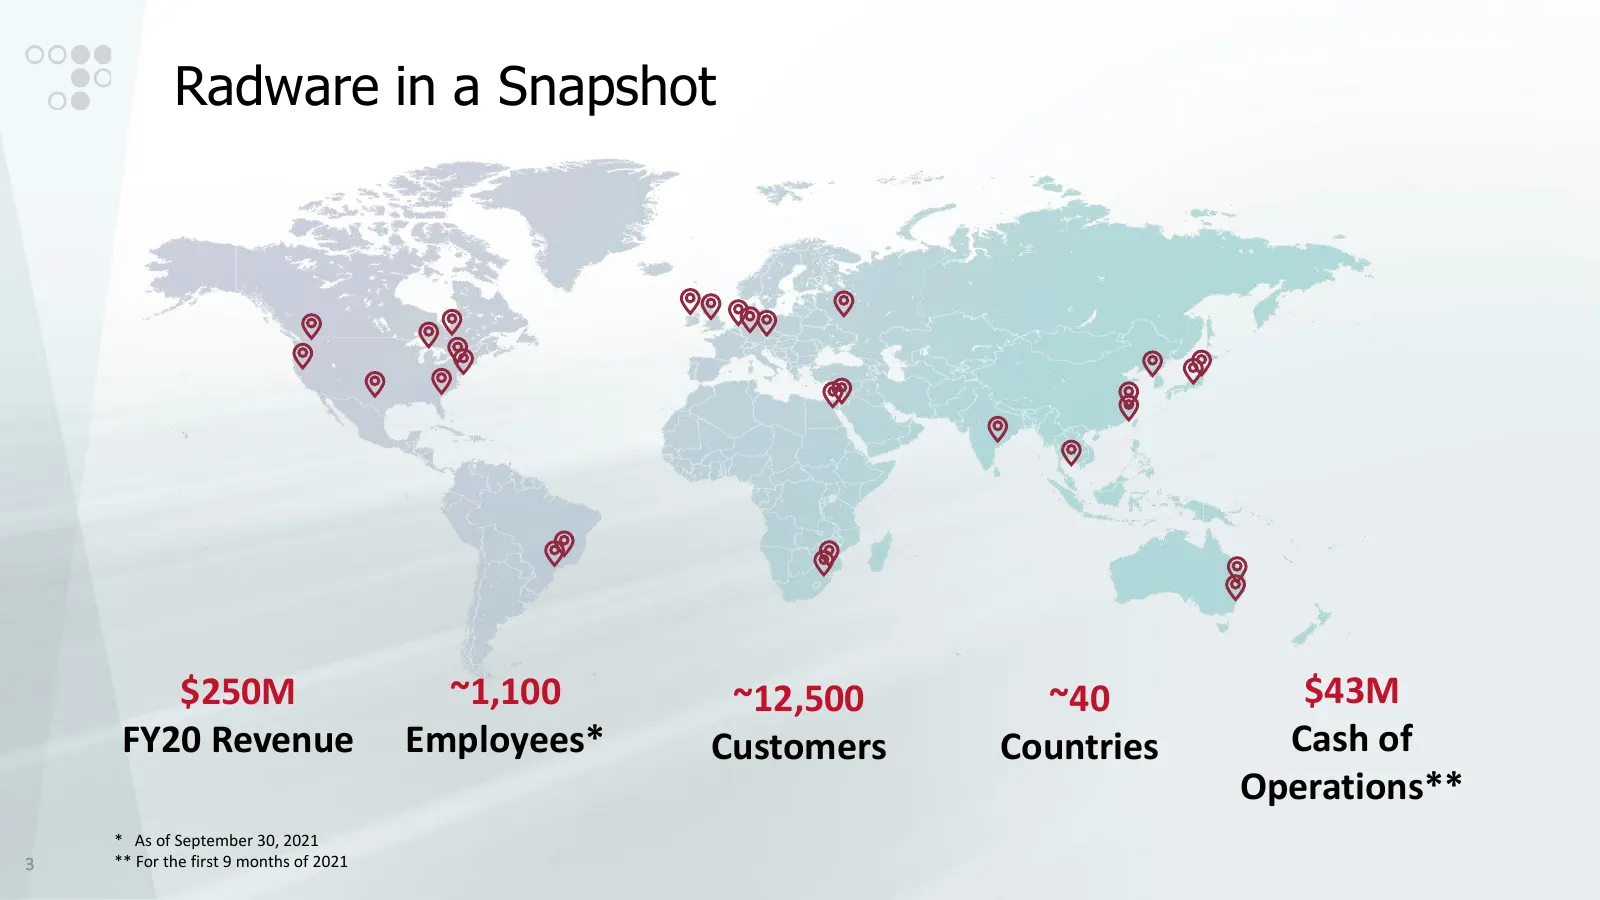
Radware in a Snapshot $250M ~1,100 ~12,500 ~40 $43M FY20 Revenue Employees* Customers Countries Cash of Operations** * As of September 30, 2021 3 ** For the first 9 months of 2021
Slide 4: We Secure Digital Experiences
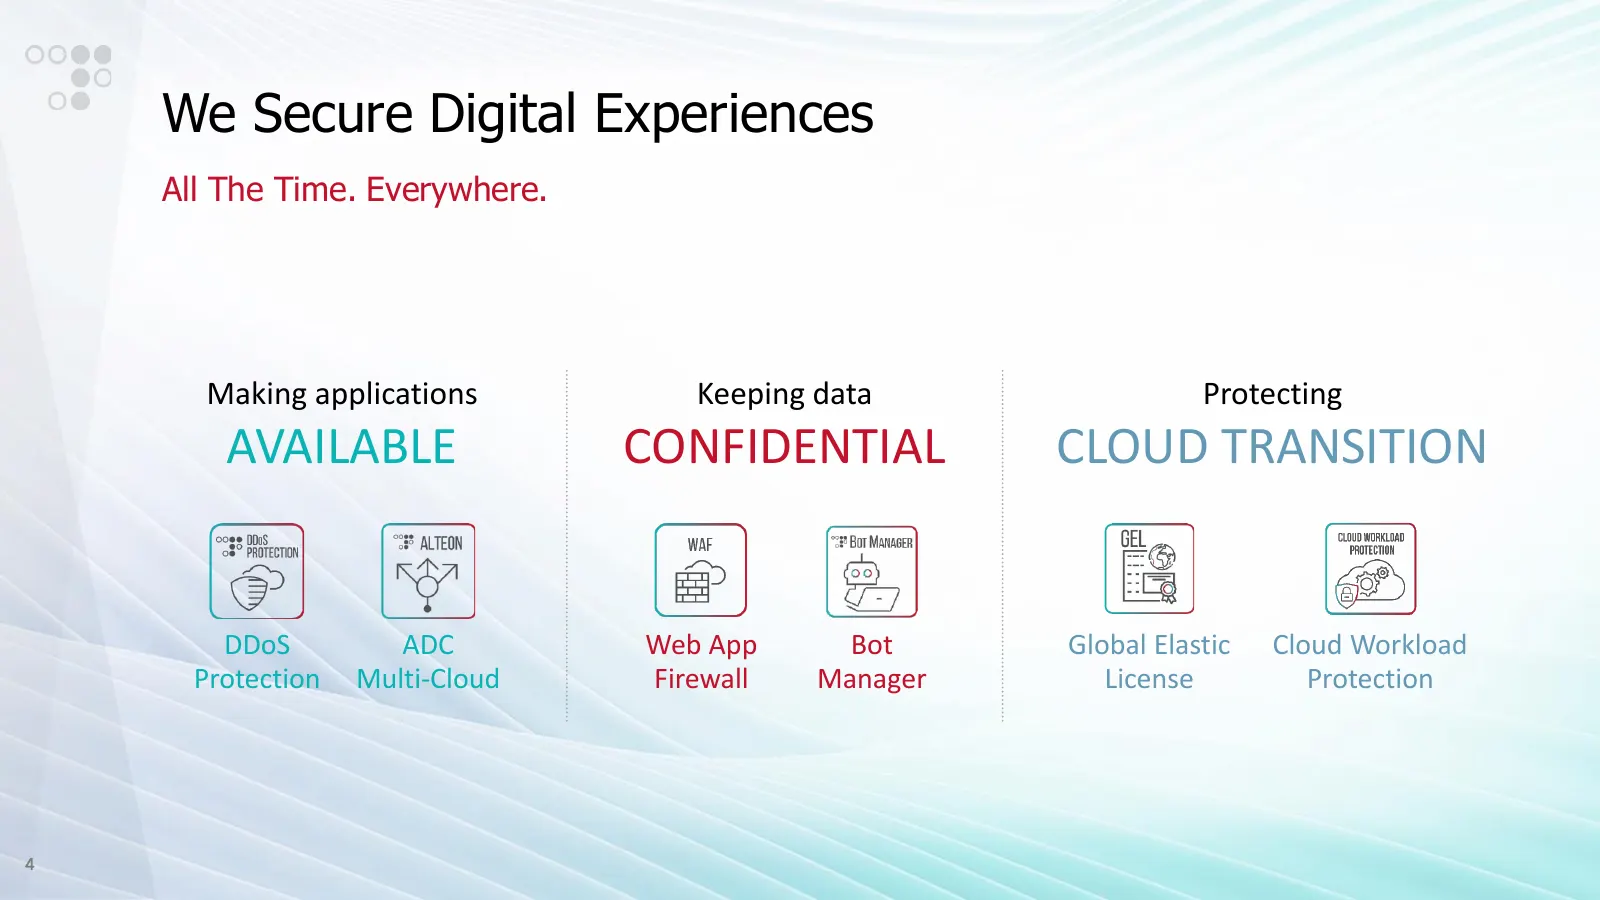
We Secure Digital Experiences All The Time. Everywhere. Making applications Keeping data Protecting AVAILABLE CONFIDENTIAL CLOUD TRANSITION DDoS ADC Web App Bot Global Elastic Cloud Workload Protection Multi-Cloud Firewall Manager License Protection 4
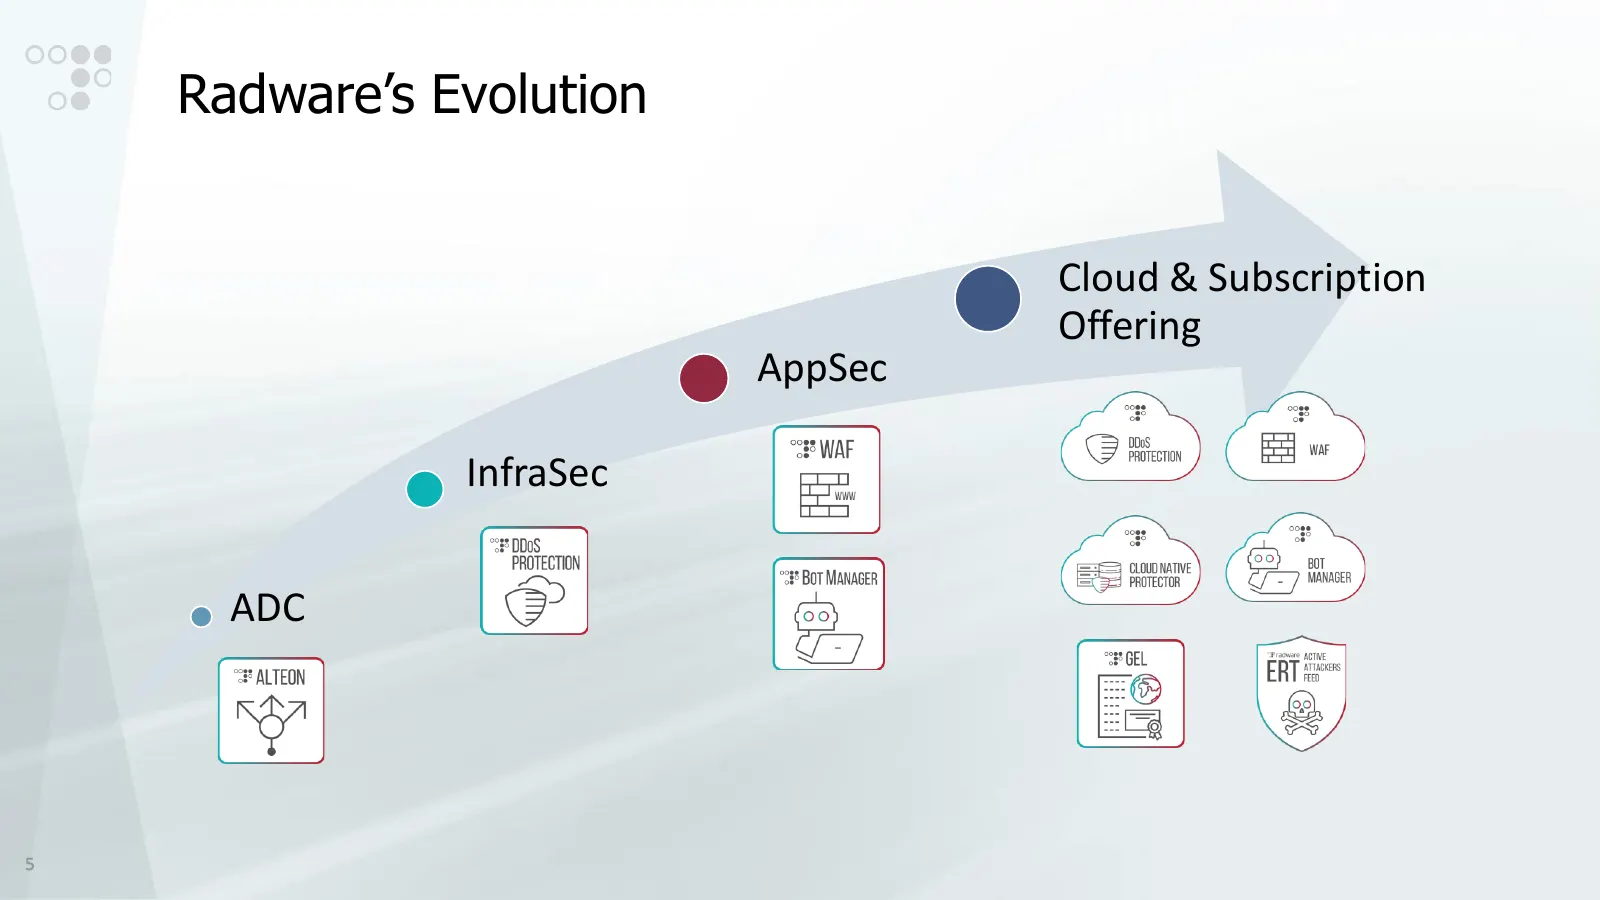
Slide 5: Radware's Evolution
Radware’s Evolution Cloud & Subscription Offering AppSec InfraSec ADC 5
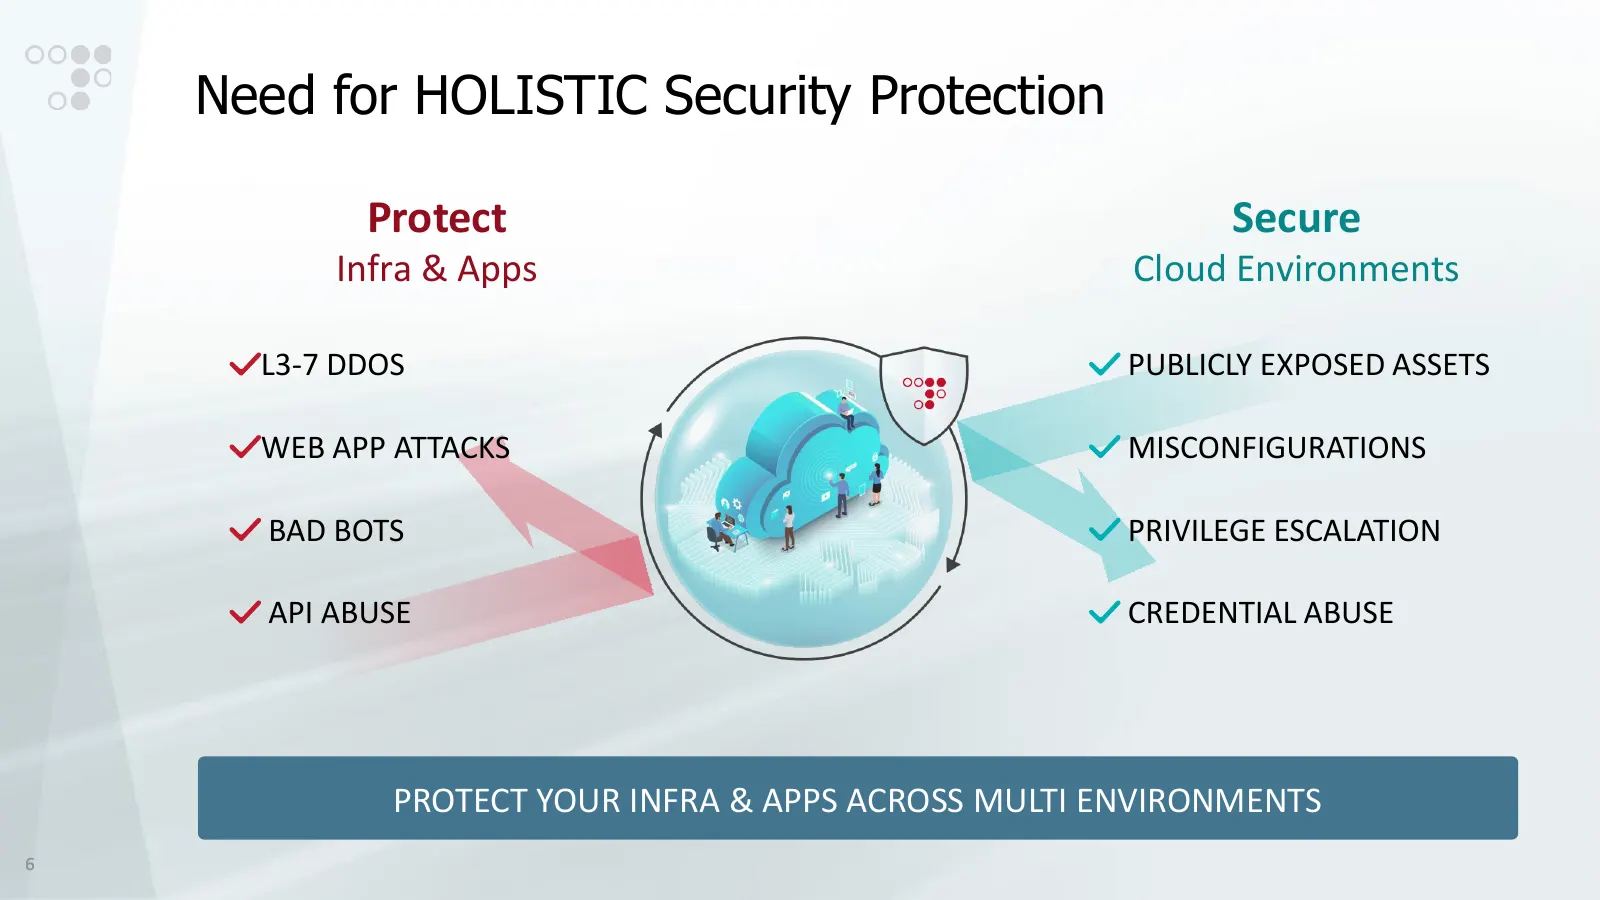
Slide 6: Need for Holistic Security Protection
Need for HOLISTIC Security Protection Protect Secure Infra & Apps Cloud Environments L3-7 DDOS PUBLICLY EXPOSED ASSETS WEB APP ATTACKS MISCONFIGURATIONS BAD BOTS PRIVILEGE ESCALATION API ABUSE CREDENTIAL ABUSE PROTECT YOUR INFRA & APPS ACROSS MULTI ENVIRONMENTS 6
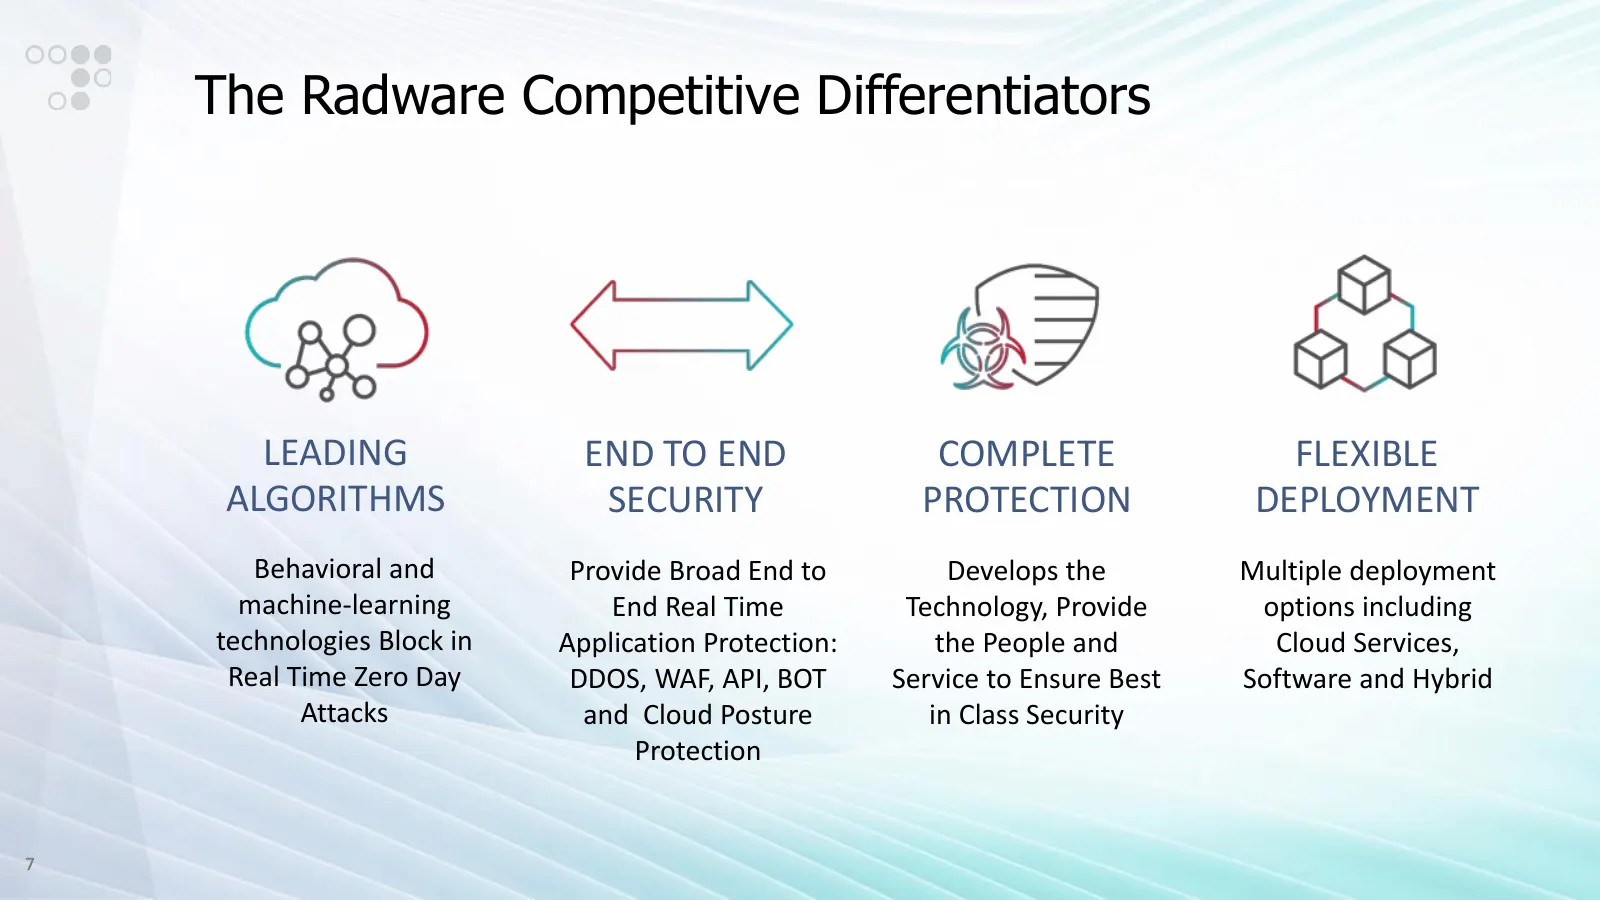
Slide 7: The Radware Competitive Differentiators
The Radware Competitive Differentiators LEADING END TO END COMPLETE FLEXIBLE ALGORITHMS SECURITY PROTECTION DEPLOYMENT Behavioral and Provide Broad End to Develops the Multiple deployment machine-learning End Real Time Technology, Provide options including technologies Block in Application Protectio
Slide 8: Investment Highlights
Investment Highlights Major Market A Leader in Strong Customer Fast Growing Opportunities Cybersecurity Base & Subscription Partnerships Business 8
Slide 9: Investment Highlights
Investment Highlights Major Market A Leader in Strong Customer Fast Growing Opportunities Cybersecurity Base & Subscription Partnerships Business 9
Slide 10: Major Market Opportunity
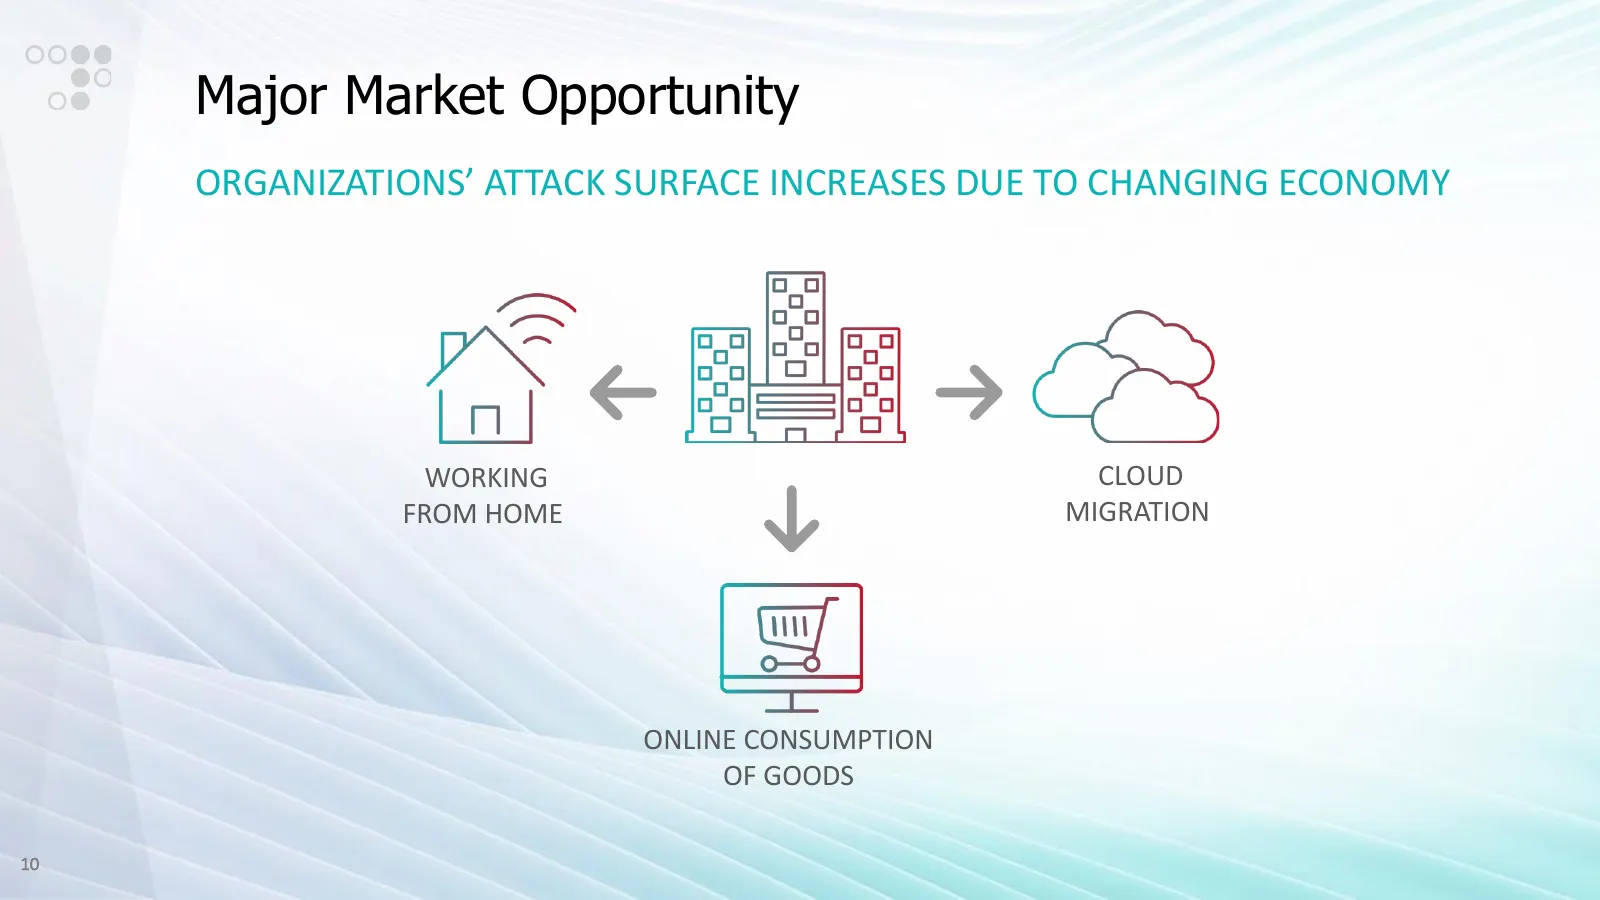
Major Market Opportunity ORGANIZATIONS’ ATTACK SURFACE INCREASES DUE TO CHANGING ECONOMY WORKING CLOUD FROM HOME MIGRATION ONLINE CONSUMPTION OF GOODS 10
Slide 11: Our Markets are Growing Fast
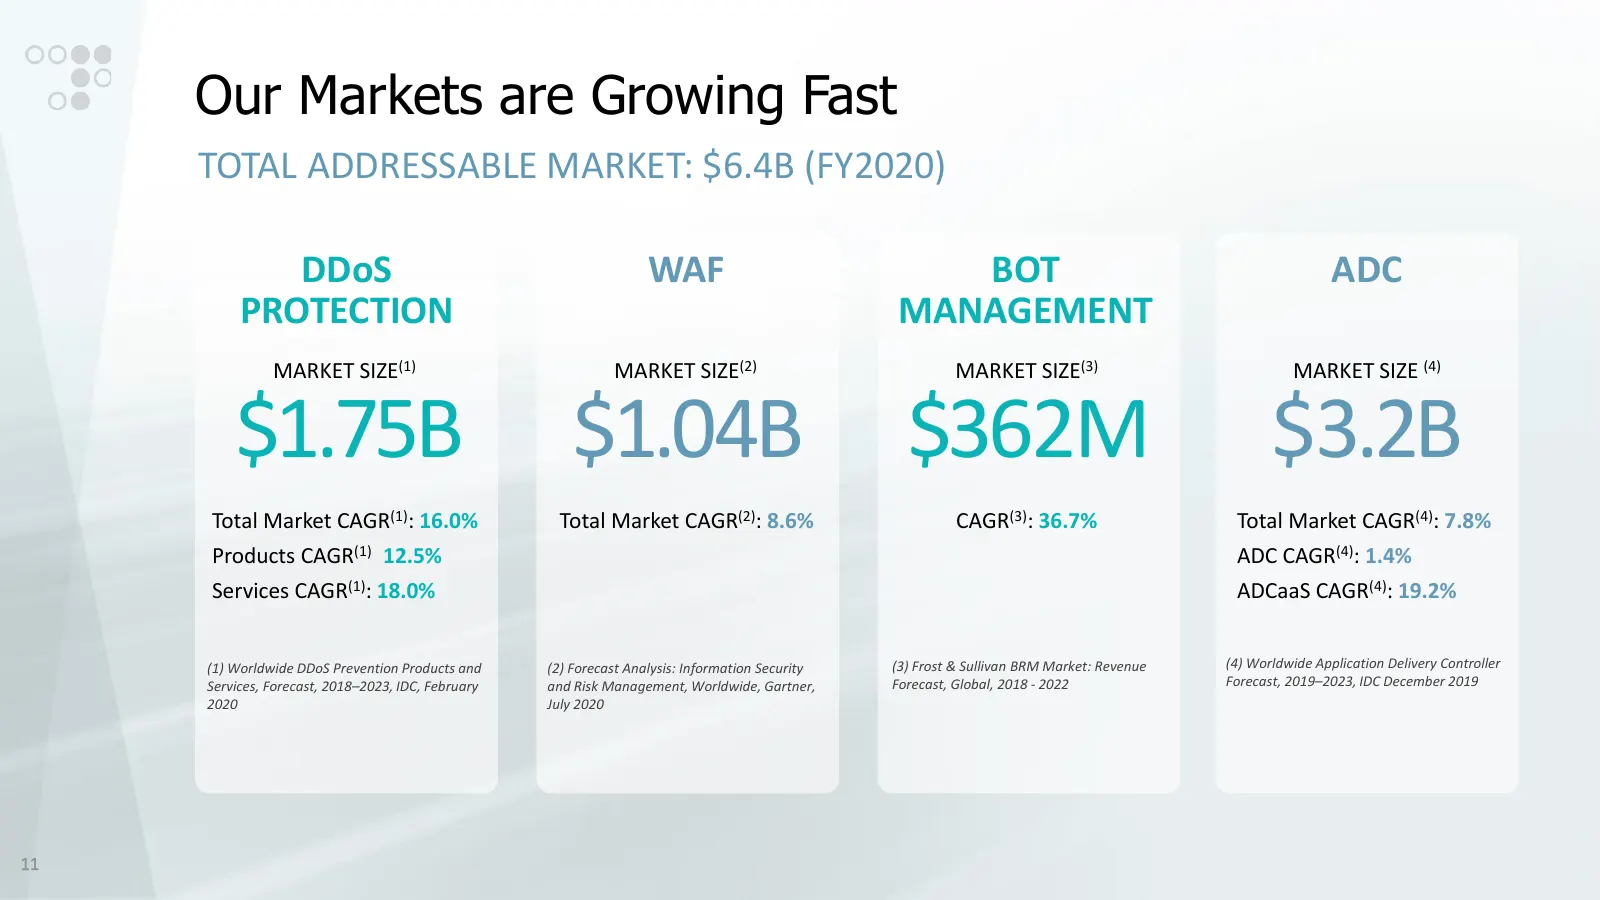
Our Markets are Growing Fast TOTAL ADDRESSABLE MARKET: $6.4B (FY2020) DDoS WAF BOT ADC PROTECTION MANAGEMENT MARKET SIZE(1) MARKET SIZE(2) MARKET SIZE(3) MARKET SIZE (4) $1.75B $1.04B $362M $3.2B Total Market CAGR(1): 16.0% Total Market CAGR(2): 8.6% CAGR(3): 36.7% Total Market CAGR(4): 7.8% Product
Slide 12: Investment Highlights
Investment Highlights Major Market A Leader in Strong Customer Fast Growing Opportunities Cybersecurity Base & Subscription Partnerships Business 12
Slide 13: Winning Industry Recognition
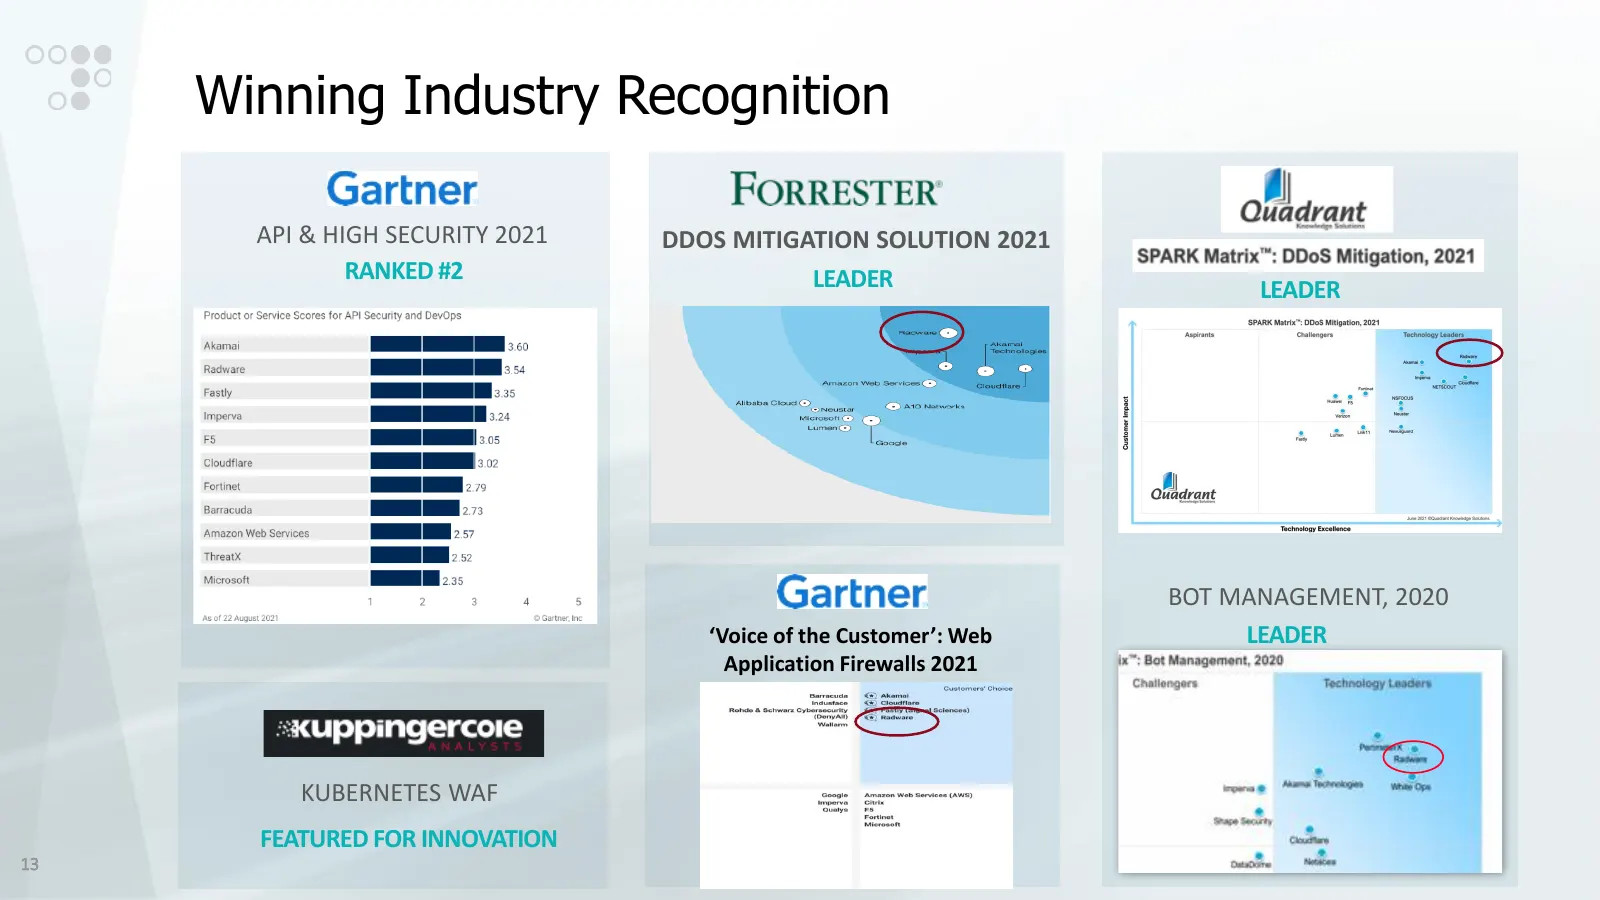
Winning Industry Recognition API & HIGH SECURITY 2021 DDOS MITIGATION SOLUTION 2021 RANKED #2 LEADER LEADER BOT MANAGEMENT, 2020 ‘Voice of the Customer’: Web LEADER Application Firewalls 2021 KUBERNETES WAF FEATURED FOR INNOVATION 13
Slide 14: Our Solutions Are Highly Effective
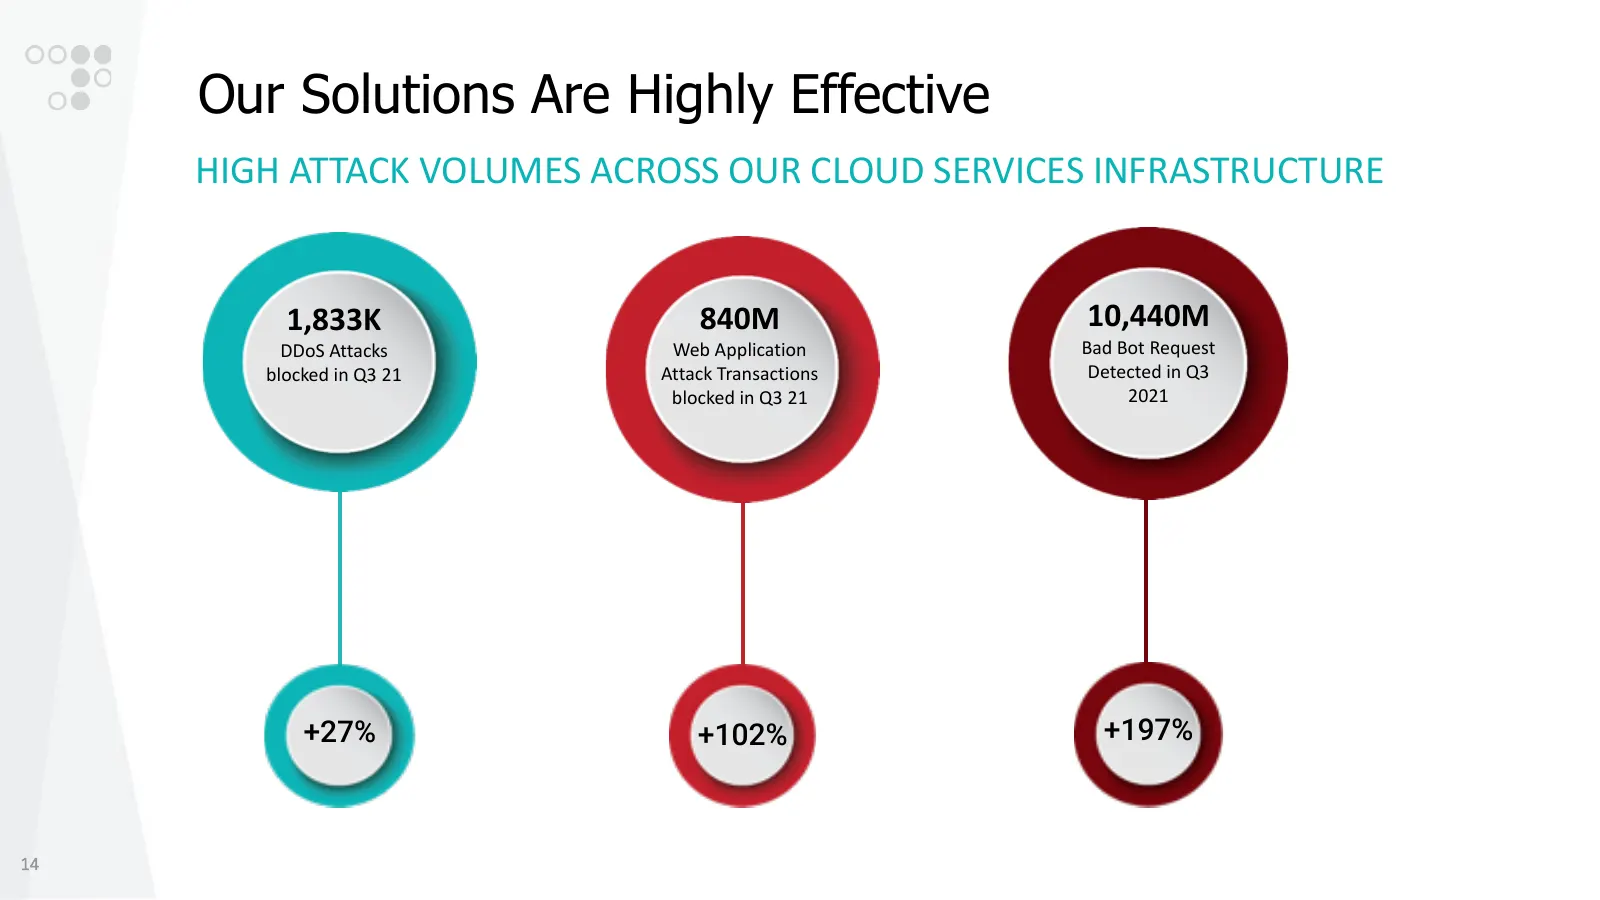
Our Solutions Are Highly Effective HIGH ATTACK VOLUMES ACROSS OUR CLOUD SERVICES INFRASTRUCTURE 1,833K 840M 10,440M DDoS Attacks Web Application Bad Bot Request blocked in Q3 21 Attack Transactions Detected in Q3 blocked in Q3 21 2021 +27% +102% +197% 14
Slide 15: Investment Highlights
Investment Highlights Major Market A Leader in Strong Customer Fast Growing Opportunities Cybersecurity Base & Subscription Partnerships Business 15
Slide 16: Strong Customer Base and Partnerships
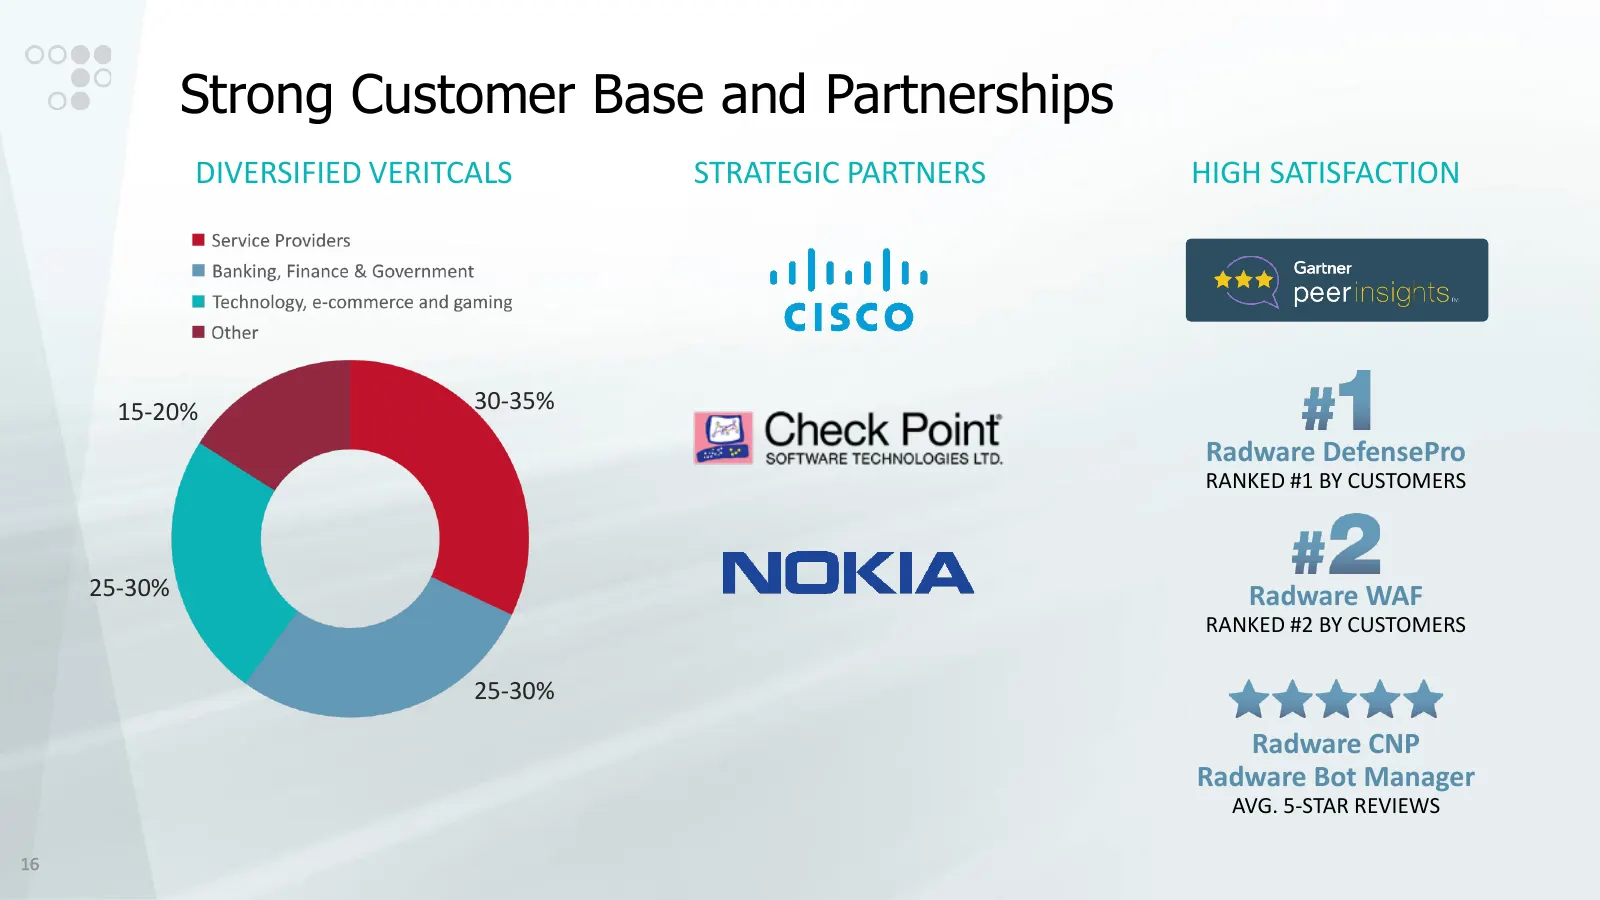
Strong Customer Base and Partnerships DIVERSIFIED VERITCALS STRATEGIC PARTNERS HIGH SATISFACTION 15-20% 30-35% Radware DefensePro RANKED #1 BY CUSTOMERS 25-30% Radware WAF RANKED #2 BY CUSTOMERS 25-30% Radware CNP Radware Bot Manager AVG. 5-STAR REVIEWS 16
Slide 17: Leadership by Top Customers
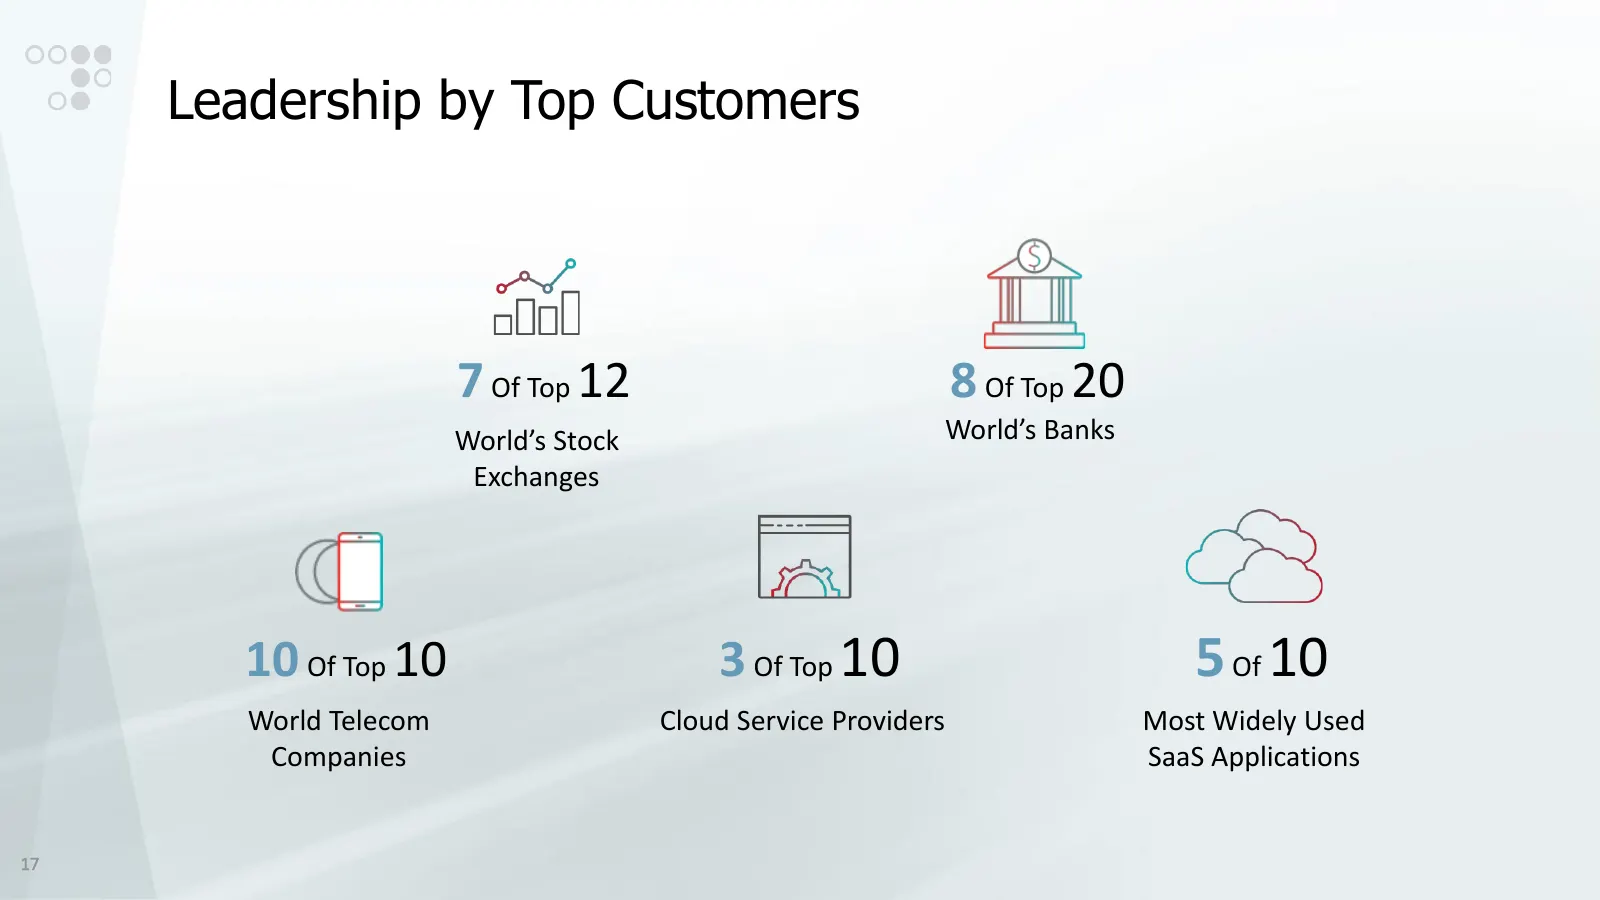
Leadership by Top Customers 7 Of Top 12 8 Of Top 20 World’s Stock World’s Banks Exchanges 10 Of Top 10 3 Of Top 10 5 Of 10 World Telecom Cloud Service Providers Most Widely Used Companies SaaS Applications 17
Slide 18: Investment Highlights
Investment Highlights Major Market A Leader in Strong Customer Fast Growing Opportunities Cybersecurity Base & Subscription Partnerships Business 18
Slide 19: Fast Growing Subscriptions Business
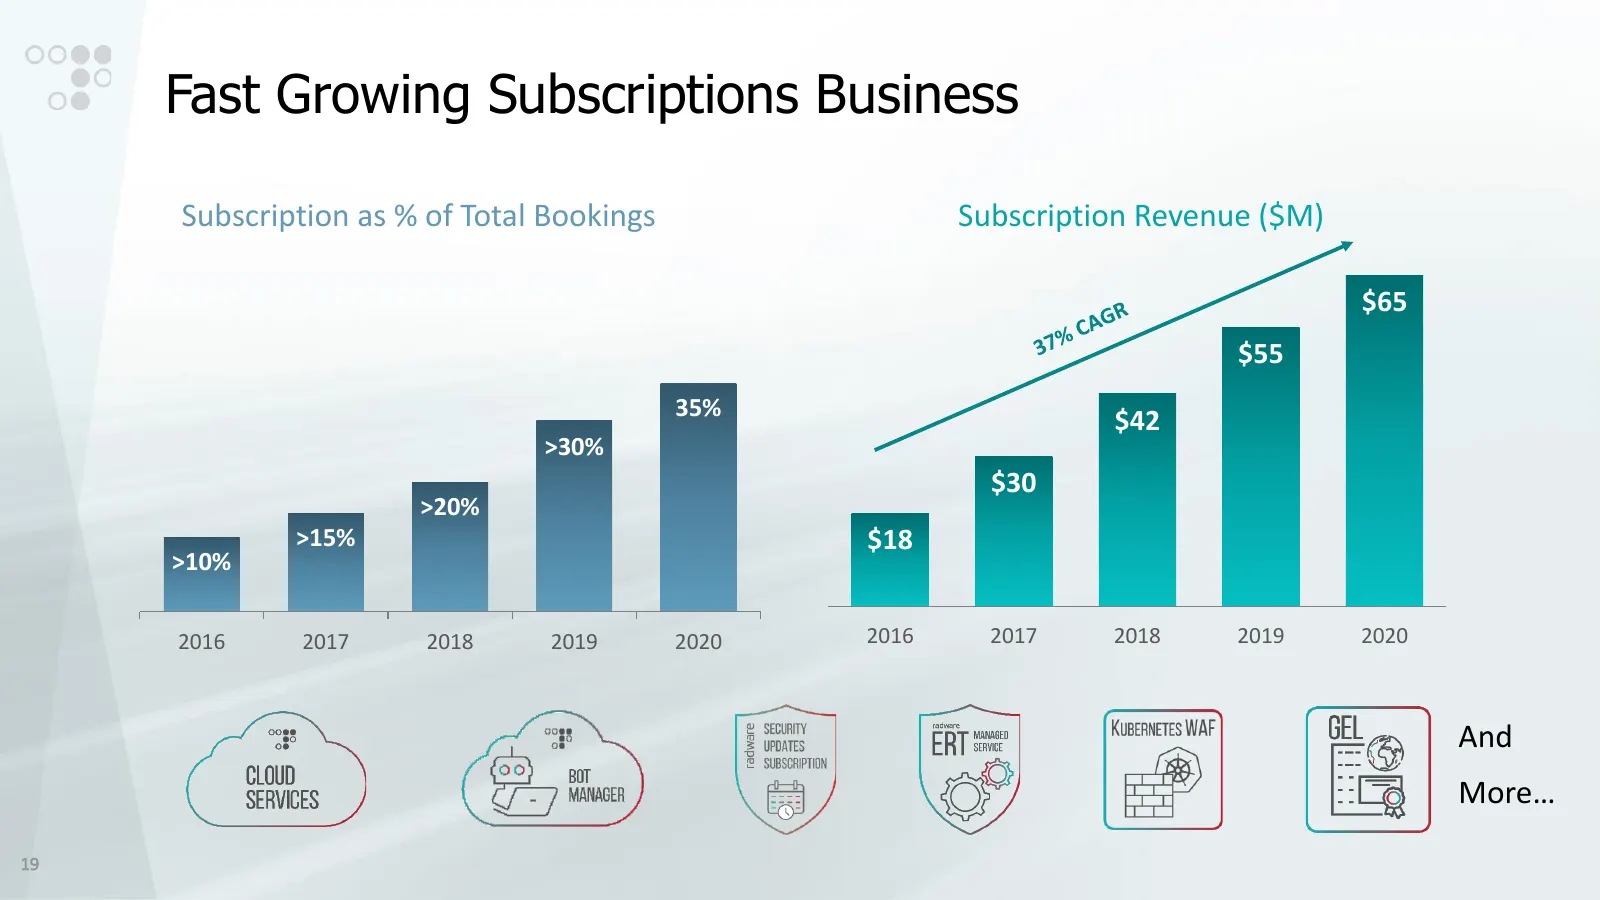
Fast Growing Subscriptions Business Subscription as % of Total Bookings Subscription Revenue ($M) $65 $55 35% $42 >30% $30 >20% >15% $18 >10% 2016 2017 2018 2019 2020 2016 2017 2018 2019 2020 And More… 19
Slide 20: Growth Strategy
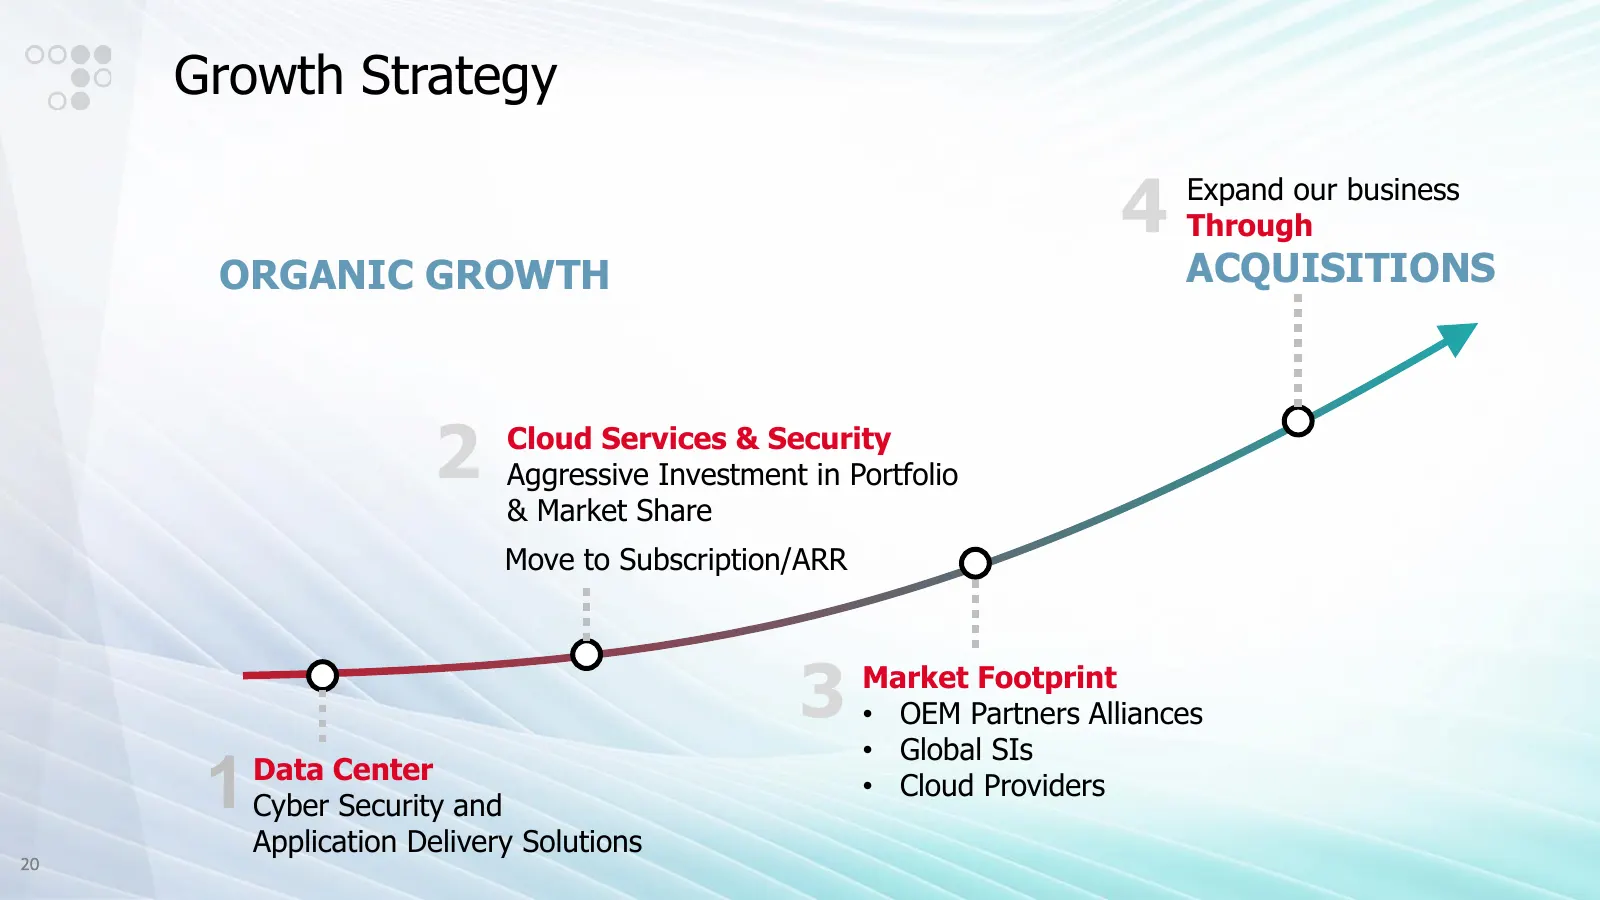
Growth Strategy 4 Expand our business Through ORGANIC GROWTH ACQUISITIONS 2 Cloud Services & Security Aggressive Investment in Portfolio & Market Share Move to Subscription/ARR 3 Market Footprint • OEM Partners Alliances • Global SIs 1 Data Center Cyber Security and • Cloud Providers Application Del

Slide 21: Financials
FINANCIALS 21
Slide 22: Q3 2021 Highlights
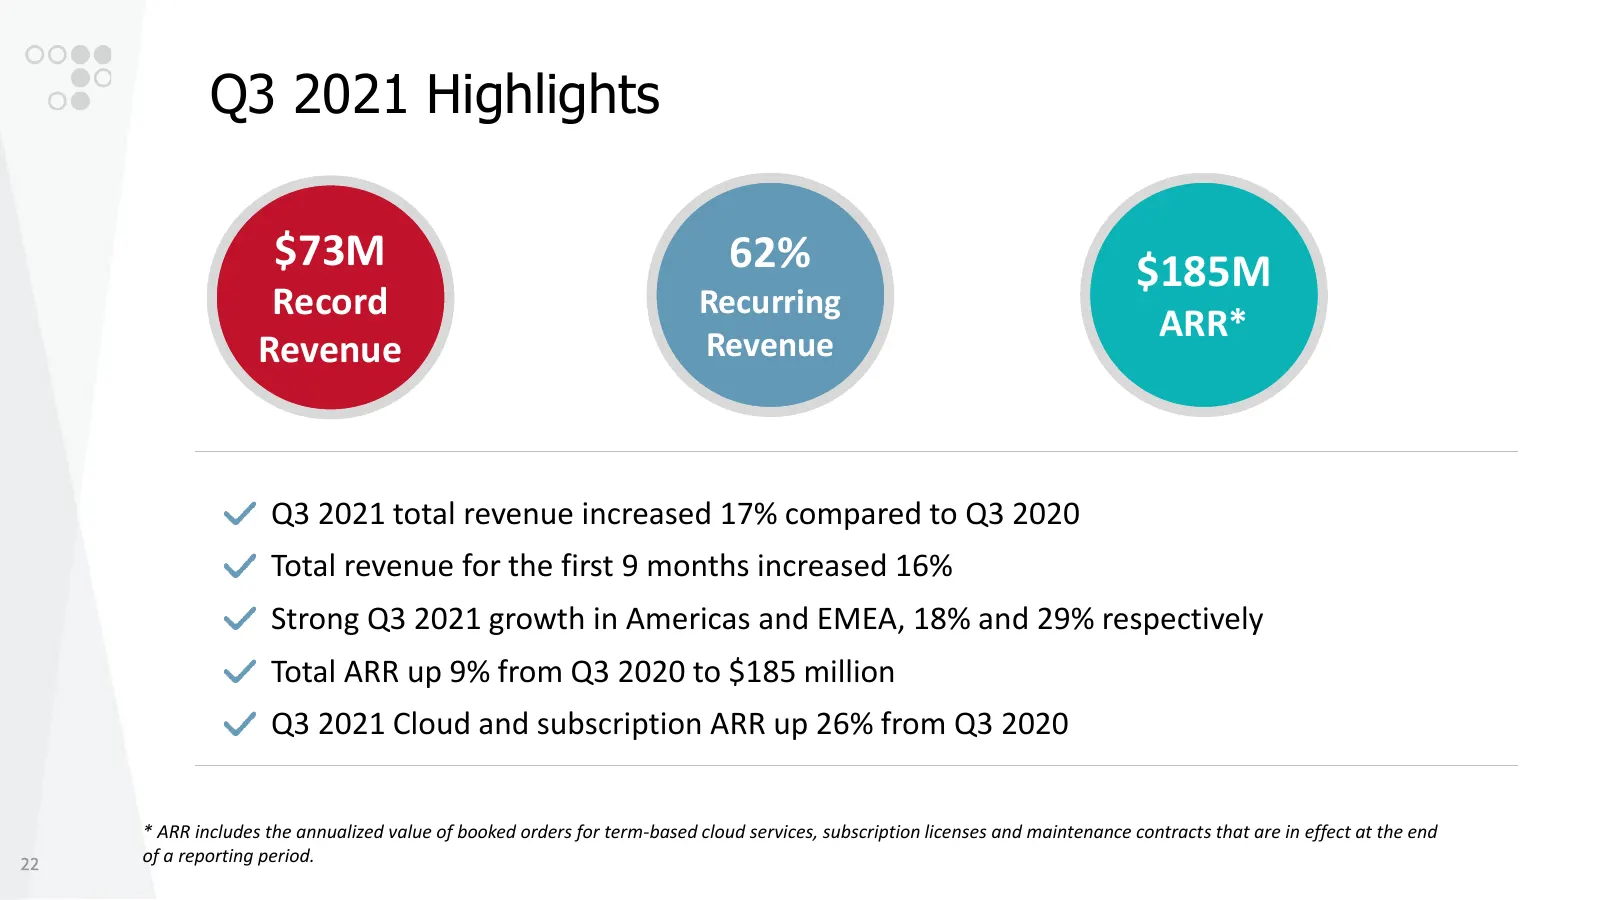
Q3 2021 Highlights $73M 62% $185M Record Recurring ARR* Revenue Revenue Q3 2021 total revenue increased 17% compared to Q3 2020 Total revenue for the first 9 months increased 16% Strong Q3 2021 growth in Americas and EMEA, 18% and 29% respectively Total ARR up 9% from Q3 2020 to $185 million Q3 2021
Slide 23: Revenues Trends ($M)
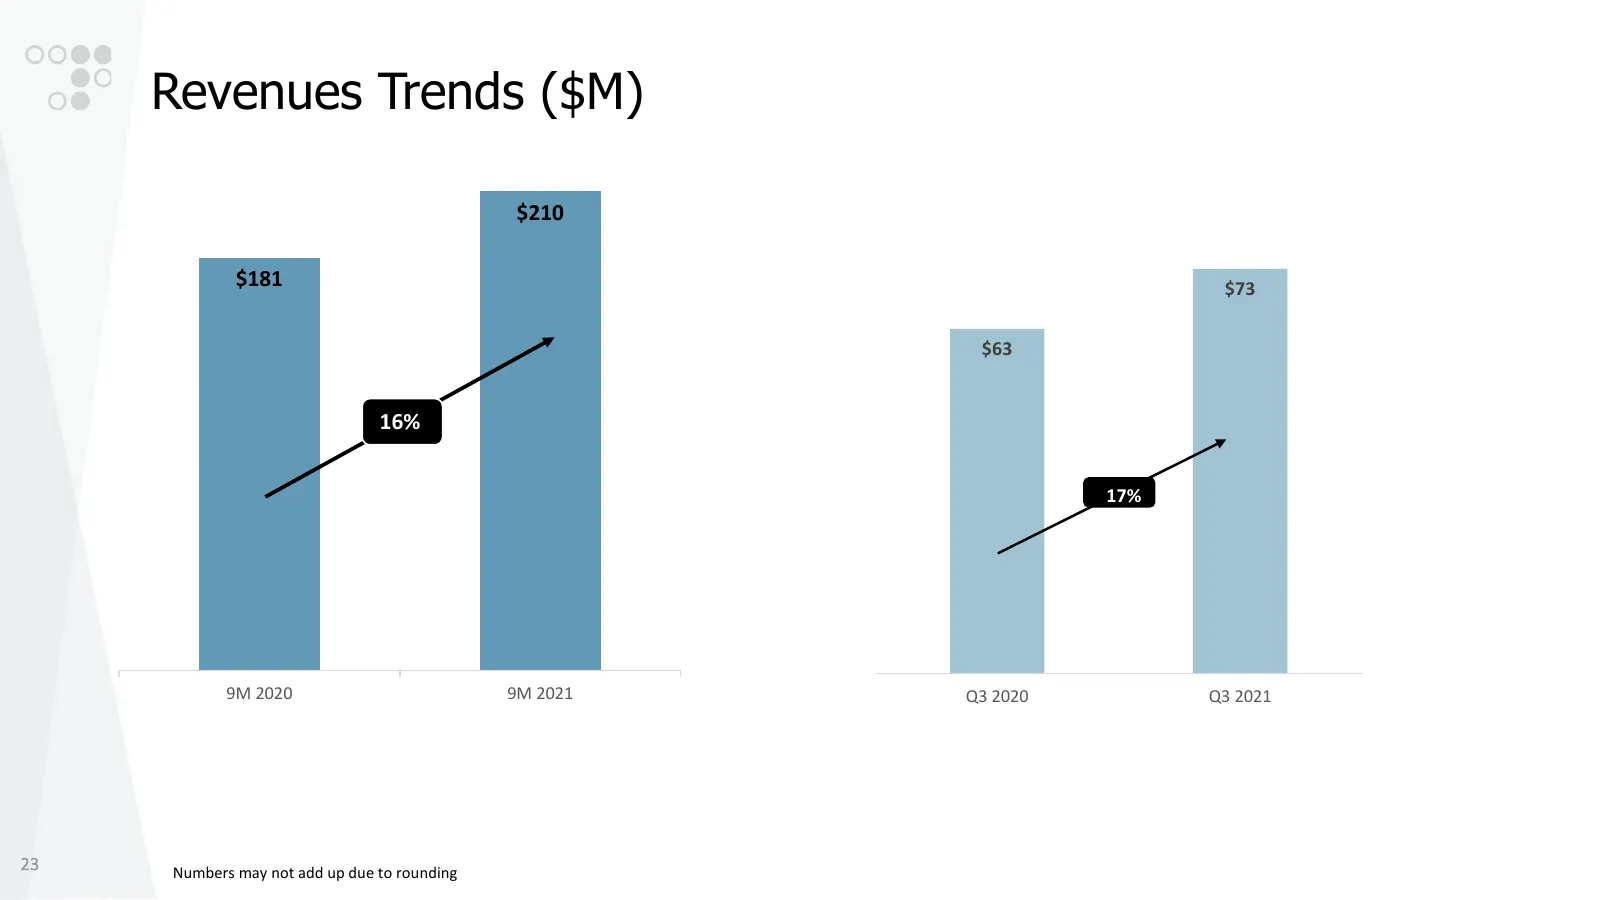
Revenues Trends ($M) $210 $181 $73 $63 16% 17% 11% 9M 2020 9M 2021 Q3 2020 Q3 2021 23 Numbers may not add up due to rounding
Slide 24: Revenues By Geographies ($M)
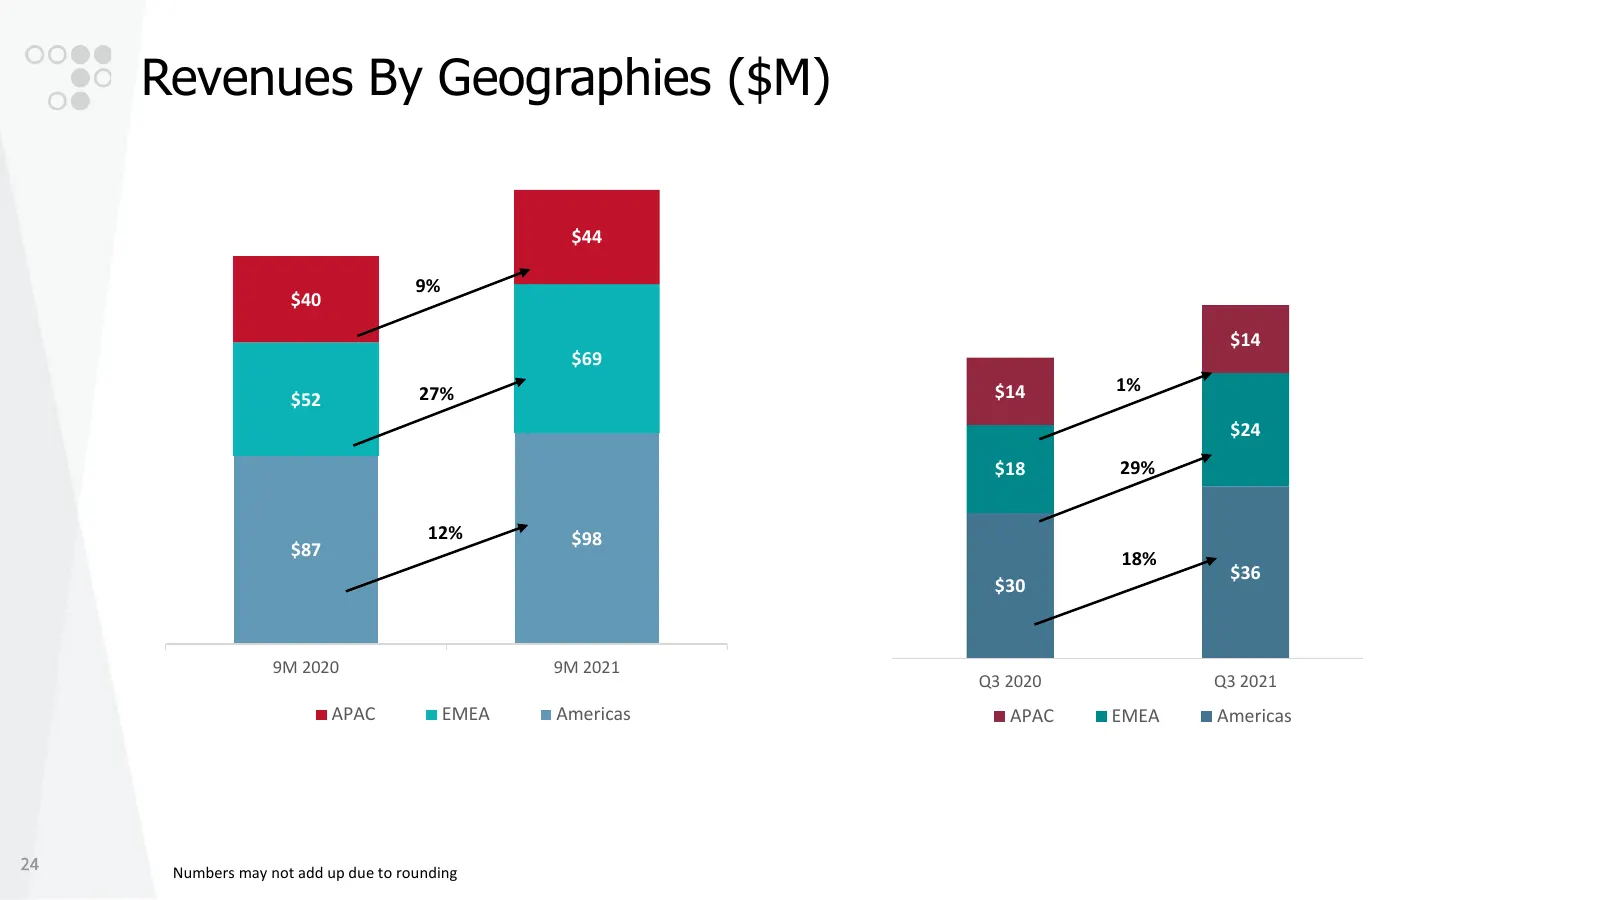
Revenues By Geographies ($M) $44 9% $40 $14 $69 27% $14 1% $52 $24 $18 29% 12% $98 $87 18% $36 $30 11% 9M 2020 9M 2021 Q3 2020 Q3 2021 APAC EMEA Americas APAC EMEA Americas 24 Numbers may not add up due to rounding
Slide 25: EPS ($)
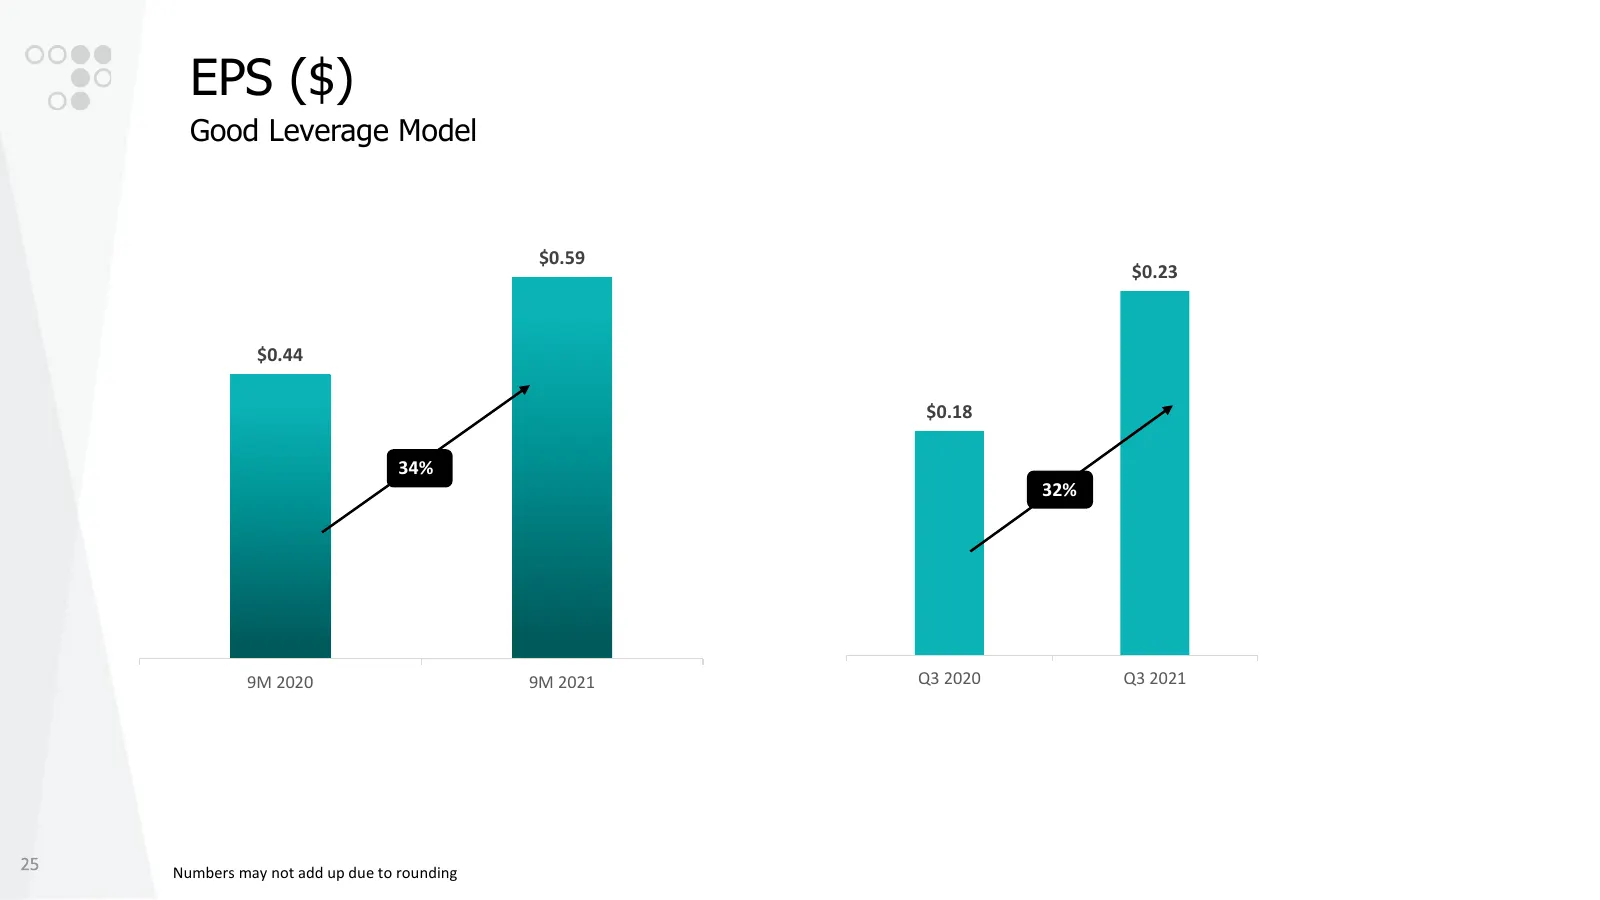
EPS ($) Good Leverage Model $0.59 $0.23 $0.44 $0.18 34% 32% 9M 2020 9M 2021 Q3 2020 Q3 2021 25 Numbers may not add up due to rounding
Slide 26: Total Annual Recurring Revenue ($M)
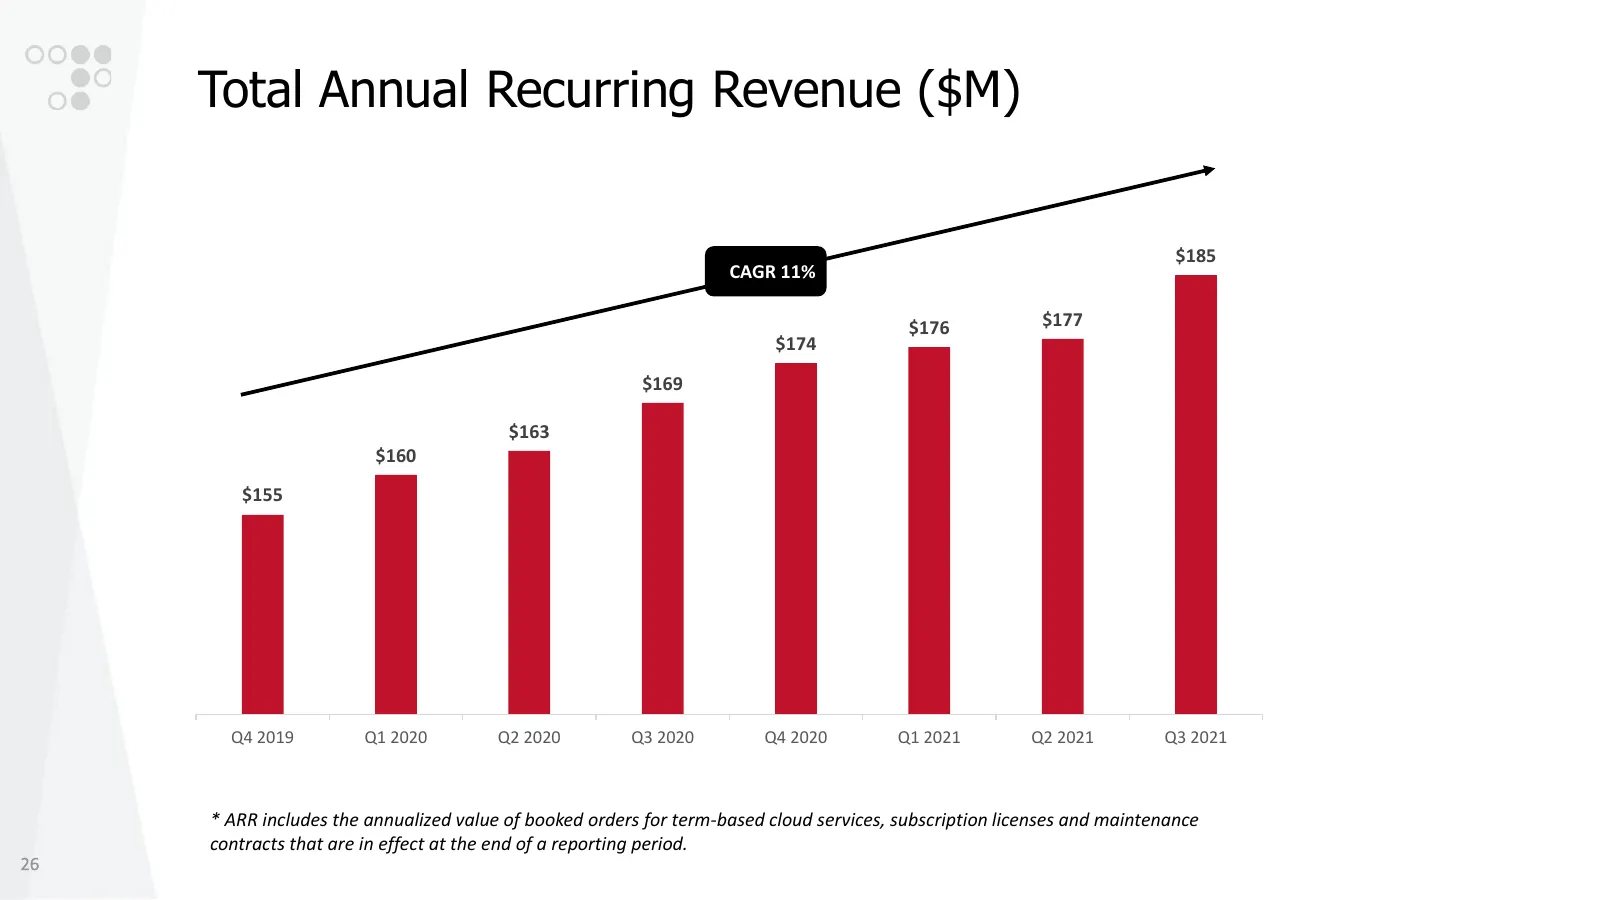
Total Annual Recurring Revenue ($M) $185 CAGR 11% $176 $177 $174 $169 $163 $160 $155 Q4 2019 Q1 2020 Q2 2020 Q3 2020 Q4 2020 Q1 2021 Q2 2021 Q3 2021 * ARR includes the annualized value of booked orders for term-based cloud services, subscription licenses and maintenance contracts that are in effect
Slide 27: Cash Generation and Balance Sheet ($M)
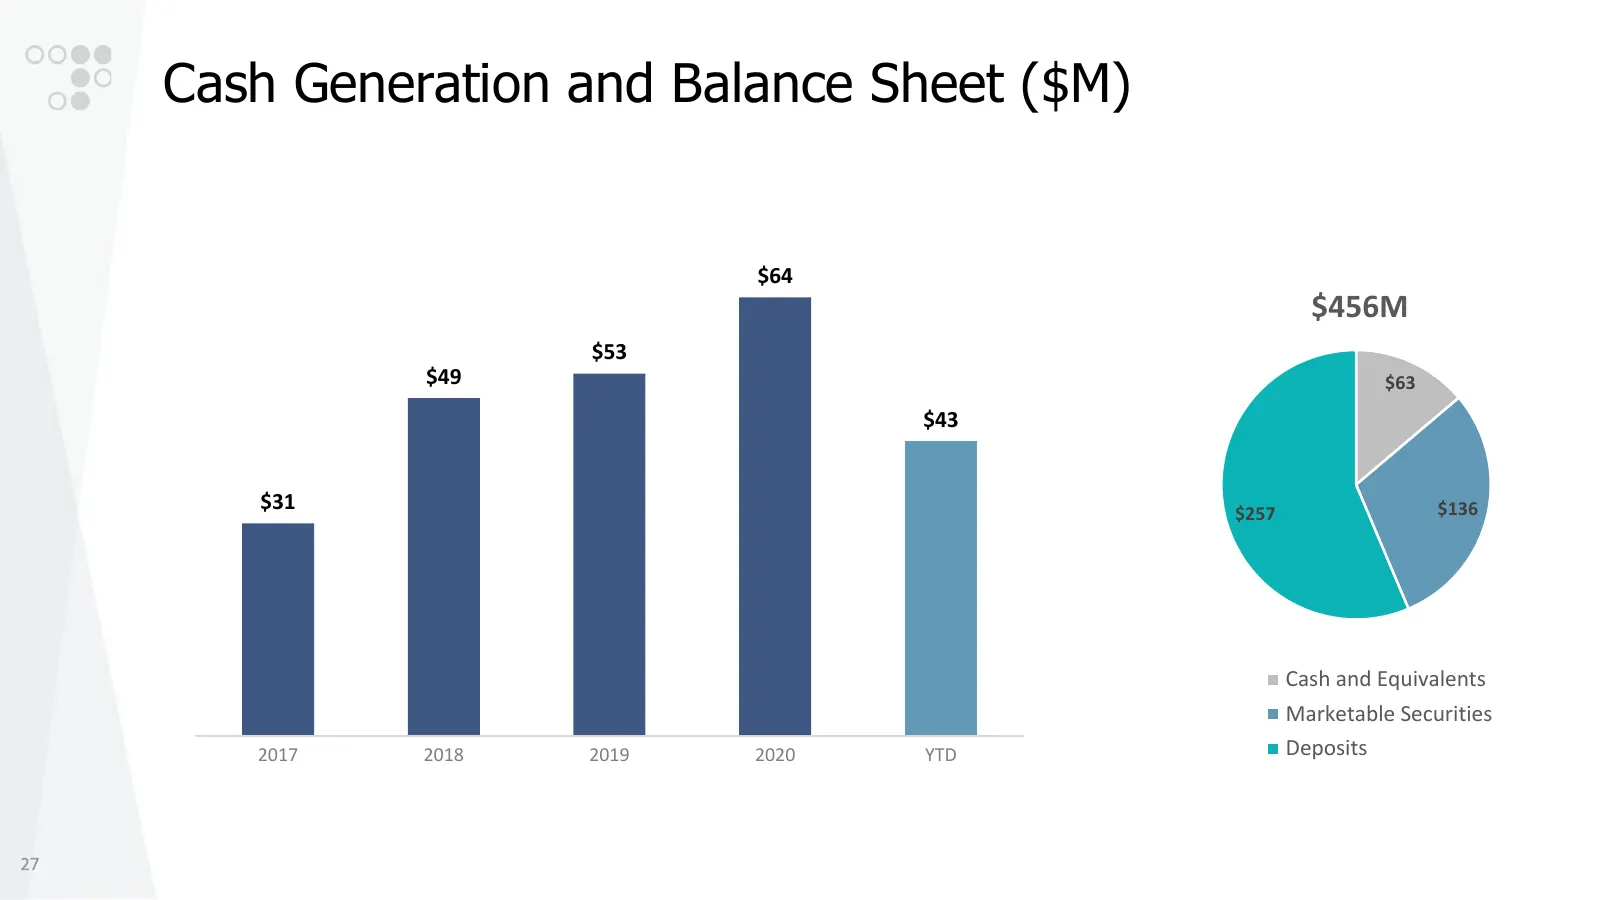
Cash Generation and Balance Sheet ($M) $64 $456M $53 $49 $63 $43 $31 $257 $136 Cash and Equivalents Marketable Securities 2017 2018 2019 2020 YTD Deposits 27
Slide 28: Technical issues with adding a thank you slide to be fixed
Technical issues with adding a thank you slide to be fixed 28
Source: Internet Archive copy of radware.com
More decks from Radware Ltd.
 Q1 2026 Earnings Presentation35 slides · May 7, 2026
 Q4 2025 Earnings Presentation30 slides · Feb 11, 2026
 Q3 2025 Earnings Presentation35 slides · Oct 29, 2025
 Q2 2025 Earnings Presentation35 slides · Jul 30, 2025
 Q1 2025 Earnings Presentation35 slides · May 7, 2025
 Q4 2024 Earnings Presentation37 slides · Feb 12, 2025