Landmark Infrastructure Partners LP
Landmark Infrastructure Partners LP — Investor Presentation (May 2018)
25 slides from Landmark Infrastructure Partners LP's investor presentation, May 3, 2018
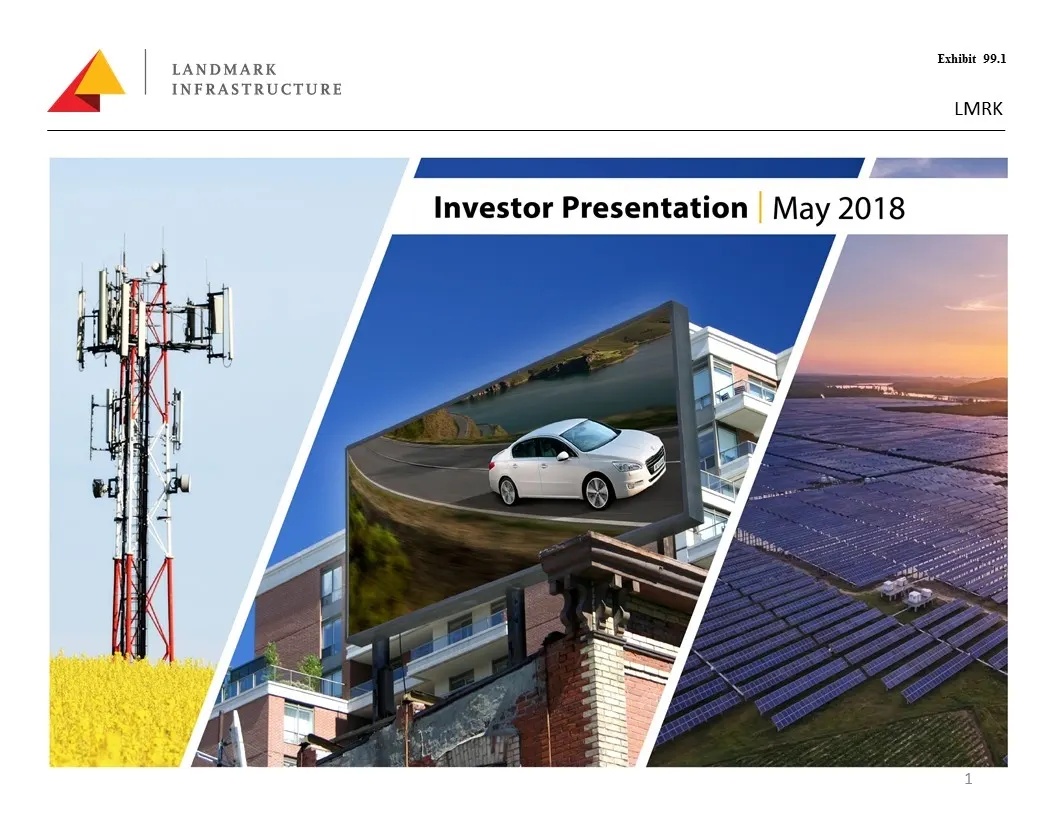
Slide 1: Investor Presentation | May 2018
Exhibit 99.1 LANDMARK INFRASTRUCTURE LMRK = = Investor Presentation | May 2018
Slide 2: Disclaimer
Disclaimer This presentation may contain forward‐looking statements that involve risks and uncertainties. These forward‐looking statements include information about possible or assumed future results of Landmark Infrastructure Partner LP’s (“LMRK” or the “Partnership”) business, future events, finan
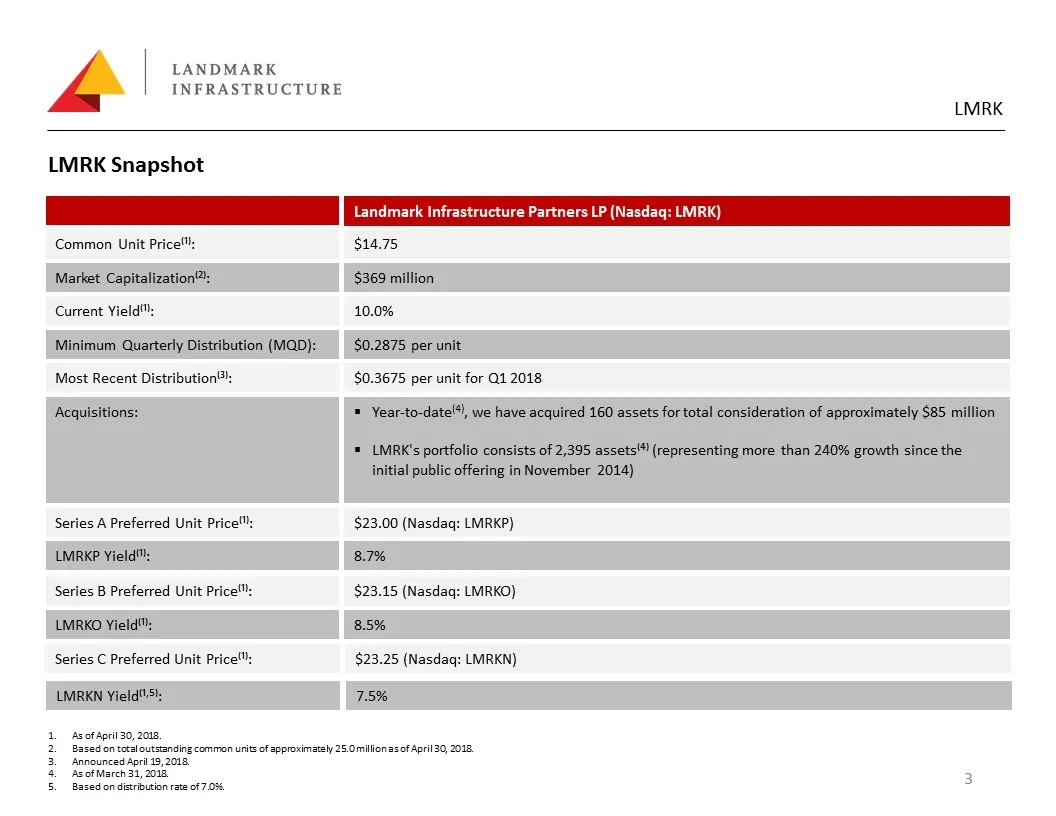
Slide 3: LMRK Snapshot
LMRK Snapshot Landmark Infrastructure Partners LP (Nasdaq: LMRK) Common Unit Price⁽¹⁾: $14.75 Market Capitalization⁽²⁾: $369 million Current Yield⁽¹⁾: 10.0% Minimum Quarterly Distribution (MQD): $0.2875 per unit Most Recent Distribution⁽³⁾: $0.3675 per unit for Q1 2018 Acquisitions: Year-to-date(4),
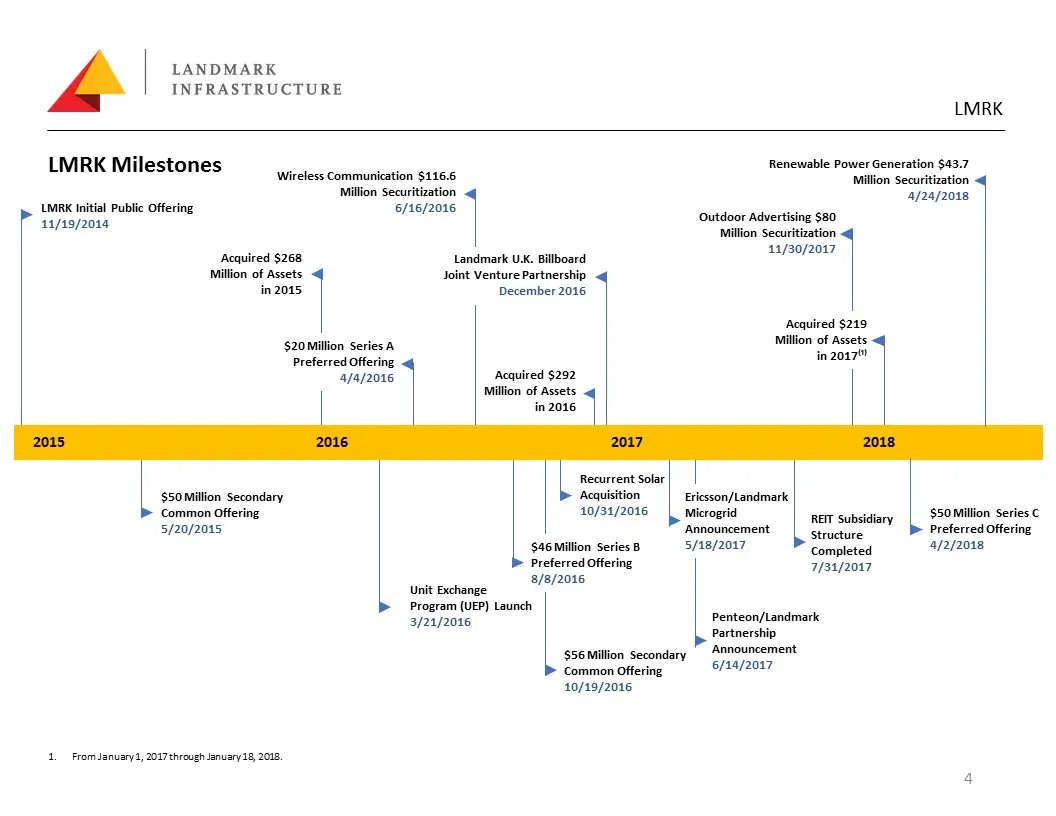
Slide 4: LMRK Milestones
LMRK Milestones LMRK Initial Public Offering 11/19/2014 $50 Million Secondary Common Offering 5/20/2015 Acquired $268 Million of Assets in 2015 Wireless Communication $116.6 Million Securitization 6/16/2016 Landmark U.K. Billboard Joint Venture Partnership December 2016 Acquired $292 Million of Asse
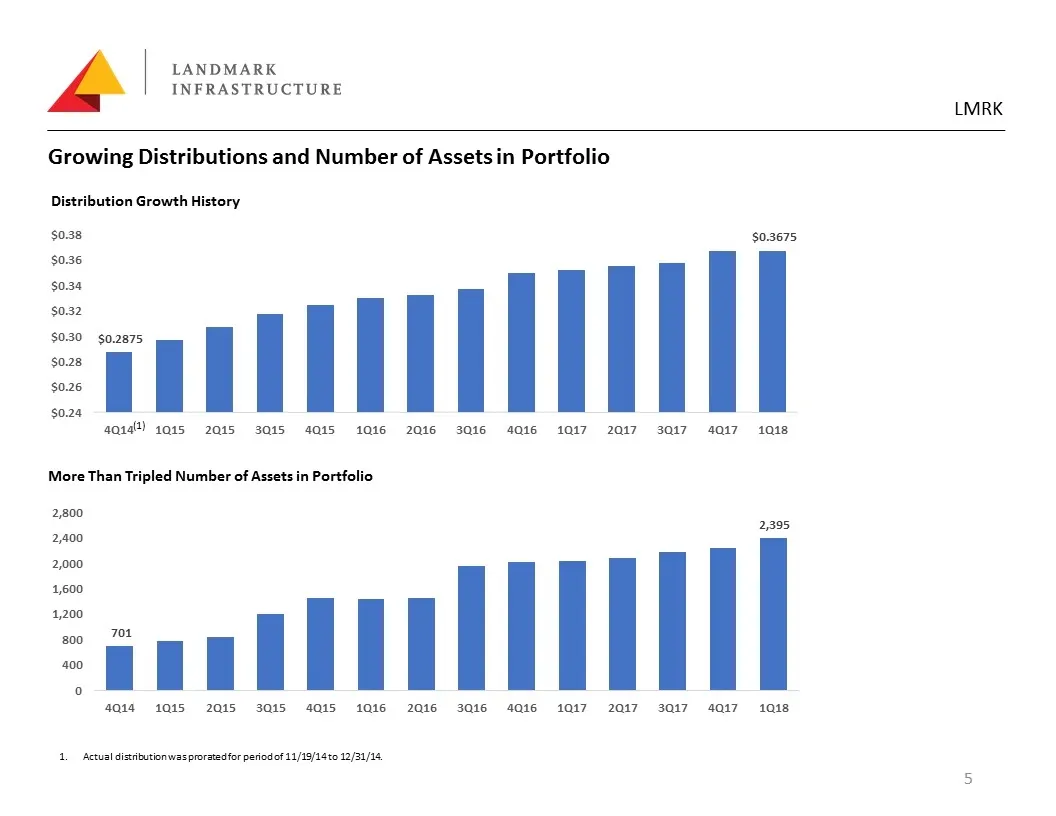
Slide 5: Growing Distributions and Number of Assets in Portfolio
Growing Distributions and Number of Assets in Portfolio Distribution Growth History More Than Tripled Number of Assets in Portfolio Actual distribution was prorated for period of 11/19/14 to 12/31/14. (1)
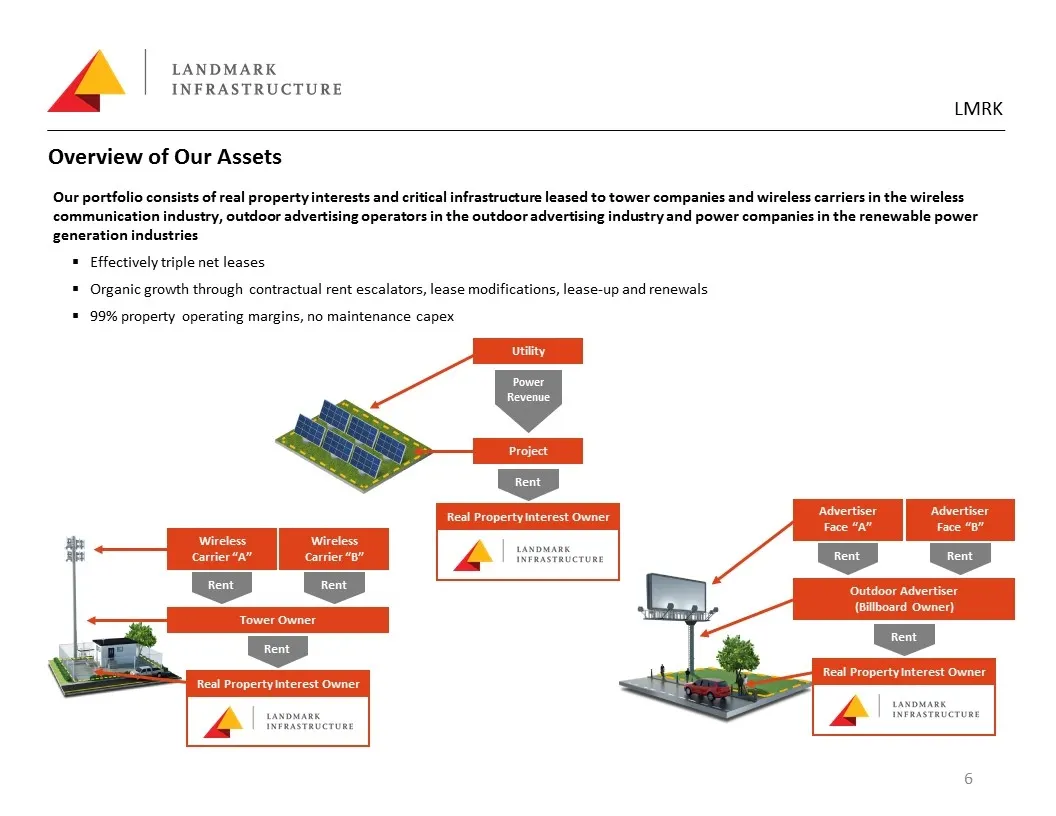
Slide 6: Overview of Our Assets
Overview of Our Assets Our portfolio consists of real property interests and critical infrastructure leased to tower companies and wireless carriers in the wireless communication industry, outdoor advertising operators in the outdoor advertising industry and power companies in the renewable power ge
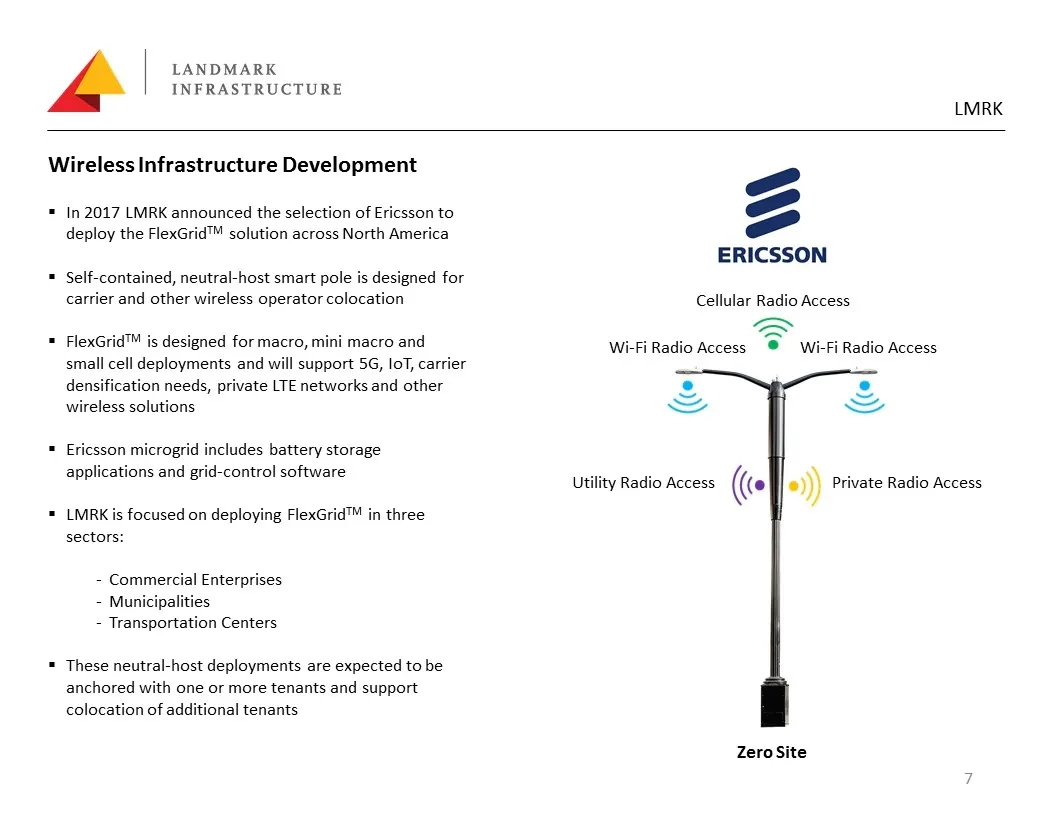
Slide 7: Wireless Infrastructure Development
Wireless Infrastructure Development In 2017 LMRK announced the selection of Ericsson to deploy the FlexGridTM solution across North America Self-contained, neutral-host smart pole is designed for carrier and other wireless operator colocation FlexGridTM is designed for macro, mini macro and small ce
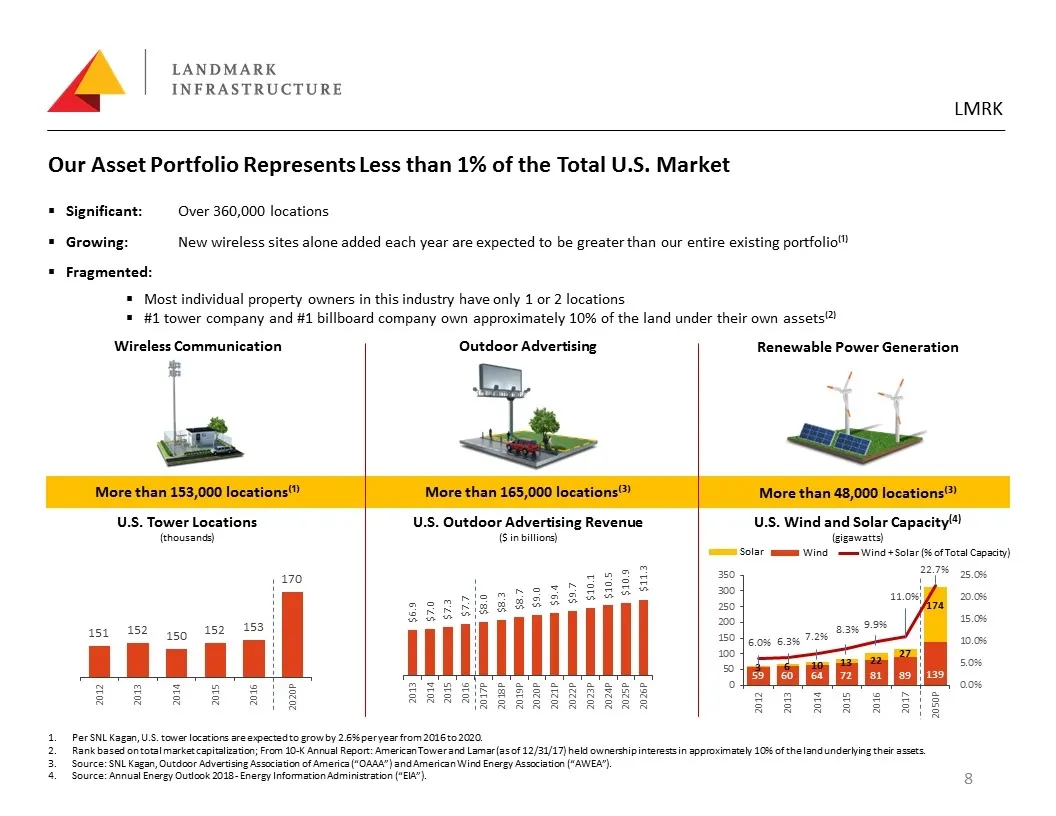
Slide 8: Our Asset Portfolio Represents Less than 1% of the Total U.S. Market
Per SNL Kagan, U.S. tower locations are expected to grow by 2.6% per year from 2016 to 2020. Rank based on total market capitalization; From 10-K Annual Report: American Tower and Lamar (as of 12/31/17) held ownership interests in approximately 10% of the land underlying their assets. Source: SNL Ka
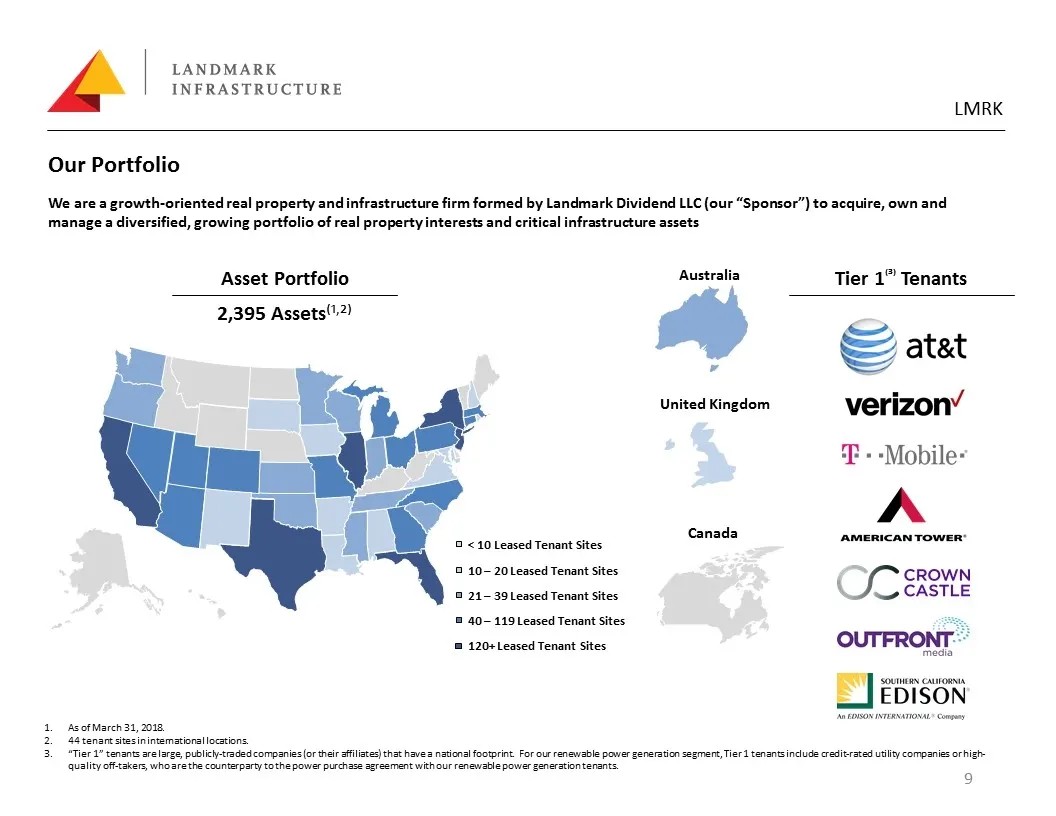
Slide 9: Our Portfolio
Our Portfolio We are a growth-oriented real property and infrastructure firm formed by Landmark Dividend LLC (our “Sponsor”) to acquire, own and manage a diversified, growing portfolio of real property interests and critical infrastructure assets Asset Portfolio 2,395 Assets⁽¹,²⁾ Tier 1⁽³⁾ Tenants A
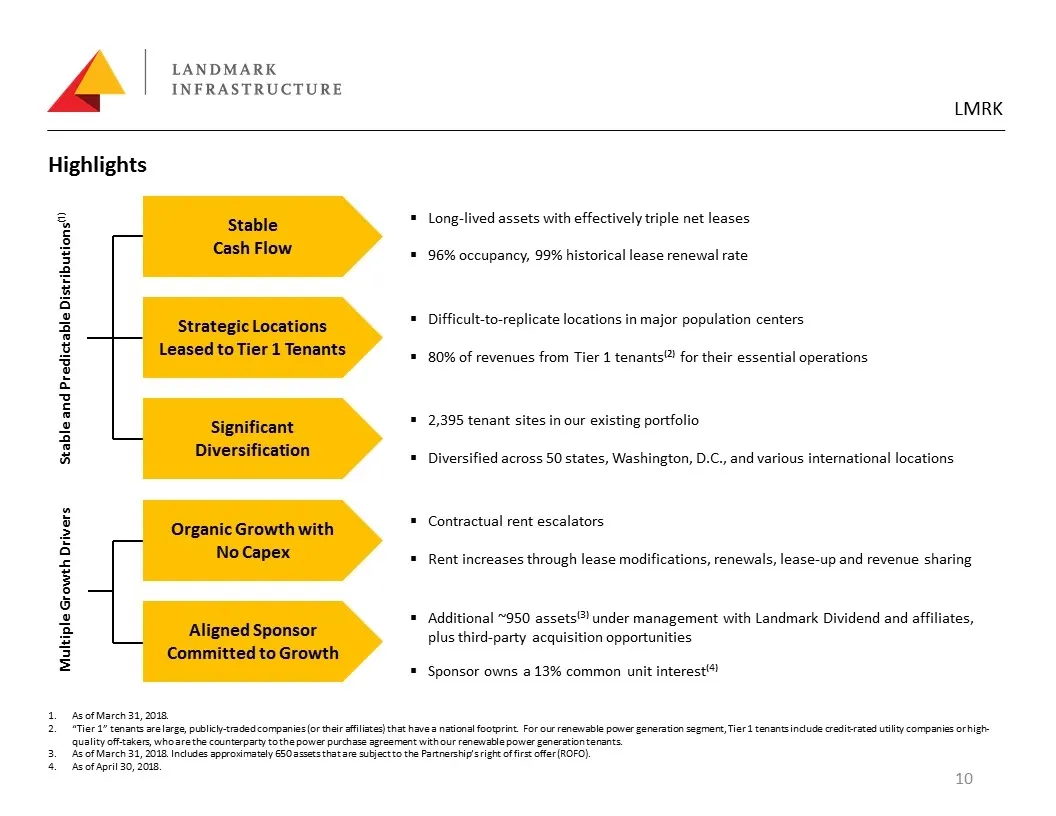
Slide 10: Highlights
Highlights Stable and Predictable Distributions⁽¹⁾ Multiple Growth Drivers Stable Cash Flow Strategic Locations Leased to Tier 1 Tenants Significant Diversification Organic Growth with No Capex Aligned Sponsor Committed to Growth Long-lived assets with effectively triple net leases 96% occupancy, 99
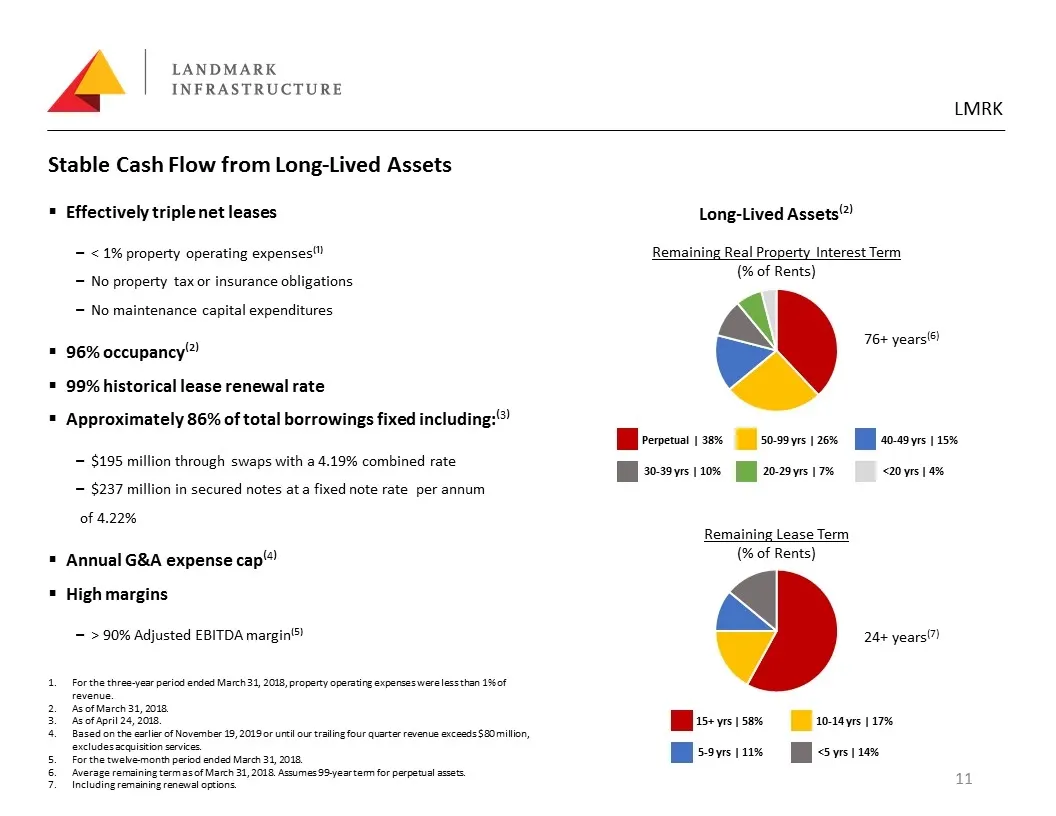
Slide 11: Stable Cash Flow from Long-Lived Assets
̶ $195 million through swaps with a 4.19% combined rate ̶ $237 million in secured notes at a fixed note rate per annum of 4.22% Stable Cash Flow from Long-Lived Assets Effectively triple net leases ̶ < 1% property operating expenses⁽¹⁾ ̶ No property tax or insurance obligations ̶ No maintenance capi
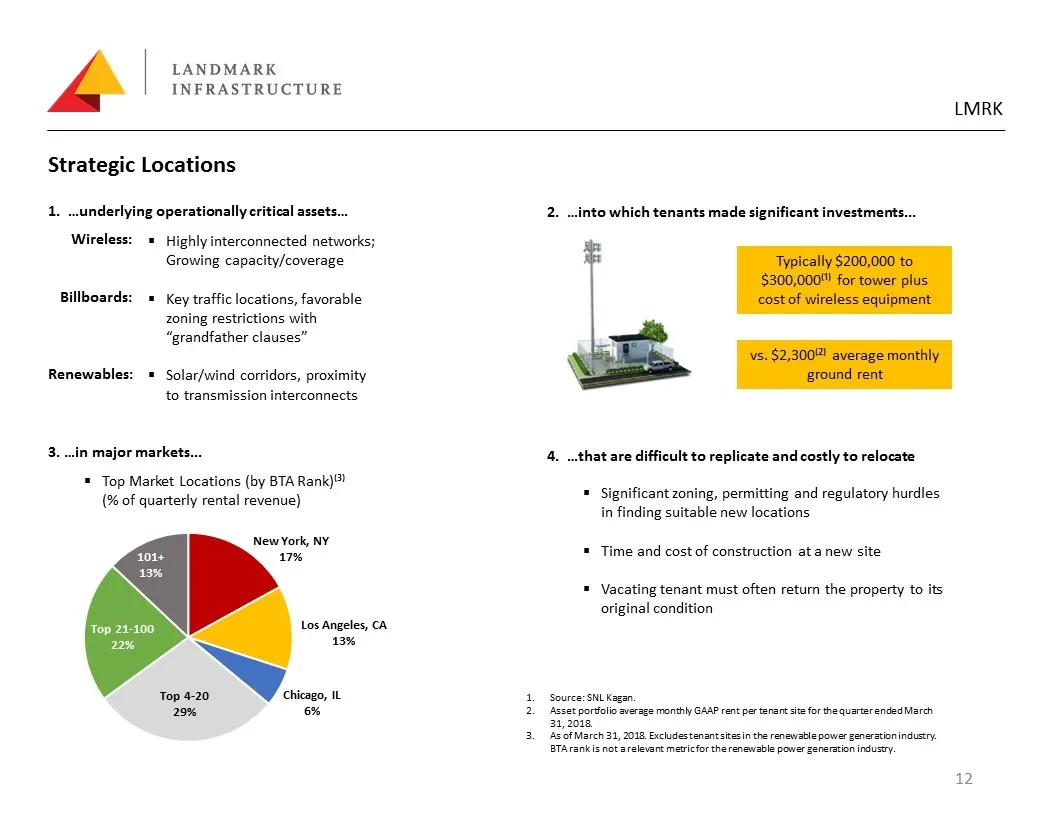
Slide 12: Strategic Locations
Strategic Locations 1. …underlying operationally critical assets… Wireless: Billboards: Renewables: Highly interconnected networks; Growing capacity/coverage Key traffic locations, favorable zoning restrictions with “grandfather clauses” Solar/wind corridors, proximity to transmission interconnects
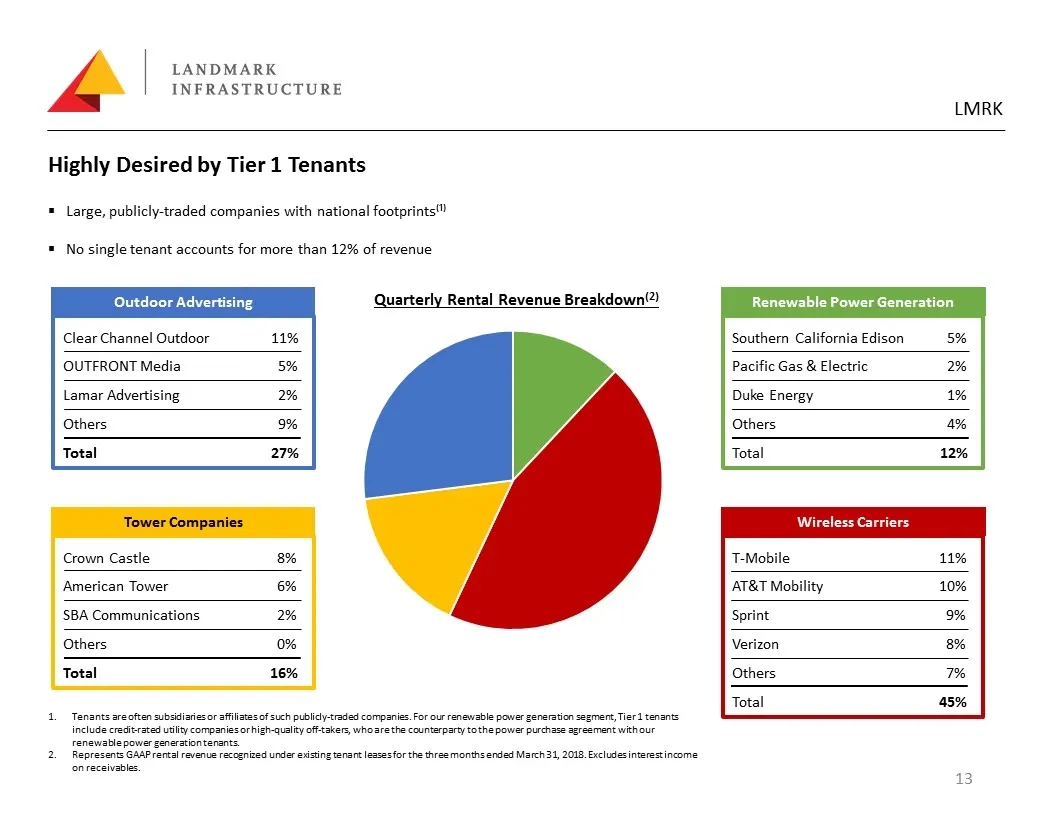
Slide 13: Highly Desired by Tier 1 Tenants
Highly Desired by Tier 1 Tenants Large, publicly-traded companies with national footprints⁽¹⁾ No single tenant accounts for more than 12% of revenue Outdoor Advertising Clear Channel Outdoor OUTFRONT Media Lamar Advertising Others Total Tower Companies Crown Castle American Tower SBA Communications
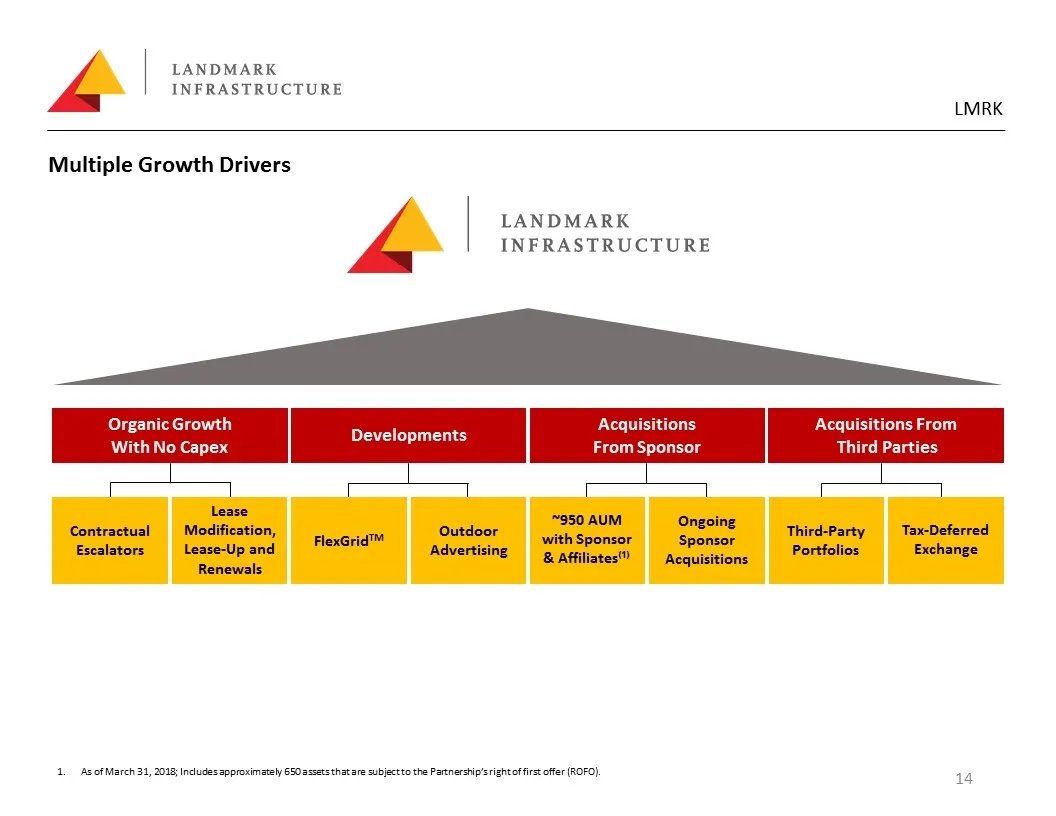
Slide 14: Multiple Growth Drivers
Multiple Growth Drivers Organic Growth With No Capex Acquisitions From Sponsor Acquisitions From Third Parties Contractual Escalators Lease Modification, Lease-Up and Renewals FlexGridTM Outdoor Advertising ~950 AUM with Sponsor & Affiliates⁽¹⁾ Ongoing Sponsor Acquisitions Third-Party Portfolios Tax
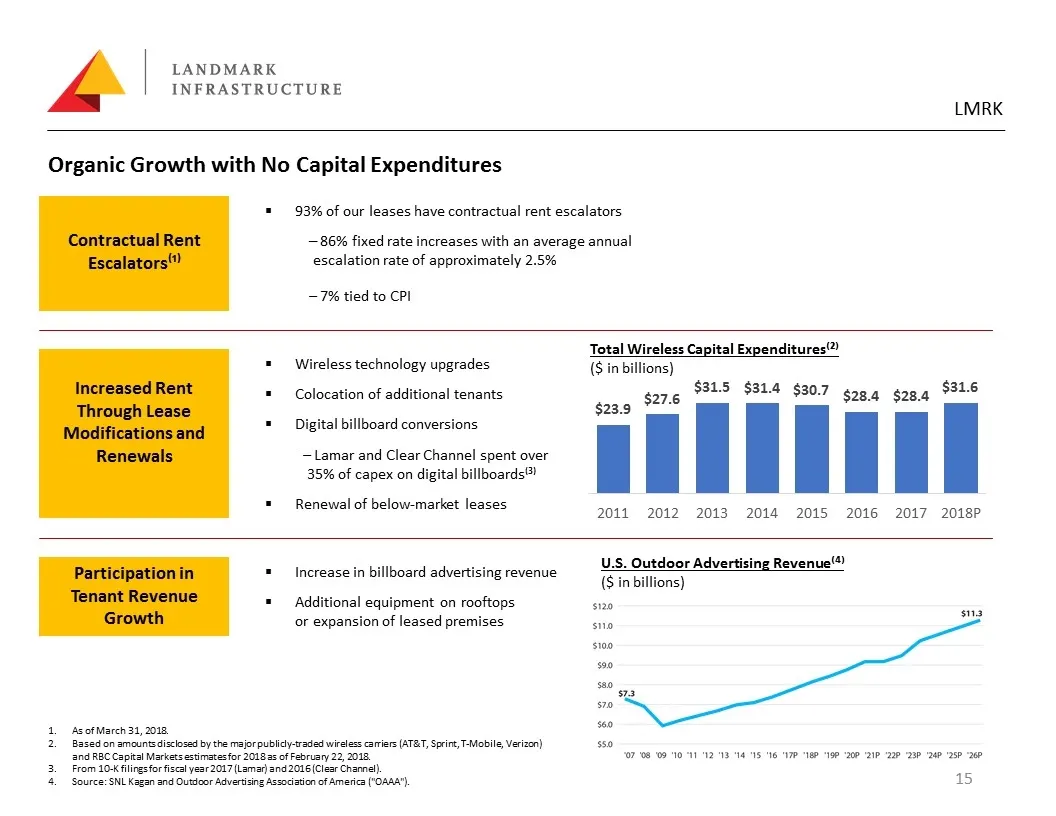
Slide 15: Organic Growth with No Capital Expenditures
Organic Growth with No Capital Expenditures Contractual Rent Escalators⁽¹⁾ Increased Rent Through Lease Modifications and Renewals Wireless technology upgrades Colocation of additional tenants Digital billboard conversions ̶ Lamar and Clear Channel spent over 35% of capex on digital billboards⁽³⁾ Re
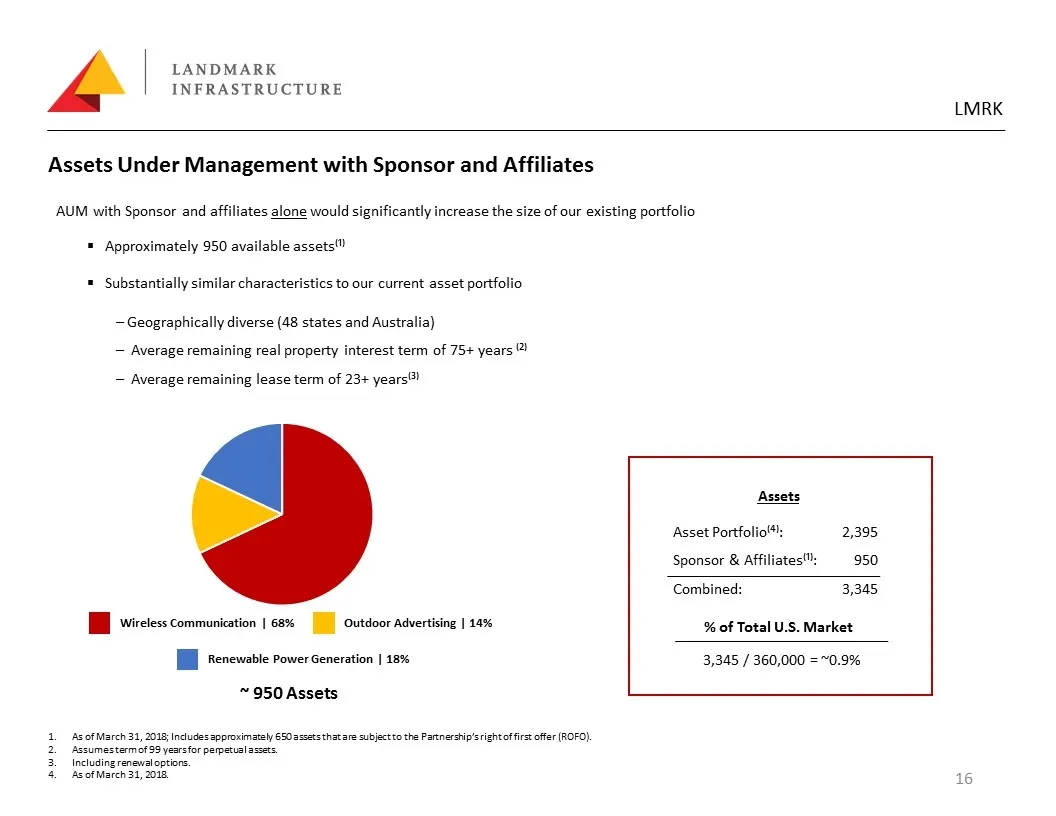
Slide 16: Assets Under Management with Sponsor and Affiliates
Assets Under Management with Sponsor and Affiliates AUM with Sponsor and affiliates alone would significantly increase the size of our existing portfolio Approximately 950 available assets⁽¹⁾ Substantially similar characteristics to our current asset portfolio ̶ Geographically diverse (48 states and
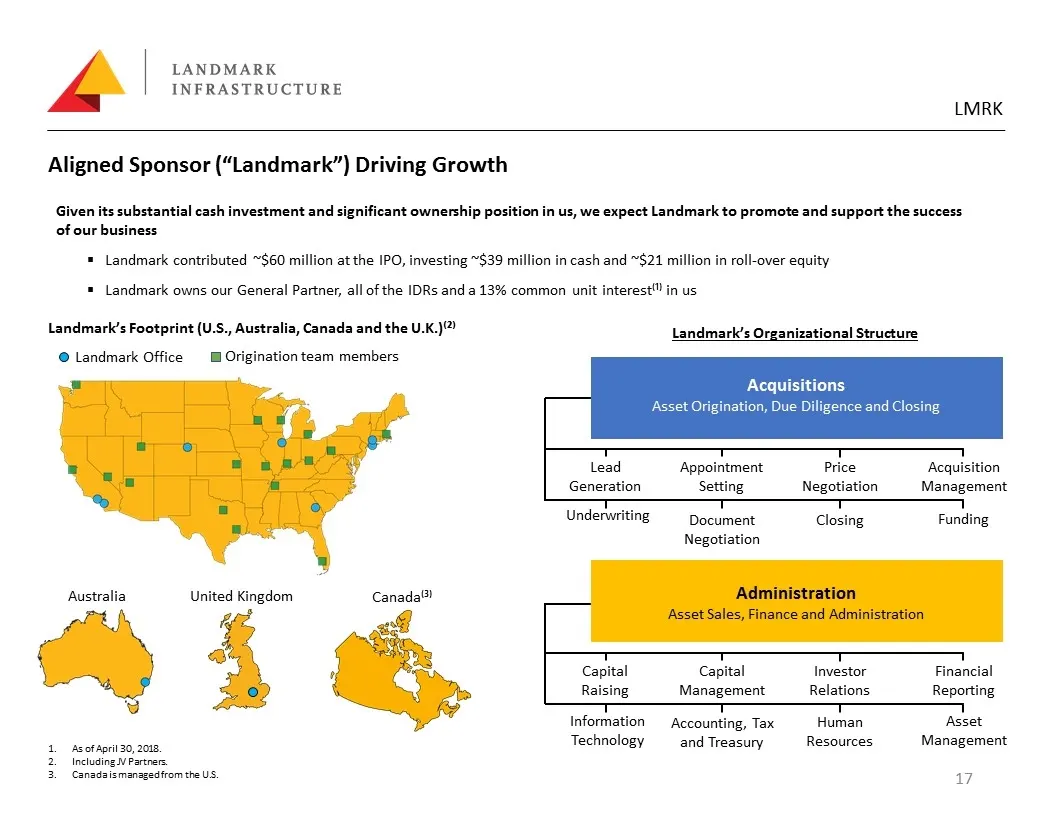
Slide 17: Aligned Sponsor (Landmark) Driving Growth
Origination team members Aligned Sponsor (“Landmark”) Driving Growth Given its substantial cash investment and significant ownership position in us, we expect Landmark to promote and support the success of our business Landmark contributed ~$60 million at the IPO, investing ~$39 million in cash and
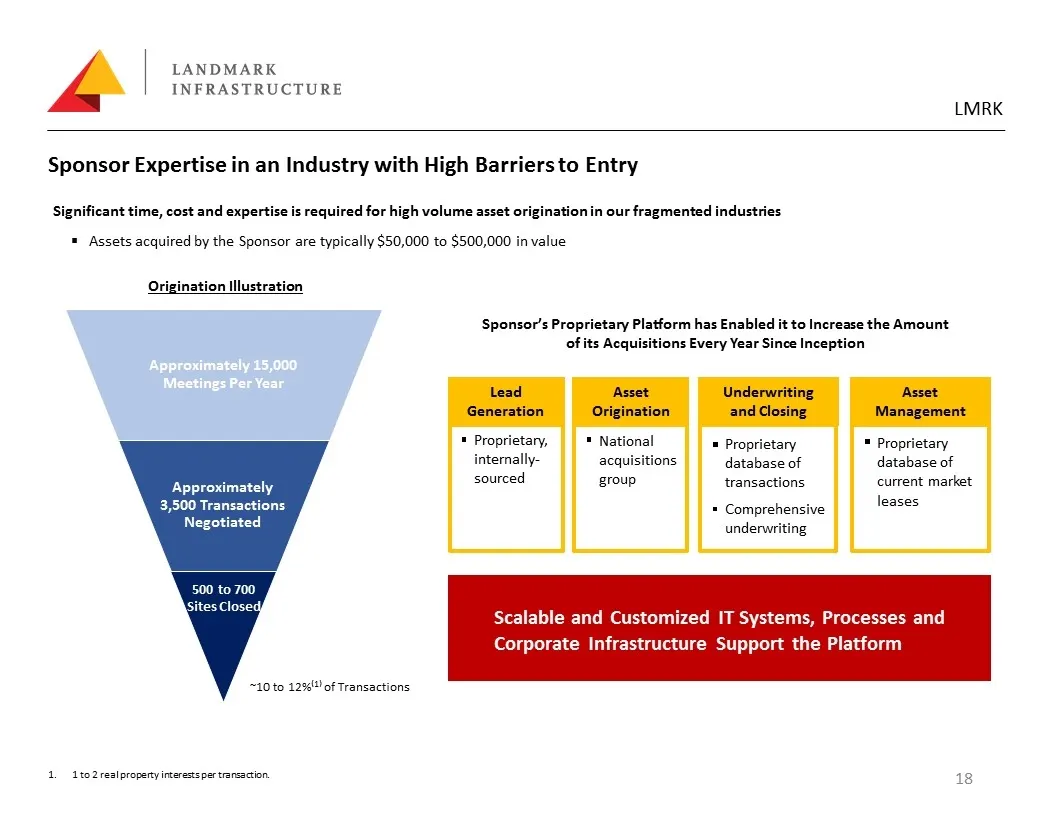
Slide 18: Sponsor Expertise in an Industry with High Barriers to Entry
Sponsor Expertise in an Industry with High Barriers to Entry Significant time, cost and expertise is required for high volume asset origination in our fragmented industries Assets acquired by the Sponsor are typically $50,000 to $500,000 in value Origination Illustration 500 to 700 Sites Closed Spon
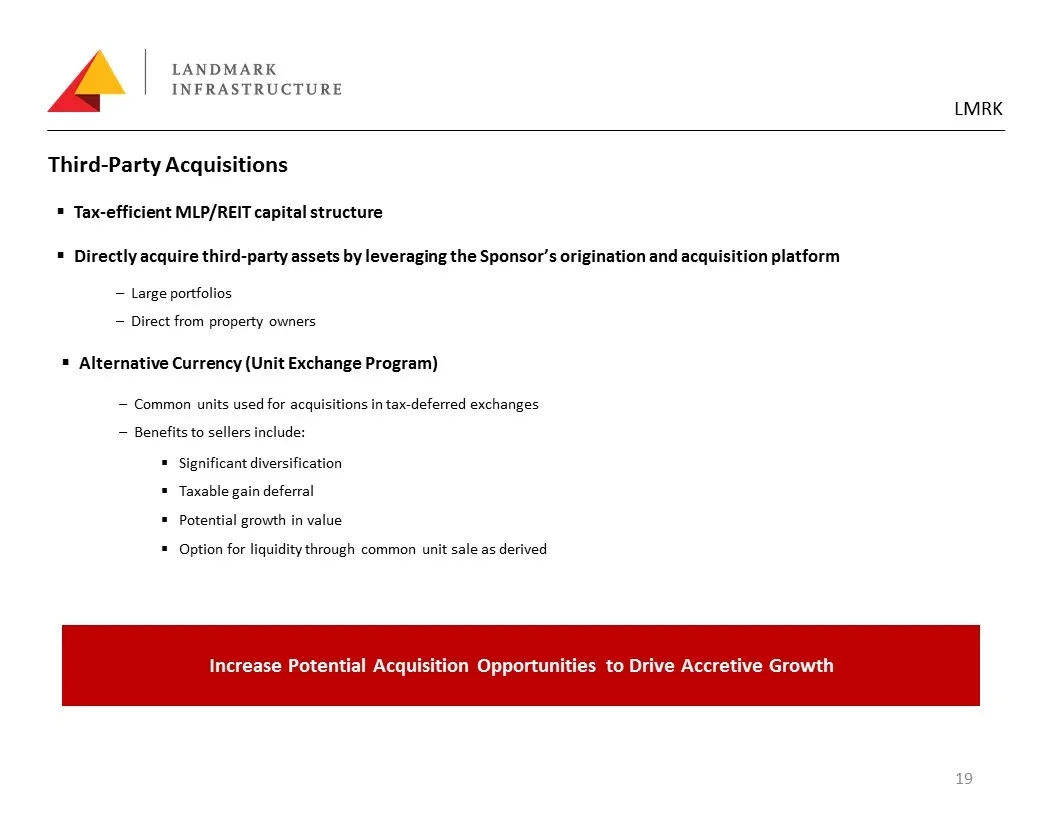
Slide 19: Third-Party Acquisitions
Third-Party Acquisitions Tax-efficient MLP/REIT capital structure Directly acquire third-party assets by leveraging the Sponsor’s origination and acquisition platform ̶ Large portfolios ̶ Direct from property owners Alternative Currency (Unit Exchange Program) ̶ Common units used for acquisitions in
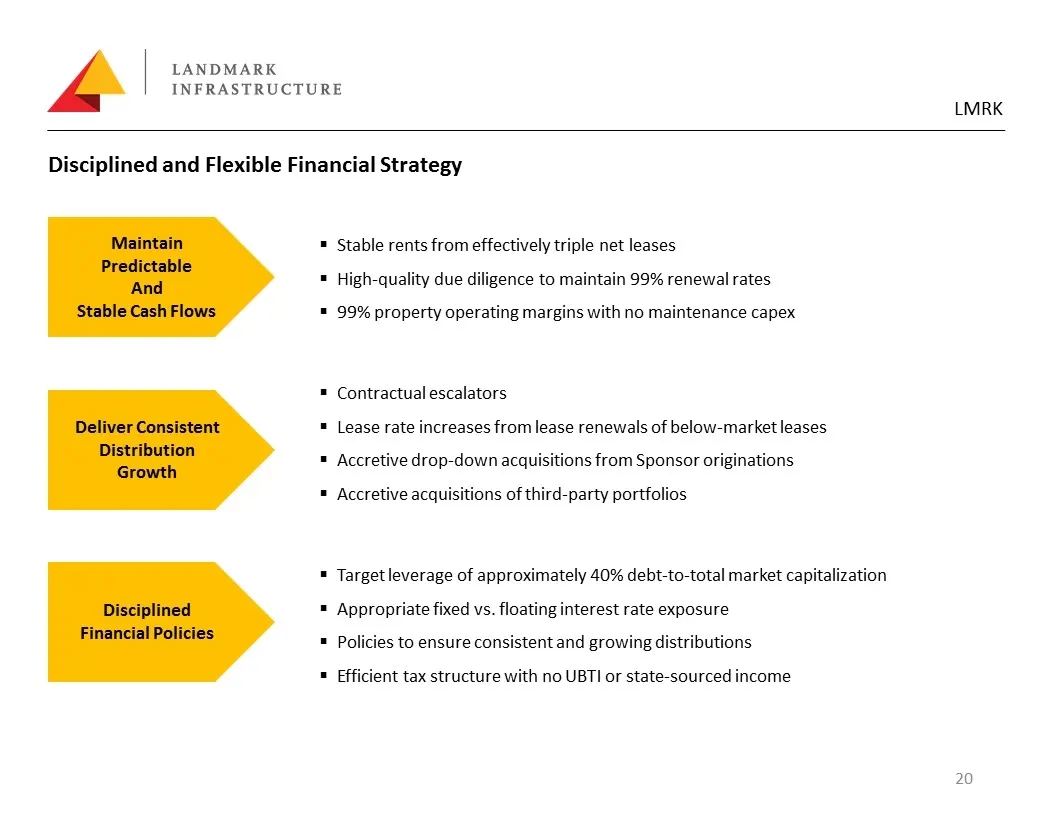
Slide 20: Disciplined and Flexible Financial Strategy
Disciplined and Flexible Financial Strategy Stable rents from effectively triple net leases High-quality due diligence to maintain 99% renewal rates 99% property operating margins with no maintenance capex Maintain Predictable And Stable Cash Flows Contractual escalators Lease rate increases from le
Slide 21: Appendix
| LANDMARK INFRASTRUCTURE LMRK Appendix
Slide 22: Non-GAAP Financial Measures
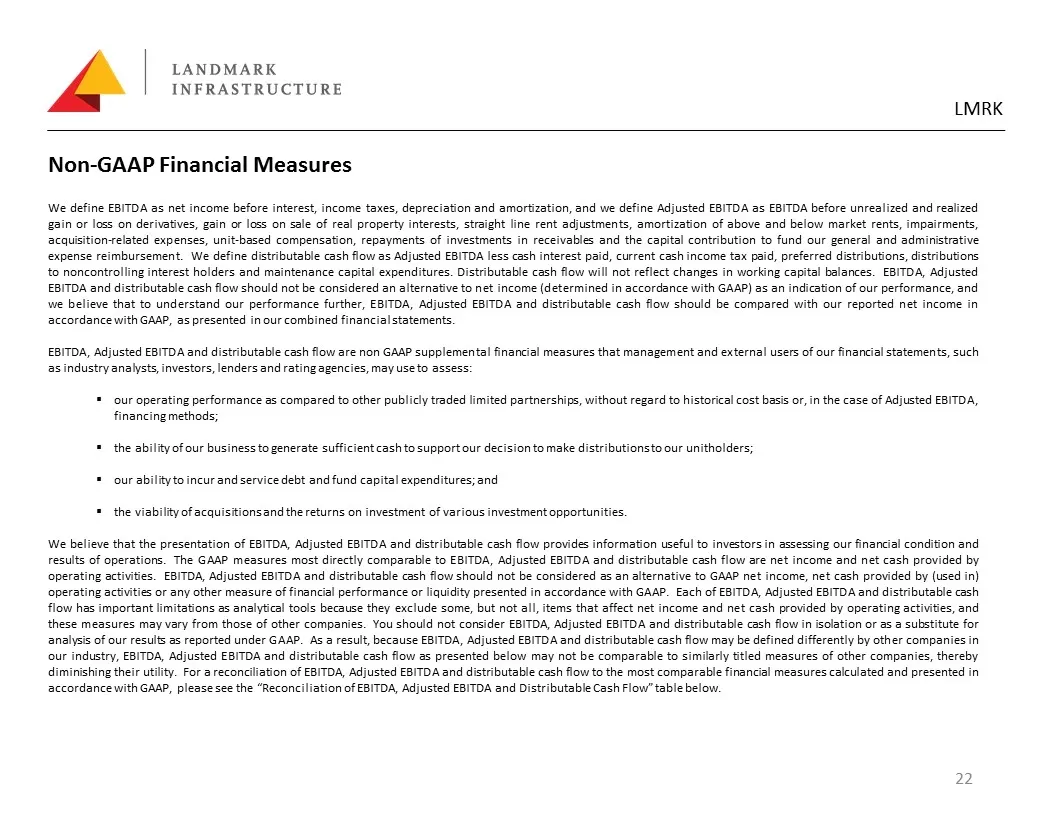
Non-GAAP Financial Measures We define EBITDA as net income before interest, income taxes, depreciation and amortization, and we define Adjusted EBITDA as EBITDA before unrealized and realized gain or loss on derivatives, gain or loss on sale of real property interests, straight line rent adjustments
Slide 23: Reconciliation of EBITDA, Adjusted EBITDA and Distributable Cash Flow
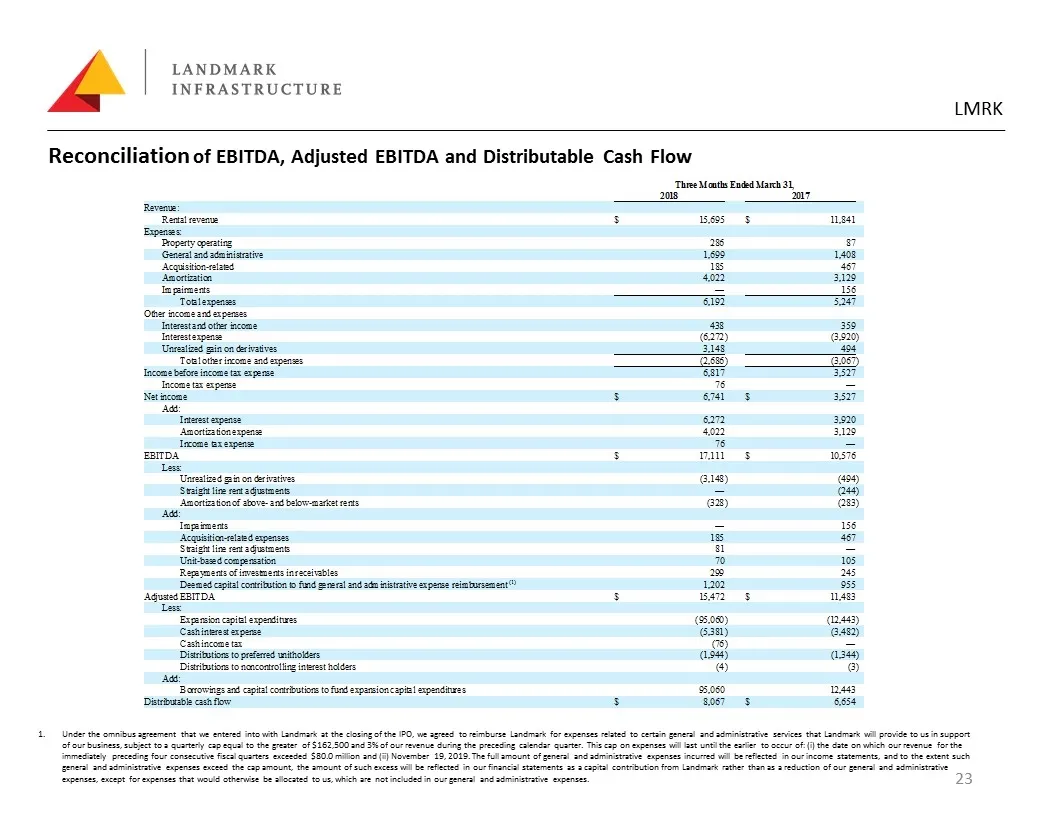
Reconciliation of EBITDA, Adjusted EBITDA and Distributable Cash Flow Under the omnibus agreement that we entered into with Landmark at the closing of the IPO, we agreed to reimburse Landmark for expenses related to certain general and administrative services that Landmark will provide to us in supp
Slide 24: Average Years of Experience with High Volume, Small Balance Real Property Asset Originations
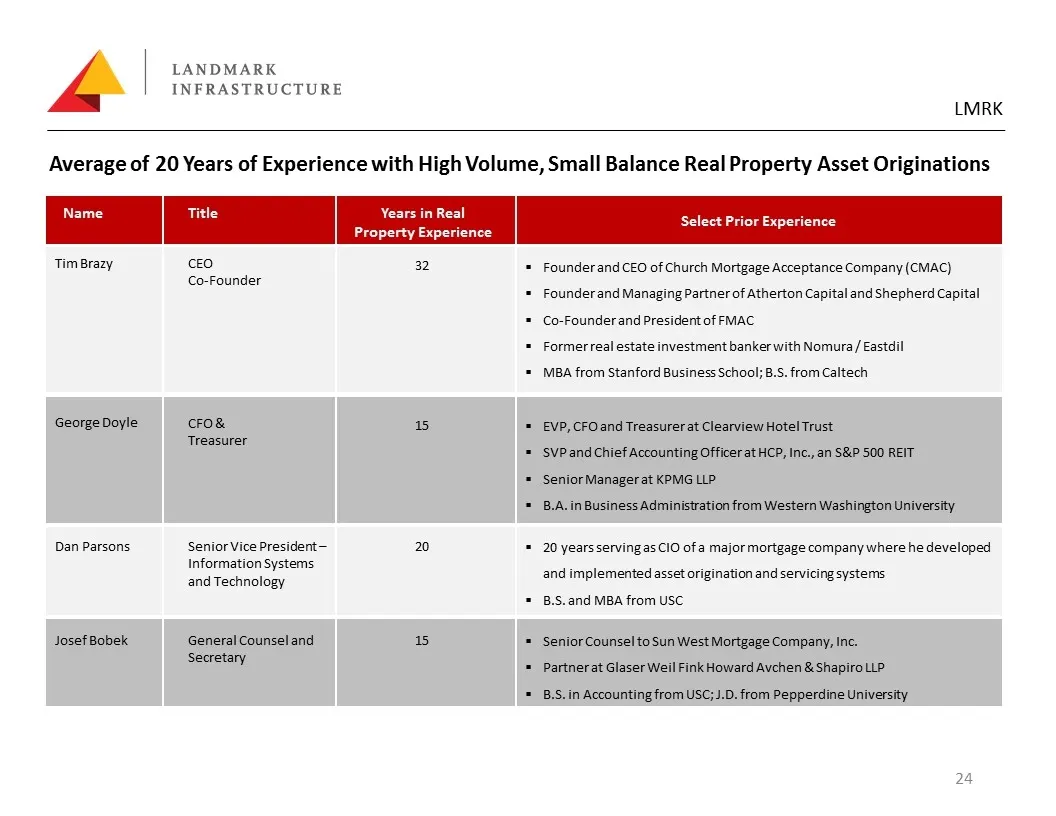
Average of 20 Years of Experience with High Volume, Small Balance Real Property Asset Originations Name Tim Brazy Title CEO Co-Founder 32 Years in Real Property Experience Select Prior Experience Founder and CEO of Church Mortgage Acceptance Company (CMAC) Founder and Managing Partner of Atherton Ca
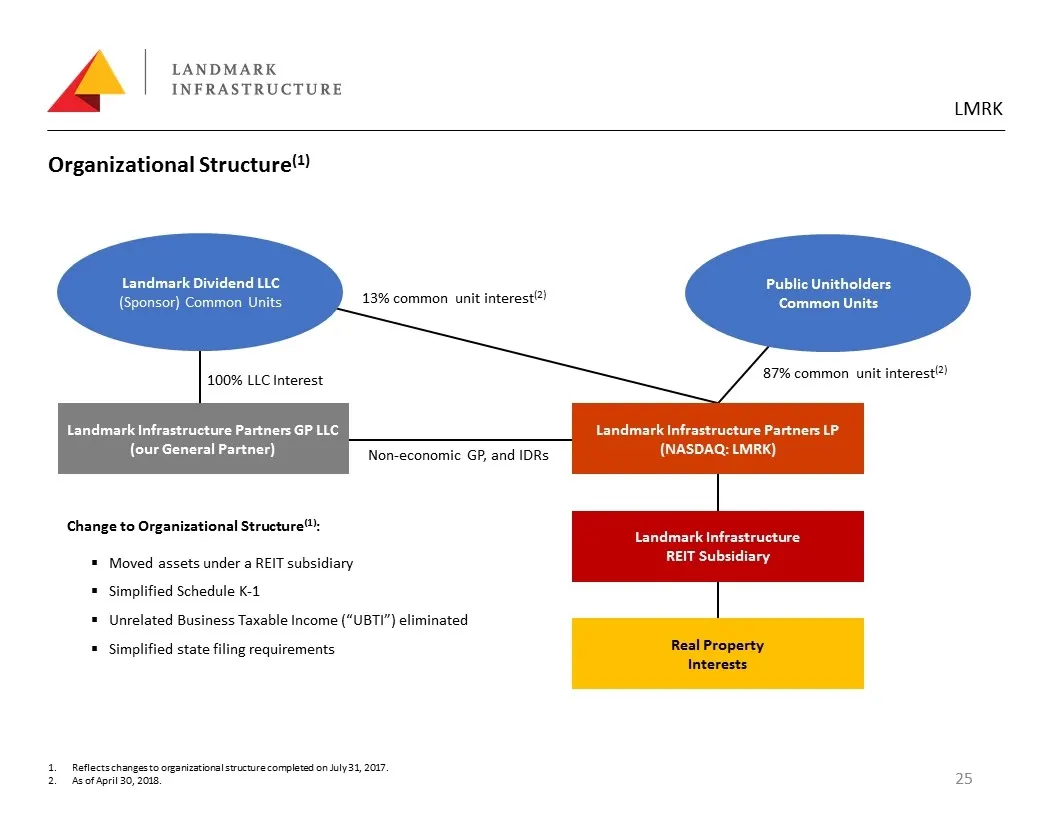
Slide 25: Organizational Structure
Organizational Structure(1) Landmark Dividend LLC (Sponsor) Common Units Landmark Infrastructure Partners GP LLC (our General Partner) Landmark Infrastructure Partners LP (NASDAQ: LMRK) Landmark Infrastructure REIT Subsidiary Real Property Interests 13% common unit interest(2) 87% common unit intere
Source: SEC EDGAR · 8-K filed May 3, 2018
More decks from Landmark Infrastructure Partners LP
 Investor Presentation (December 2020)28 slides · Dec 9, 2020
 Investor Presentation (June 2020)28 slides · Jun 2, 2020
 Investor Presentation (March 2020)28 slides · Mar 11, 2020
 Investor Presentation (November 2019)28 slides · Nov 12, 2019
 Investor Presentation (September 2019)28 slides · Sep 4, 2019
 Investor Presentation (May 2019)28 slides · May 14, 2019