NHPC Limited · NSE:NHPC
NHPC — Investor Presentation (February 2014)
26 slides from NHPC's investor presentation, February 2014

Slide 1: Investors Presentation
Investors Presentation Feb’2014
Slide 2: Agenda
Hydro Scenario in India NHPC Overview Investment Plan Financial Highlights
Slide 3: Hydro Scenario in India
Hydro Scenario in India
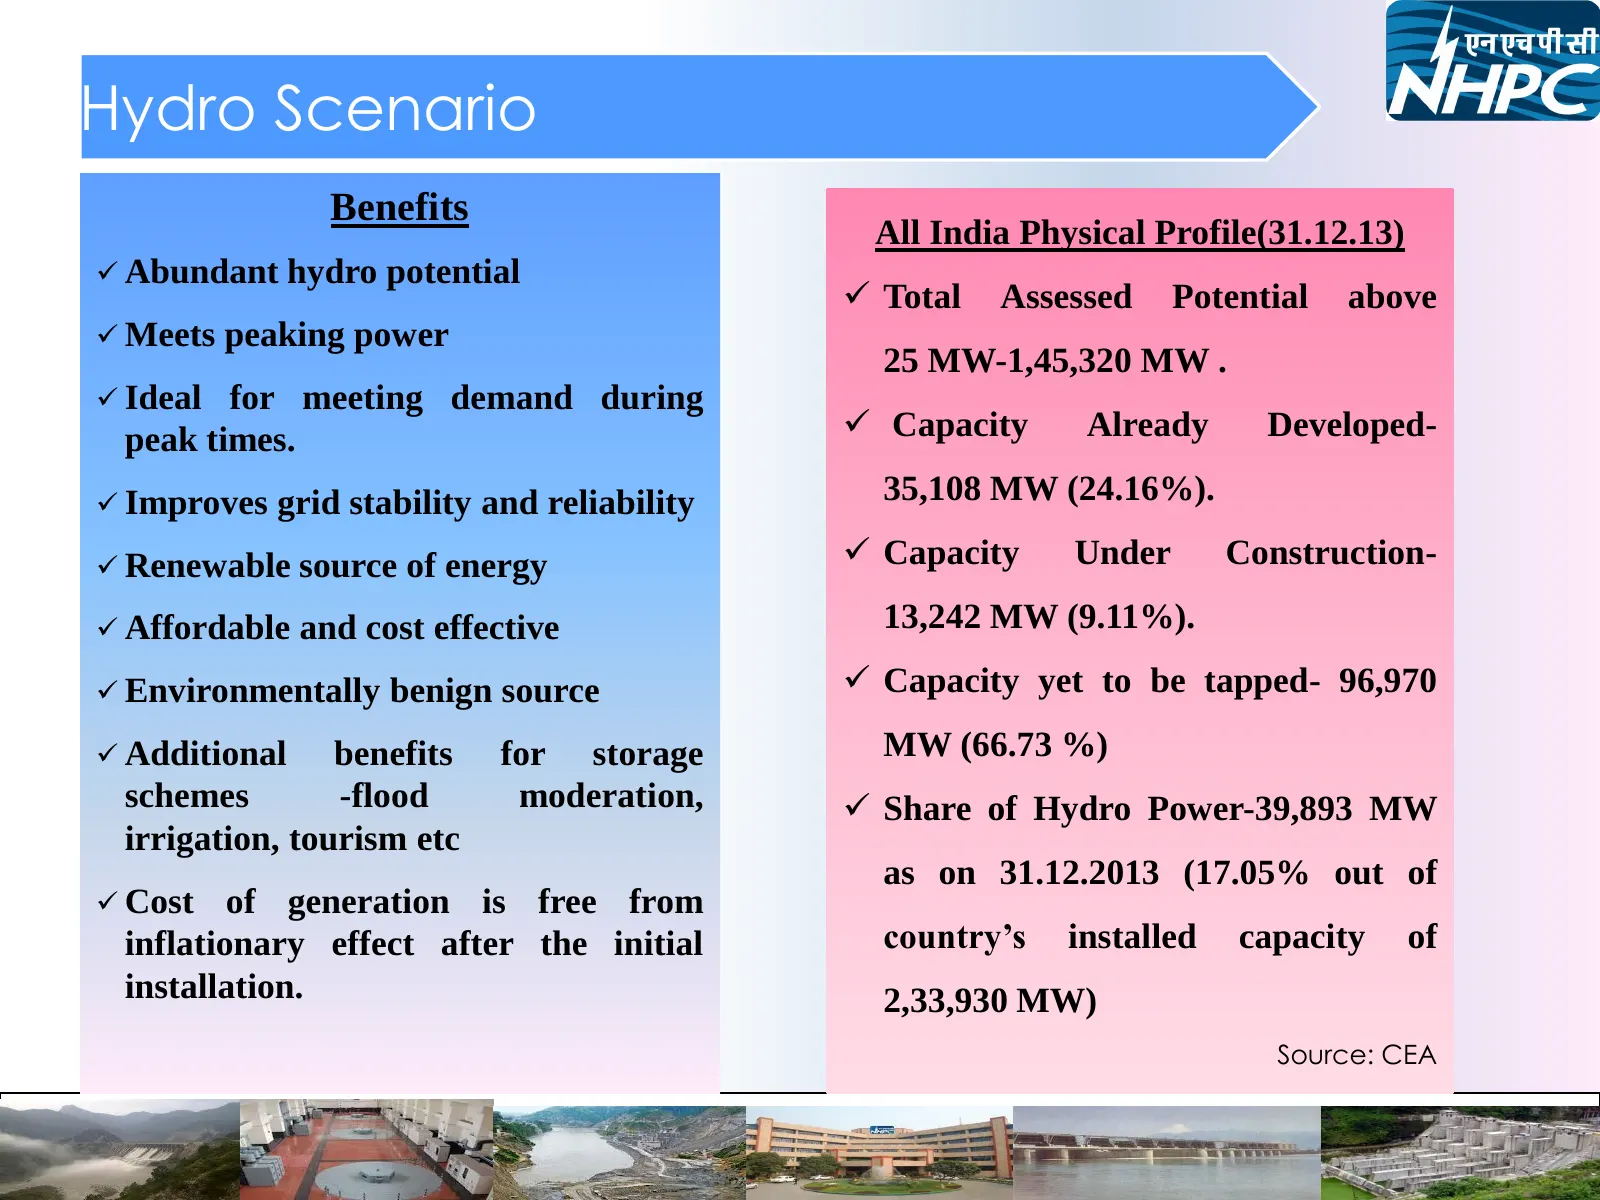
Slide 4: Hydro Scenario
Hydro Scenario Benefits All India Physical Profile(31.12.13) Abundant hydro potential Total Assessed Potential above Meets peaking power 25 MW-1,45,320 MW . Ideal for meeting demand during peak times. Capacity Already Developed- Improves grid stability and reliability 35,108 MW (24.16%).
Slide 5: NHPC Overview
NHPC Overview
Slide 6: NHPC Overview
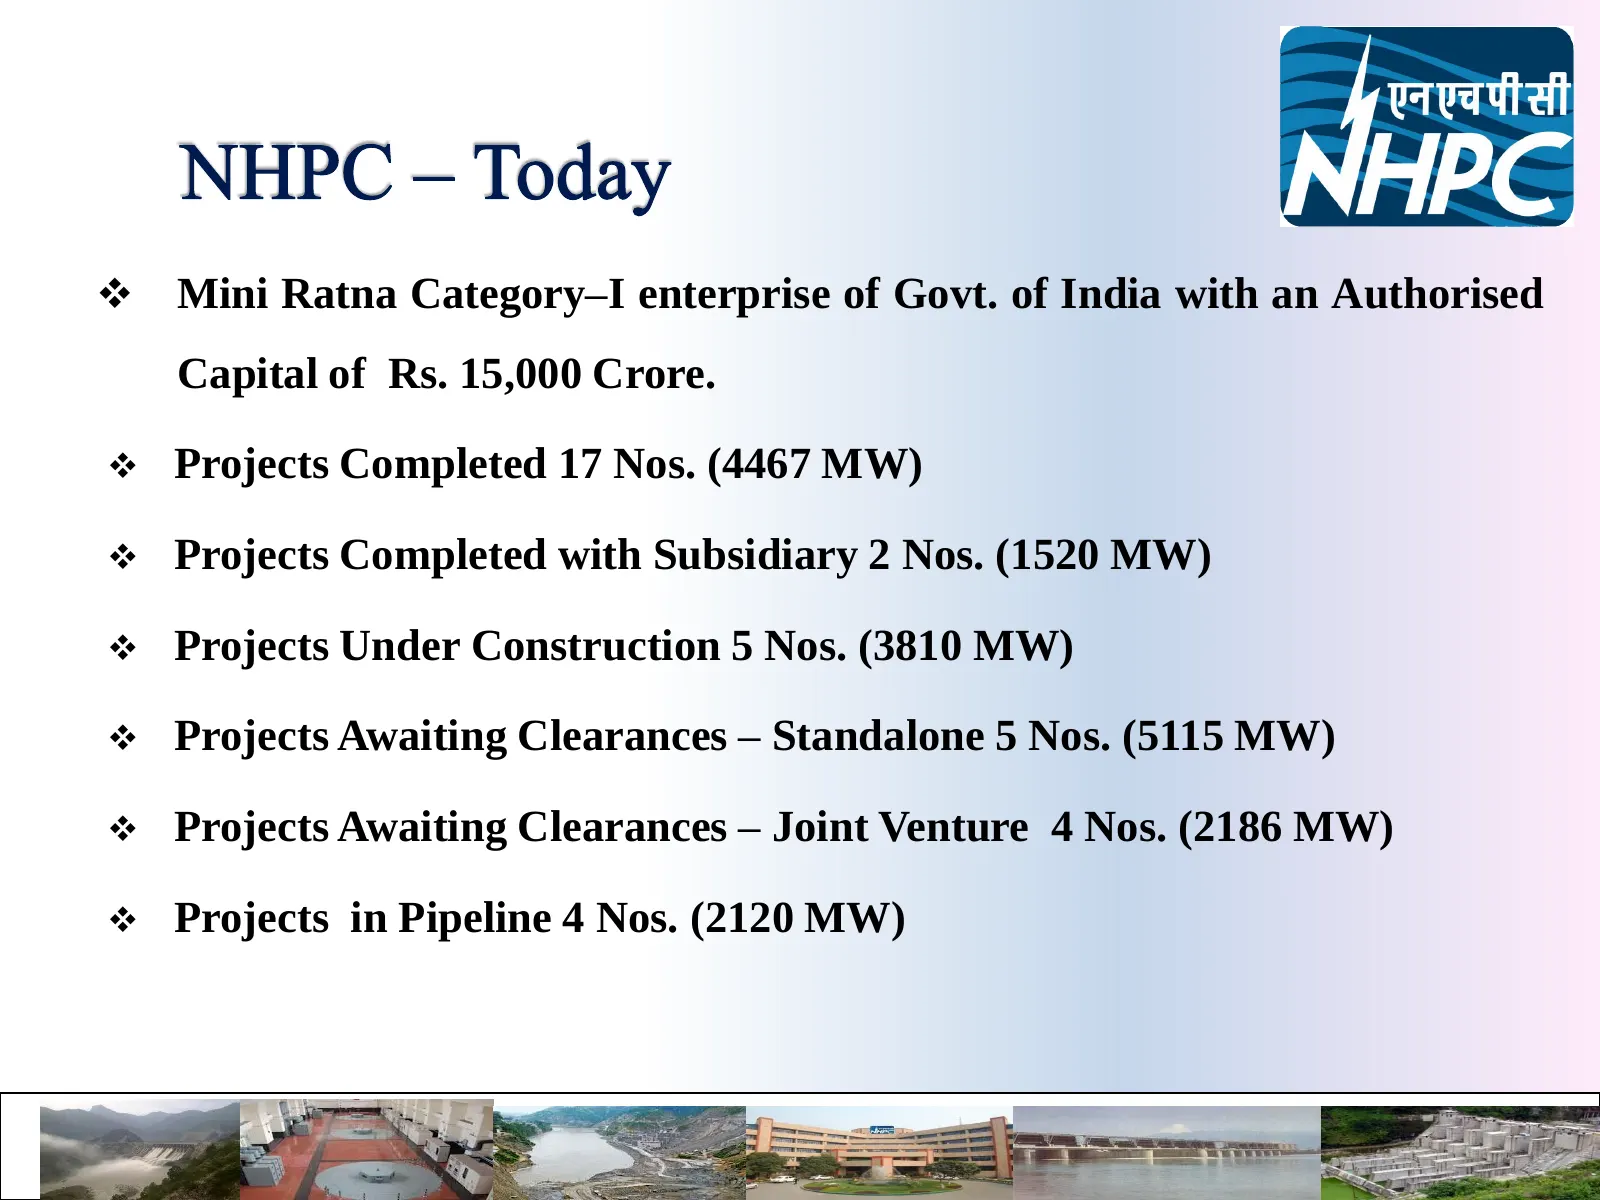
Mini Ratna Category–I enterprise of Govt. of India with an Authorised Capital of Rs. 15,000 Crore. Projects Completed 17 Nos. (4467 MW) Projects Completed with Subsidiary 2 Nos. (1520 MW) Projects Under Construction 5 Nos. (3810 MW) Projects Awaiting Clearances – Standalone 5 Nos. (5115 MW
Slide 7: NHPC's Track Record
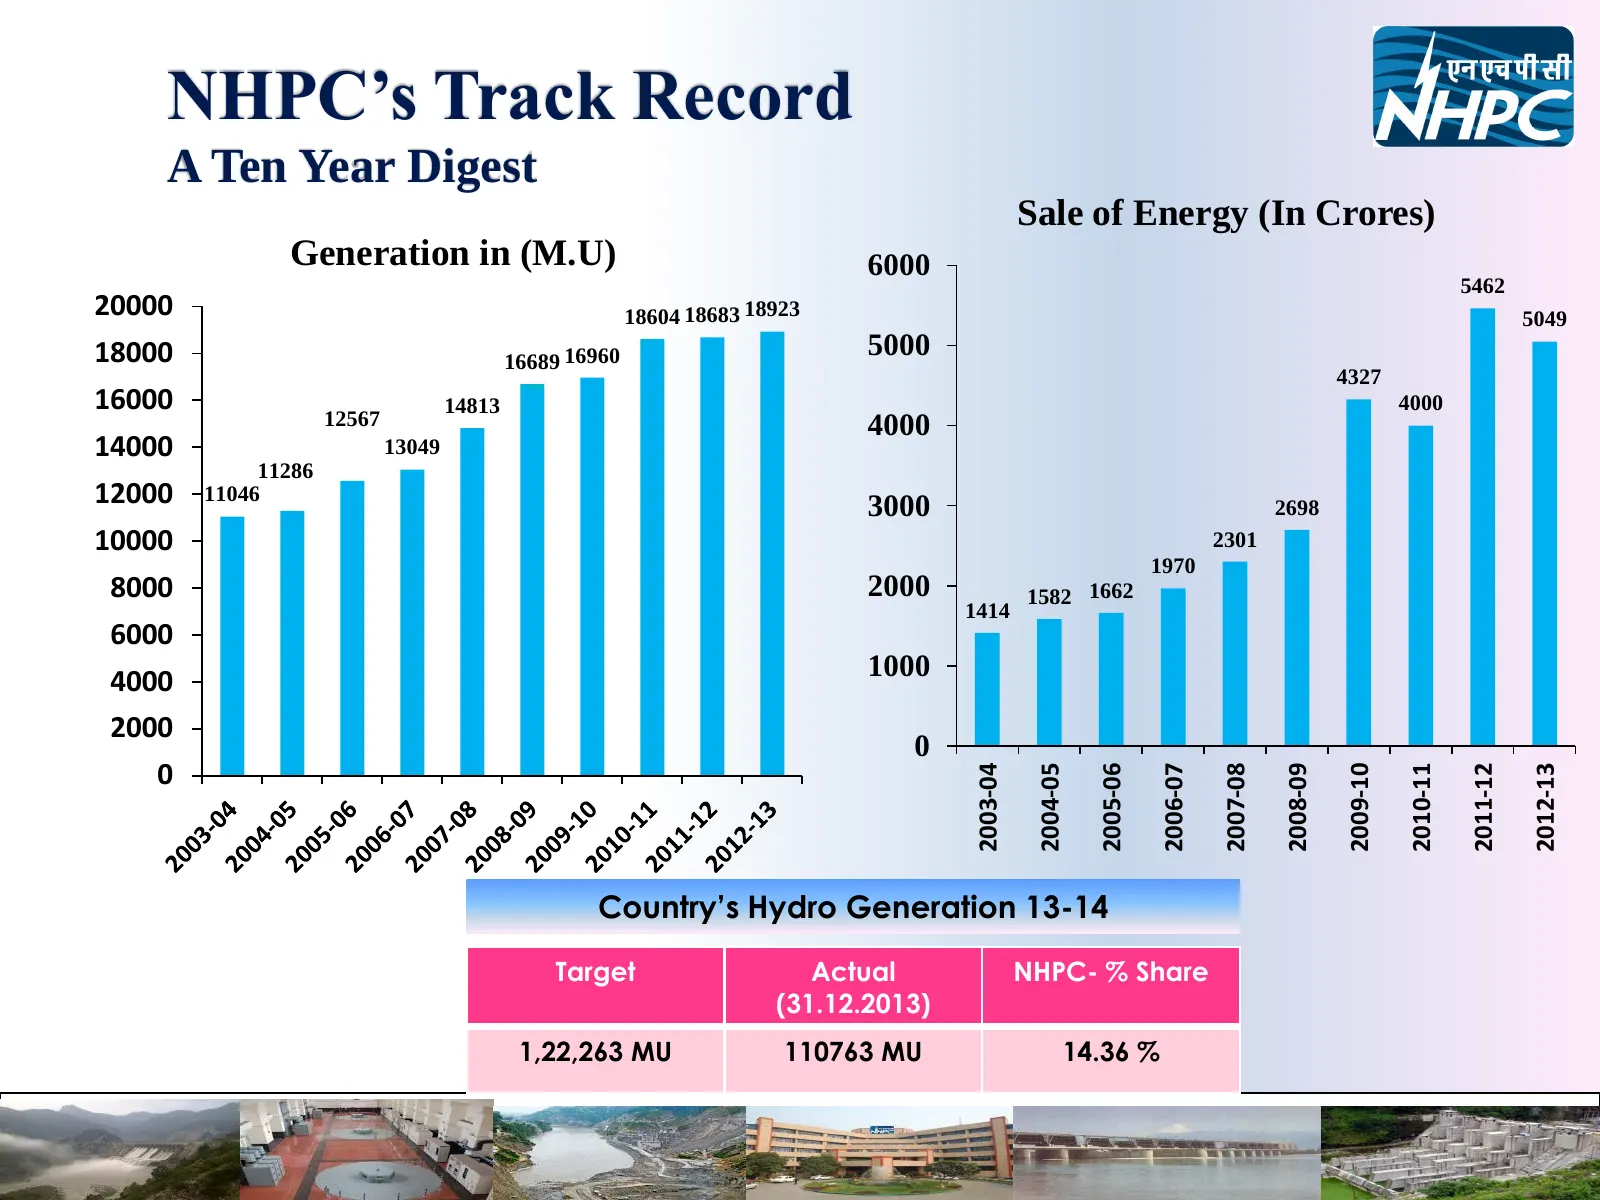
NHPC’s Track Record A Ten Year Digest Sale of Energy (In Crores) Generation in (M.U) 6000 5462 20000 18604 18683 18923 5049 18000 16689 16960 5000 4327 16000 14813 4000 12567 4000 14000 13049 11286 12000 11046 3000 2698 10000 2301 1970 8000 2000 1582 1662 1414 6000 4000 1000 2000 0 0 2003-04 2004-05
Slide 8: NHPC's Track Record
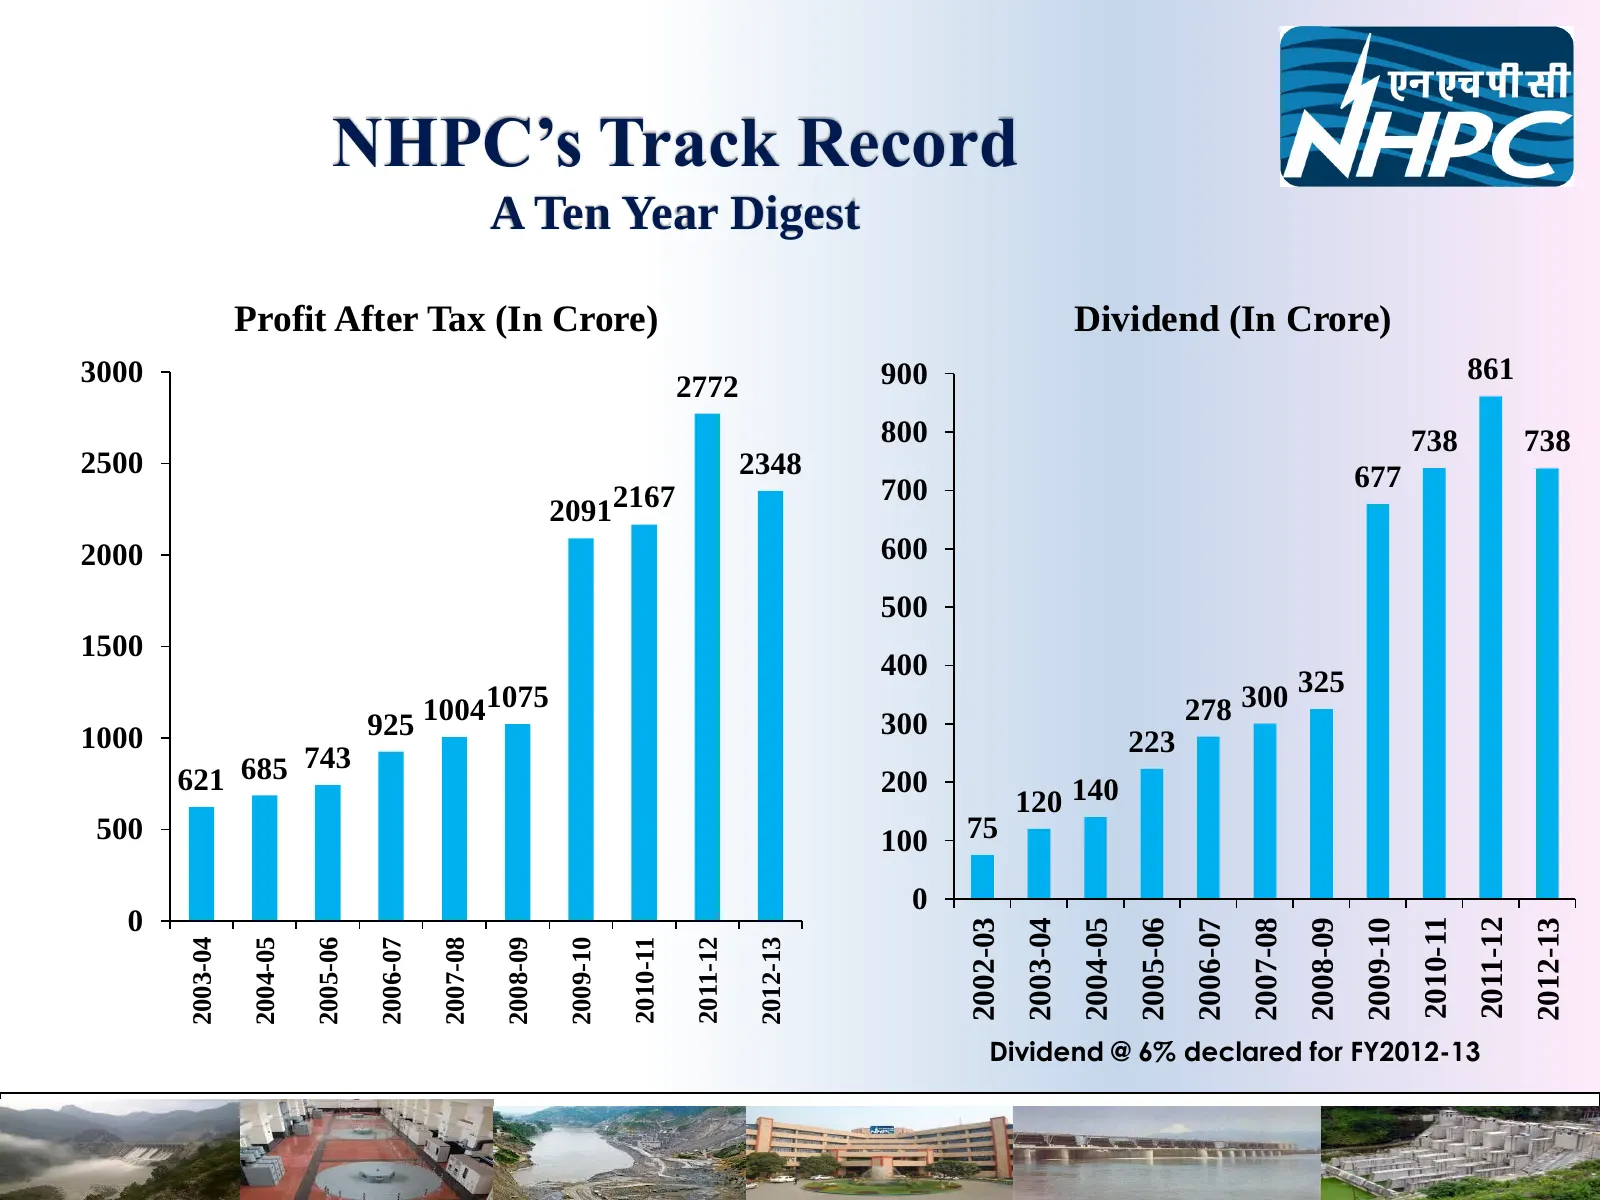
NHPC’s Track Record A Ten Year Digest Profit After Tax (In Crore) Dividend (In Crore) 3000 900 861 2772 800 738 738 2500 2348 677 700 20912167 2000 600 500 1500 400 300 325 925 10041075 300 278 1000 223 743 621 685 200 120 140 500 100 75 0 0 2010-11 2011-12 2002-03 2003-04 2004-05 2005-06 2006-07 20
Slide 9: Operational Projects- Own
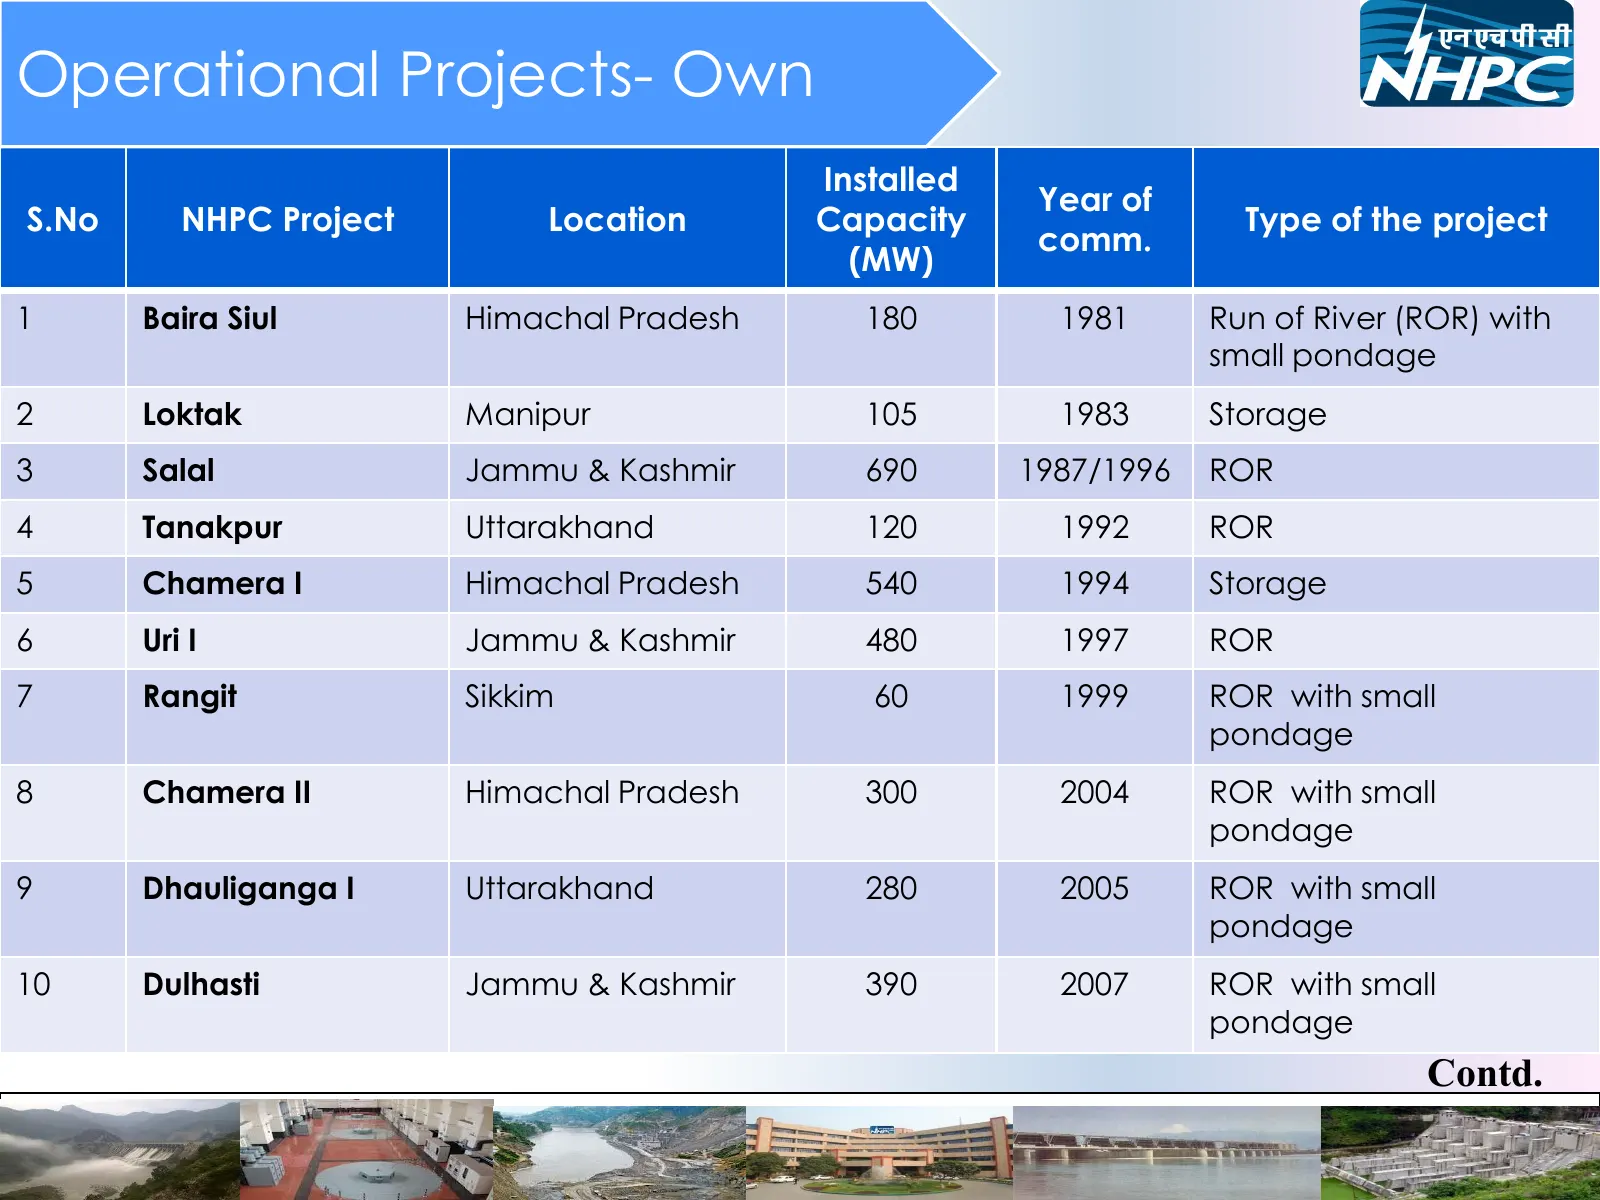
Operational Projects- Own Installed Year of S.No NHPC Project Location Capacity Type of the project comm. (MW) 1 Baira Siul Himachal Pradesh 180 1981 Run of River (ROR) with small pondage 2 Loktak Manipur 105 1983 Storage 3 Salal Jammu & Kashmir 690 1987/1996 ROR 4 Tanakpur Uttarakhand 120 1992 ROR
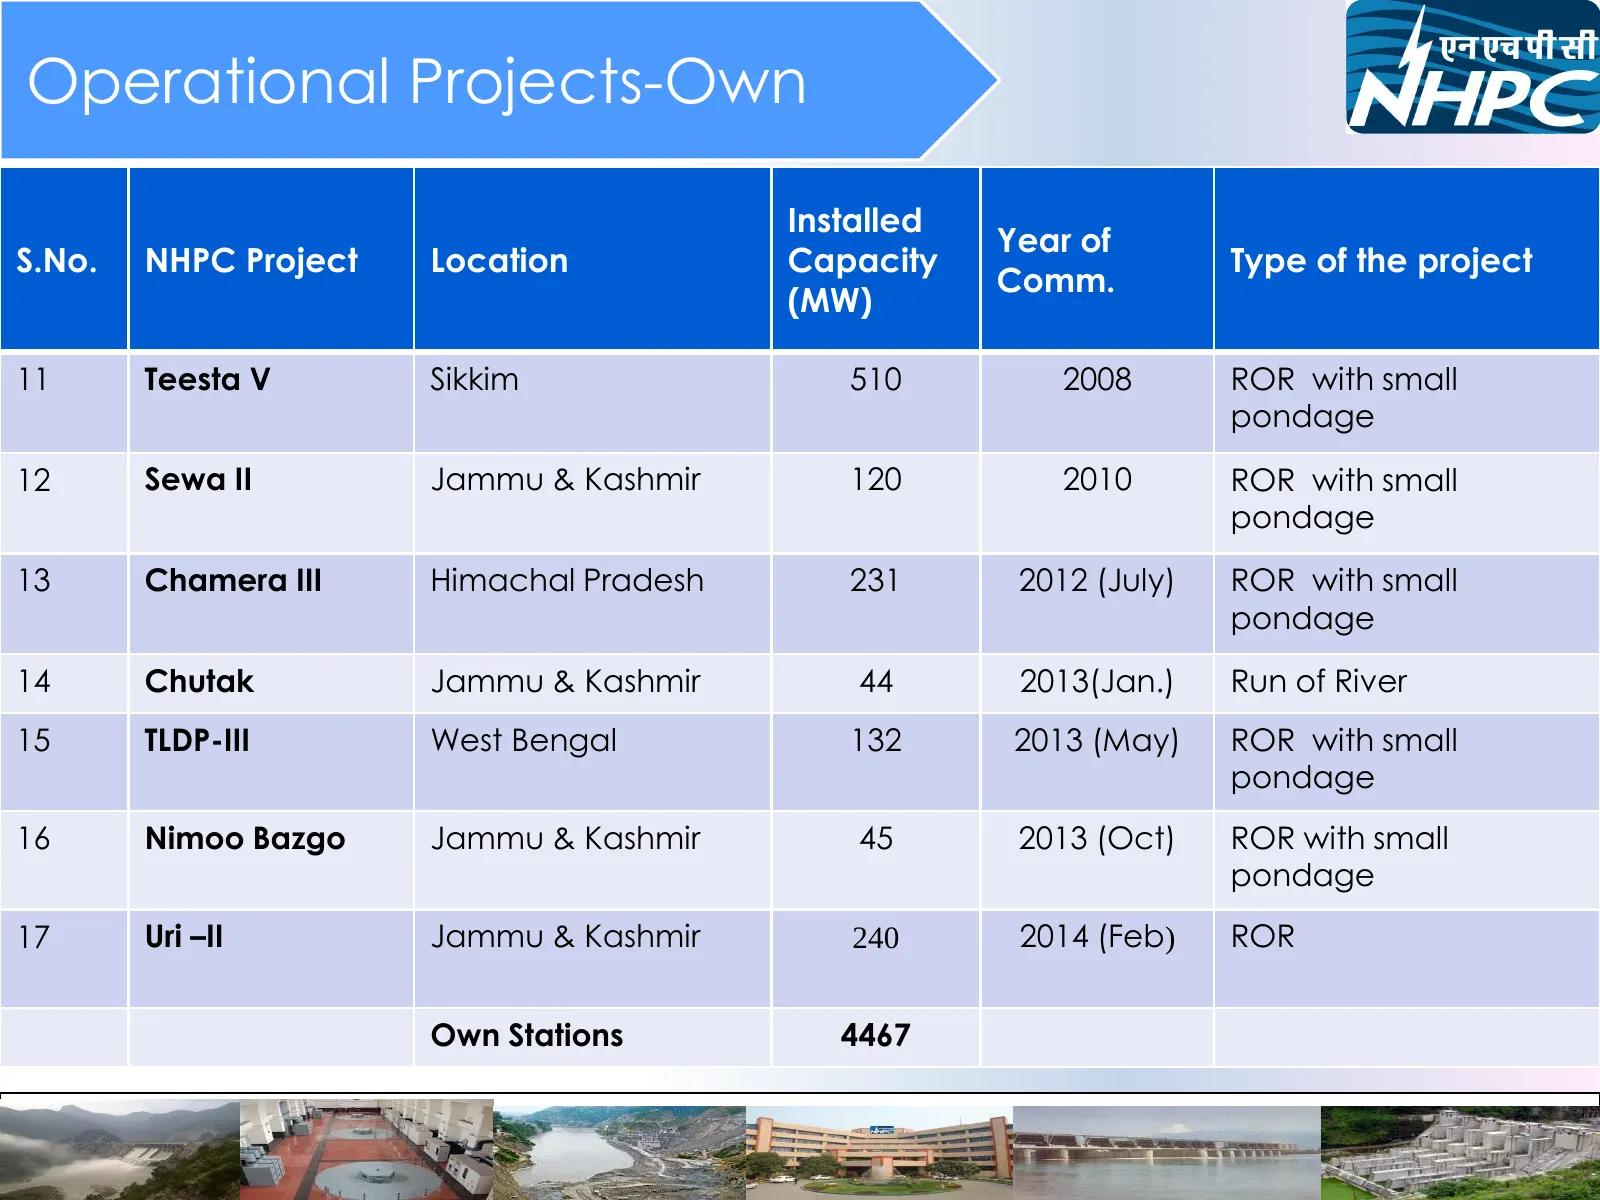
Slide 10: Operational Projects-Own
Operational Projects-Own Installed Year of S.No. NHPC Project Location Capacity Type of the project Comm. (MW) 11 Teesta V Sikkim 510 2008 ROR with small pondage 12 Sewa II Jammu & Kashmir 120 2010 ROR with small pondage 13 Chamera III Himachal Pradesh 231 2012 (July) ROR with small pondage 14 Chuta
Slide 11: Operational Projects- JV
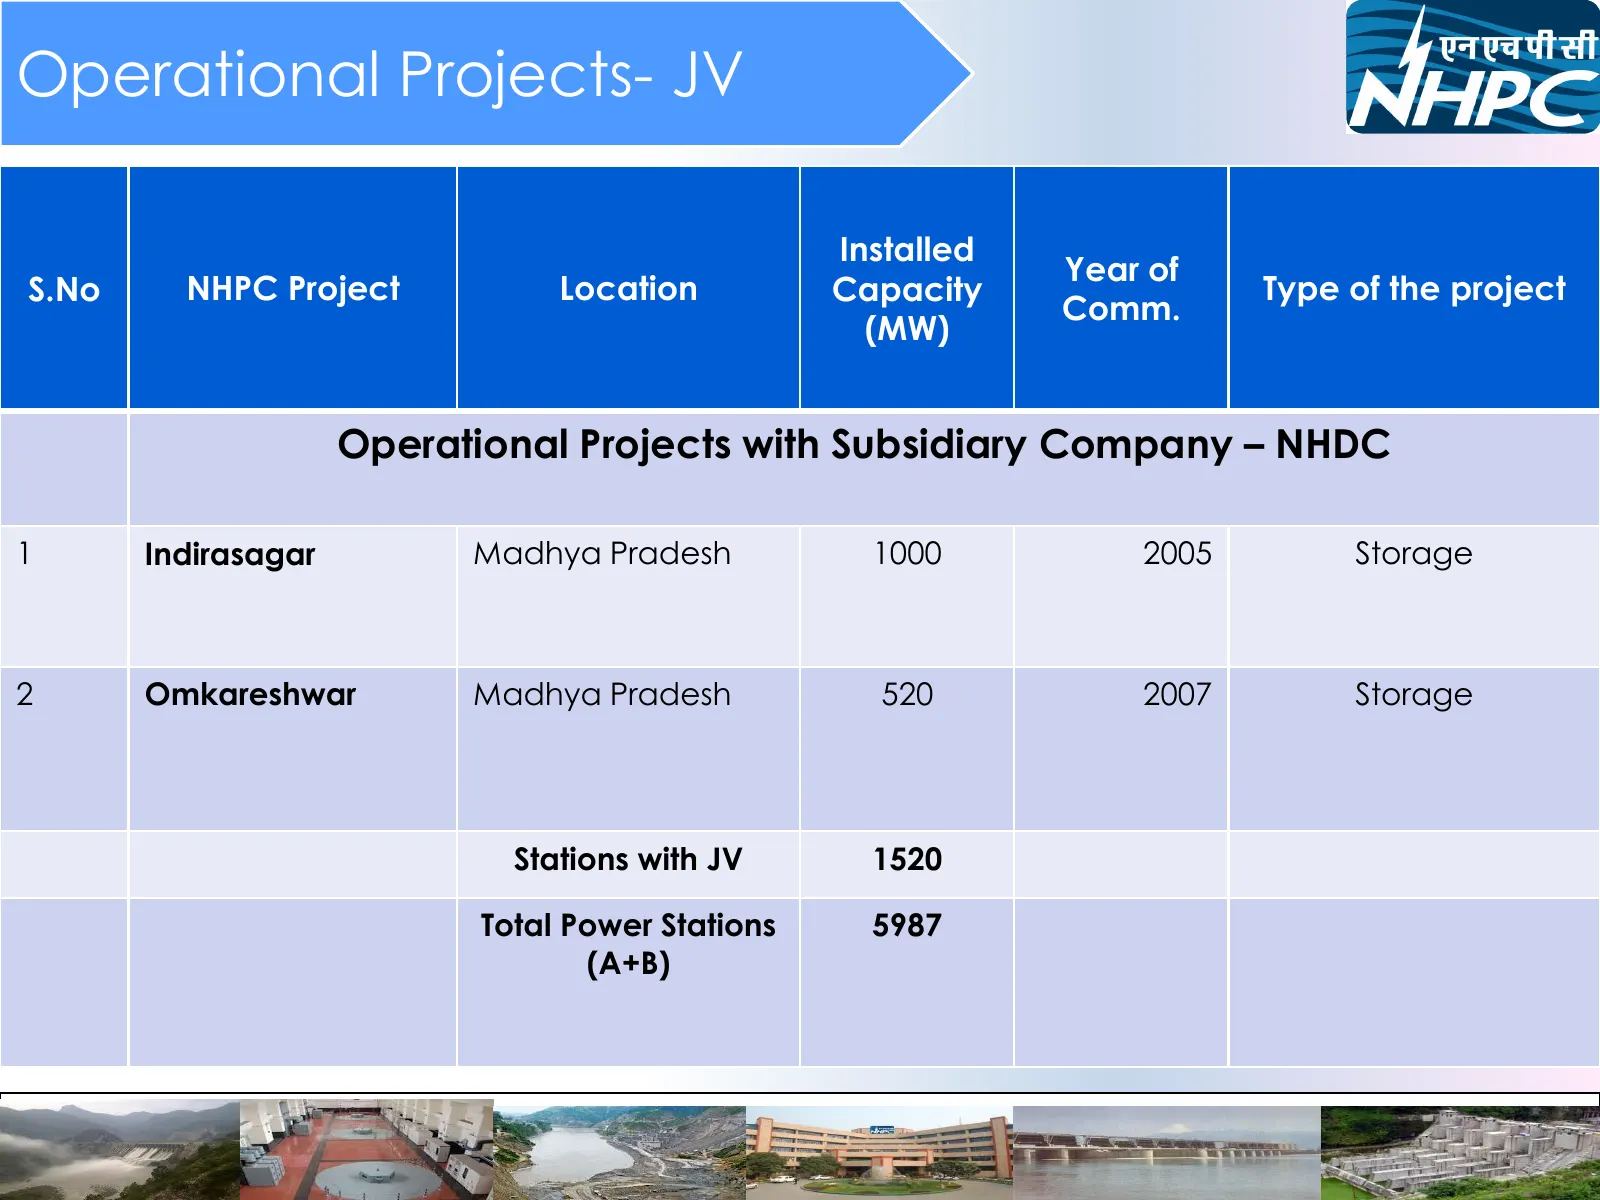
Operational Projects- JV Installed Year of S.No NHPC Project Location Capacity Type of the project Comm. (MW) Operational Projects with Subsidiary Company – NHDC 1 Indirasagar Madhya Pradesh 1000 2005 Storage 2 Omkareshwar Madhya Pradesh 520 2007 Storage Stations with JV 1520 Total Power Stations 59
Slide 12: Projects Under Construction-Own
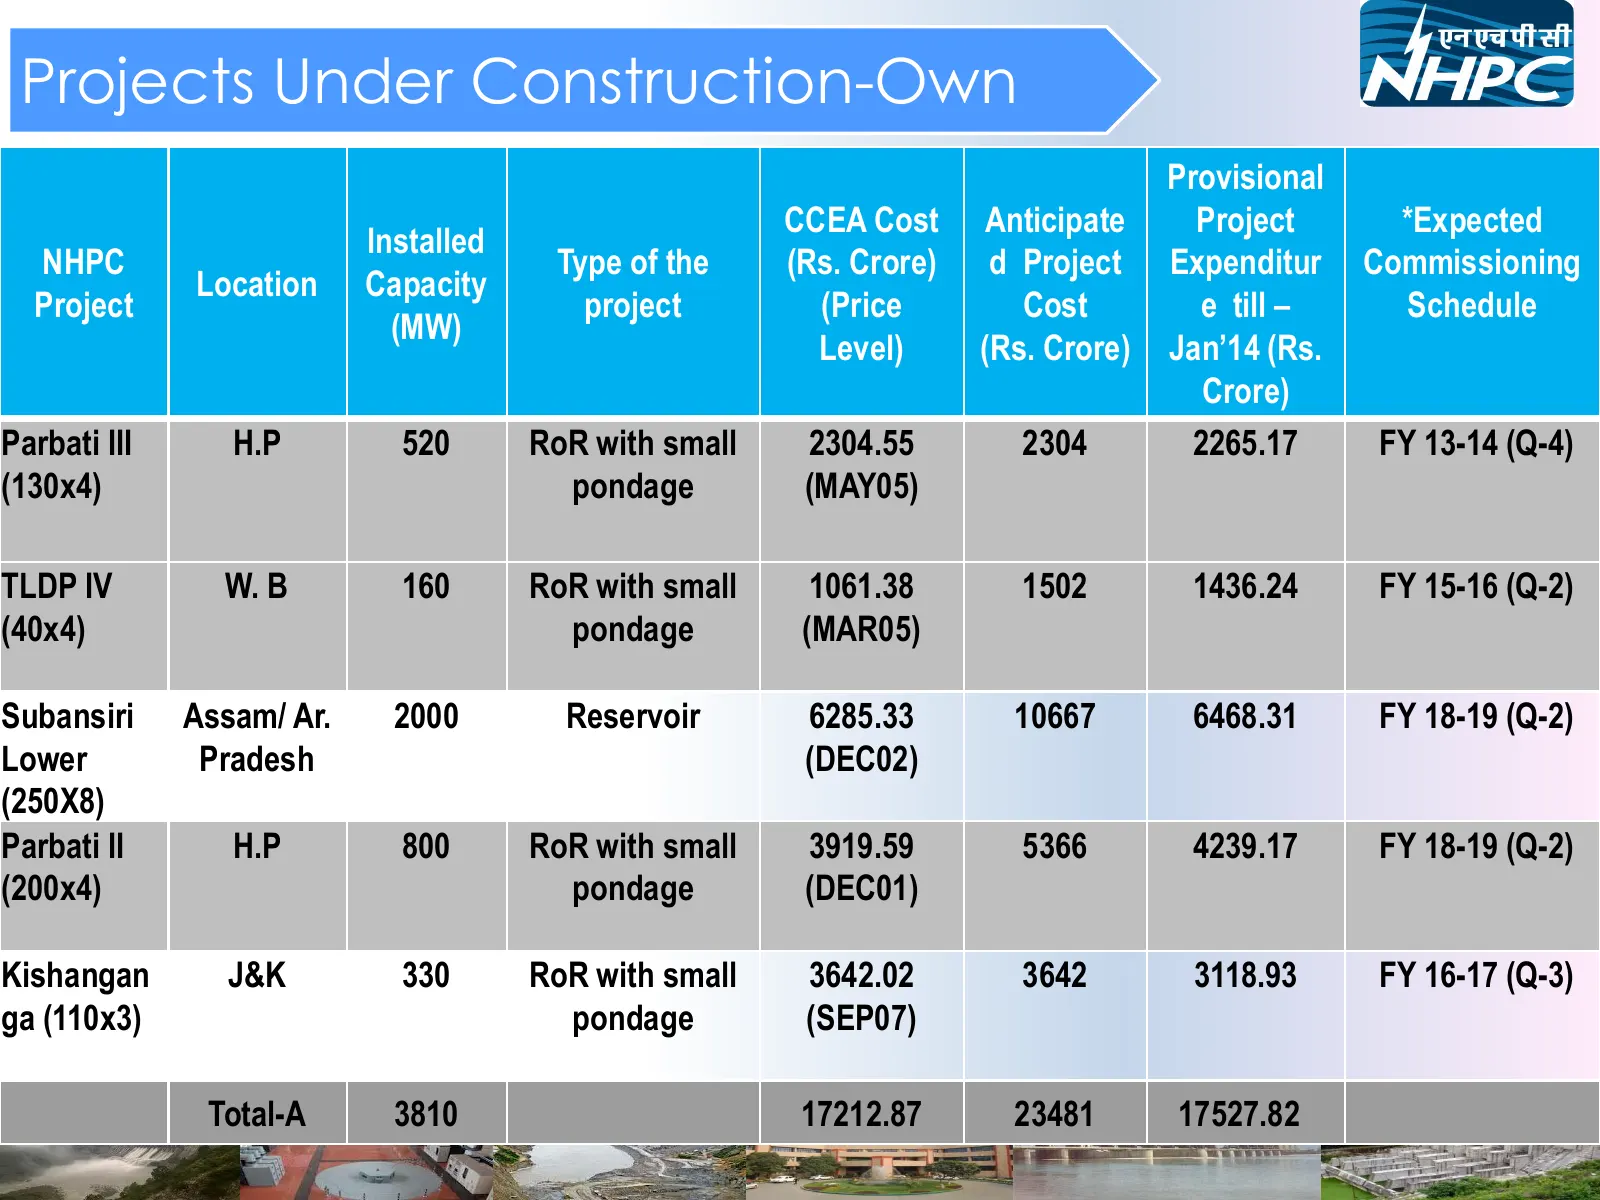
Projects Under Construction-Own Provisional CCEA Cost Anticipate Project *Expected Installed NHPC Type of the (Rs. Crore) d Project Expenditur Commissioning Location Capacity Project project (Price Cost e till – Schedule (MW) Level) (Rs. Crore) Jan’14 (Rs. Crore) Parbati III H.P 520 RoR with small 2
Slide 13: Projects Under Clearance-Own
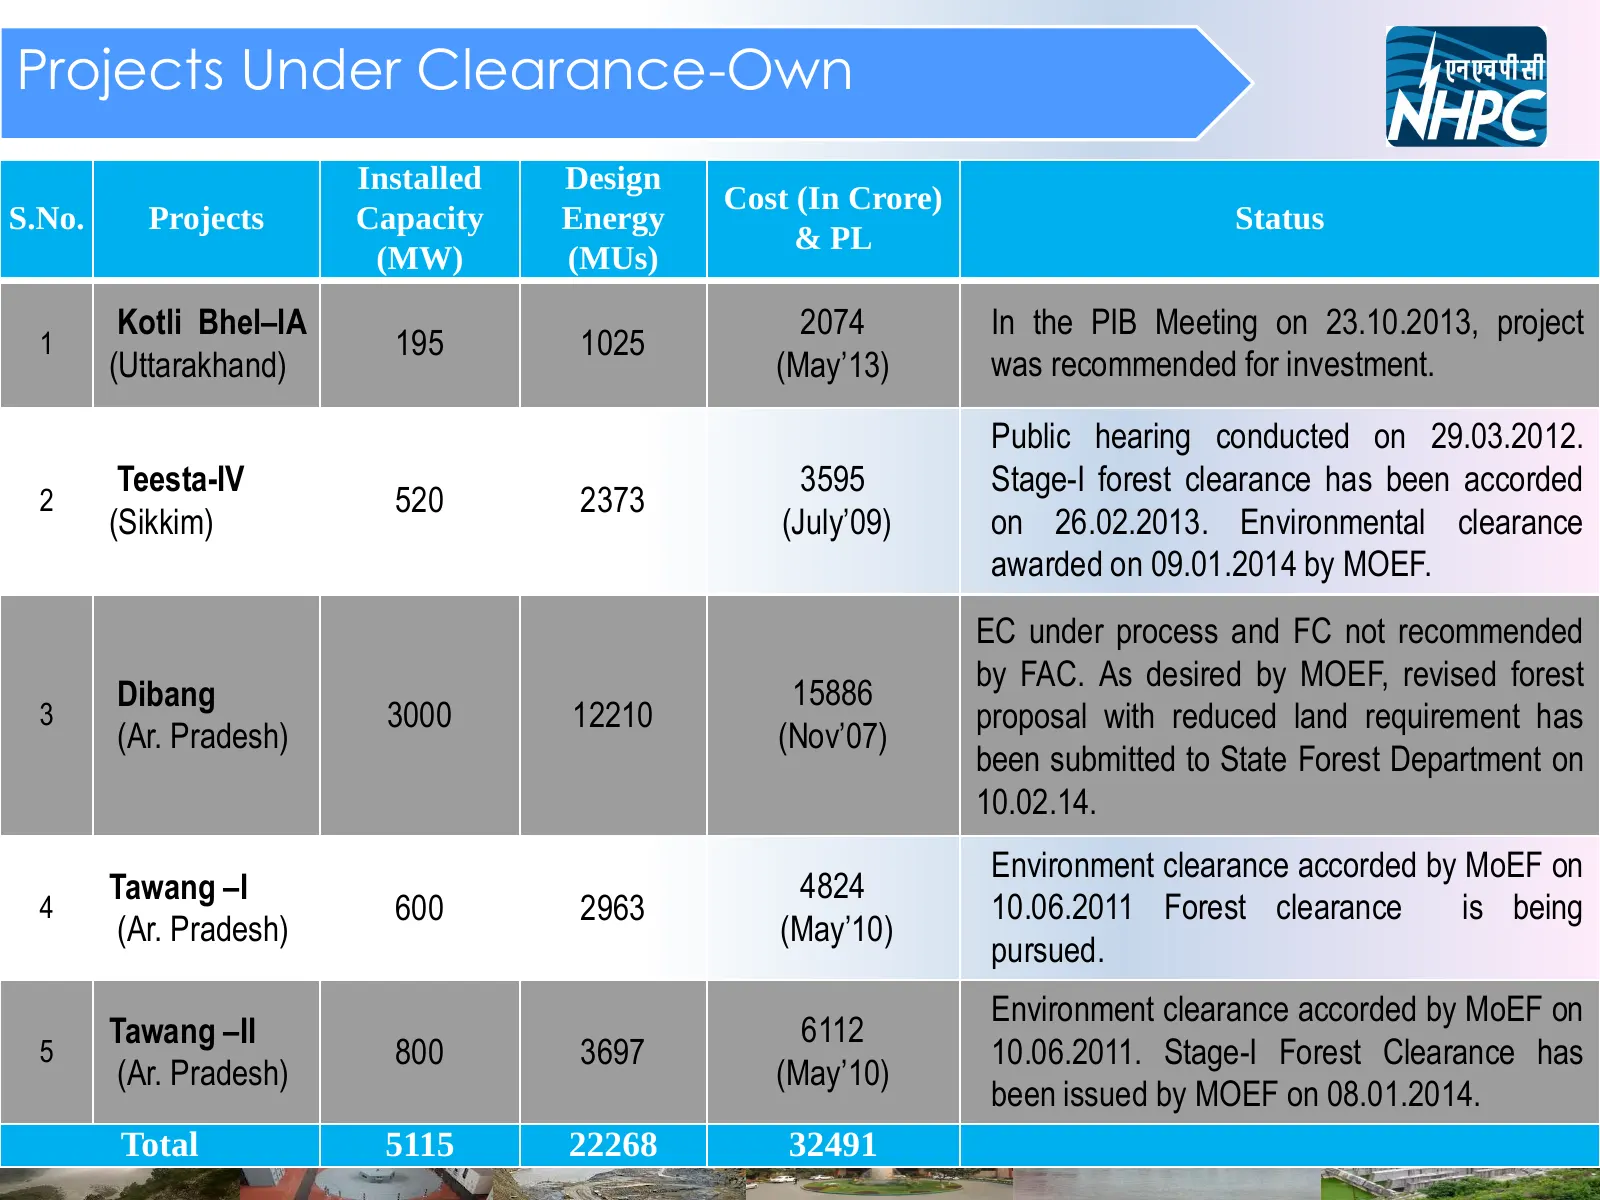
Projects Under Clearance-Own Installed Design Cost (In Crore) S.No. Projects Capacity Energy Status & PL (MW) (MUs) Kotli Bhel–IA 2074 In the PIB Meeting on 23.10.2013, project 1 195 1025 (Uttarakhand) (May’13) was recommended for investment. Public hearing conducted on 29.03.2012. Teesta-IV 3595 St
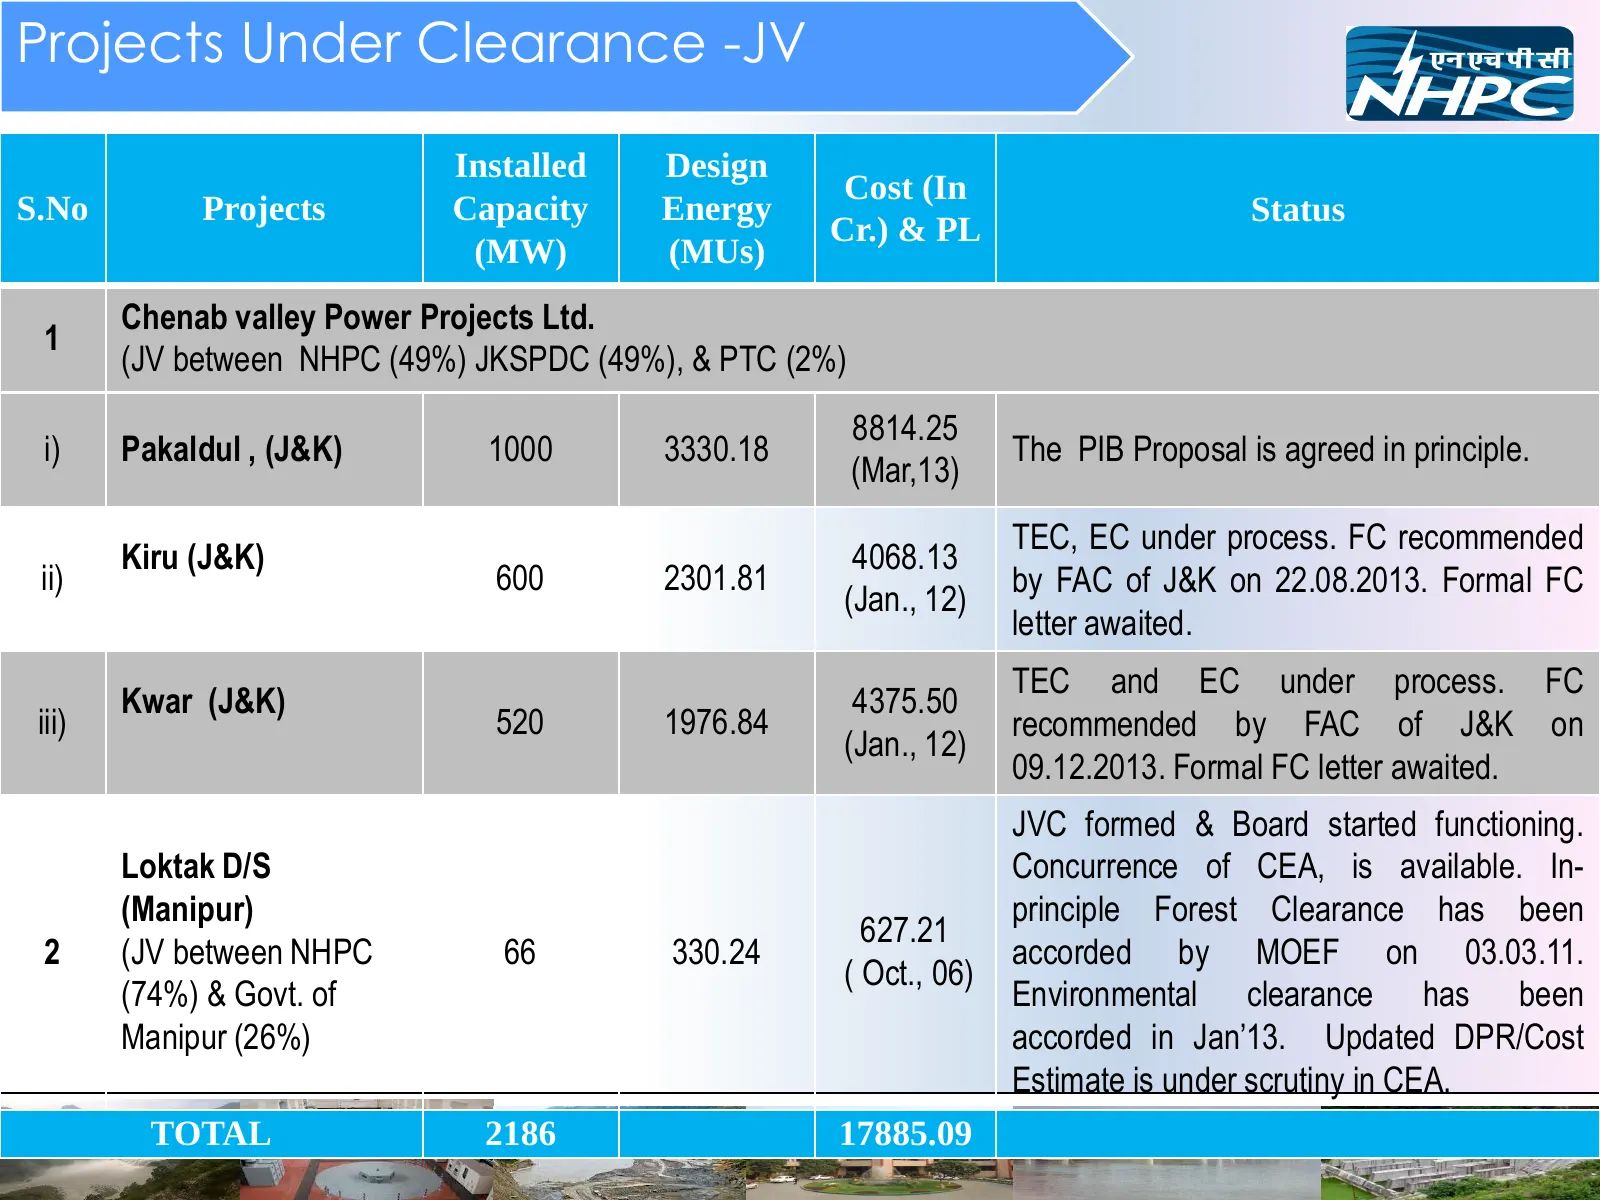
Slide 14: Projects Under Clearance-JV
Projects Under Clearance -JV Installed Design Cost (In S.No Projects Capacity Energy Status Cr.) & PL (MW) (MUs) Chenab valley Power Projects Ltd. 1 (JV between NHPC (49%) JKSPDC (49%), & PTC (2%) 8814.25 i) Pakaldul , (J&K) 1000 3330.18 The PIB Proposal is agreed in principle. (Mar,13) TEC, EC unde
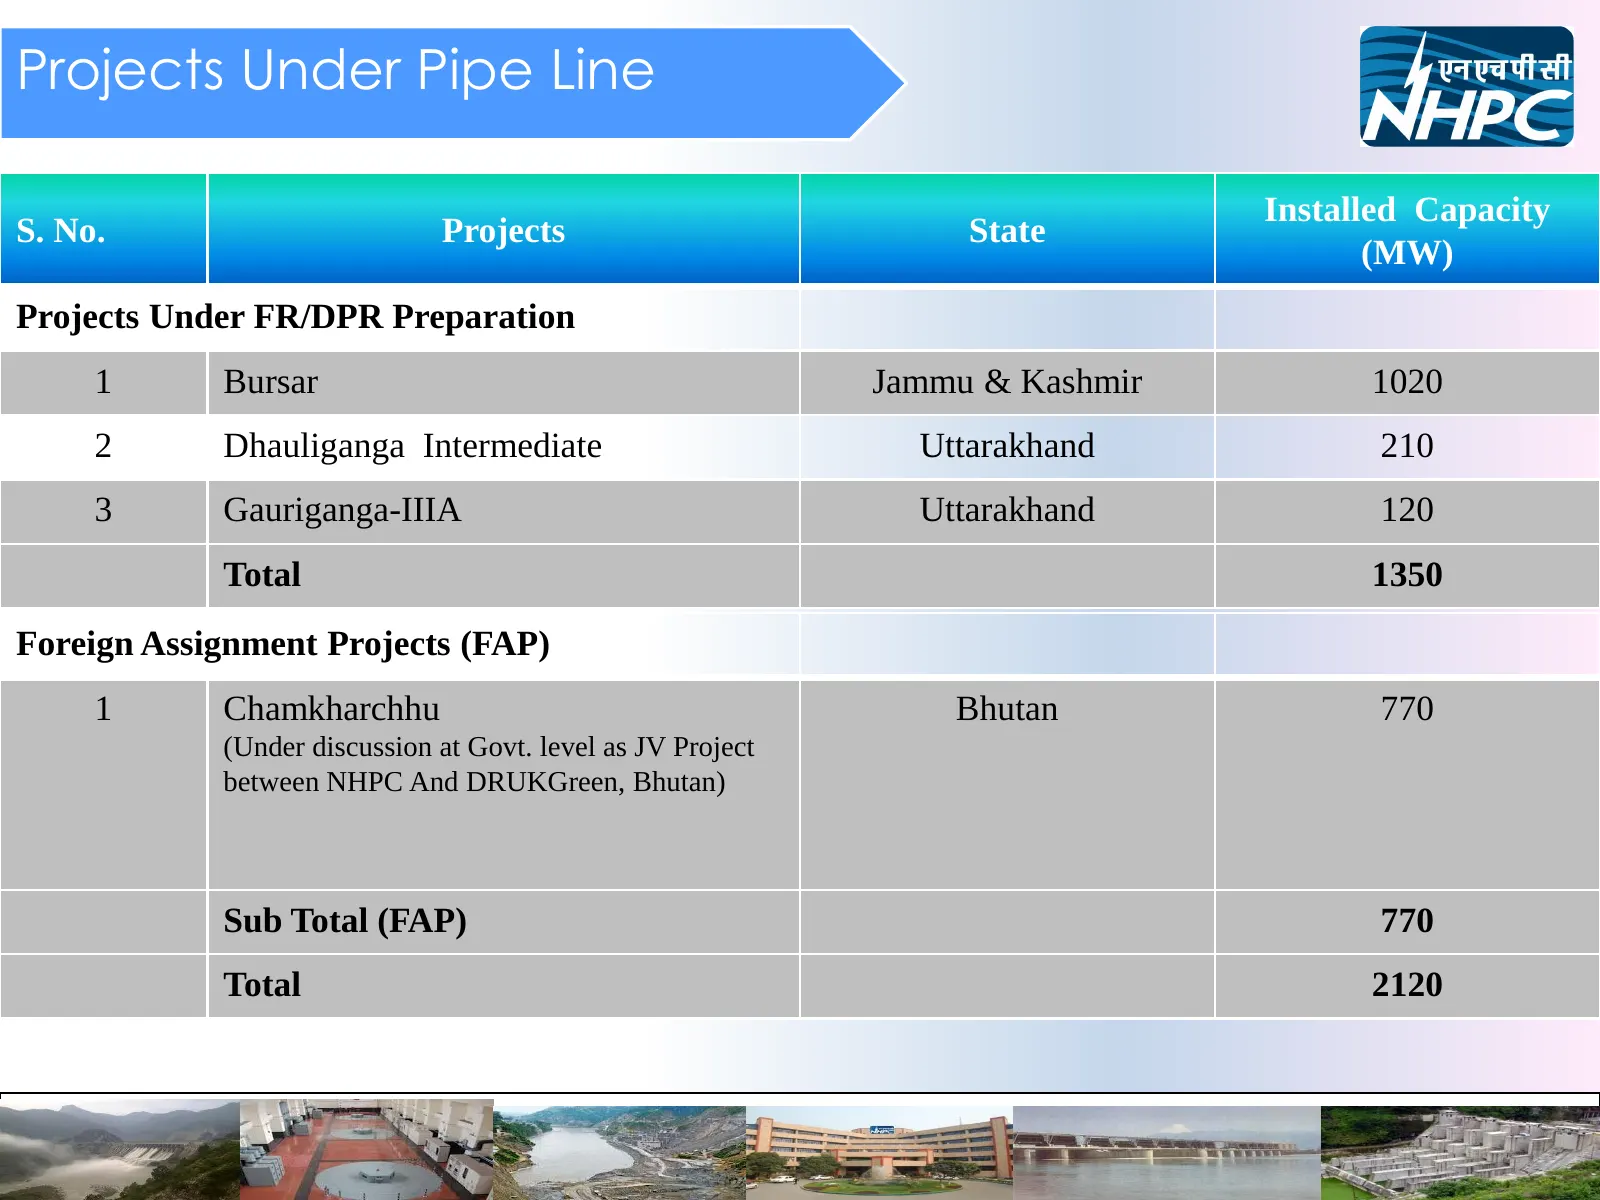
Slide 15: Projects Under Pipe Line
Projects Under Pipe Line Installed Capacity S. No. Projects State (MW) Projects Under FR/DPR Preparation 1 Bursar Jammu & Kashmir 1020 2 Dhauliganga Intermediate Uttarakhand 210 3 Gauriganga-IIIA Uttarakhand 120 Total 1350 Foreign Assignment Projects (FAP) 1 Chamkharchhu Bhutan 770 (Under discussion
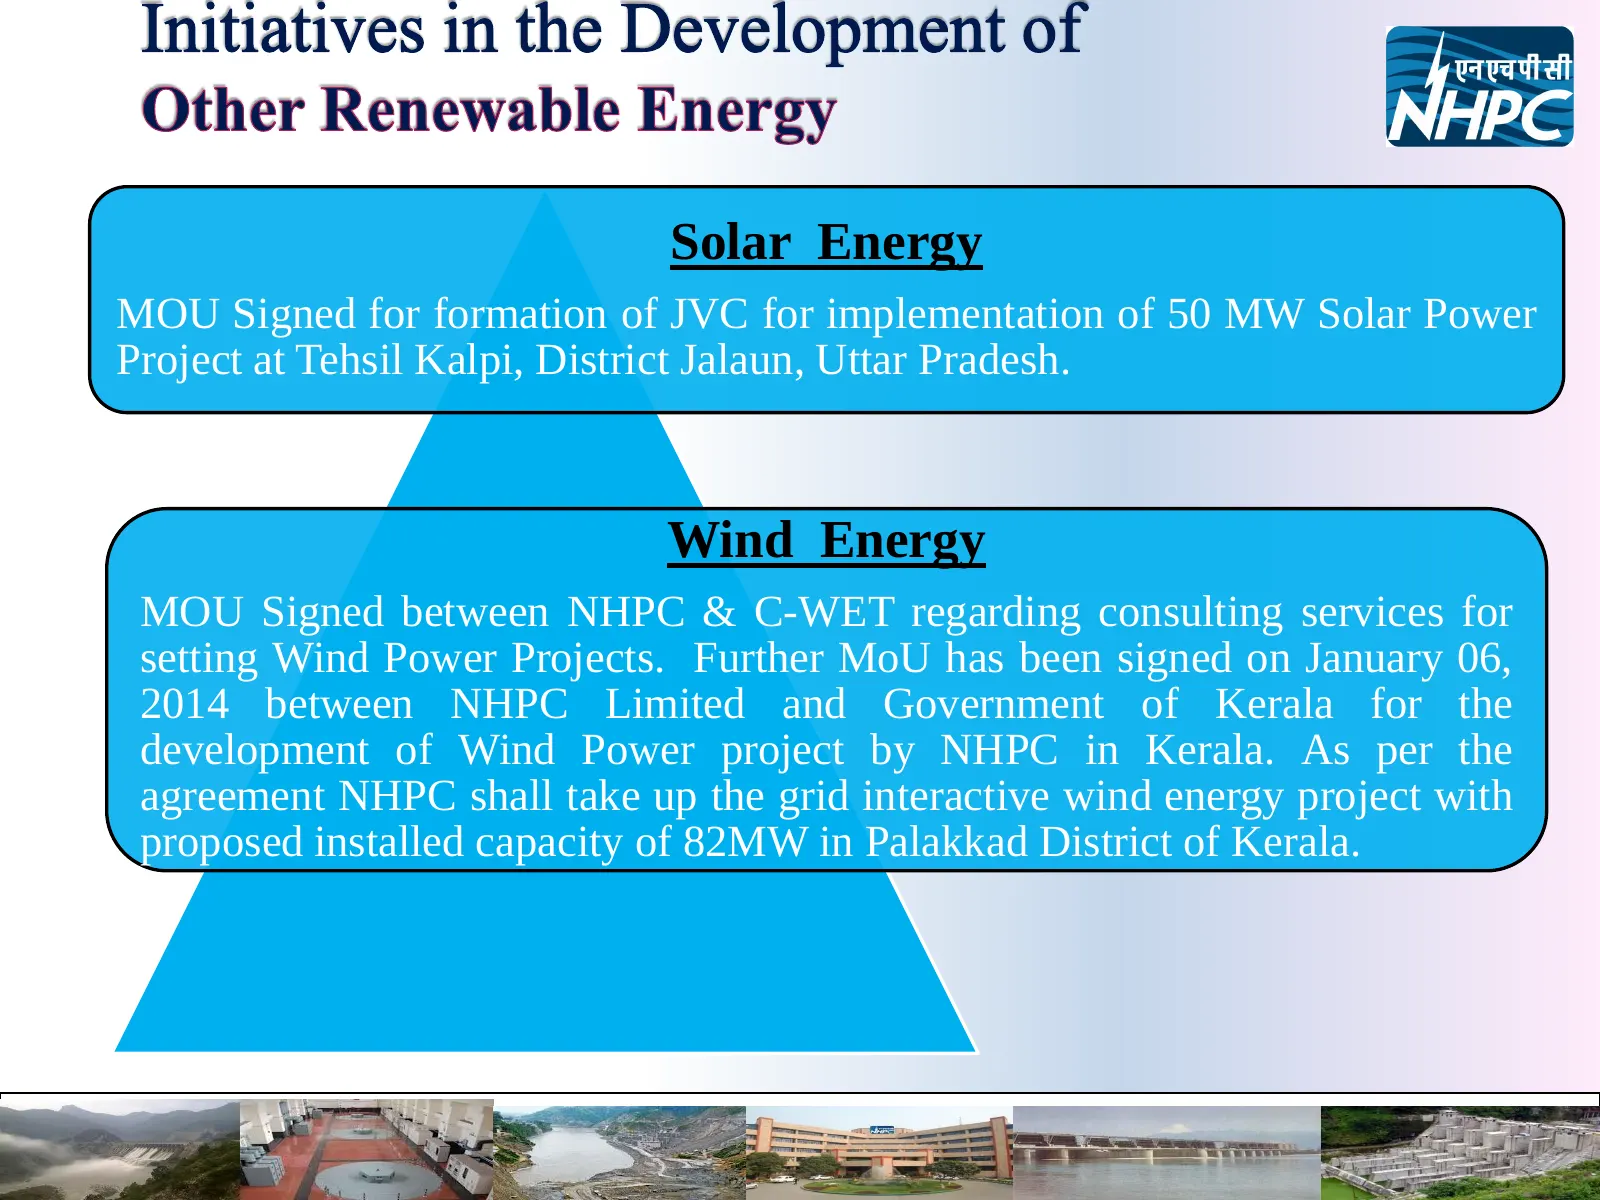
Slide 16: Solar Energy and Wind Energy
Solar Energy MOU Signed for formation of JVC for implementation of 50 MW Solar Power Project at Tehsil Kalpi, District Jalaun, Uttar Pradesh. Wind Energy MOU Signed between NHPC & C-WET regarding consulting services for setting Wind Power Projects. Further MoU has been signed on January 06, 2014 bet
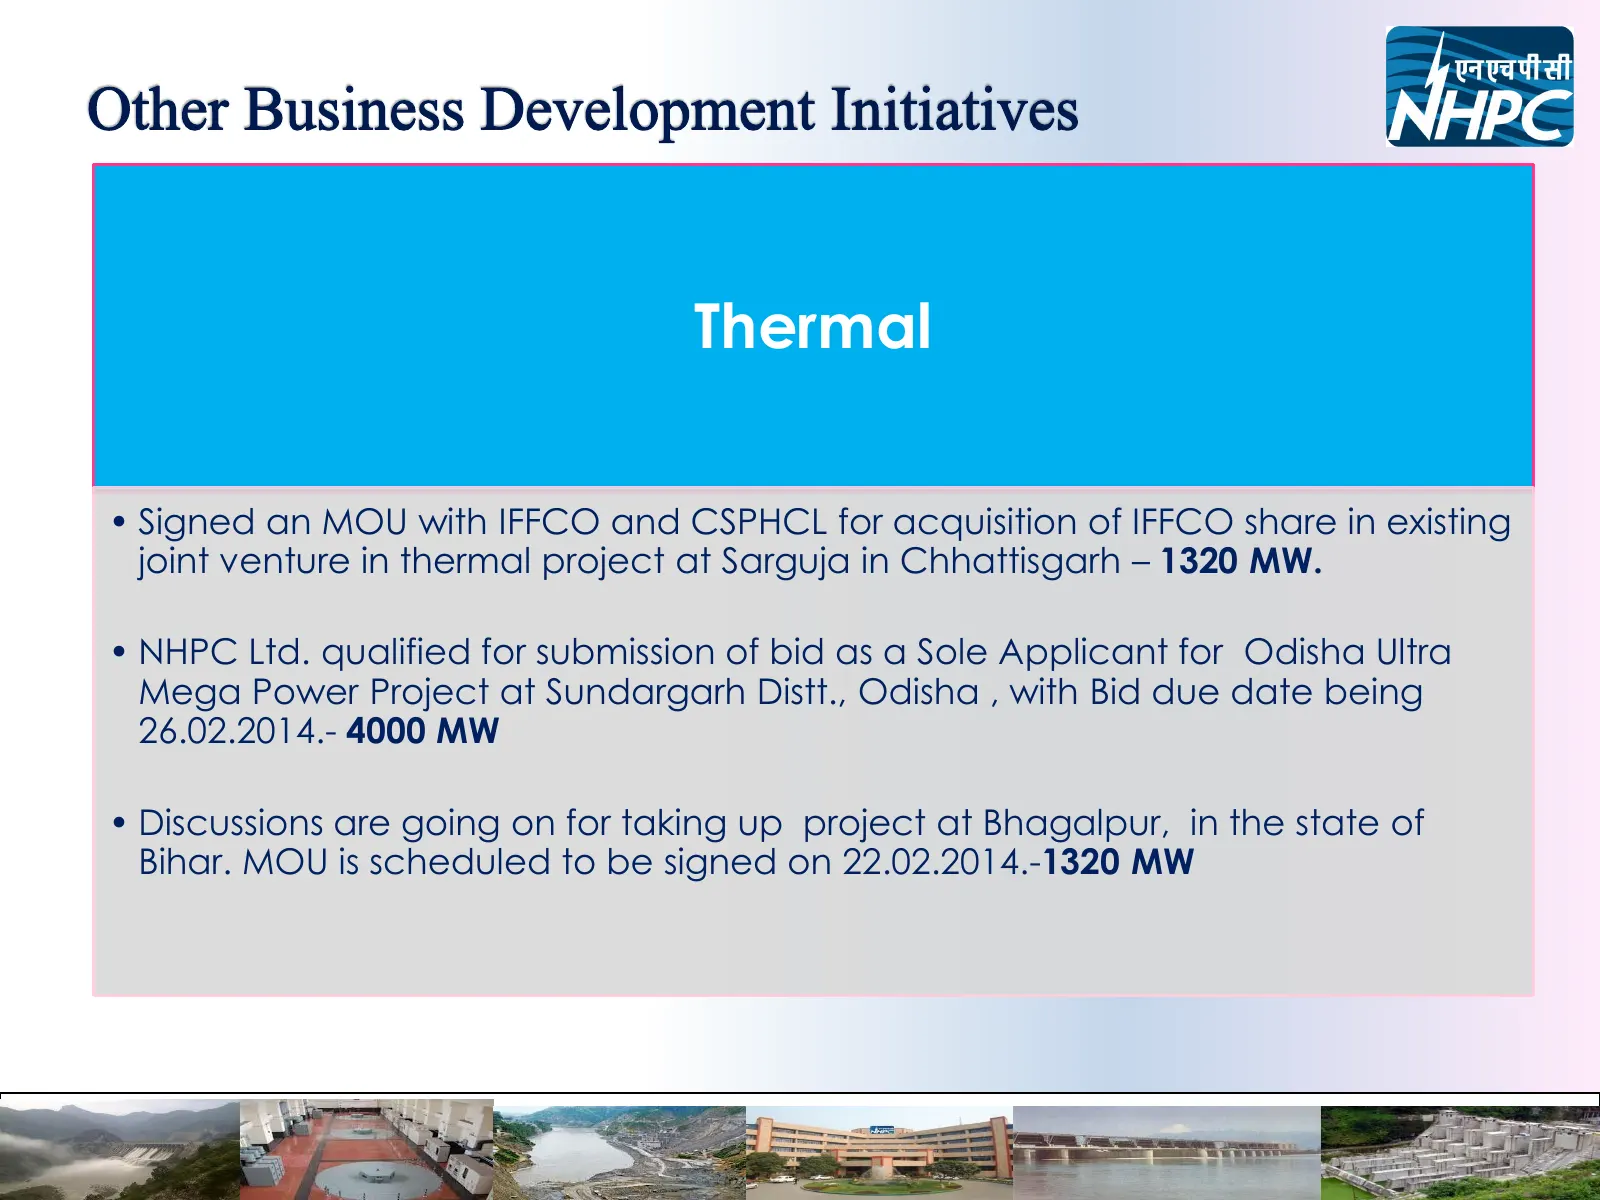
Slide 17: Thermal
Thermal • Signed an MOU with IFFCO and CSPHCL for acquisition of IFFCO share in existing joint venture in thermal project at Sarguja in Chhattisgarh – 1320 MW. • NHPC Ltd. qualified for submission of bid as a Sole Applicant for Odisha Ultra Mega Power Project at Sundargarh Distt., Odisha , with Bid
Slide 18: Investment Plan
Investment Plan
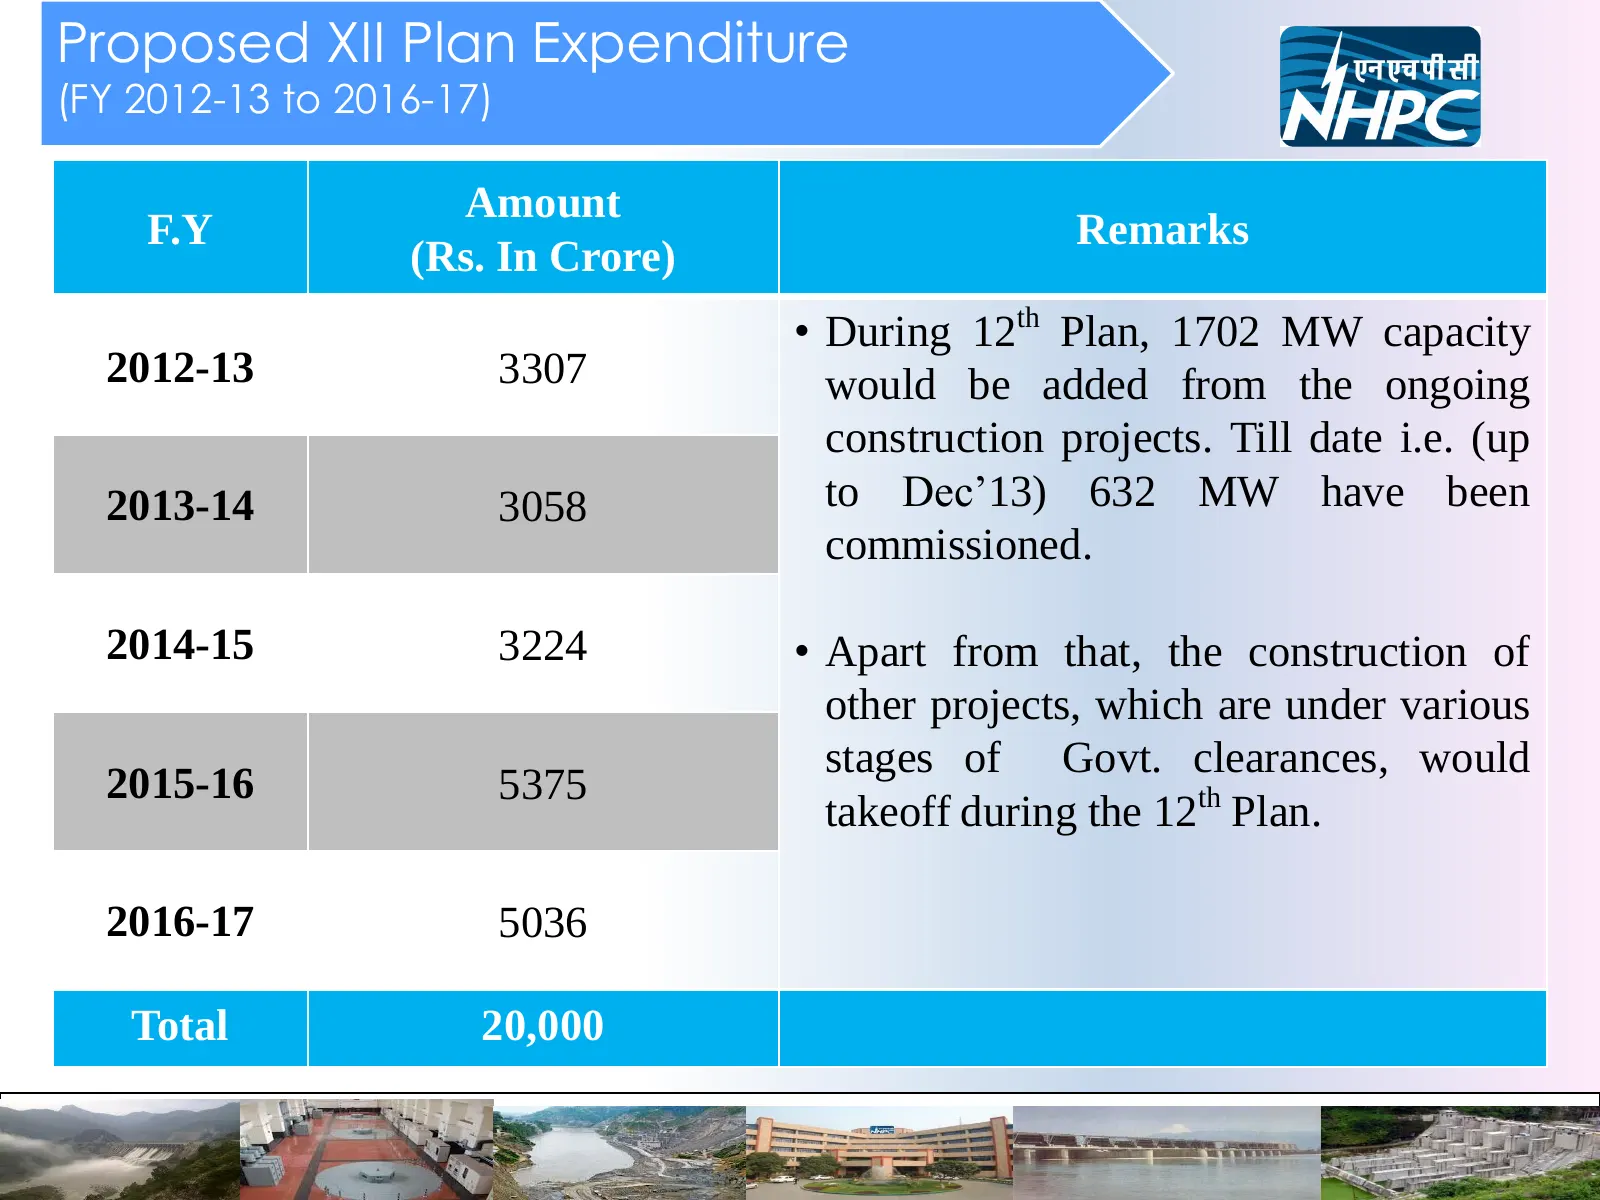
Slide 19: Proposed XII Plan Expenditure
Proposed XII Plan Expenditure (FY 2012-13 to 2016-17) Amount F.Y Remarks (Rs. In Crore) • During 12th Plan, 1702 MW capacity 2012-13 3307 would be added from the ongoing construction projects. Till date i.e. (up 2013-14 3058 to Dec’13) 632 MW have been commissioned. 2014-15 3224 • Apart from that, t

Slide 20: Financial Highlights
Financial Highlights
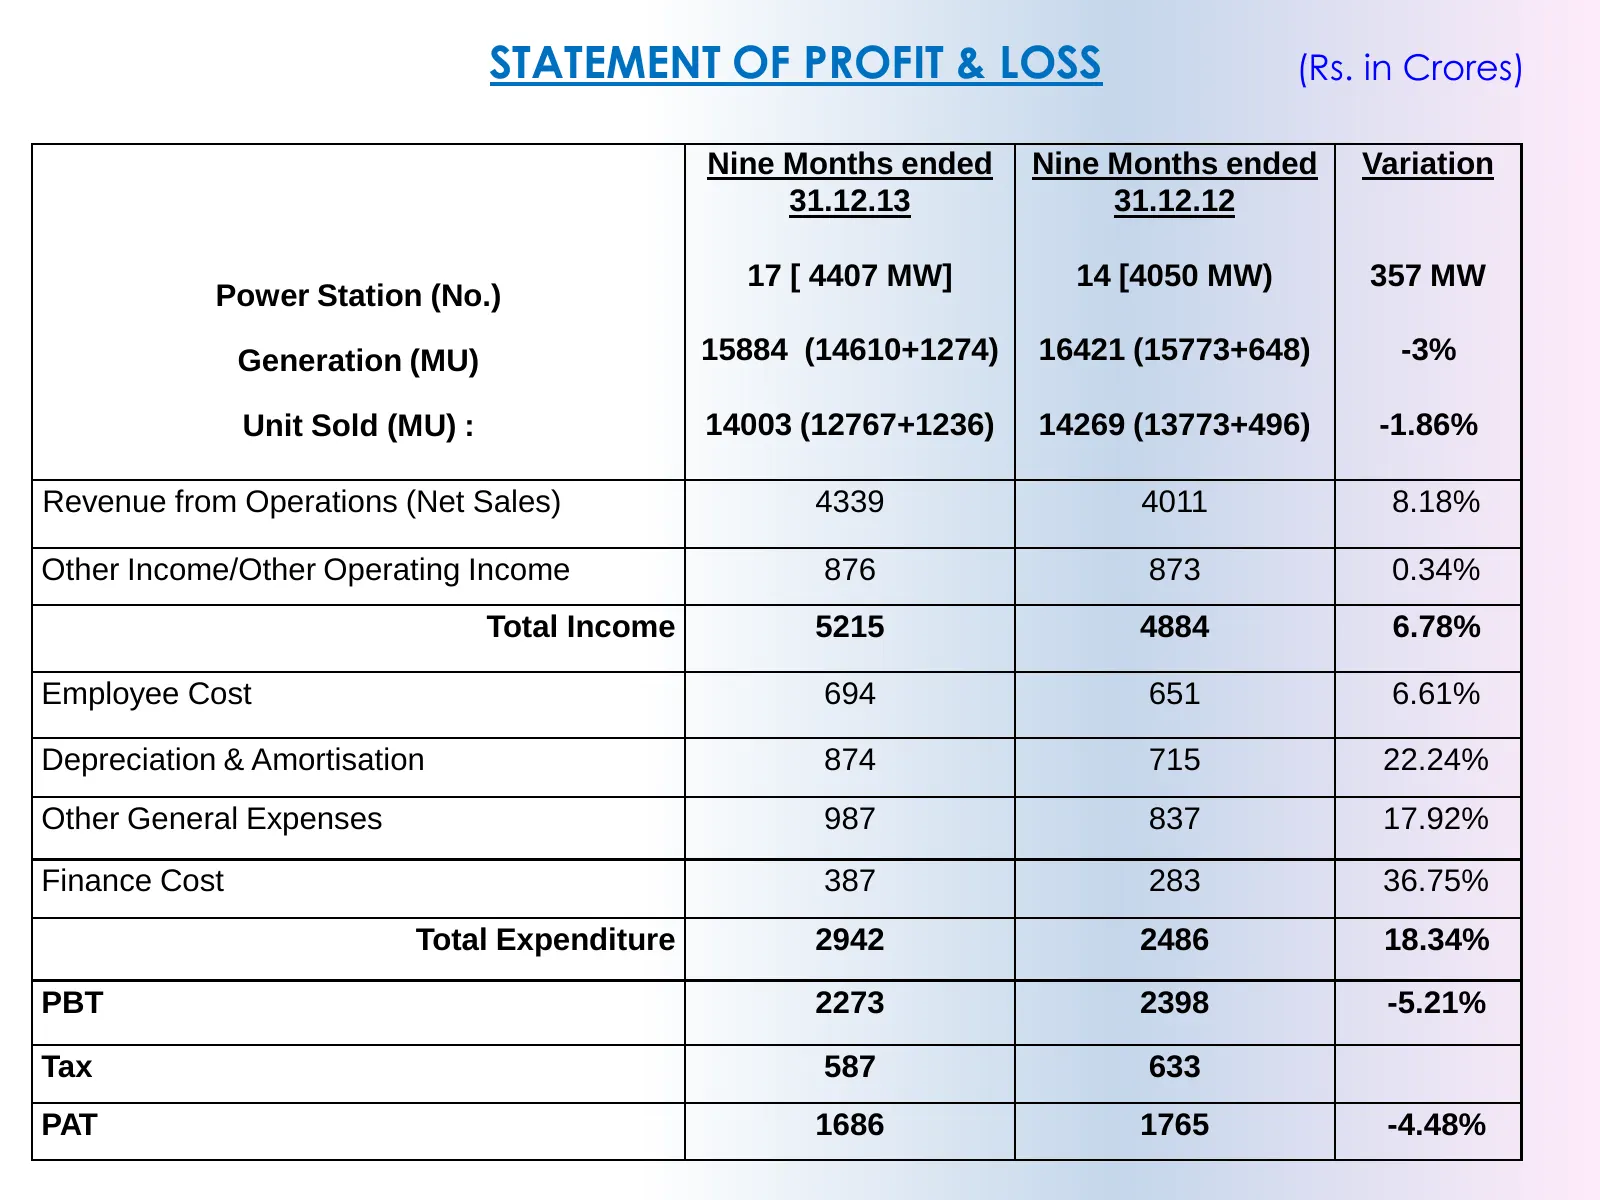
Slide 21: Statement of Profit & Loss
STATEMENT OF PROFIT & LOSS (Rs. in Crores) Nine Months ended Nine Months ended Variation 31.12.13 31.12.12 17 [ 4407 MW] 14 [4050 MW) 357 MW Power Station (No.) Generation (MU) 15884 (14610+1274) 16421 (15773+648) -3% Unit Sold (MU) : 14003 (12767+1236) 14269 (13773+496) -1.86% Revenue from Operatio
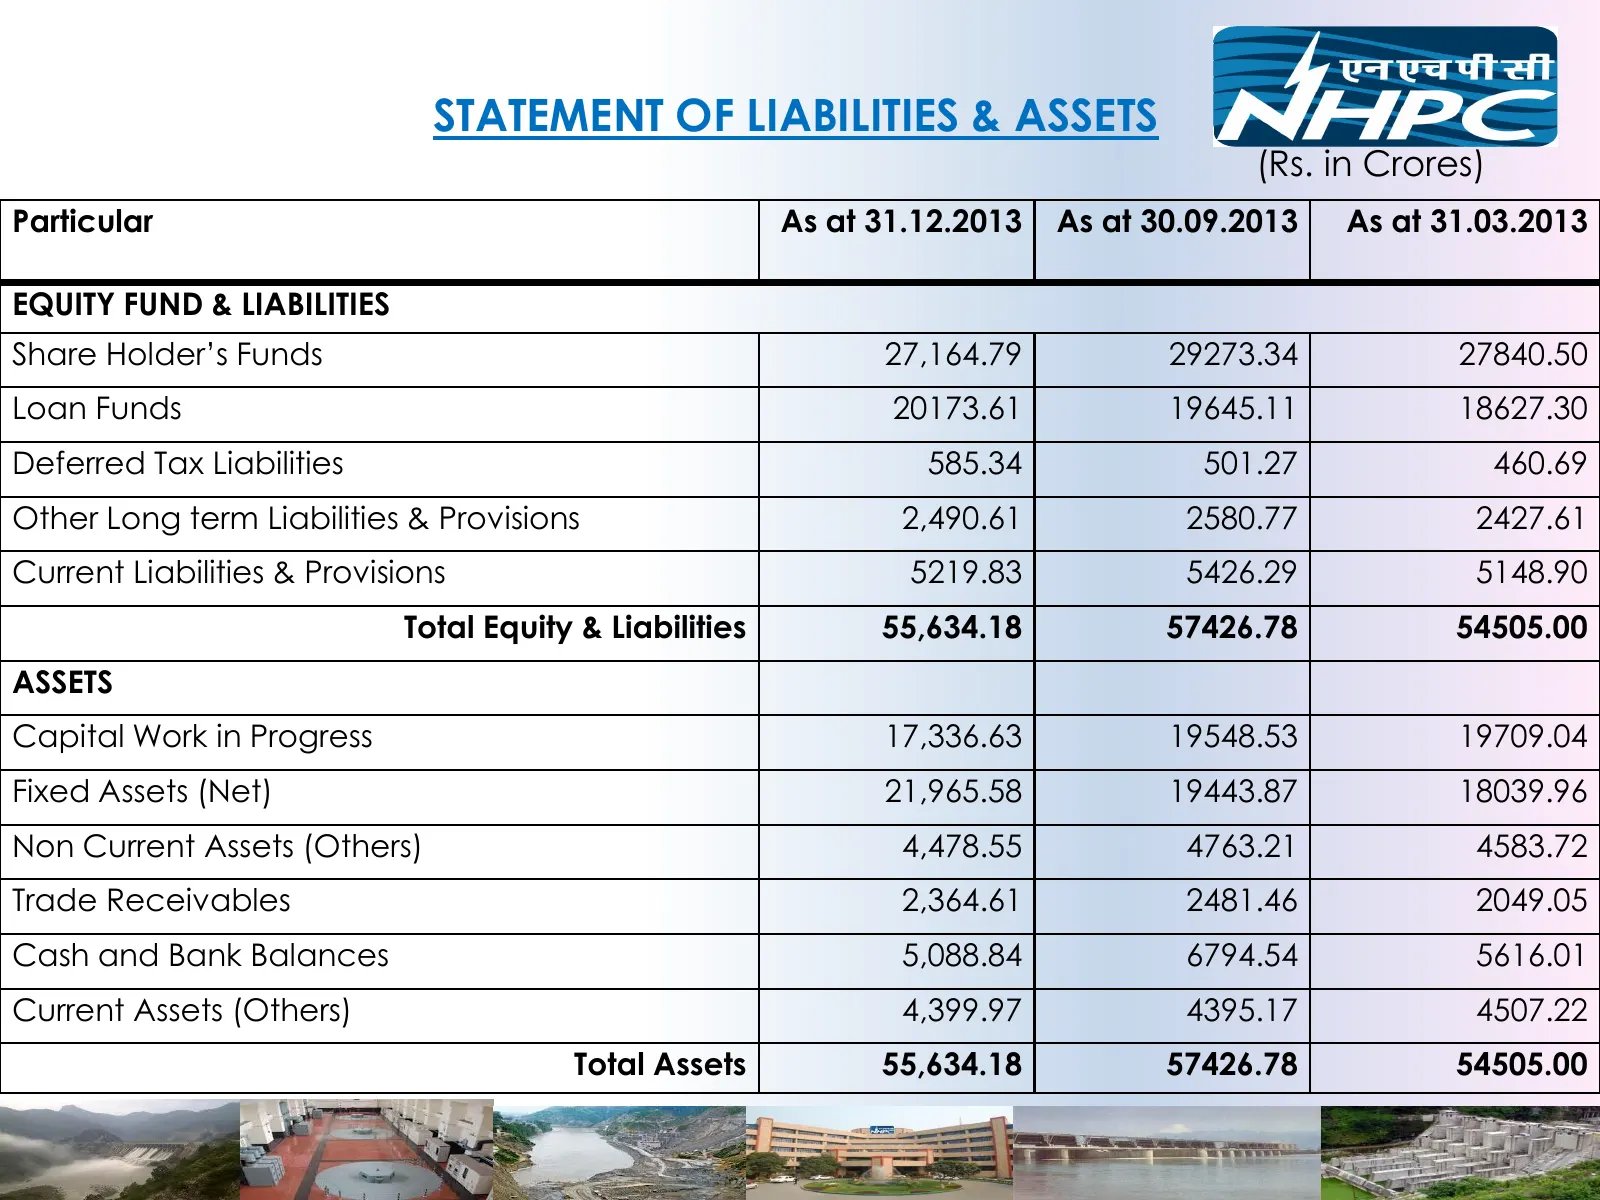
Slide 22: Statement of Liabilities & Assets
STATEMENT OF LIABILITIES & ASSETS (Rs. in Crores) Particular As at 31.12.2013 As at 30.09.2013 As at 31.03.2013 EQUITY FUND & LIABILITIES Share Holder’s Funds 27,164.79 29273.34 27840.50 Loan Funds 20173.61 19645.11 18627.30 Deferred Tax Liabilities 585.34 501.27 460.69 Other Long term Liabilities &
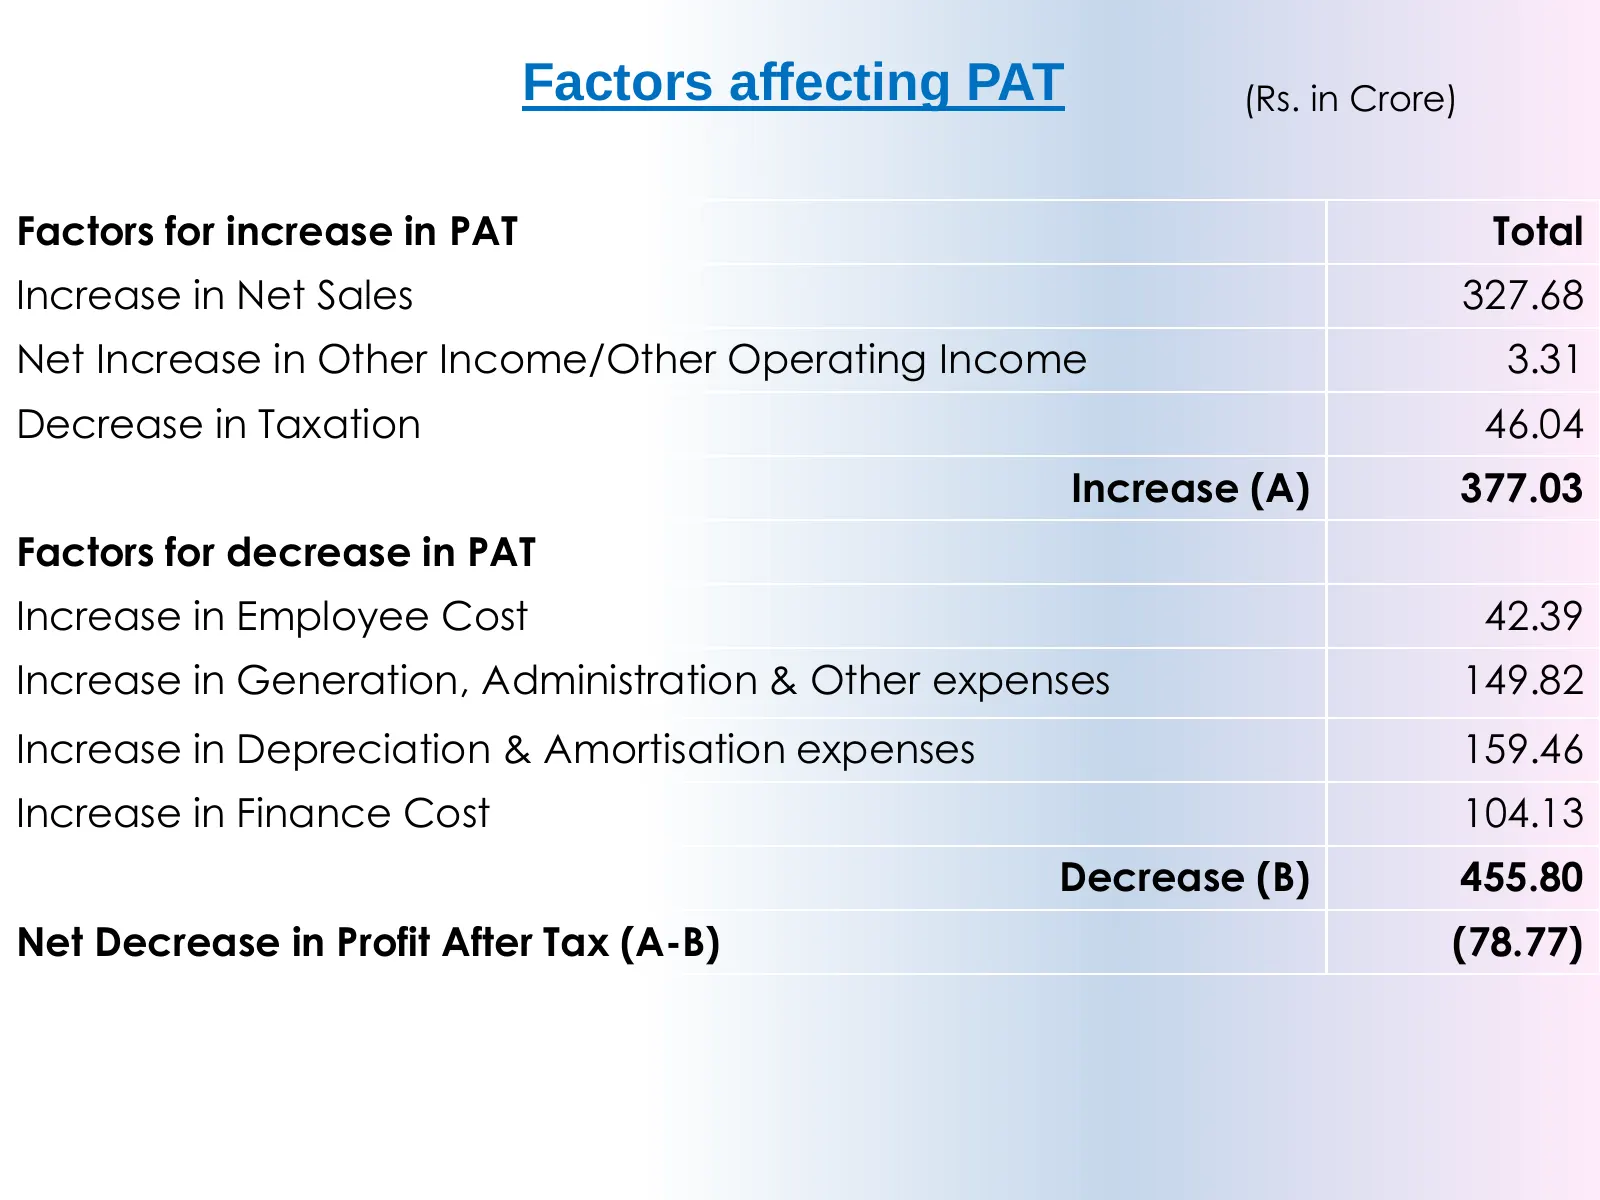
Slide 23: Factors affecting PAT
Factors affecting PAT (Rs. in Crore) Factors for increase in PAT Total Increase in Net Sales 327.68 Net Increase in Other Income/Other Operating Income 3.31 Decrease in Taxation 46.04 Increase (A) 377.03 Factors for decrease in PAT Increase in Employee Cost 42.39 Increase in Generation, Administrati
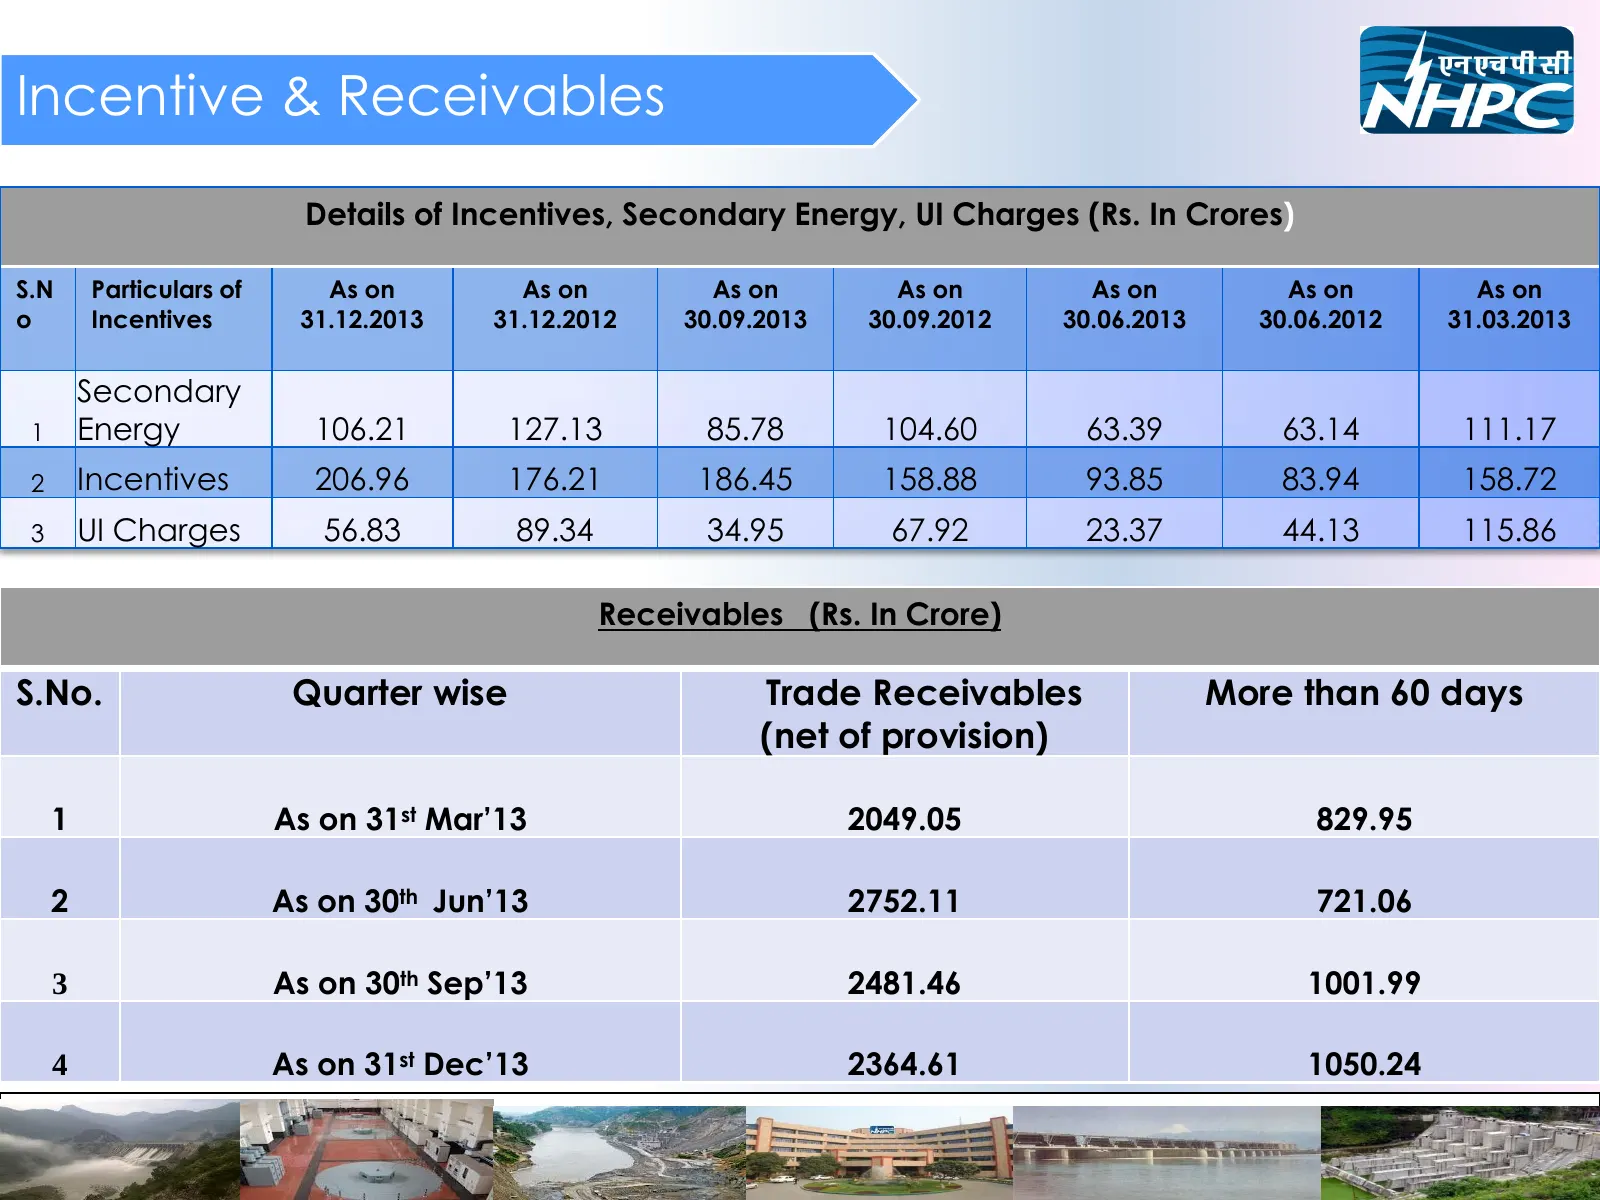
Slide 24: Incentive & Receivables
Incentive & Receivables Details of Incentives, Secondary Energy, UI Charges (Rs. In Crores) S.N Particulars of As on As on As on As on As on As on As on o Incentives 31.12.2013 31.12.2012 30.09.2013 30.09.2012 30.06.2013 30.06.2012 31.03.2013 Secondary 1 Energy 106.21 127.13 85.78 104.60 63.39 63.14
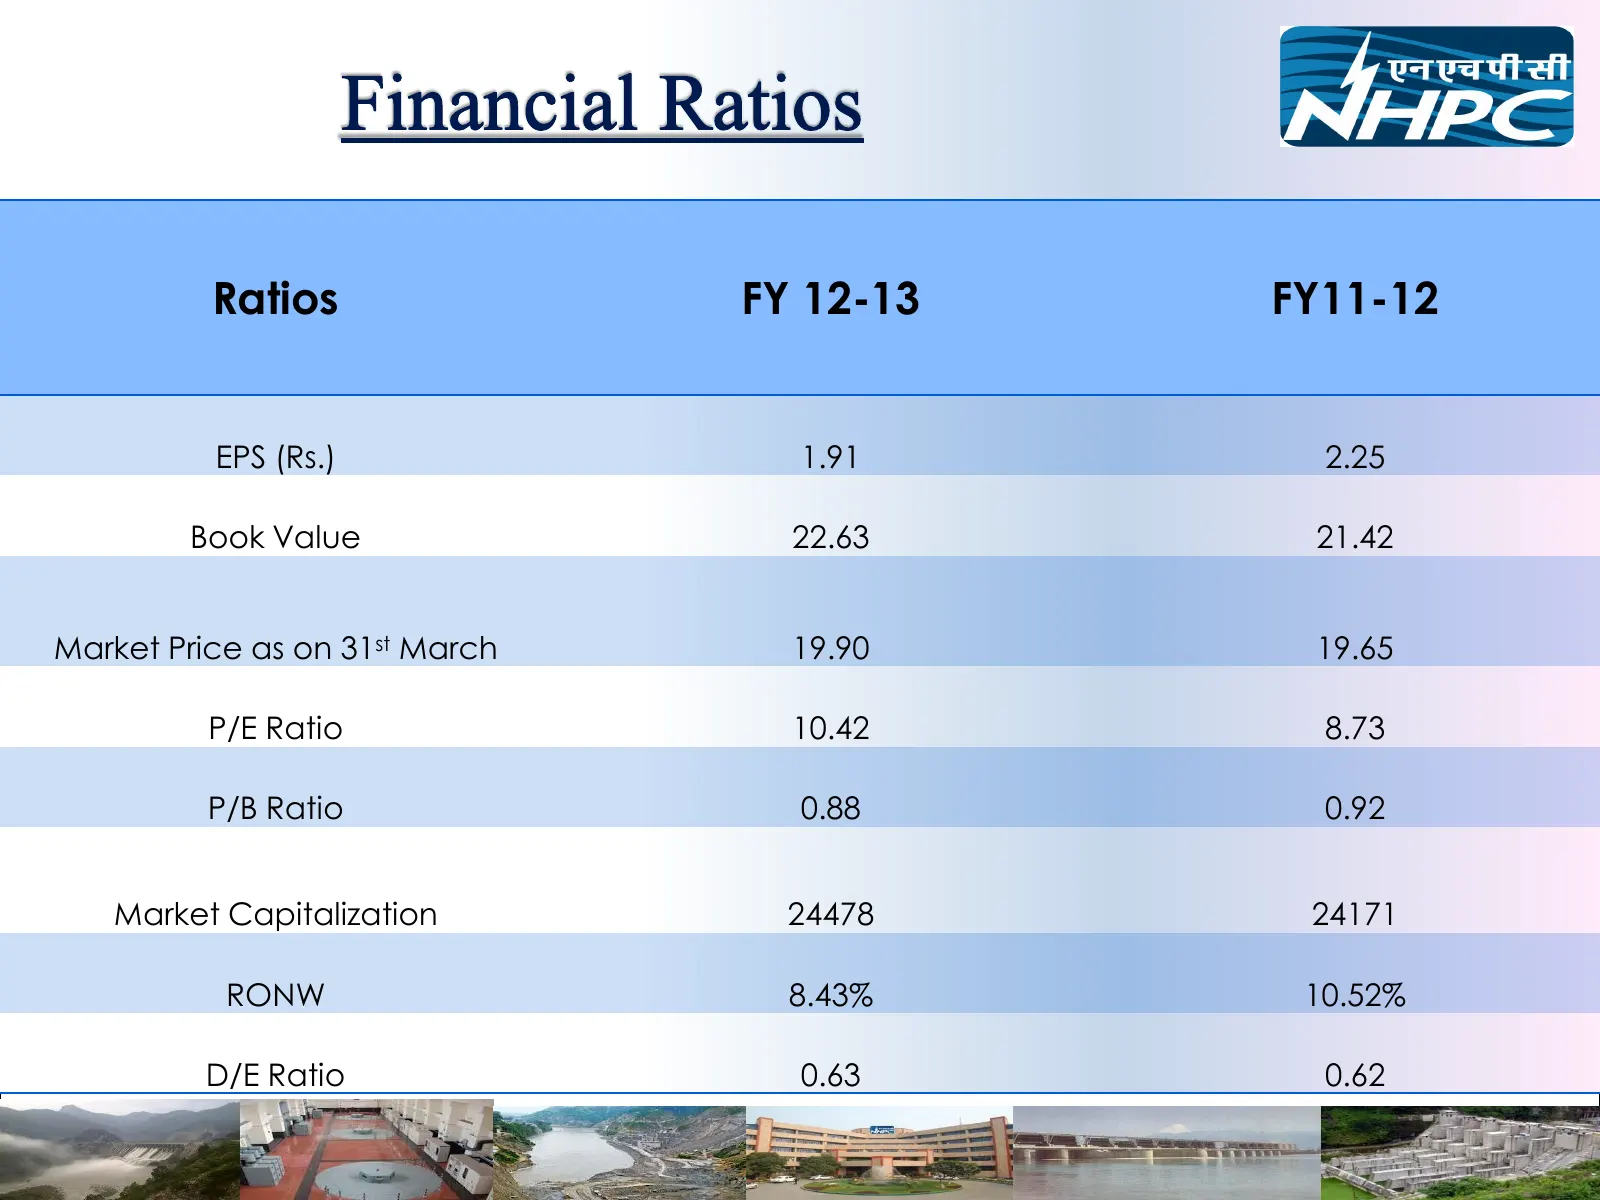
Slide 25: Ratios FY 12-13 FY11-12
Ratios FY 12-13 FY11-12 EPS (Rs.) 1.91 2.25 Book Value 22.63 21.42 Market Price as on 31st March 19.90 19.65 P/E Ratio 10.42 8.73 P/B Ratio 0.88 0.92 Market Capitalization 24478 24171 RONW 8.43% 10.52% D/E Ratio 0.63 0.62

Slide 26: Thanks
Thanks
Source: Internet Archive copy of nhpcindia.com
More decks from NHPC Limited
 Investor Presentation (June 2026)49 slides · June 2026
 Investor Presentation (March 2026)48 slides · March 2026
 Investor Presentation (December 2025)49 slides · December 2025
 Investor Presentation (September 2025)49 slides · September 2025
 Investor Presentation (June 2025)51 slides · June 2025
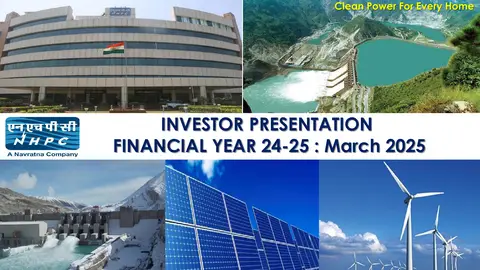 Investor Presentation (May 2025)49 slides · May 2025