Symrise AG · XETR:SY1
Symrise — H1 2020 Earnings Presentation
21 slides from Symrise's earnings presentation, Aug 6, 2020
Slide 1: Financial Results H1 2020
Financial Results H1 2020 Dr. Heinz-Jürgen Bertram (CEO), Olaf Klinger (CFO) – Holzminden, August 6, 2020
Slide 2: Agenda
Agenda Results H1 2020 — 1 Business development H1 2020 (Heinz-Jürgen Bertram, CEO) 2 Financials in detail (Olaf Klinger, CFO) 3 Outlook and long-term objectives (Heinz-Jürgen Bertram, CEO) — 2
Slide 3: 1 Business development H1 2020
1 Business development H1 2020 Heinz-Jürgen Bertram, CEO 3
Slide 4: Financial Highlights H1 2020
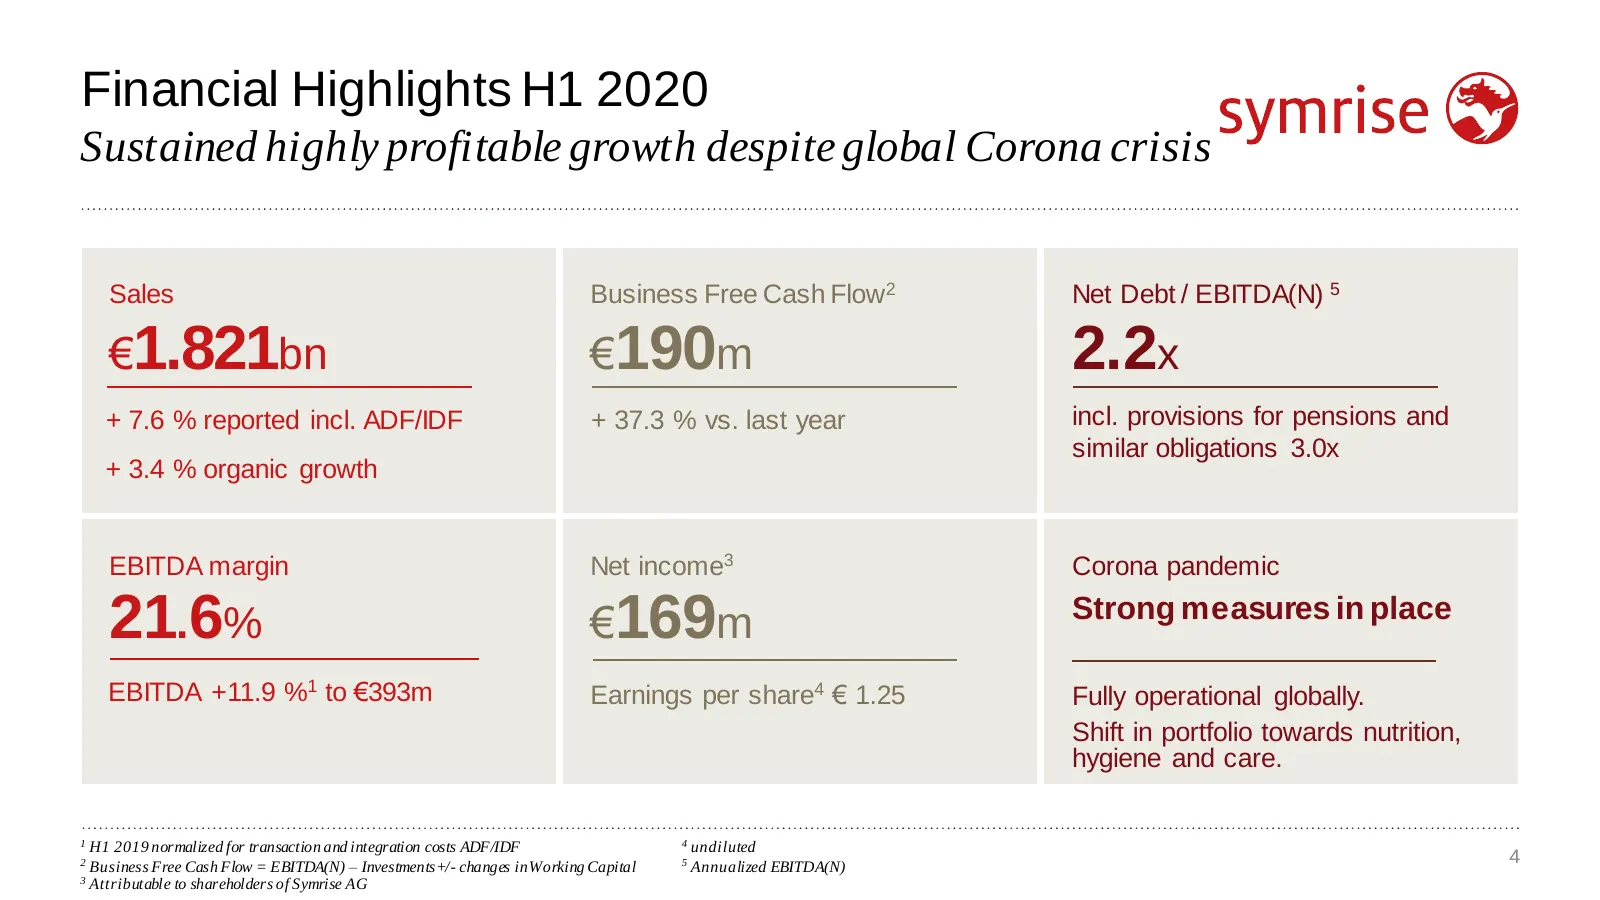
Financial Highlights H1 2020 Sustained highly profitable growth despite global Corona crisis Sales Business Free Cash Flow2 Net Debt / EBITDA(N) 5 €1.821bn €190m 2.2x + 7.6 % reported incl. ADF/IDF + 37.3 % vs. last year incl. provisions for pensions and similar obligations 3.0x + 3.4 % organic grow
Slide 5: Sales H1 2020
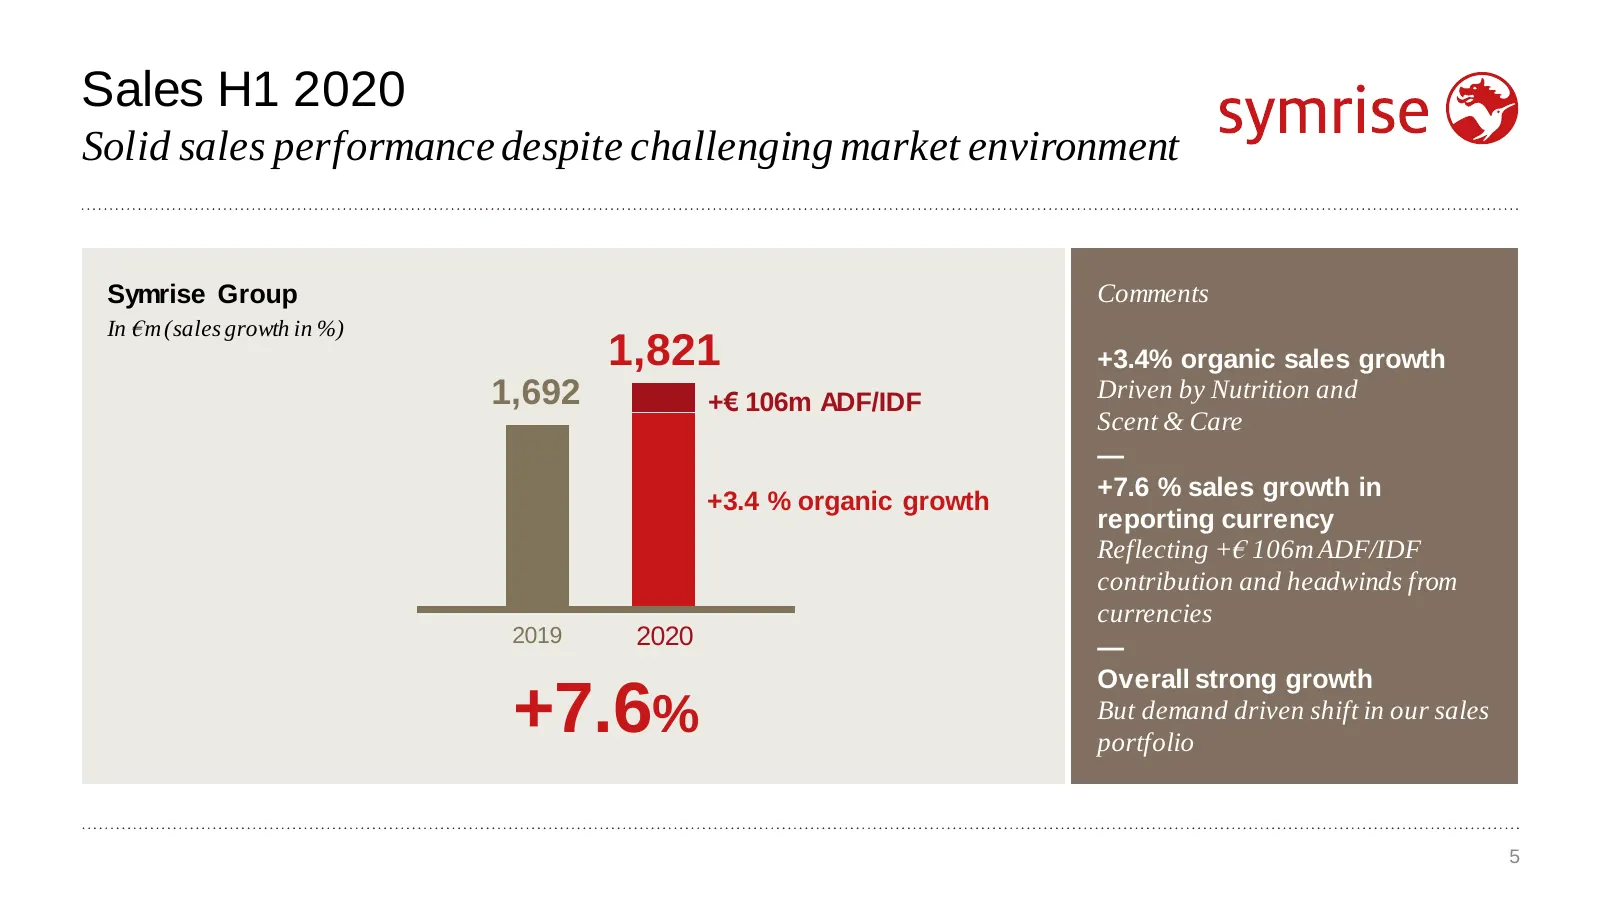
Sales H1 2020 Solid sales performance despite challenging market environment Symrise Group Comments In €m (sales growth in %) 1,821 +3.4% organic sales growth 1,692 +€ 106m ADF/IDF Driven by Nutrition and Scent & Care — +7.6 % sales growth in +3.4 % organic growth reporting currency Reflecting +€ 10
Slide 6: Sales by segment in H1 2020
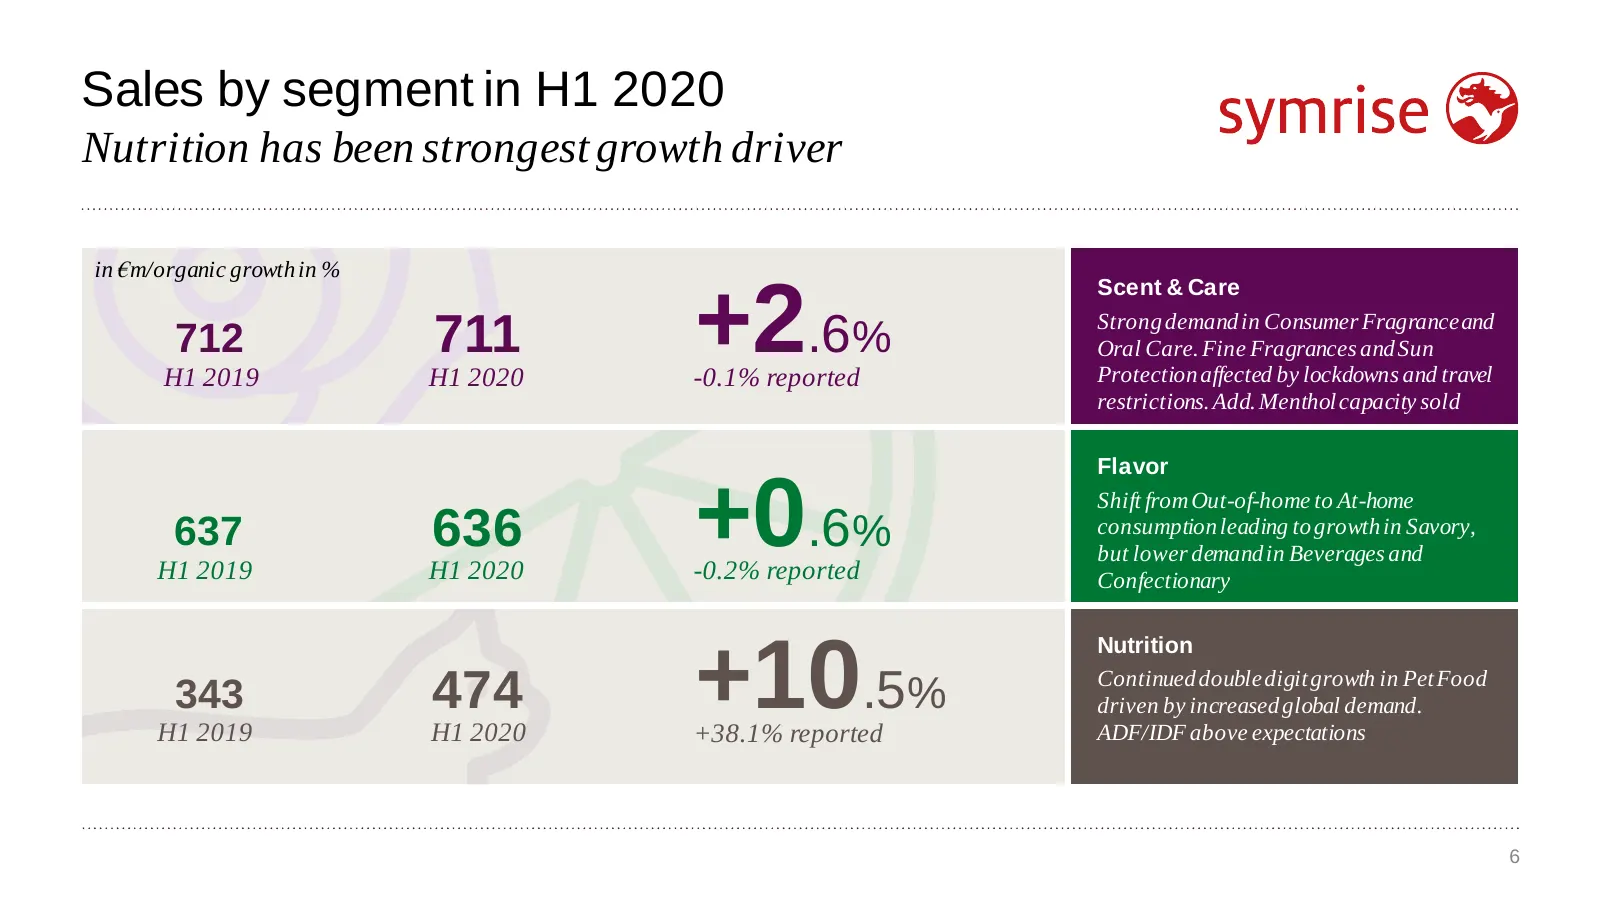
Sales by segment in H1 2020 Nutrition has been strongest growth driver in €m/organic growth in % Scent & Care 712 H1 2019 711 H1 2020 +2.6% -0.1% reported Strong demand in Consumer Fragrance and Oral Care. Fine Fragrances and Sun Protection affected by lockdowns and travel restrictions. Add. Menthol
Slide 7: Shift in portfolio due to Corona crisis
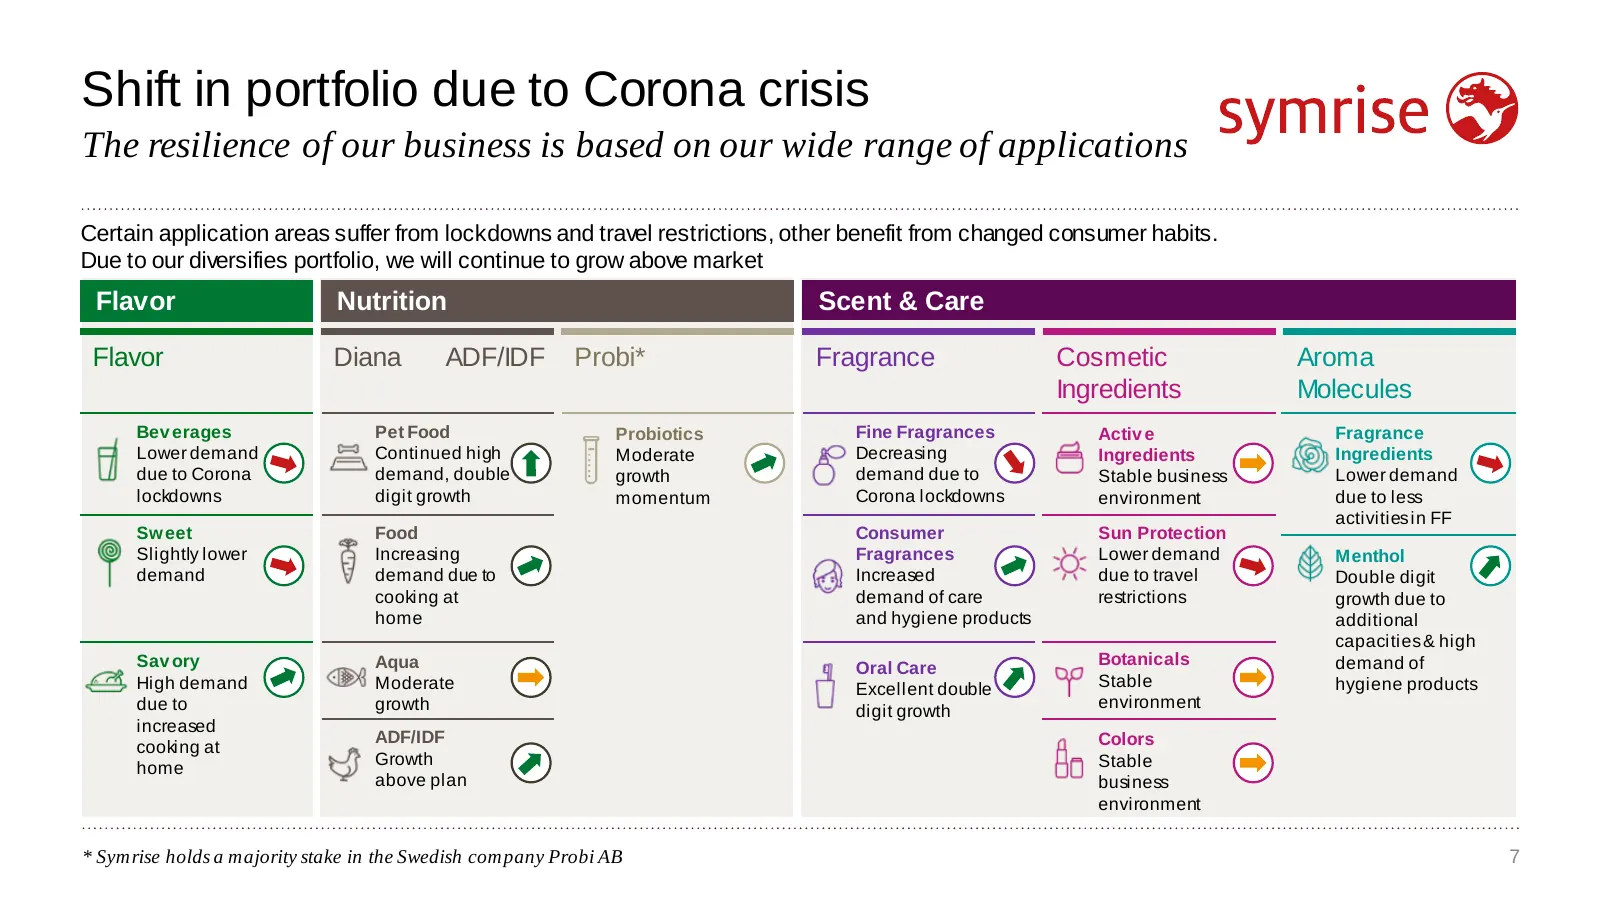
Shift in portfolio due to Corona crisis The resilience of our business is based on our wide range of applications Certain application areas suffer from lockdowns and travel restrictions, other benefit from changed consumer habits. Due to our diversifies portfolio, we will continue to grow above mark
Slide 8: 2 Financials in detail
2 Financials in detail Olaf Klinger, CFO 8
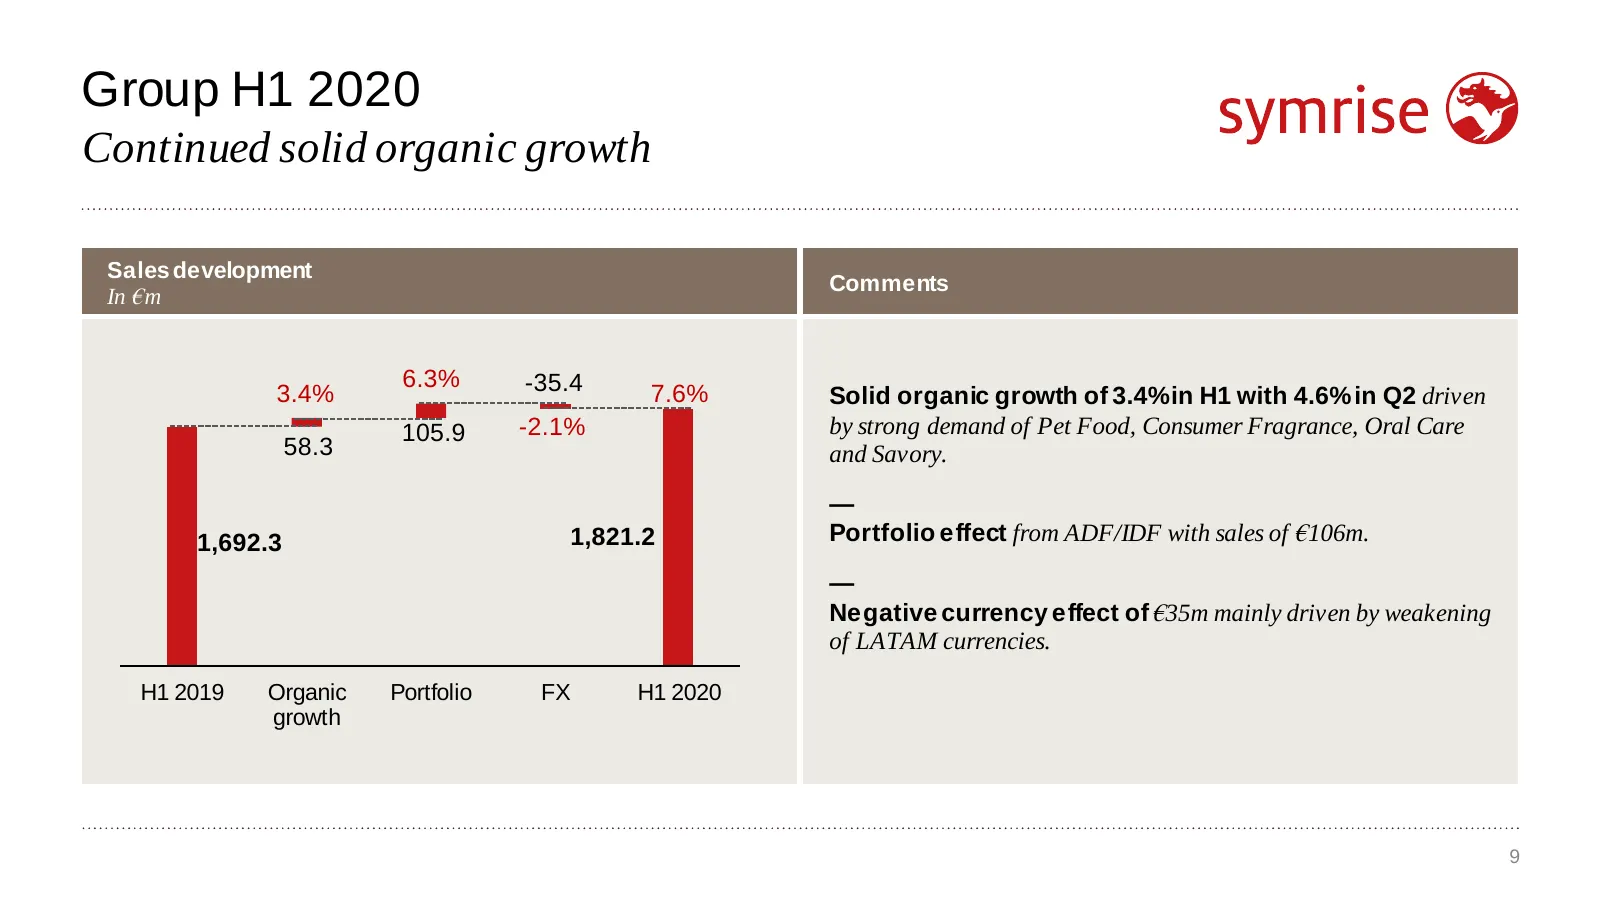
Slide 9: Group H1 2020: Continued solid organic growth
Group H1 2020 Continued solid organic growth Sales development Comments In €m 6.3% -35.4 3.4% 7.6% Solid organic growth of 3.4% in H1 with 4.6% in Q2 driven 105.9 -2.1% by strong demand of Pet Food, Consumer Fragrance, Oral Care 58.3 and Savory. — 1,692.3 1,821.2 Portfolio effect from ADF/IDF with s
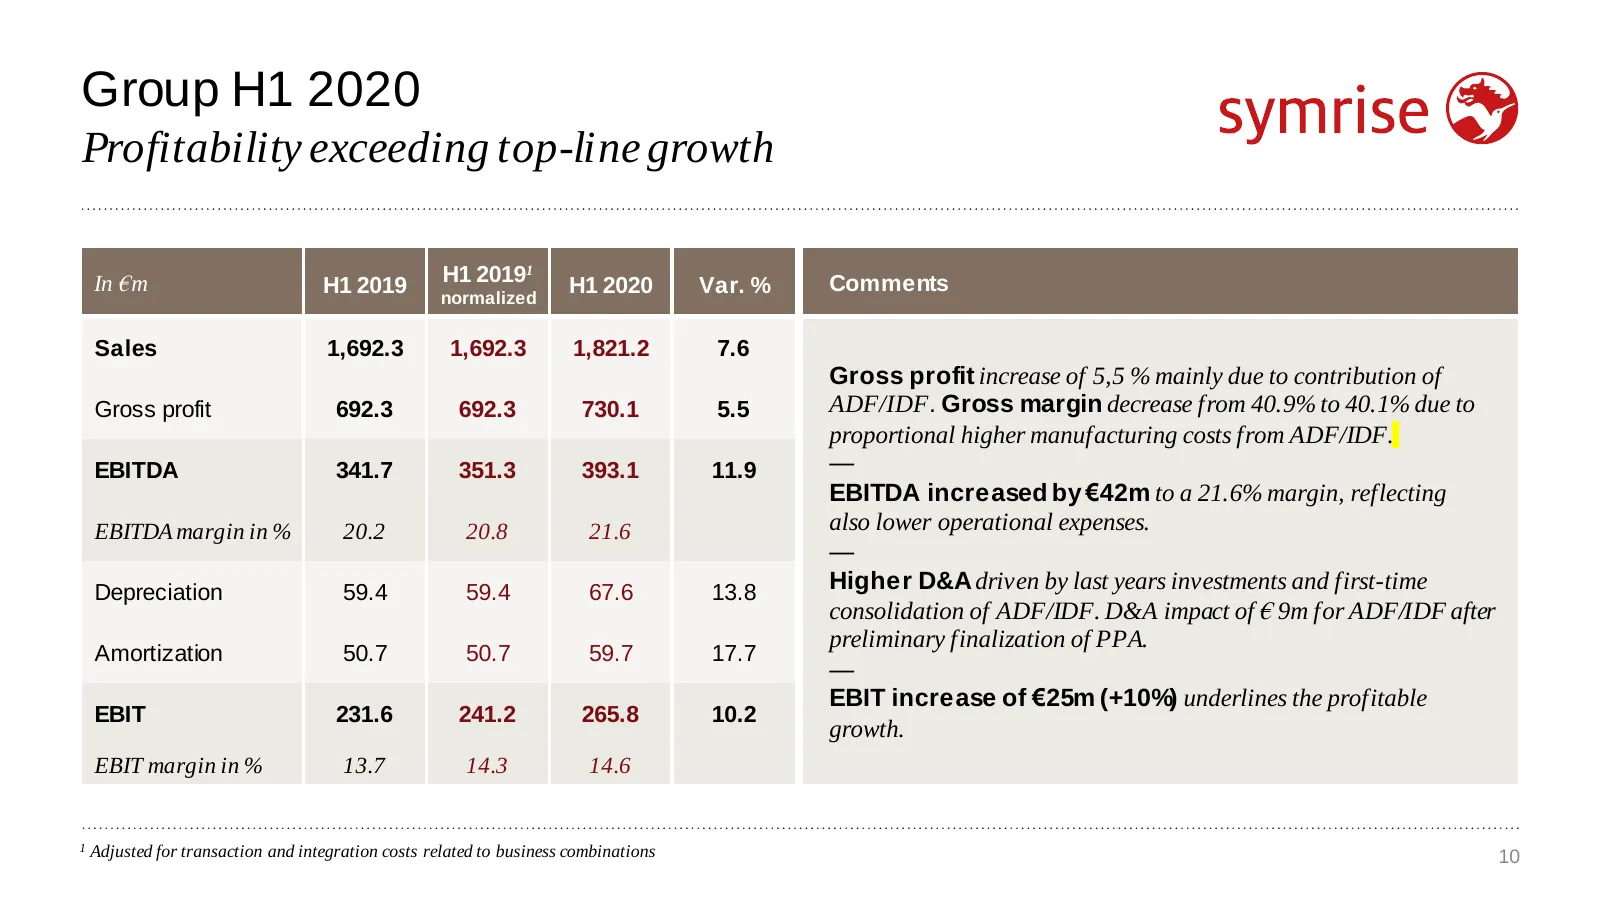
Slide 10: Group H1 2020: Profitability exceeding top-line growth
Group H1 2020 Profitability exceeding top-line growth In €m H1 2019 H1 20191 H1 2020 Var. % Comments normalized Sales 1,692.3 1,692.3 1,821.2 7.6 Gross profit increase of 5,5 % mainly due to contribution of Gross profit 692.3 692.3 730.1 5.5 ADF/IDF. Gross margin decrease from 40.9% to 40.1% due to
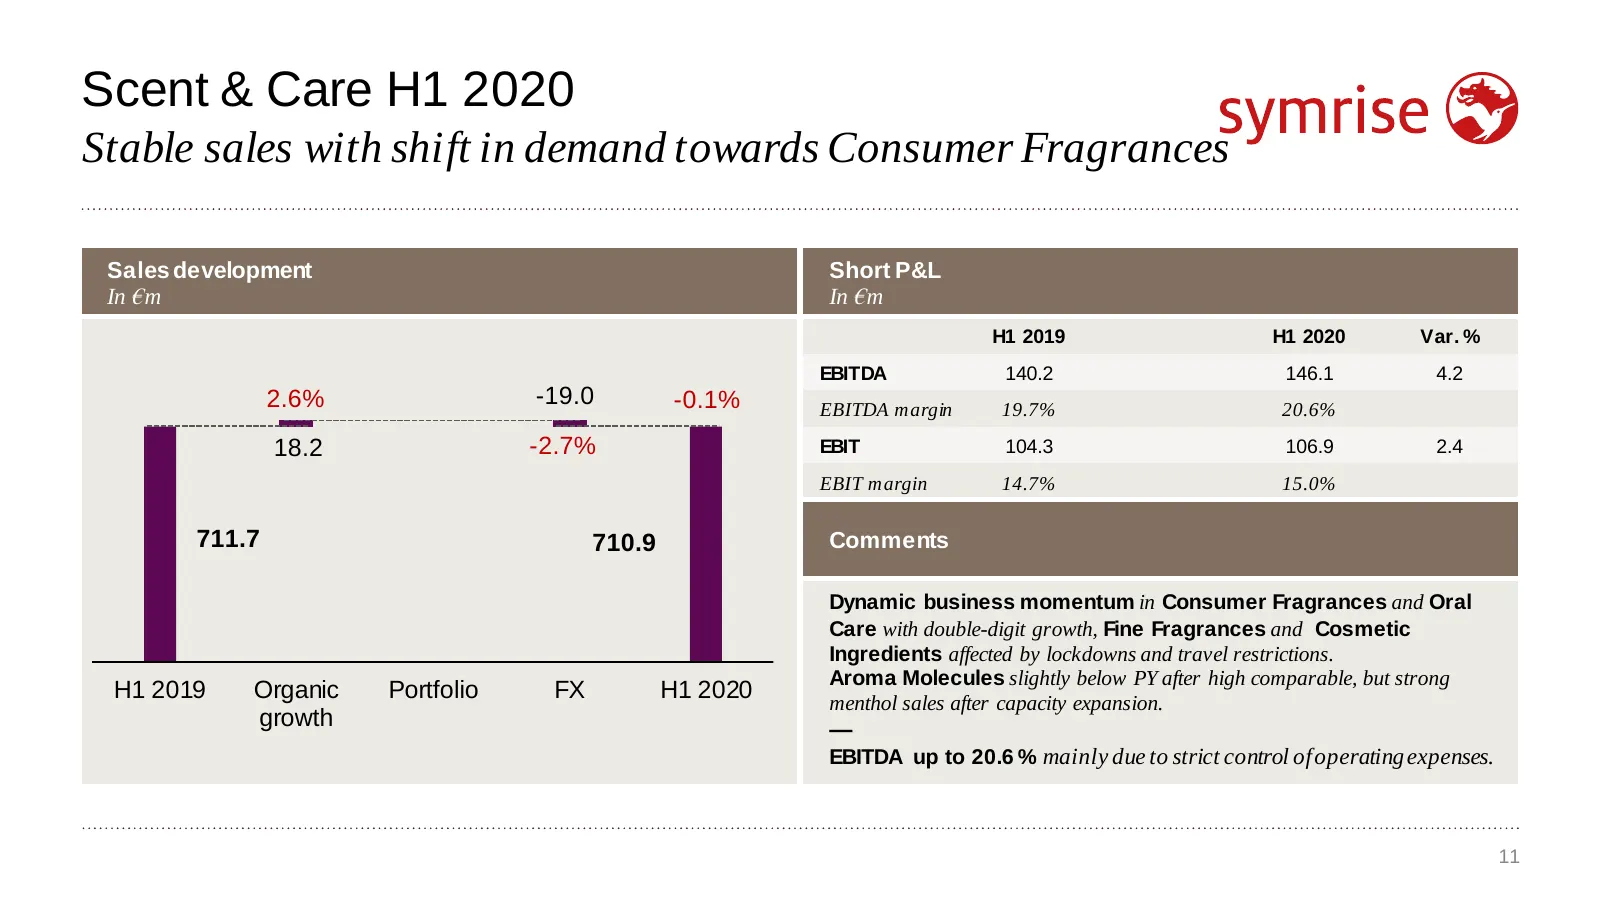
Slide 11: Scent & Care H1 2020
Scent & Care H1 2020 Stable sales with shift in demand towards Consumer Fragrances Sales development Short P&L In €m In €m H1 2019 H1 2020 Var. % EBITDA 140.2 146.1 4.2 2.6% -19.0 -0.1% EBITDA margin 19.7% 20.6% 18.2 -2.7% EBIT 104.3 106.9 2.4 EBIT margin 14.7% 15.0% 711.7 710.9 Comments Dynamic bus
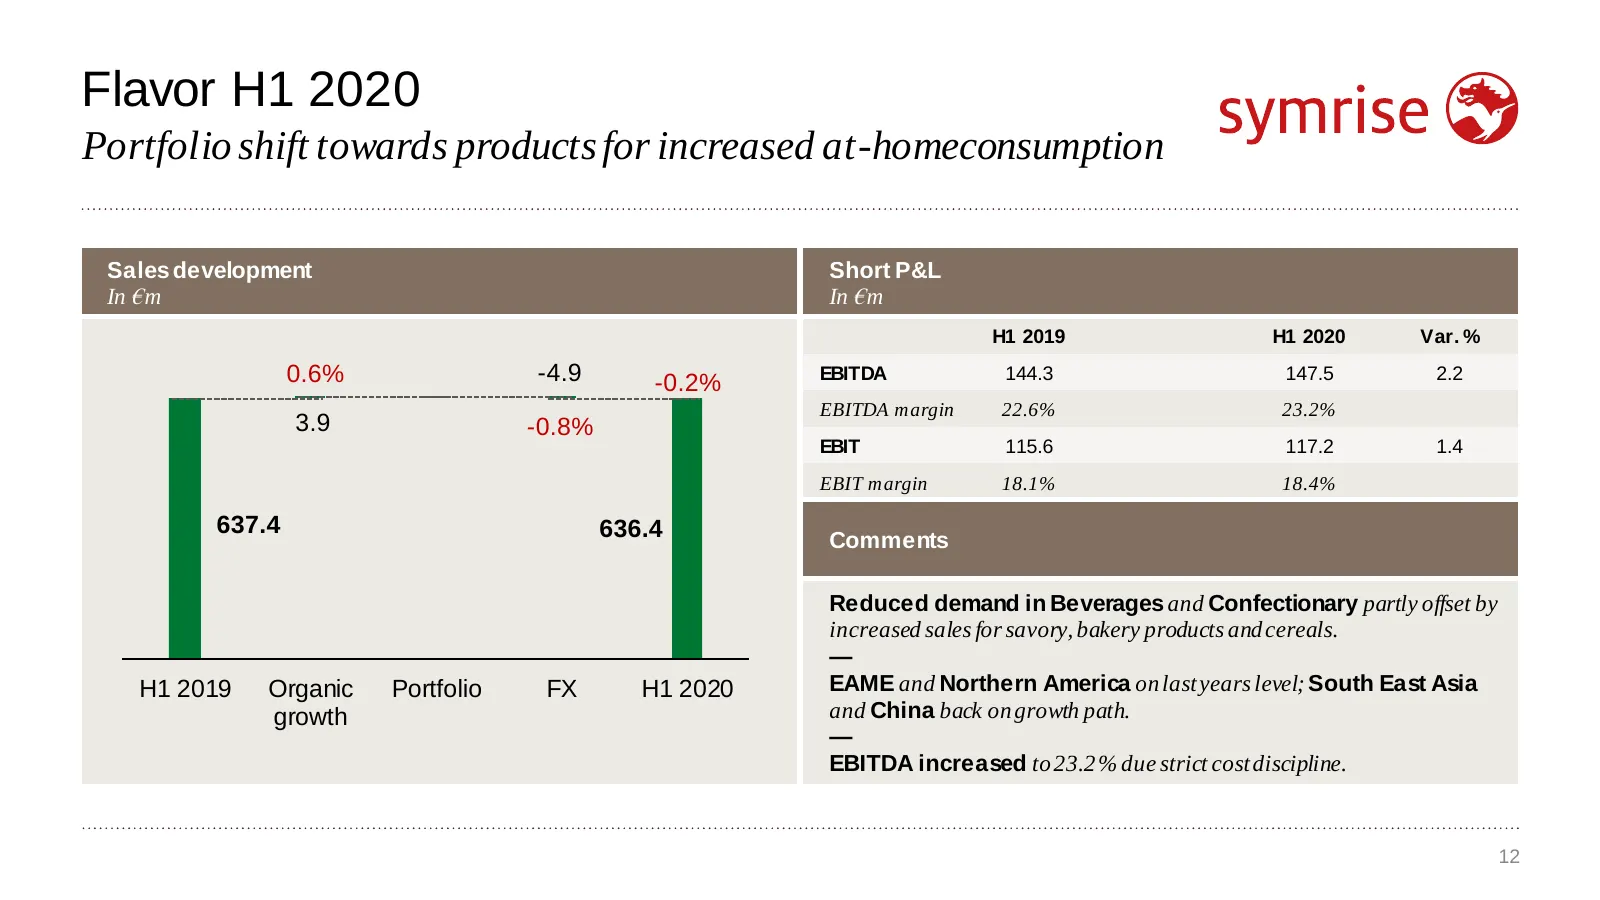
Slide 12: Flavor H1 2020
Flavor H1 2020 Portfolio shift towards products for increased at-homeconsumption Sales development Short P&L In €m In €m H1 2019 H1 2020 Var. % 0.6% -4.9 -0.2% EBITDA 144.3 147.5 2.2 EBITDA margin 22.6% 23.2% 3.9 -0.8% EBIT 115.6 117.2 1.4 EBIT margin 18.1% 18.4% 637.4 636.4 Comments Reduced demand
Slide 13: Nutrition H1 2020
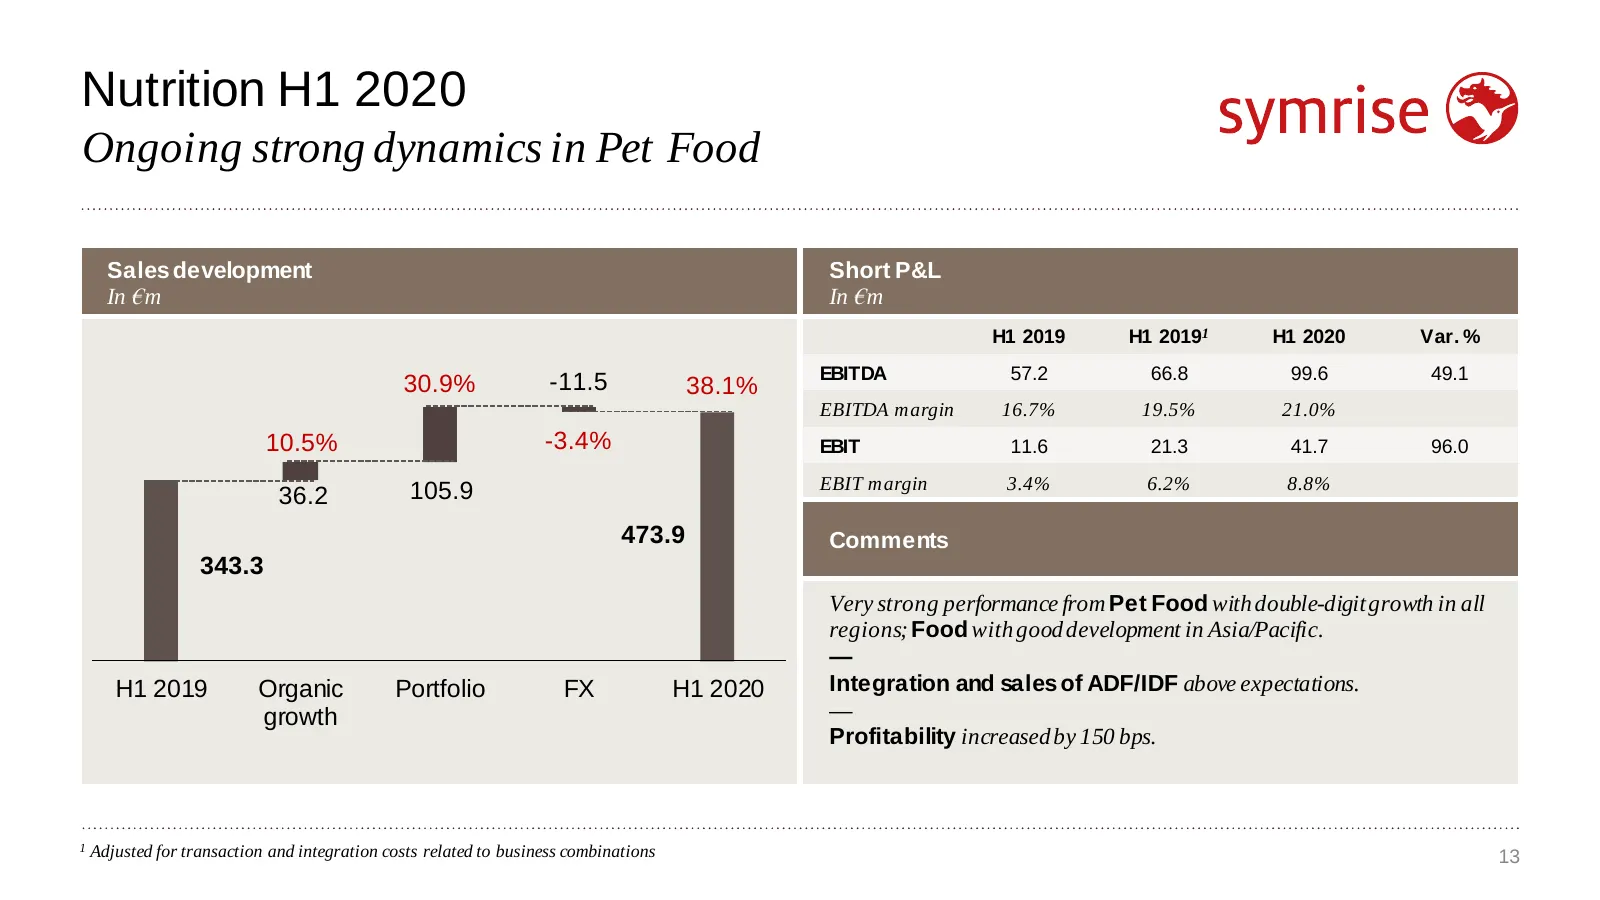
Nutrition H1 2020 Ongoing strong dynamics in Pet Food Sales development Short P&L In €m In €m H1 2019 H1 20191 H1 2020 Var. % EBITDA 57.2 66.8 99.6 49.1 30.9% -11.5 38.1% EBITDA margin 16.7% 19.5% 21.0% 10.5% -3.4% EBIT 11.6 21.3 41.7 96.0 105.9 EBIT margin 3.4% 6.2% 8.8% 36.2 473.9 Comments 343.3 V
Slide 14: Earnings Per Share H1 2020
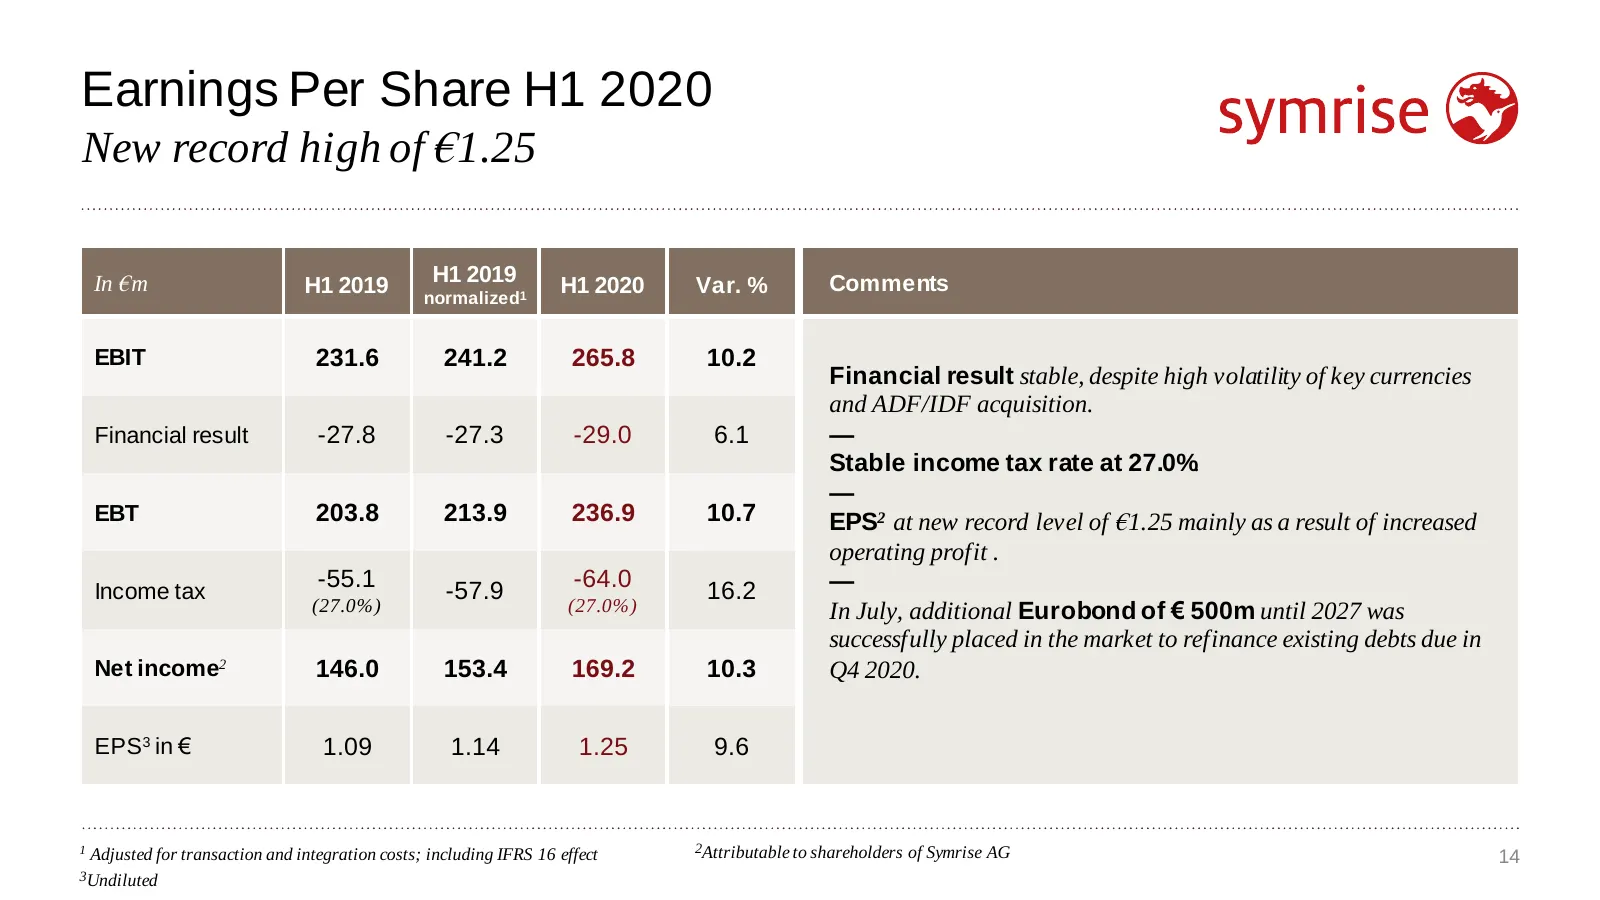
Earnings Per Share H1 2020 New record high of €1.25 In €m H1 2019 H1 2019 H1 2020 Var. % Comments normalized1 EBIT 231.6 241.2 265.8 10.2 Financial result stable, despite high volatility of key currencies and ADF/IDF acquisition. Financial result -27.8 -27.3 -29.0 6.1 — Stable income tax rate at 27.
Slide 15: Business Free Cash Flow (BFCF)
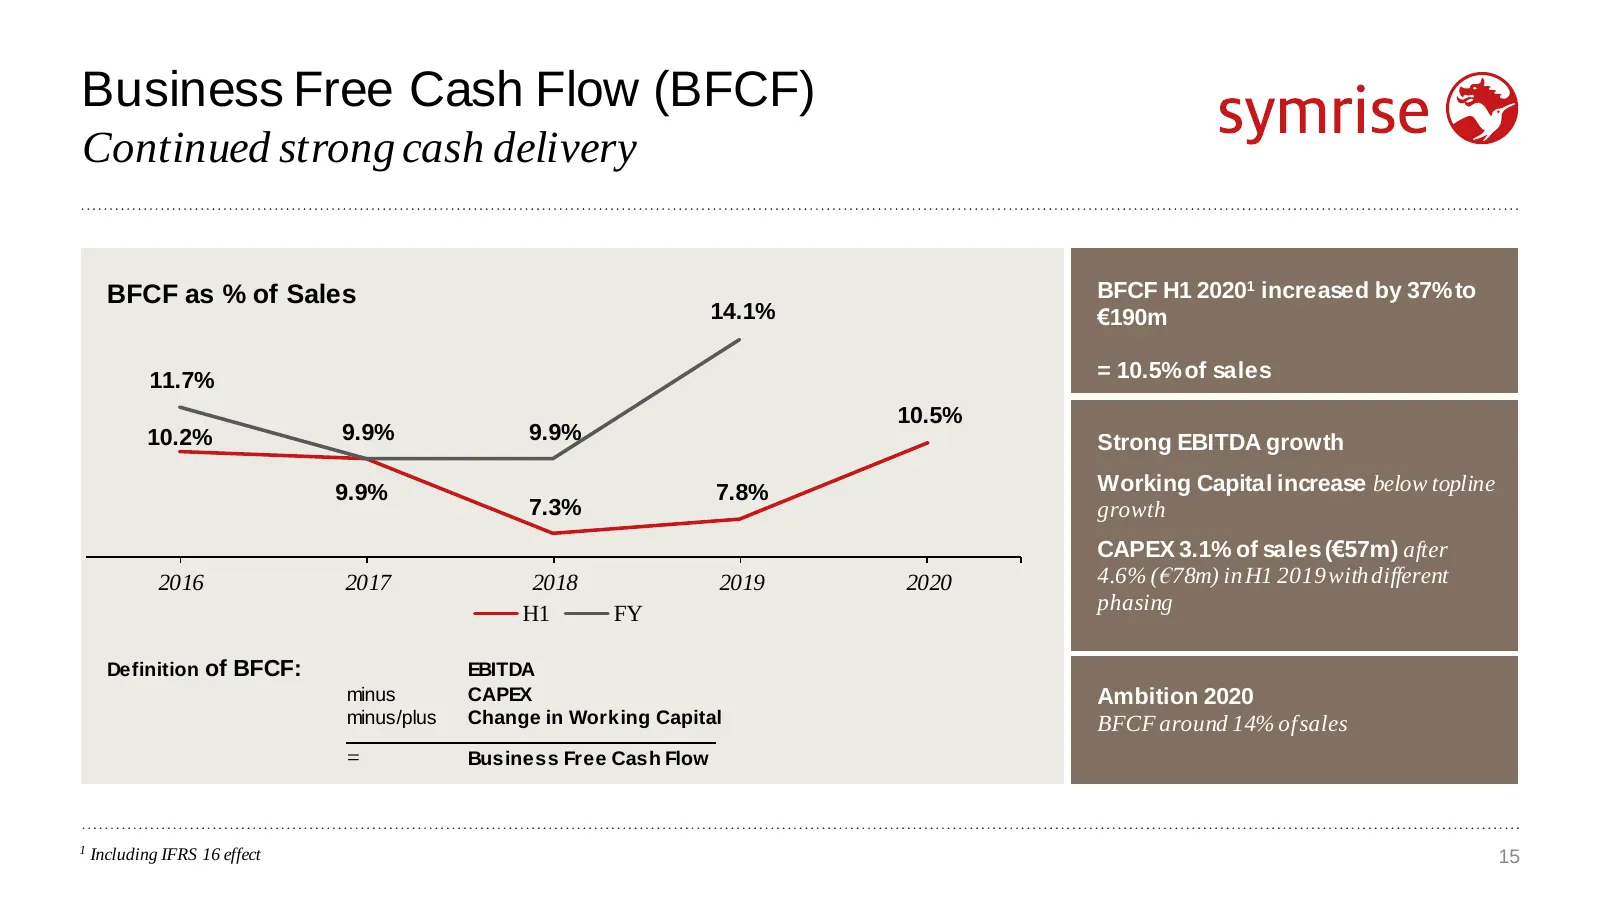
Business Free Cash Flow (BFCF) Continued strong cash delivery BFCF as % of Sales BFCF H1 20201 increased by 37% to 14.1% €190m 11.7% = 10.5% of sales 10.5% 10.2% 9.9% 9.9% Strong EBITDA growth 9.9% 7.8% Working Capital increase below topline 7.3% growth CAPEX 3.1% of sales (€57m) after 2016 2017 201
Slide 16: Balance Sheet
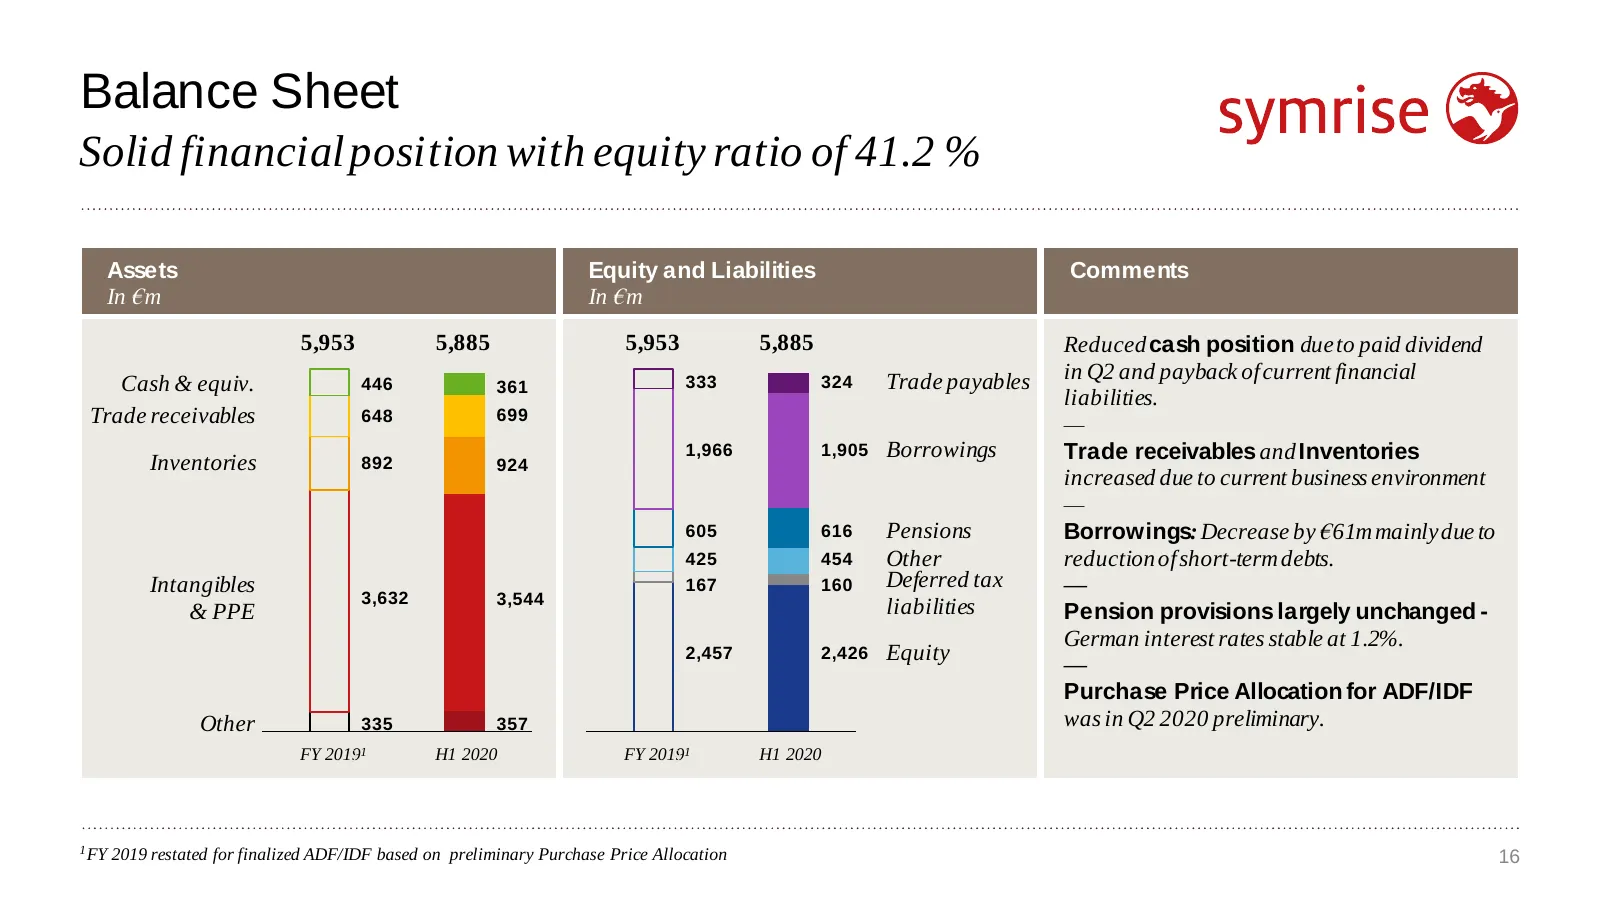
Balance Sheet Solid financial position with equity ratio of 41.2 % Assets Equity and Liabilities Comments In €m In €m 5,953 5,885 5,953 5,885 Reduced cash position due to paid dividend Trade payables in Q2 and payback of current financial Cash & equiv. 446 361 333 324 liabilities. Trade receivables
Slide 17: Net Debt Development
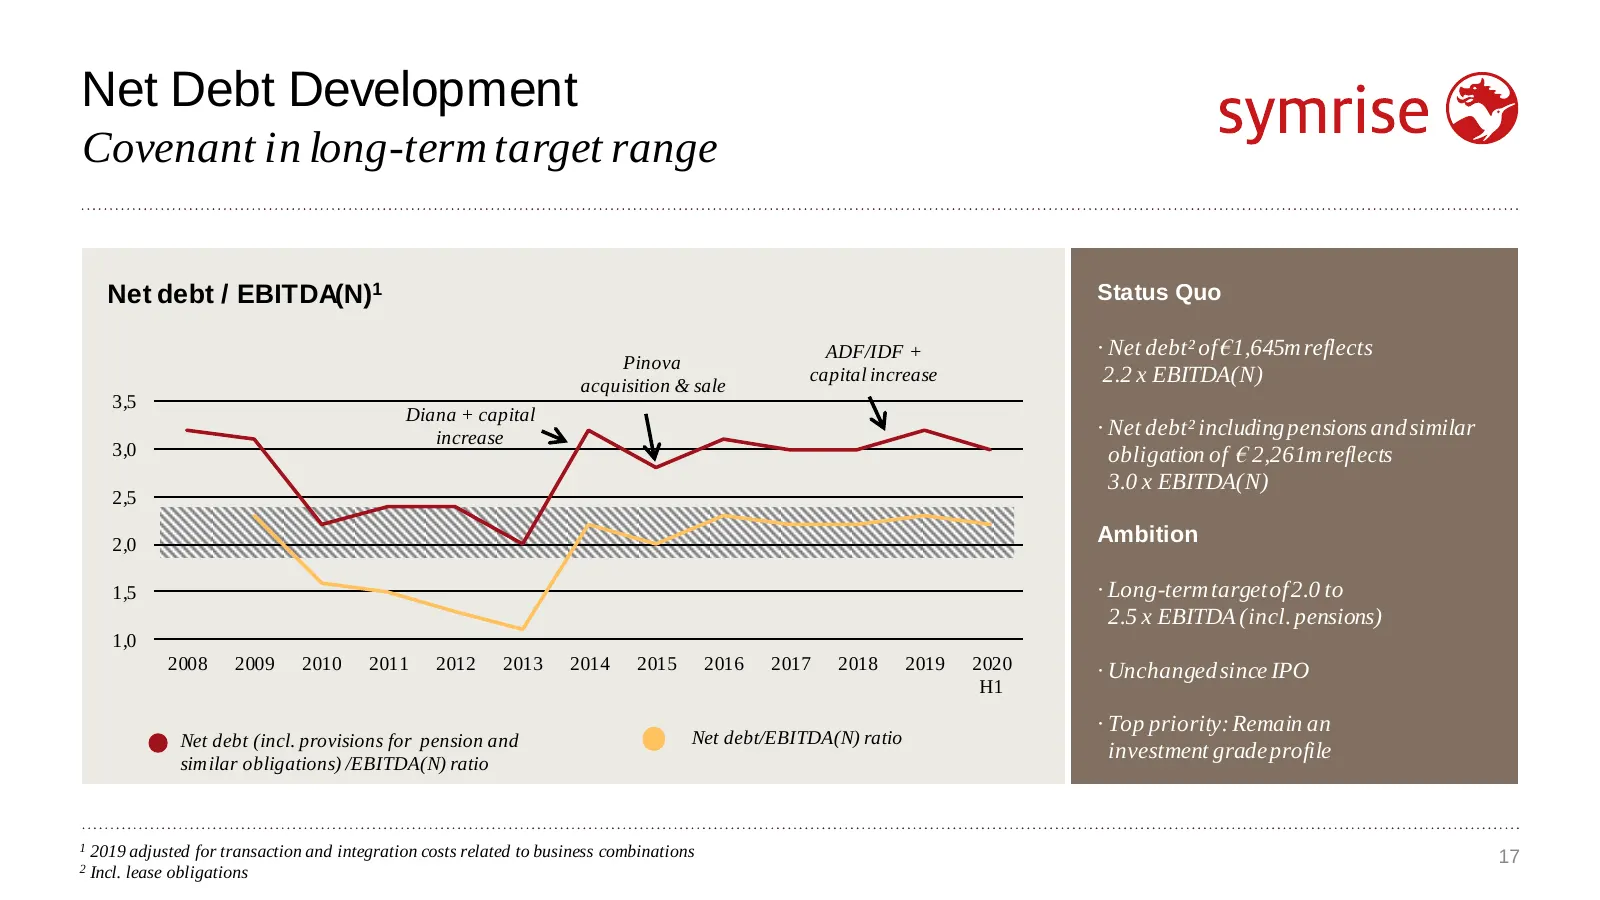
Net Debt Development Covenant in long-term target range Net debt / EBITDA(N)1 Status Quo ADF/IDF + · Net debt² of €1,645m reflects Pinova acquisition & sale capital increase 2.2 x EBITDA(N) 3,5 Diana + capital increase · Net debt² including pensions and similar 3,0 obligation of € 2,261m reflects 3.
Slide 18: 3 Outlook and long-term objectives
3 Outlook and long-term objectives Heinz-Jürgen Bertram 18
Slide 19: Updated outlook 2020
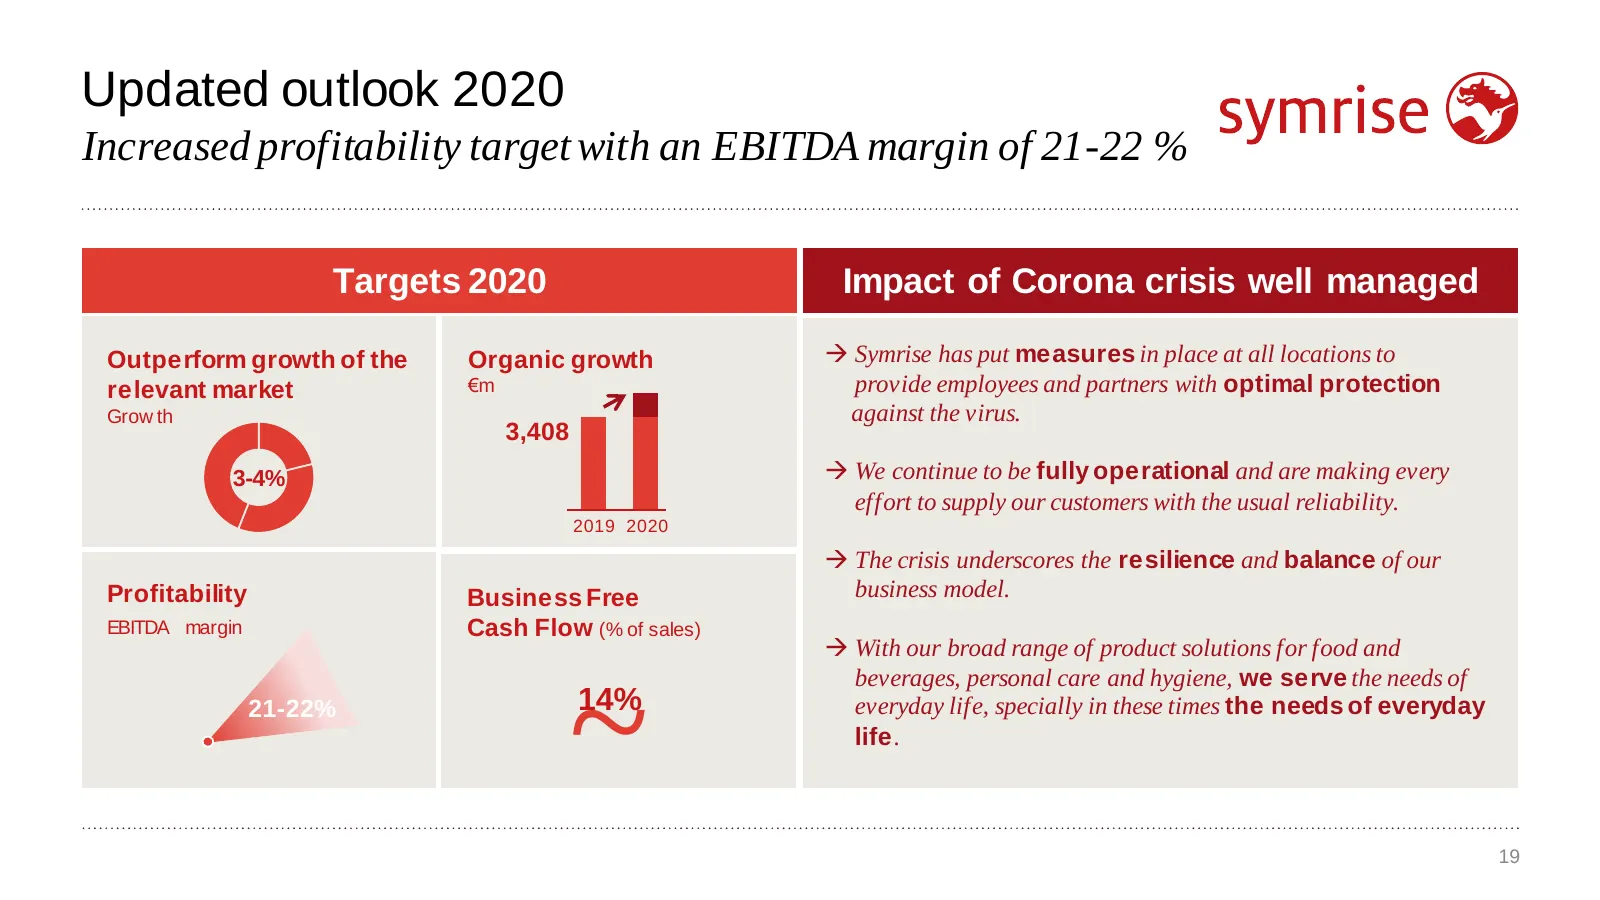
Updated outlook 2020 Increased profitability target with an EBITDA margin of 21-22 % Targets 2020 Impact of Corona crisis well managed Outperform growth of the Organic growth Symrise has put measures in place at all locations to relevant market €m provide employees and partners with optimal protec
Slide 20: Objectives 2025
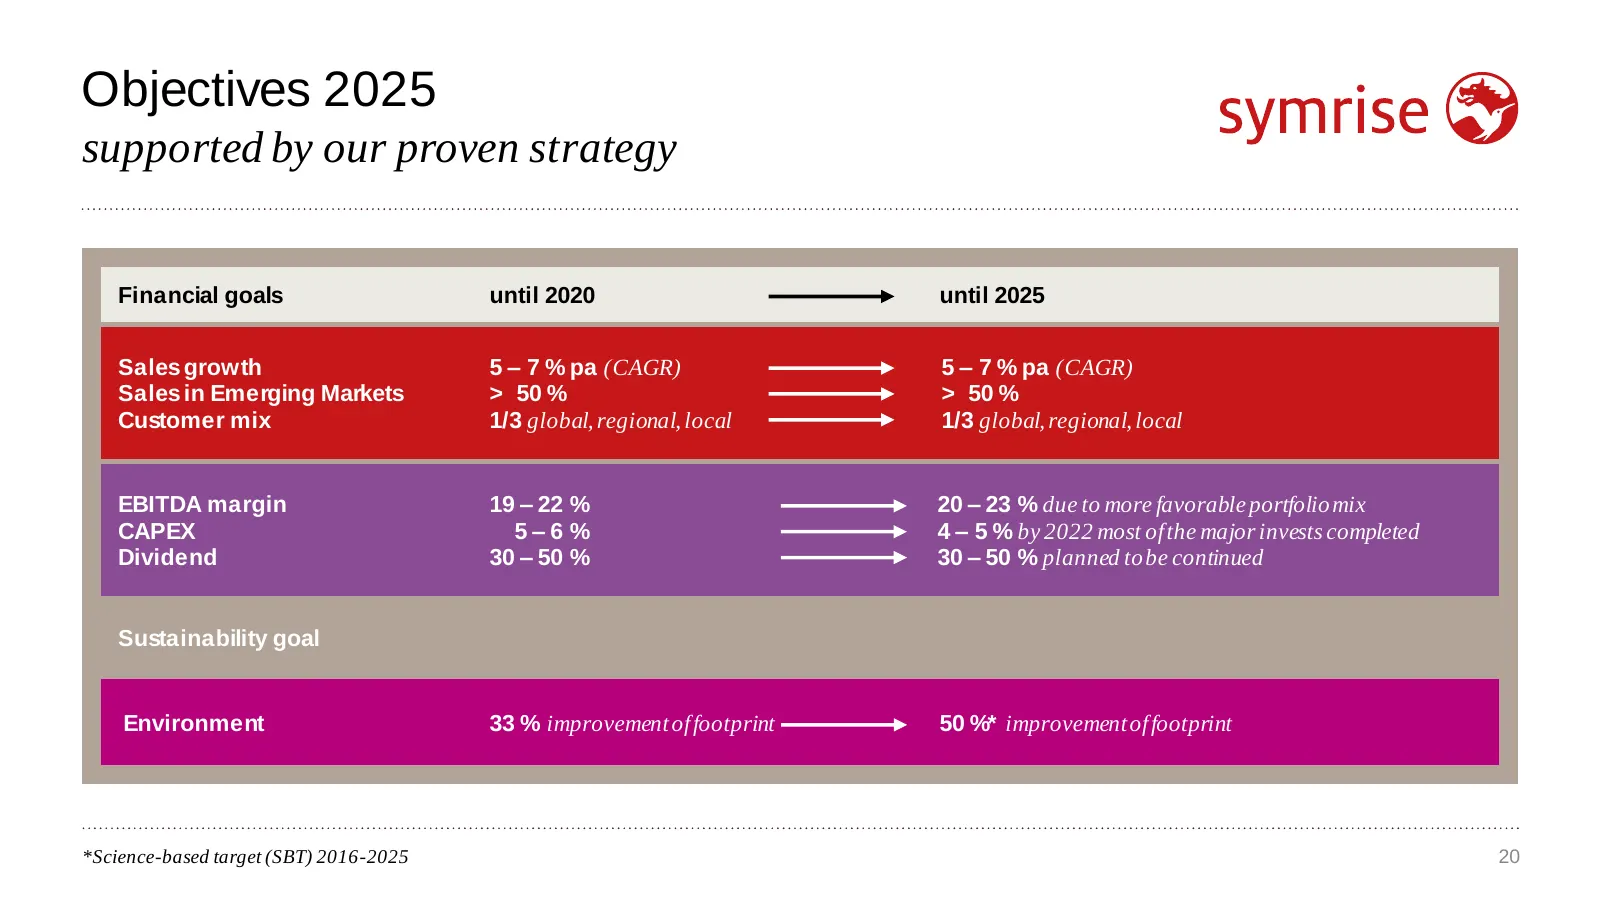
Objectives 2025 supported by our proven strategy Financial goals until 2020 until 2025 Sales growth 5 – 7 % pa (CAGR) 5 – 7 % pa (CAGR) Sales in Emerging Markets > 50 % > 50 % Customer mix 1/3 global, regional, local 1/3 global, regional, local EBITDA margin 19 – 22 % 20 – 23 % due to more favorable
Slide 21: Symrise AG
Symrise AG Financial Calendar 2020 Contacts 29 October Symrise AG 9M 2020 trading statement Mühlenfeldstraße 1 37603 Holzminden, Germany Tobias Erfurth Investor Relations tobias.erfurth@symrise.com Bernhard Kott Corporate Communications and Sustainability bernhard.kott@symrise.com This document cont
Source: Internet Archive copy of symrise.com
More decks from Symrise AG
 Q3 2026 Earnings Presentation22 slides · Oct 28, 2026
 Investor Presentation (October 2026)39 slides · October 2026
 H1 2026 Earnings Presentation25 slides · Jul 30, 2026
 Q2 2026 Earnings Presentation29 slides · Jul 30, 2026
 Shareholder Meeting (May 2026)19 slides · May 6, 2026
 Q1 2026 Earnings Presentation19 slides · Apr 29, 2026