American Airlines Group, Inc. · NASDAQ:AAL
American Airlines — Q4 2023 Earnings Presentation
18 slides from American Airlines's earnings presentation, Jan 25, 2024

Slide 1: Fourth-Quarter and Full-Year 2023 Financial Results
Slide 2: Forward-looking statements
Forward-looking statements Certain of the statements contained in this presentation should be considered forward-looking statements within the meaning of the Securities Act of 1933, as amended, the Securities Exchange Act of 1934, as amended, and the Private Securities Litigation Reform Act of 1995.
Slide 3: Strong fourth-quarter and full-year results
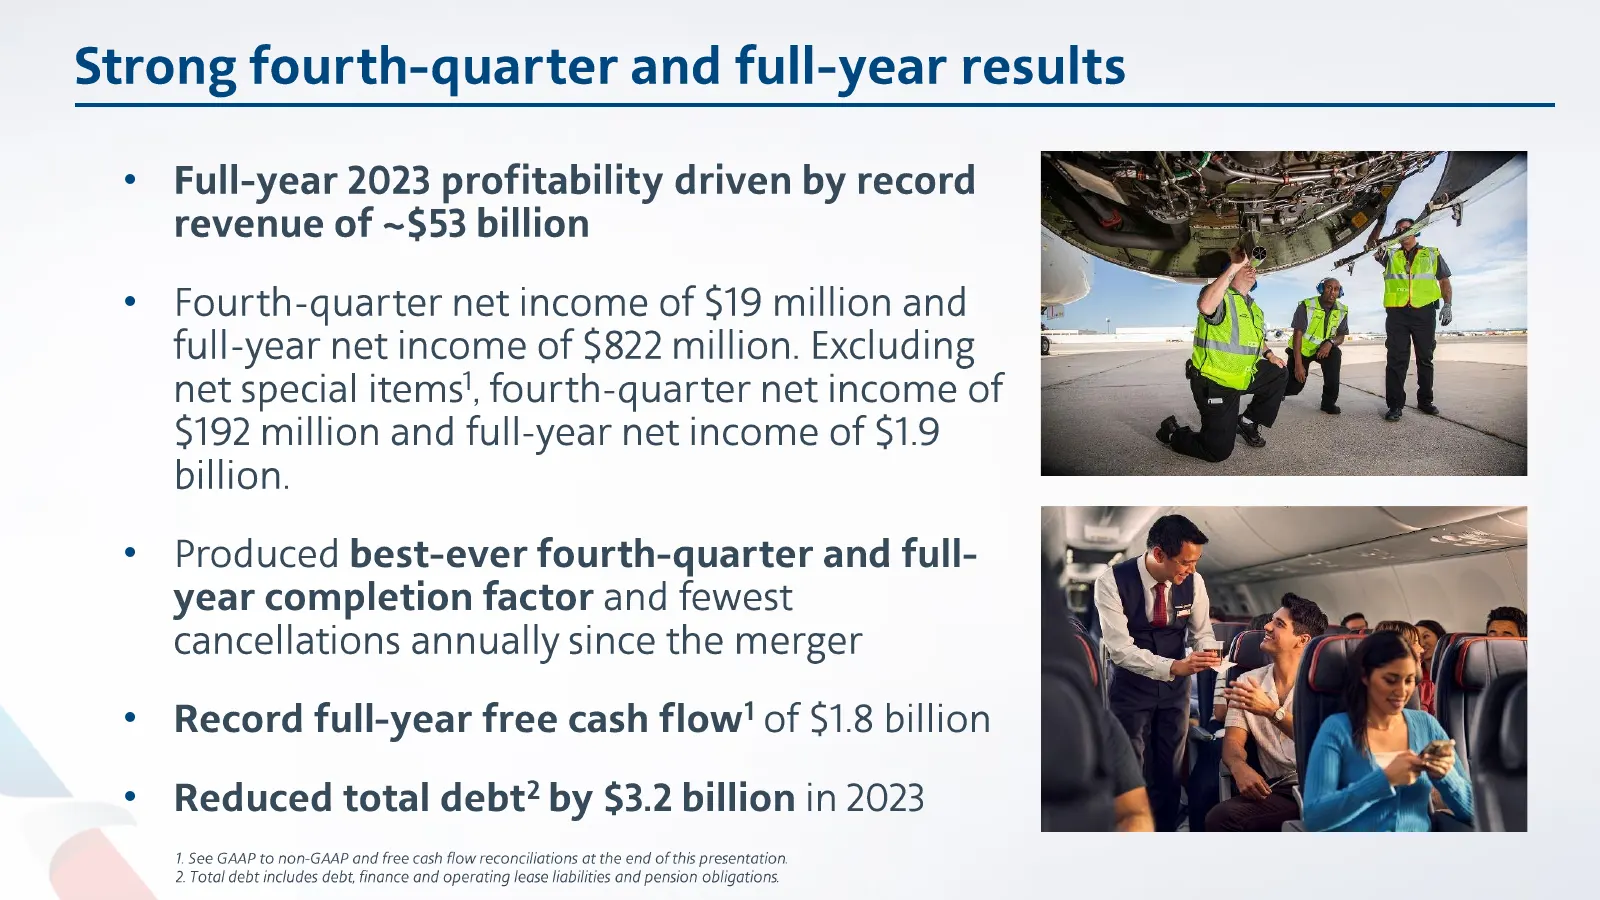
Strong fourth-quarter and full-year results ¢ Full-year 2023 profitability driven by record revenue of ~$53 billion ¢ Fourth-quarter net income of $19 million and full-year net income of $822 million. Excluding net special items', fourth-quarter net income of $192 million and full-year net income of
Slide 4: Completion Factor and On-time Departures
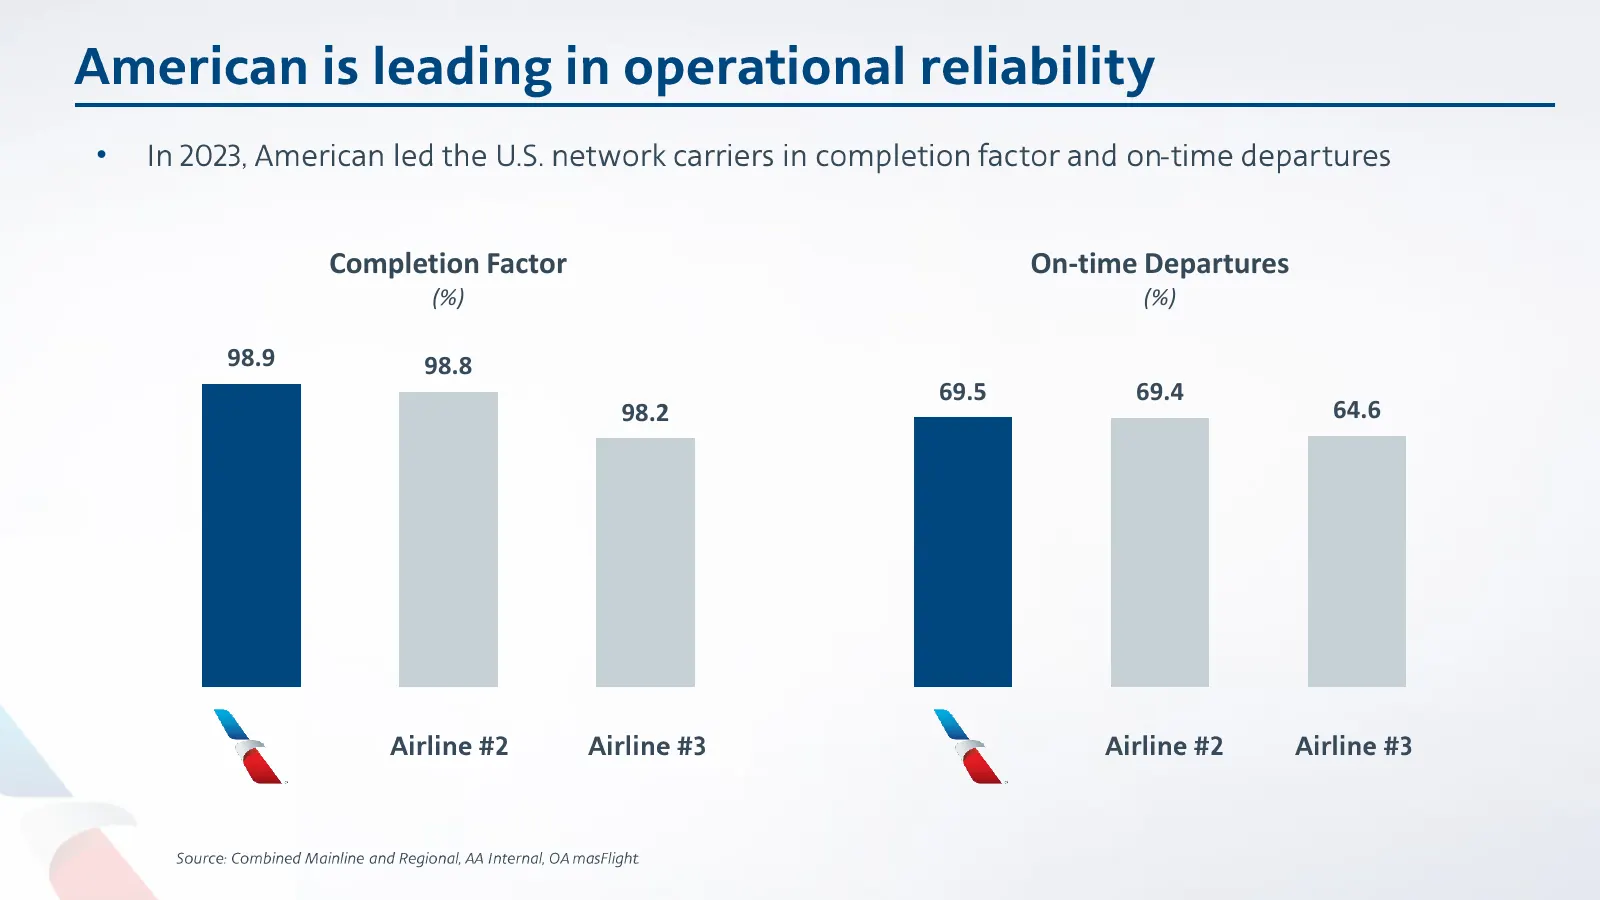
• Completion Factor On-time Departures (%) (%) 98.9 98.8 69.5 69.4 98.2 64.6
Slide 5: New loyalty member accounts
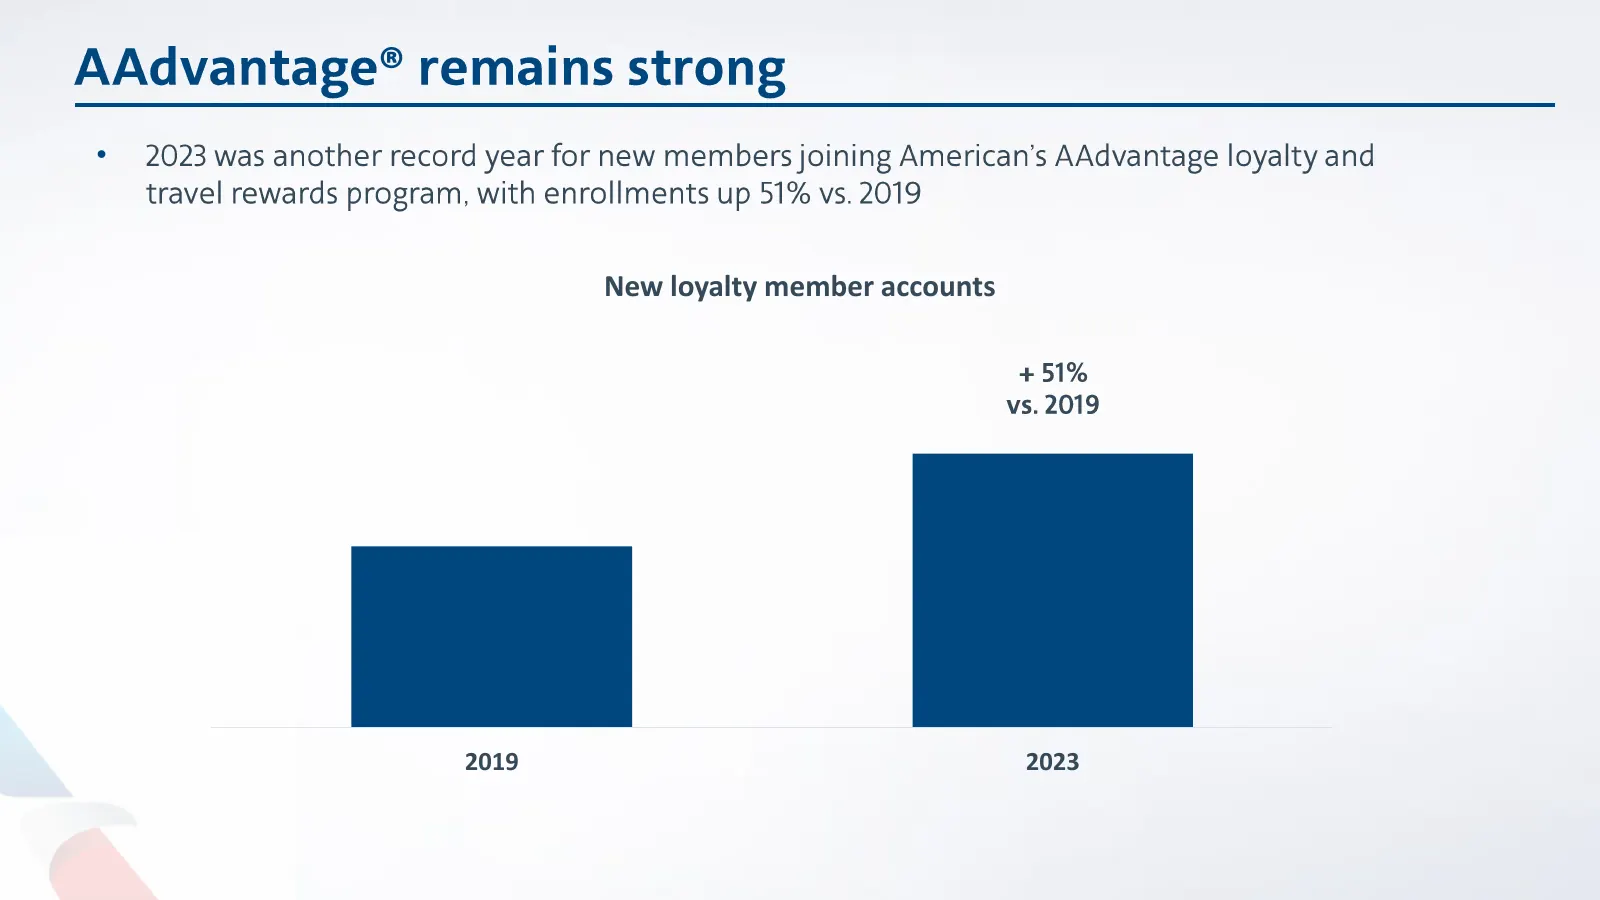
® • New loyalty member accounts 2019 2023
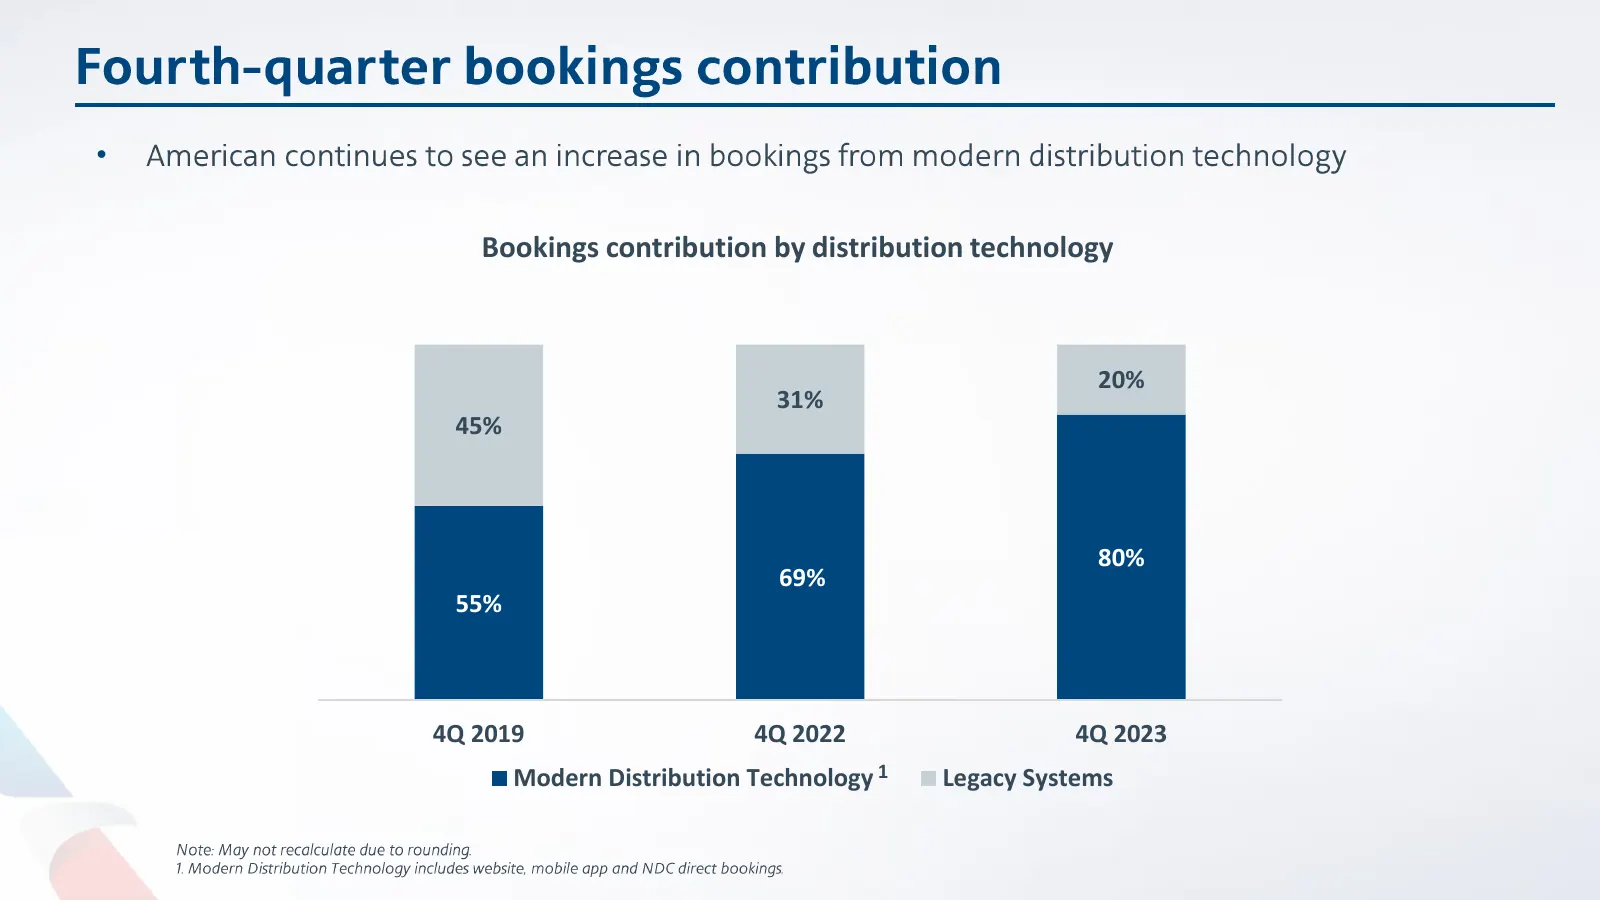
Slide 6: Bookings contribution by distribution technology
• Bookings contribution by distribution technology 20% 31% 45% 80% 69% 55% 4Q 2019 4Q 2022 4Q 2023 Modern Distribution Technology 1 Legacy Systems

Slide 7: Financial update
Financial update
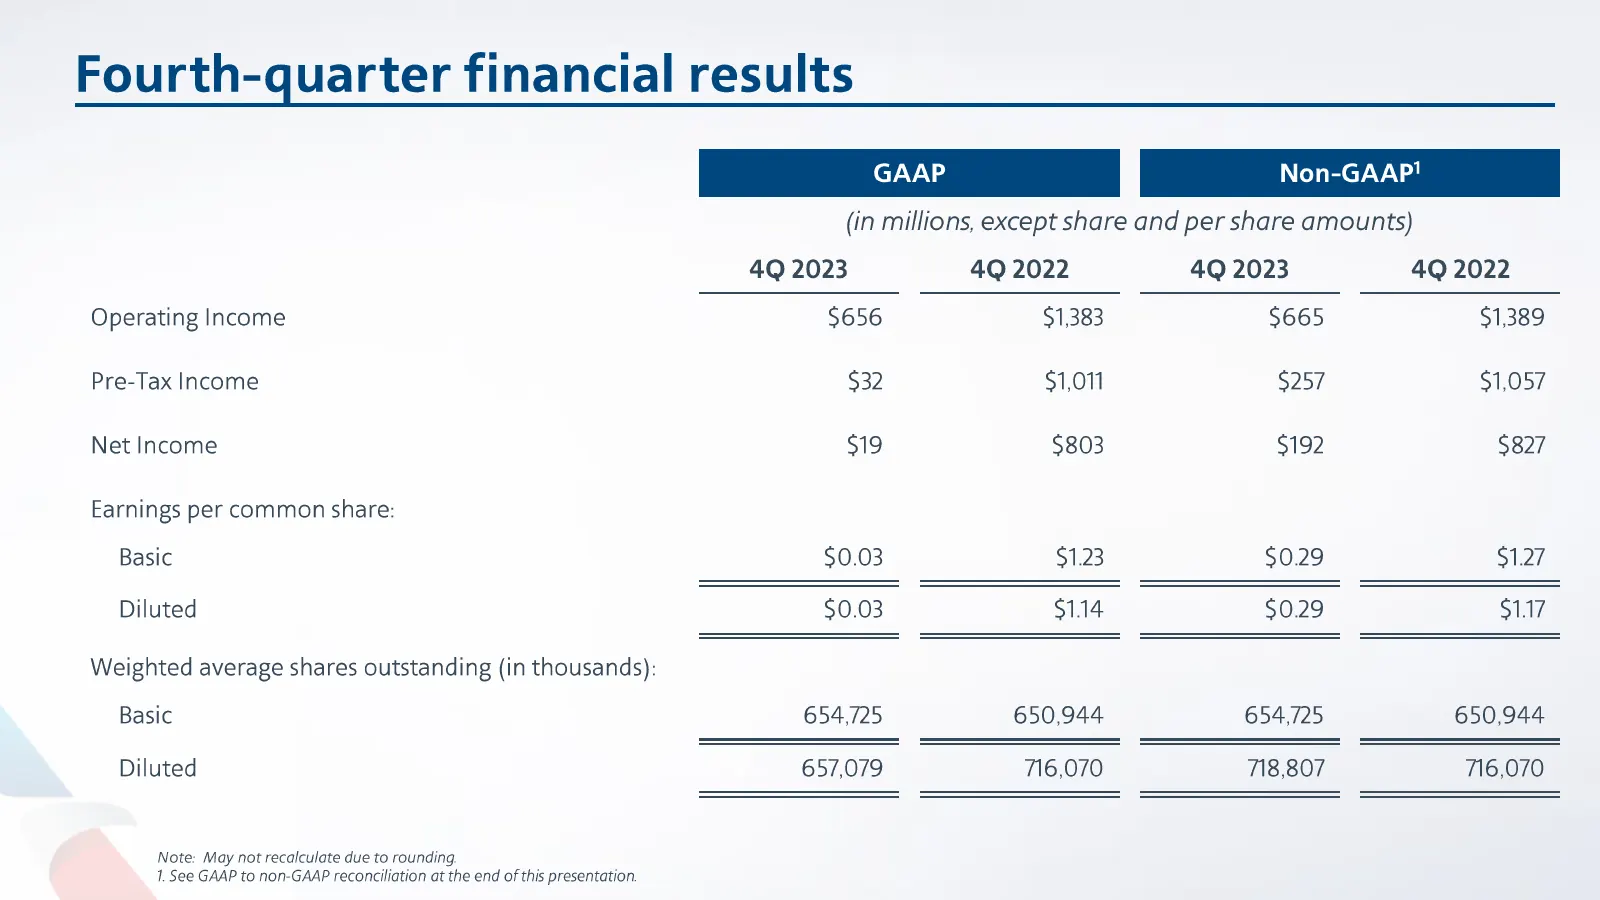
Slide 8: Fourth-quarter financial results
Fourth-quarter financial results (in millions, except share and per share amounts) 4Q 2023 4Q 2022 4Q 2023 4Q 2022 Operating Income $656 $1,383 $665 $1,389 Pre-Tax Income $32 $1,011 $257 $1,057 Net Income $19 $803 $192 $827 Earnings per common share: Basic $0.03 $1.23 $0.29 $1.27 Diluted $0.03 $1.14
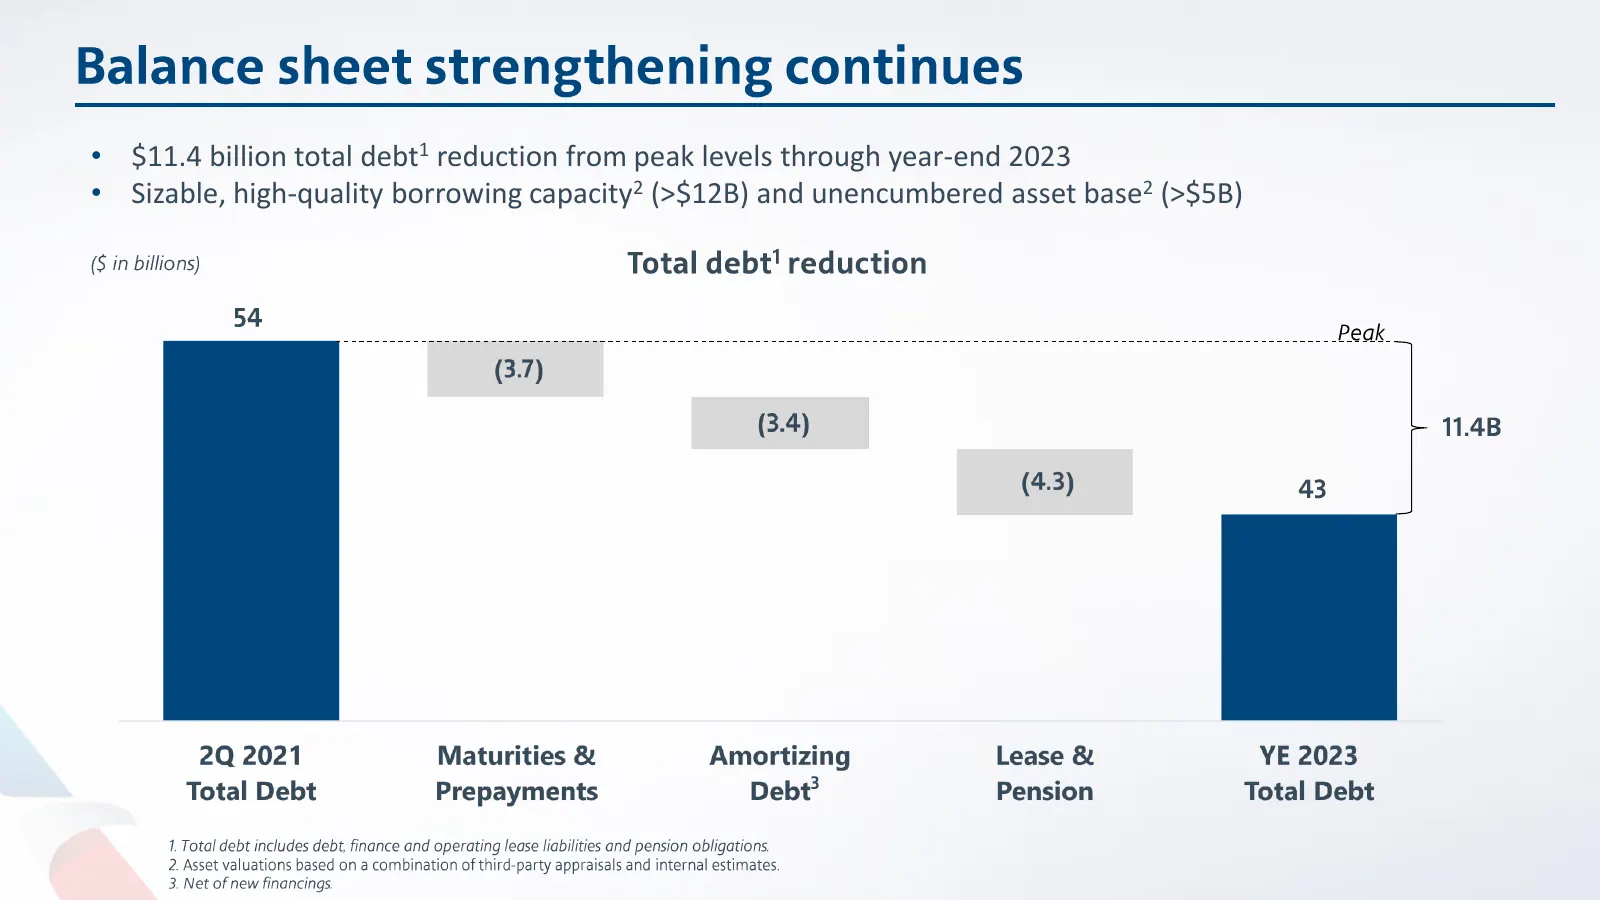
Slide 9: Total debt reduction and borrowing capacity
• $11.4 billion total debt1 reduction from peak levels through year-end 2023 • Sizable, high-quality borrowing capacity2 (>$12B) and unencumbered asset base2 (>$5B)
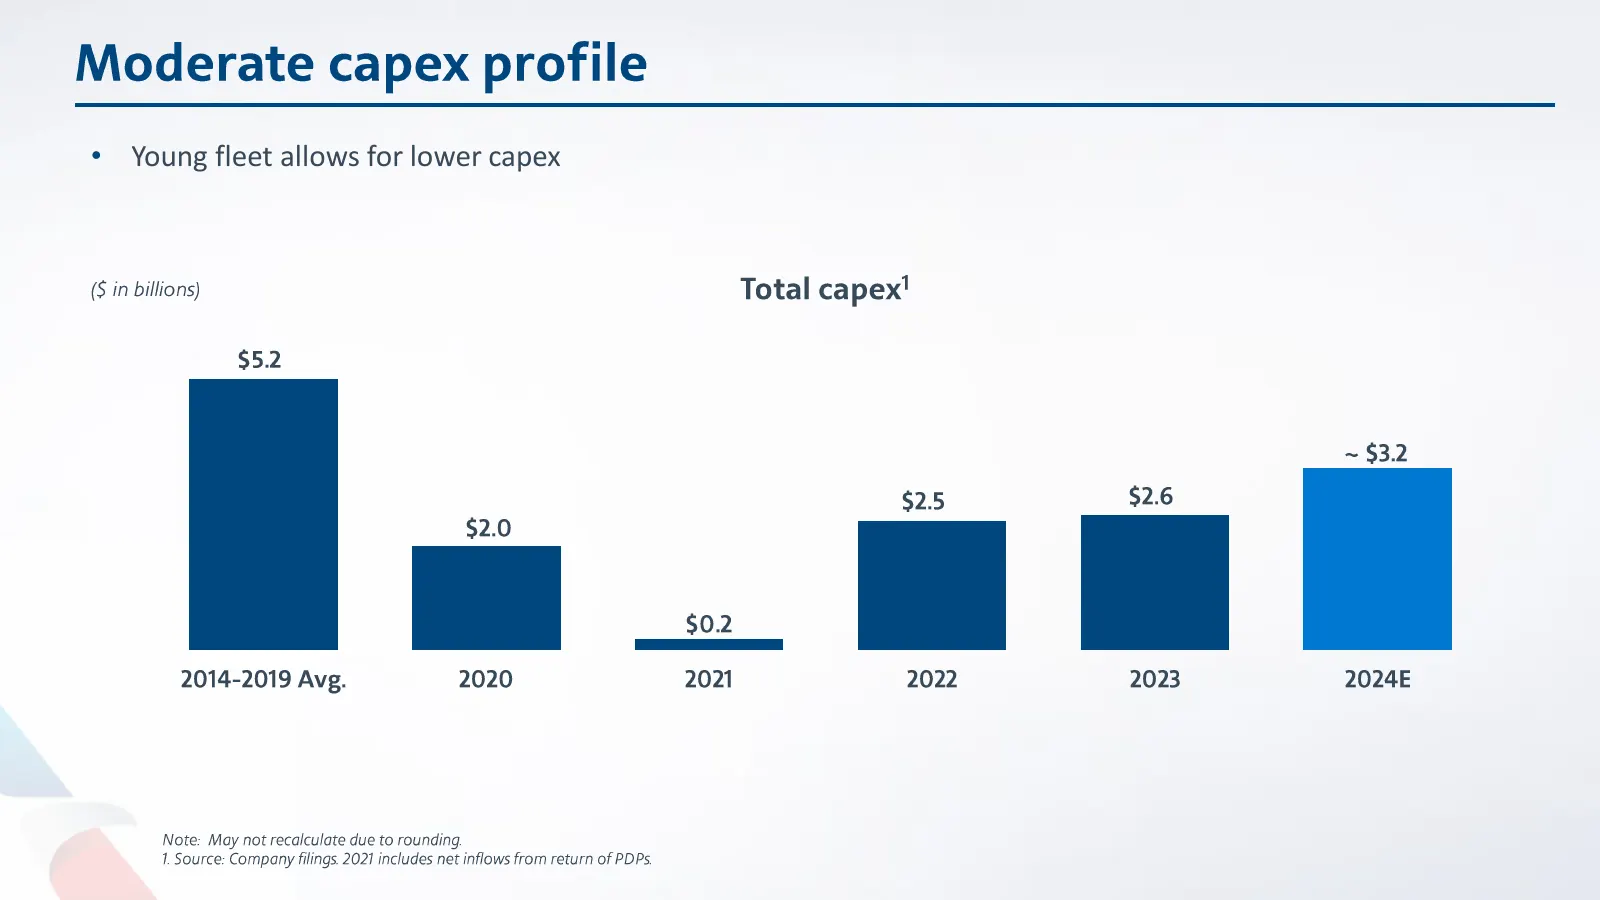
Slide 10: Young fleet allows for lower capex
• Young fleet allows for lower capex
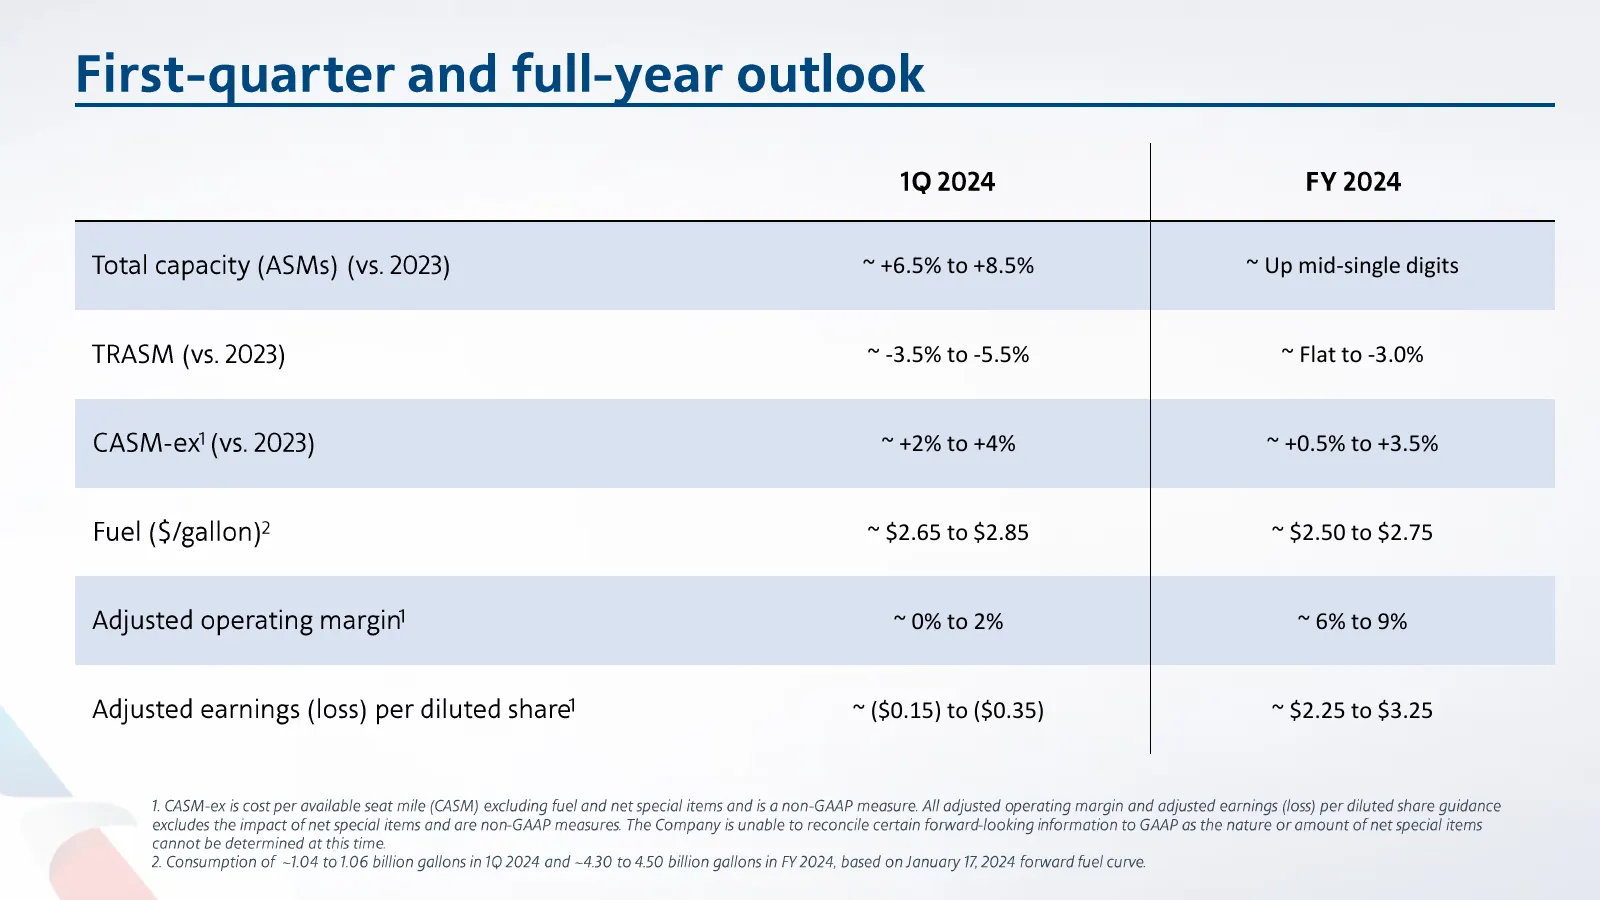
Slide 11: Outlook and guidance
~ +6.5% to +8.5% ~ Up mid-single digits ~ -3.5% to -5.5% ~ Flat to -3.0% ~ +2% to +4% ~ +0.5% to +3.5% ~ $2.65 to $2.85 ~ $2.50 to $2.75 ~ 0% to 2% ~ 6% to 9% ~ ($0.15) to ($0.35) ~ $2.25 to $3.25

Slide 12: THANK YOU, #AATeam!
THANK YOU, #AATeam!
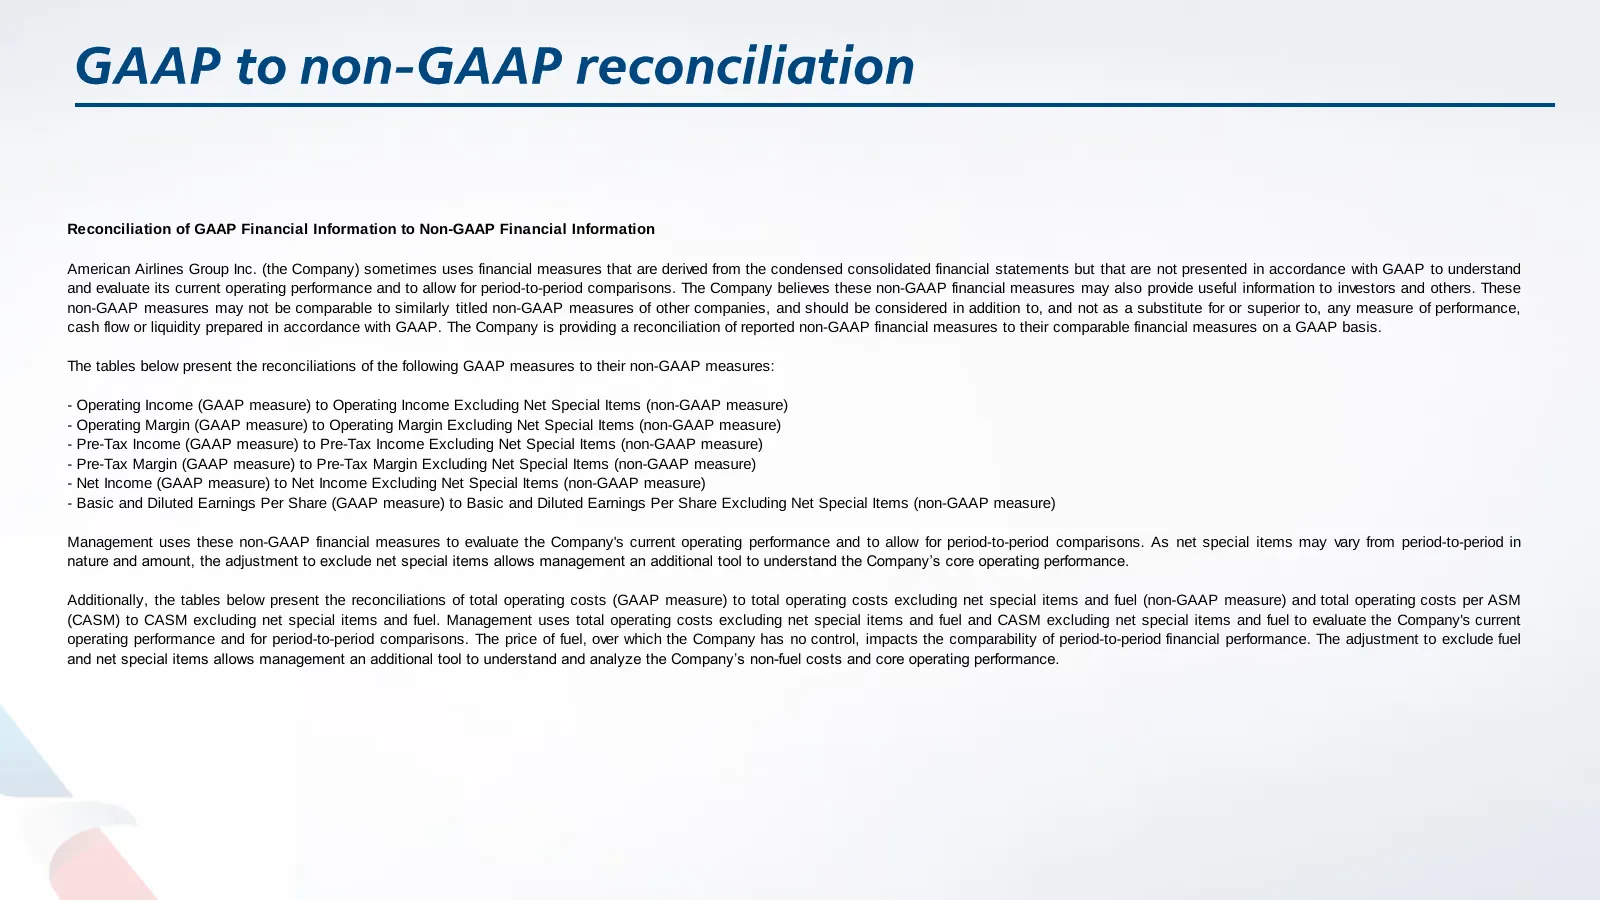
Slide 13: Reconciliation of GAAP to Non-GAAP Financial Information
Reconciliation of GAAP Financial Information to Non-GAAP Financial Information American Airlines Group Inc. (the Company) sometimes uses financial measures that are derived from the condensed consolidated financial statements but that are not presented in accordance with GAAP to understand and evalu
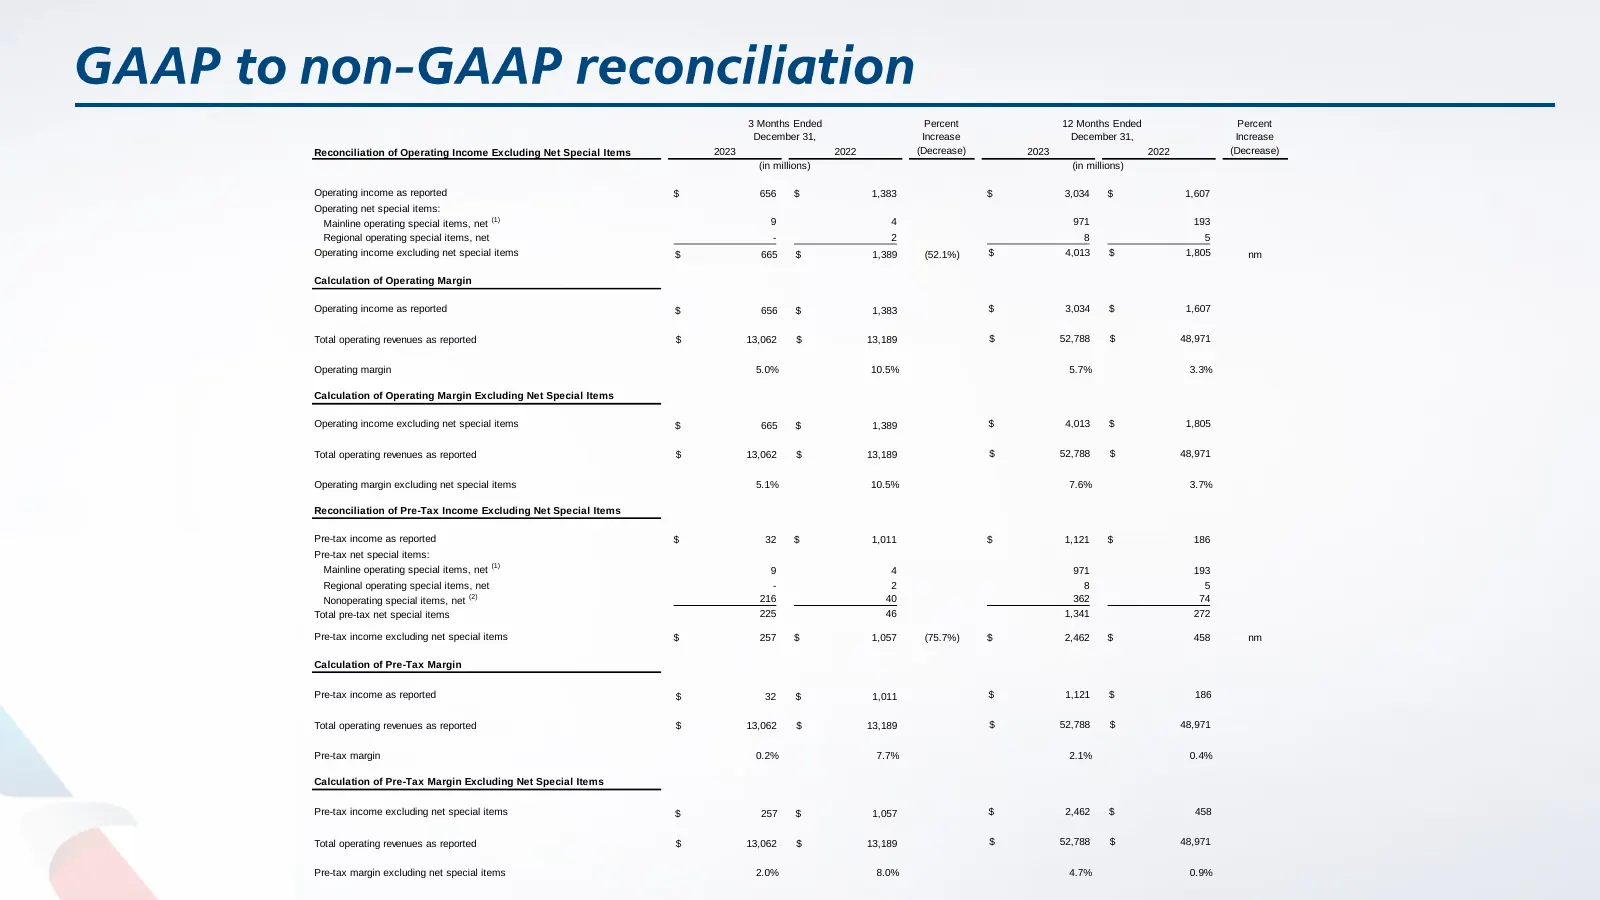
Slide 14: Reconciliation of Operating Income Excluding Net Special Items
3 Months Ended Percent 12 Months Ended Percent December 31, Increase December 31, Increase Reconciliation of Operating Income Excluding Net Special Items 2023 2022 (Decrease) 2023 2022 (Decrease) (in millions) (in millions) Operating income as reported $ 656 $ 1,383 $ 3,034 $ 1,607 Operating net spe
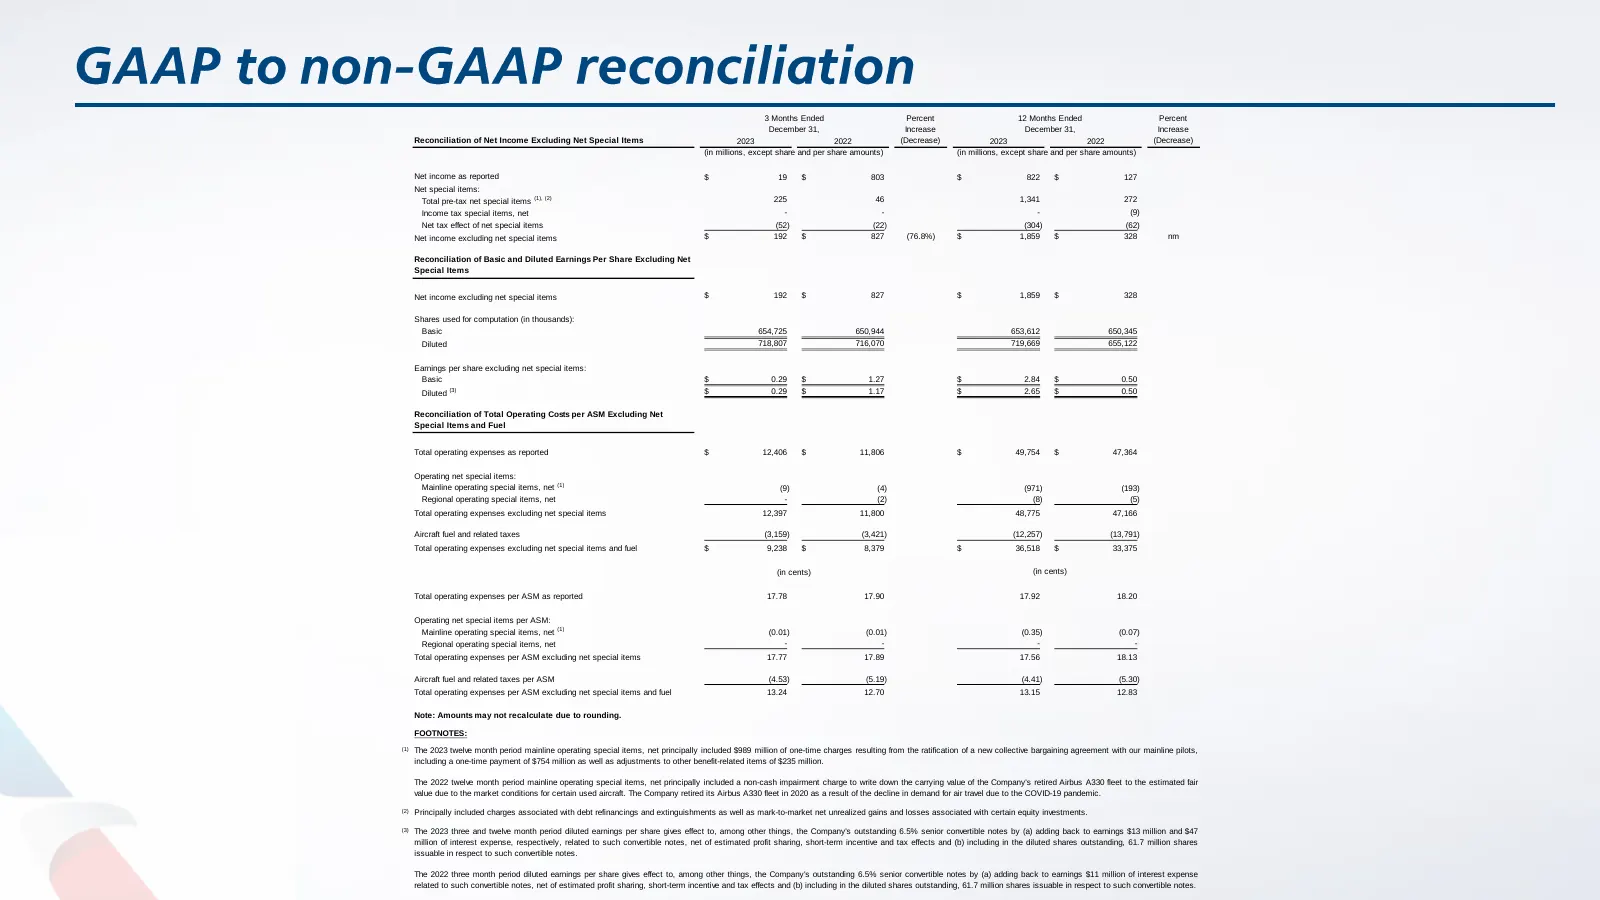
Slide 15: Reconciliation of Net Income Excluding Net Special Items
3 Months Ended Percent 12 Months Ended Percent December 31, Increase December 31, Increase Reconciliation of Net Income Excluding Net Special Items 2023 2022 (Decrease) 2023 2022 (Decrease) (in millions, except share and per share amounts) (in millions, except share and per share amounts) Net income
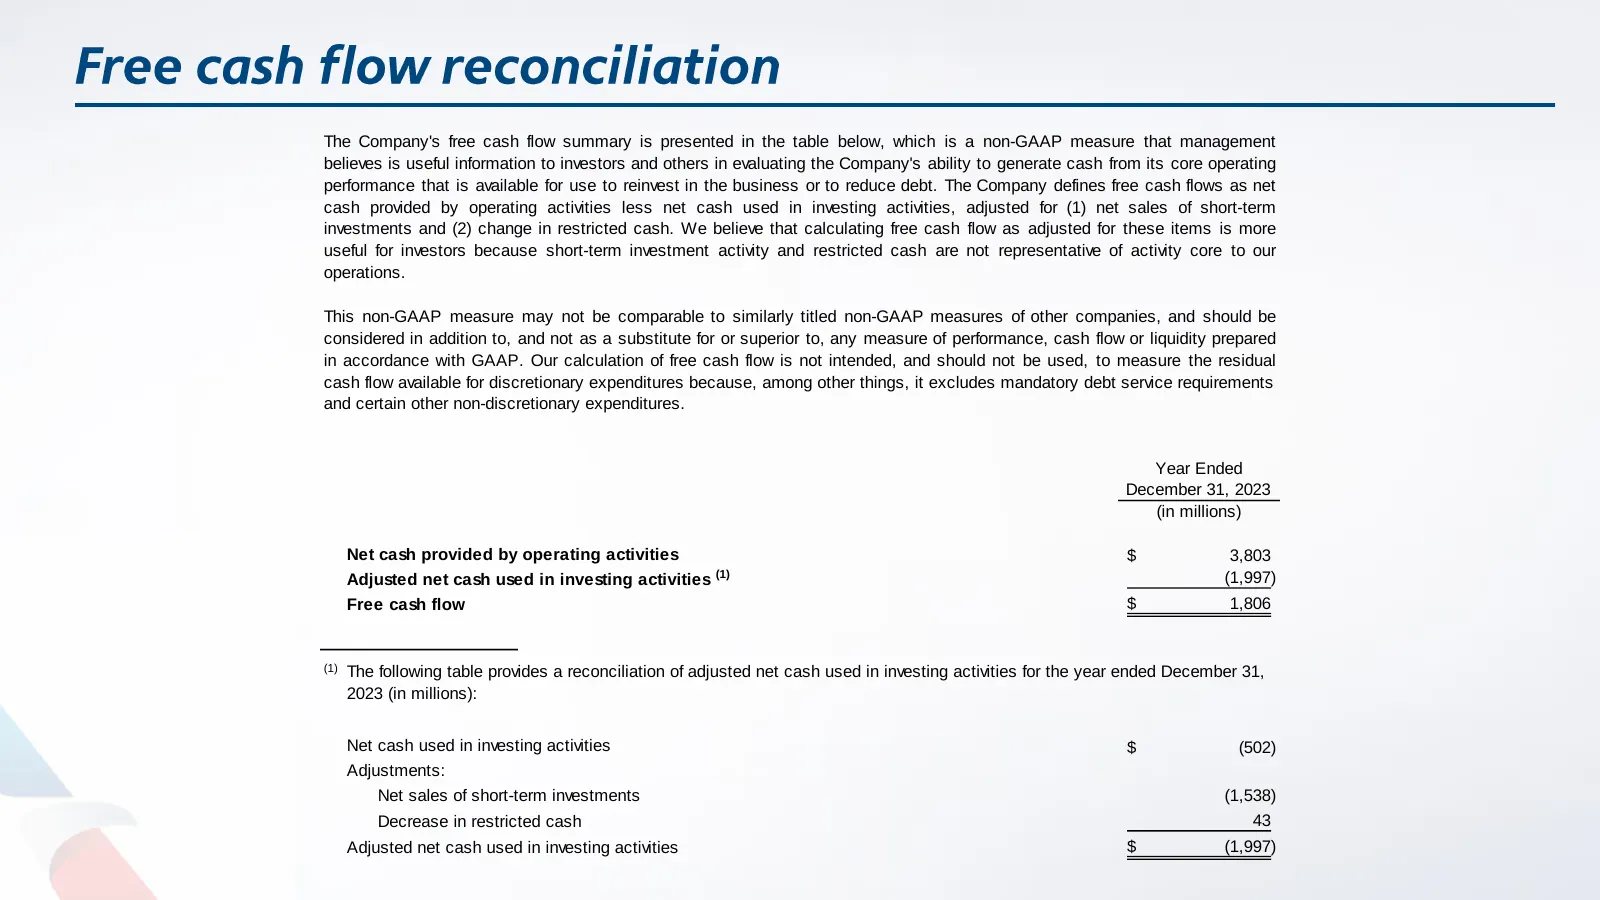
Slide 16: Free cash flow summary
The Company's free cash flow summary is presented in the table below, which is a non-GAAP measure that management believes is useful information to investors and others in evaluating the Company's ability to generate cash from its core operating performance that is available for use to reinvest in t
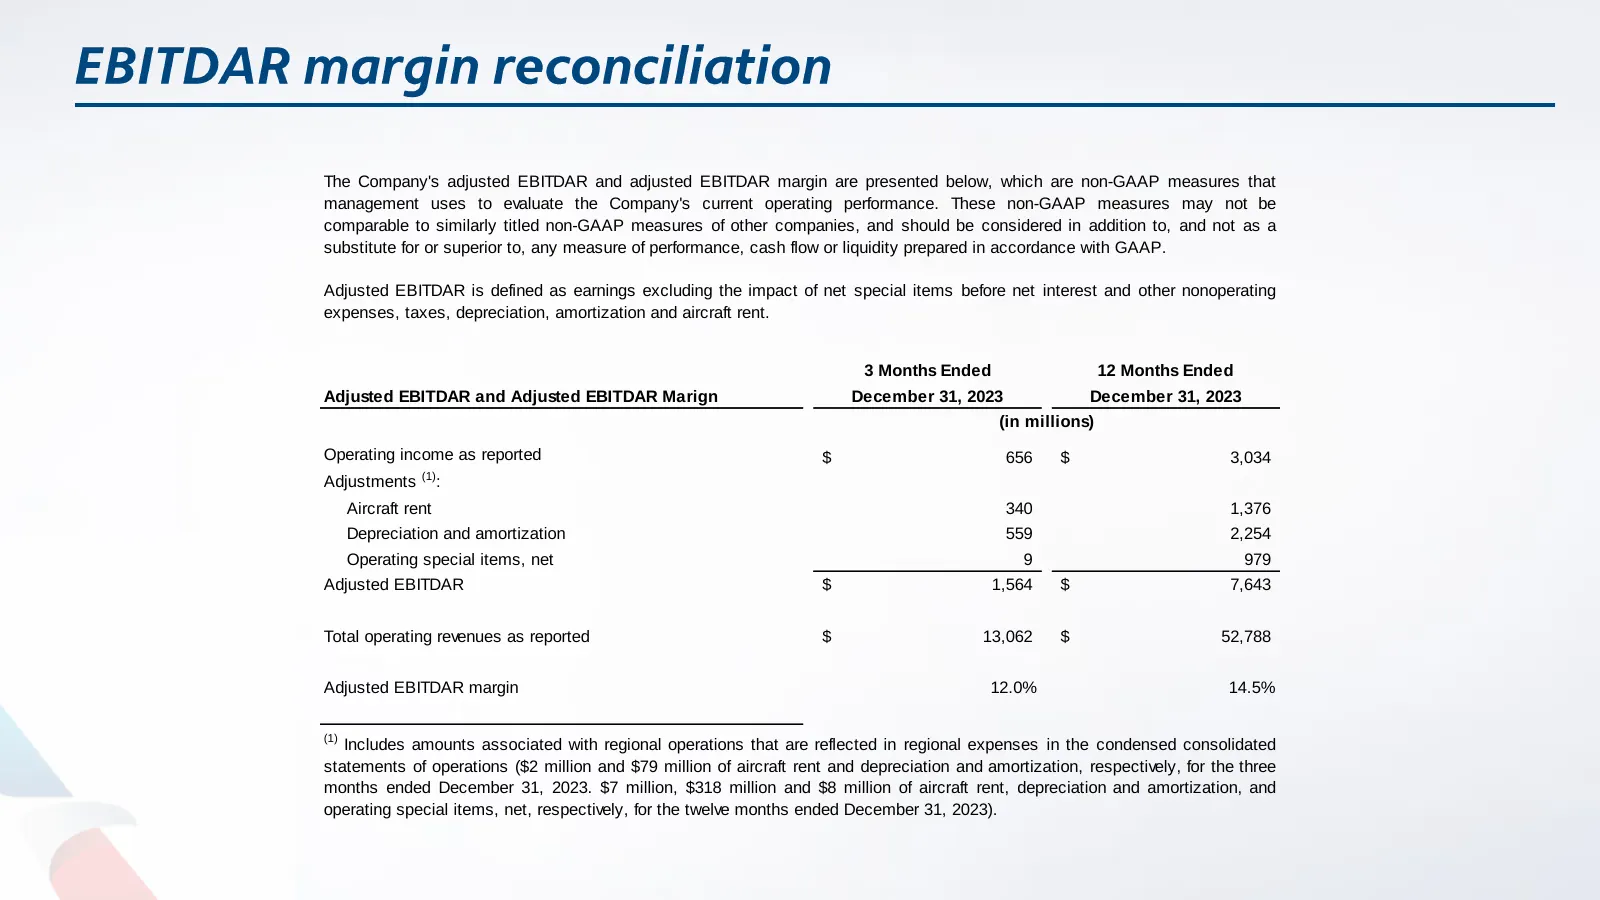
Slide 17: Adjusted EBITDAR and Adjusted EBITDAR Margin
The Company's adjusted EBITDAR and adjusted EBITDAR margin are presented below, which are non-GAAP measures that management uses to evaluate the Company's current operating performance. These non-GAAP measures may not be comparable to similarly titled non-GAAP measures of other companies, and should

Slide 18: American Airlines
American®, Airlines
Source: 6ix earnings call
More decks from American Airlines Group, Inc.
 Q3 2026 Earnings Presentation16 slides · Oct 22, 2026
 IPO Roadshow (July 2026)38 slides · Jul 27, 2026
 Q2 2026 Earnings Presentation14 slides · Jul 23, 2026
 IPO Roadshow (April 2026)39 slides · Apr 27, 2026
 Q1 2026 Earnings Presentation18 slides · Apr 23, 2026
 Q4 2025 Earnings Presentation19 slides · Jan 27, 2026