Meritor — Arvinmeritor — Deutsche Bank 2007 Leveraged Finance Conference
18 slides from Meritor's conference presentation, Oct 4, 2007

Slide 1: Deutsche Bank 2007 Leveraged Finance Conference
Deutsche Bank 2007 Leveraged Finance Conference Jim Donlon, Executive Vice President and CFO Mary Lehmann, Sr. VP, Strategic Initiatives, and Treasurer October 3, 2007

Slide 2: Forward-Looking Statements
Forward-Looking Statements This presentation contains statements relating to future results of the company (including certain projections and business trends) that are “forward-looking statements” as defined in the Private Securities Litigation Reform Act of 1995. Forward-looking statements are typi
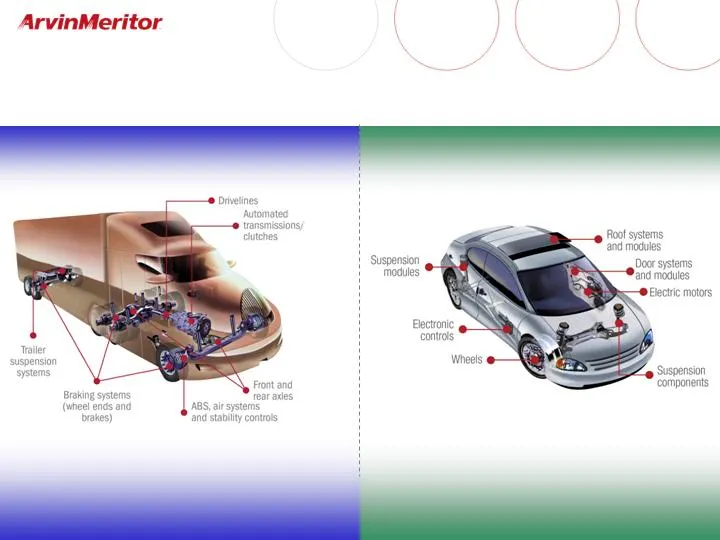
Slide 3: Product Portfolio
Commercial Vehicle Systems Light Vehicle Systems Product Portfolio
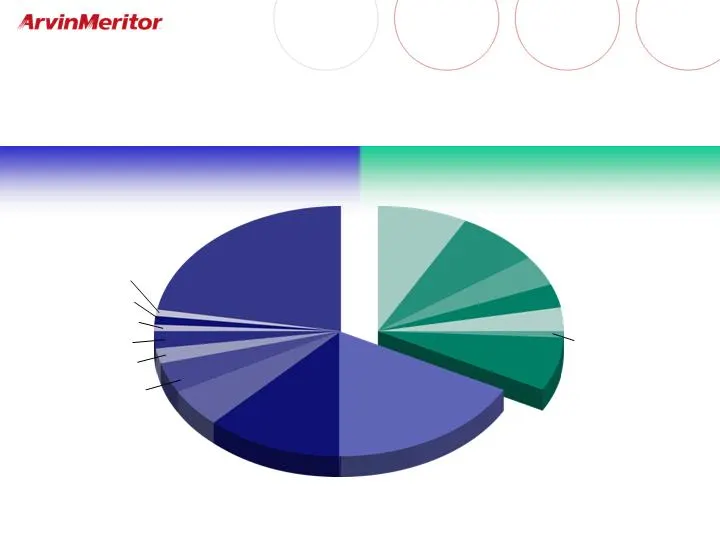
Slide 4: Customer Base After ET Divestiture
Commercial Vehicle Customers Light Vehicle Customers Customer Base After ET Divestiture 2006 Sales DaimlerChrysler 8% General Motors 3% Volkswagen 7% Ford 3% Asian Based OEMs 4% BMW 1% Other LVS 7% Other CVS 22% Fiat 2% Asian Based OEMs 4% Ford 1% Volkswagen 1% General Motors 1% PACCAR 2% Internatio
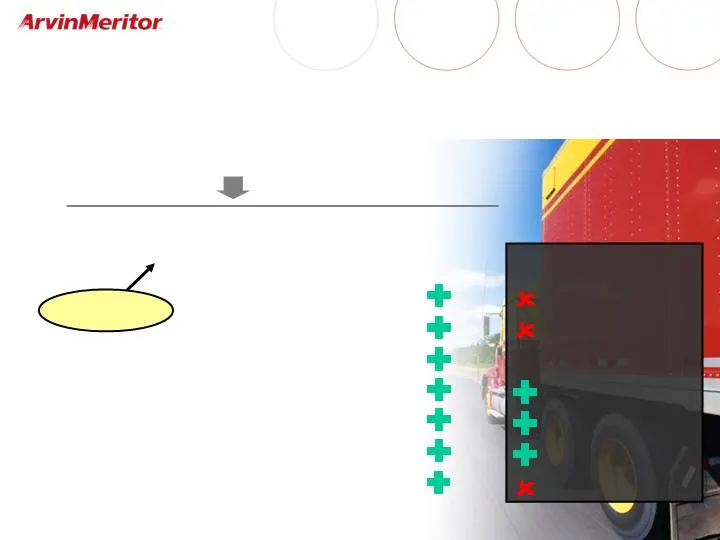
Slide 5: Scorecard of Downturn Offsets
2007 Outcome Volume shortfall Sold Emissions Industry contracted Migrated to Europe Exceeded Scorecard of Downturn Offsets Slide from June 2006 showing expected offsets to N.A. Class 8 downturn Layered Capacity Emerging Markets High-Volume Premium Reduction CVA Growth Specialty Vehicle Market CVE Gr
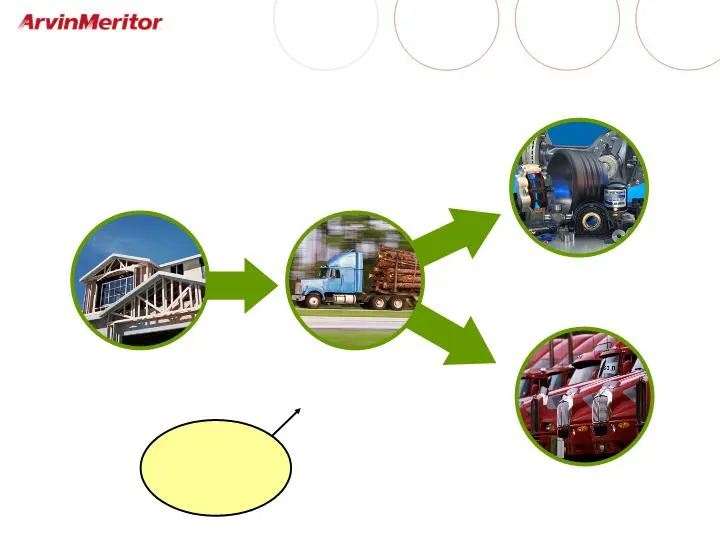
Slide 6: Credit Crunch Affects Aftermarket, Trailers and OE Truck Sales
Credit Crunch Affects Aftermarket, Trailers and OE Truck Sales Scarce funding exacerbates already poor new home sales. The demand for aftermarket truck components declines as ton-miles remain weak. Trailer sales also suffer. The volume of building materials, landscaping materials, appliances and fur
Slide 7: Truck Tonnage Index
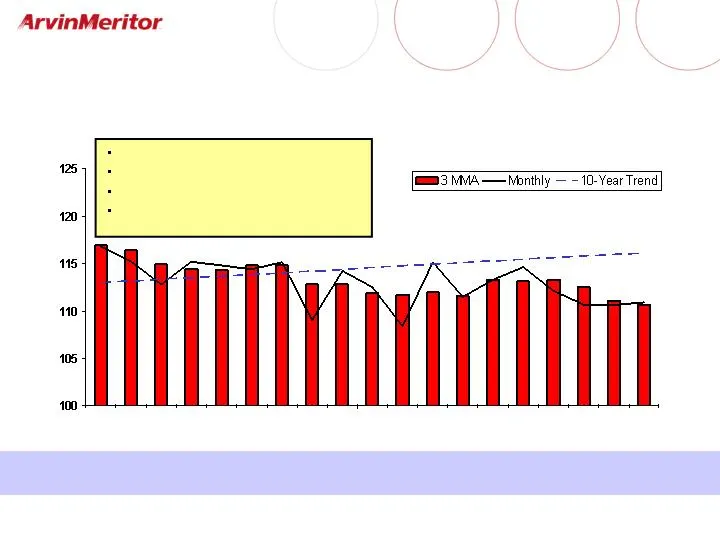
Truck Tonnage Index Seasonally adjusted monthly index, 2000 = 100.0 Jan Apr Jul Oct Jan Apr Freight volumes were weak even before credit crunch Source: ATA Jul July down 4% vs July 2006 Below year-ago 12 of last 13 months July CYTD down 3% vs 2006 August and September weaker
Slide 8: 2007 CY U.S. Trailer Sales Forecast
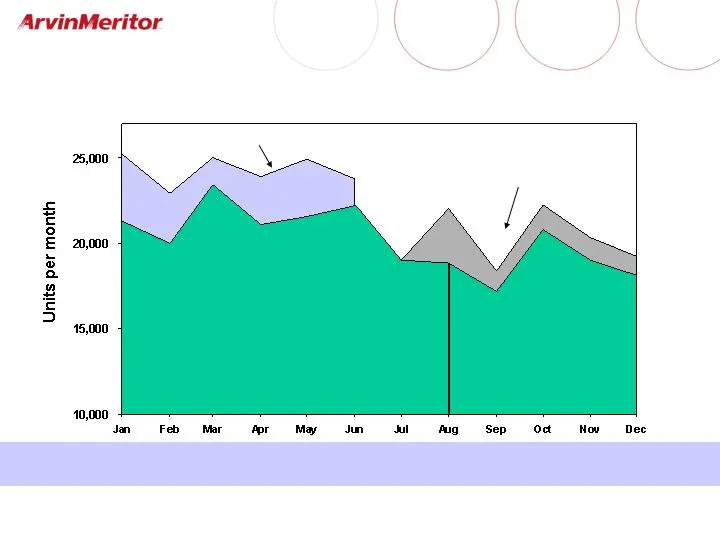
2007 CY U.S. Trailer Sales Forecast Total U.S. trailer industry builds Actual September Forecast January Forecast Source: ACT Research Trailer weakness continues to surprise industry analysts August Forecast 11% miss Lowered by 8% one month later
Slide 9: Class 8 Truck Net New Orders
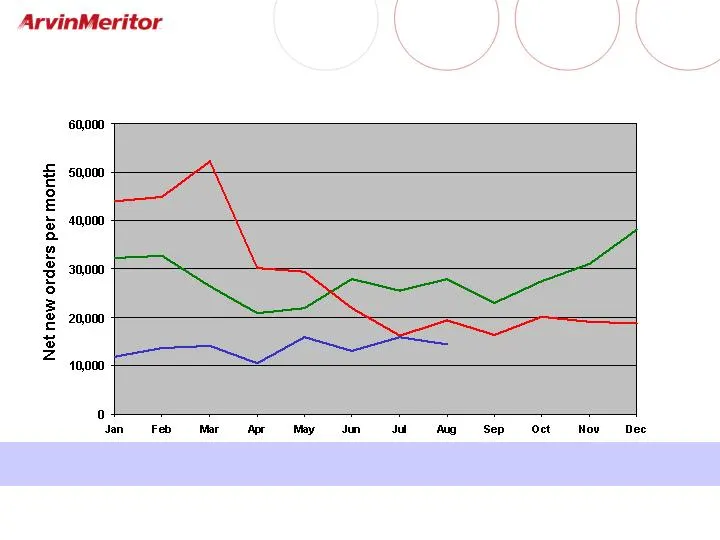
Class 8 Truck Net New Orders Source: ACT Research New order intake for heavy trucks has been weak
Slide 10: Class 8 Production Likely to Recover Later
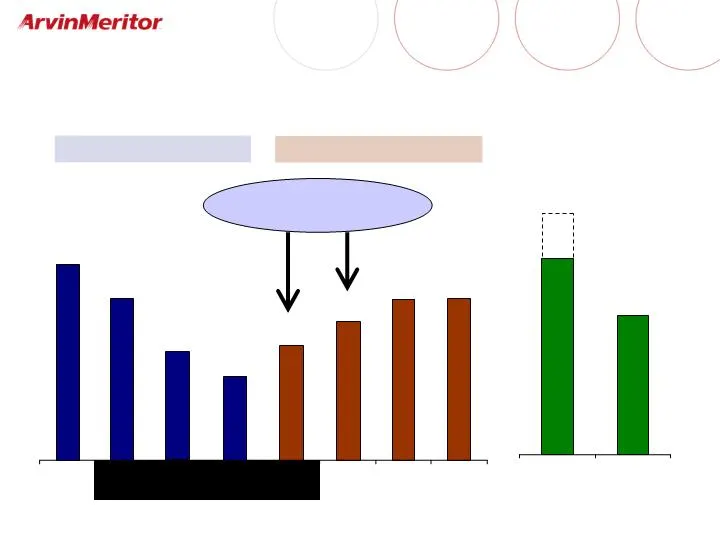
Q2 Q3 Q4 Q1 CY2007 = 185K Vehicles FY2007 = 224K vehicles FY2008 = 250K vehicles Q1 Q2 Q3 Q4 FY2009 FY2010 Class 8 Production Likely to Recover Later (Thousands of vehicles) Downward pressure
Slide 11: Unfavorable Sales Mix
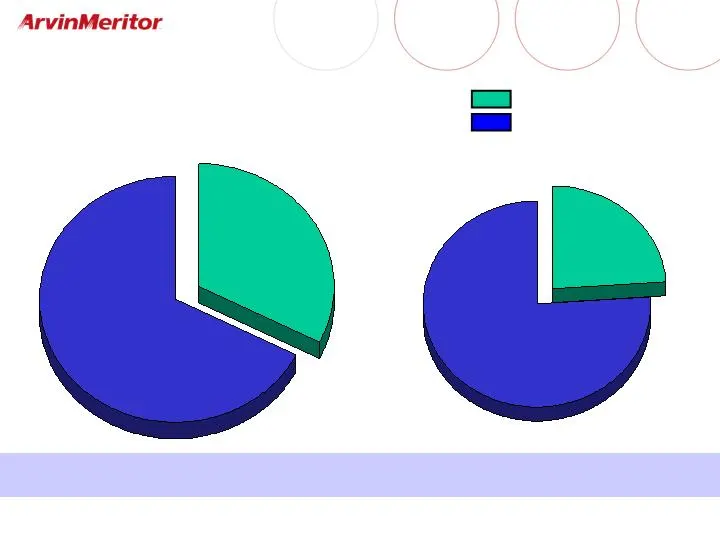
Unfavorable Sales Mix Class 8 Registrations July YTD 32% 24% For-hire Carriers All Other For-hire freight carriers (where ARM share is greatest) affected most Source: R.L. Polk Total registrations 30% lower
Slide 12: Europe Medium & Heavy Truck Production
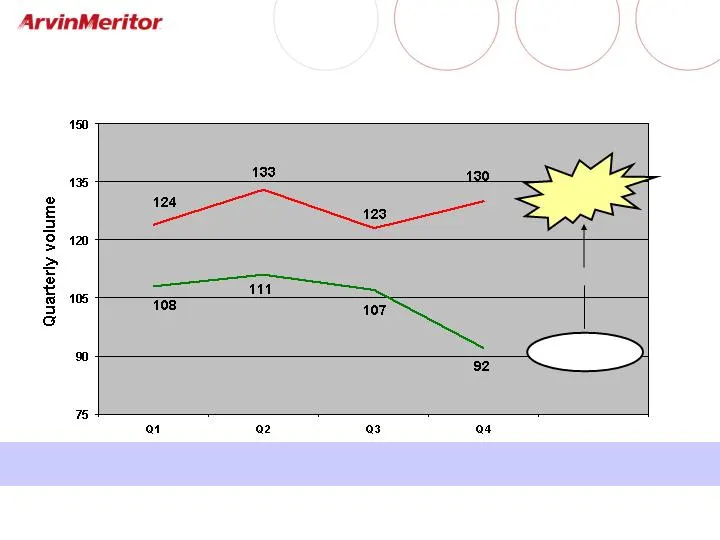
Europe Medium & Heavy Truck Production Thousands of vehicles, fiscal quarters Nov. 2006 Forecast Preliminary Actual Source: Internal estimates Europe truck volumes have taken OEMs and suppliers off-guard FY Actual FY Forecast 22% Surprise 15% 20% 15% 47%
Slide 13: CVS Europe Supply Constraints
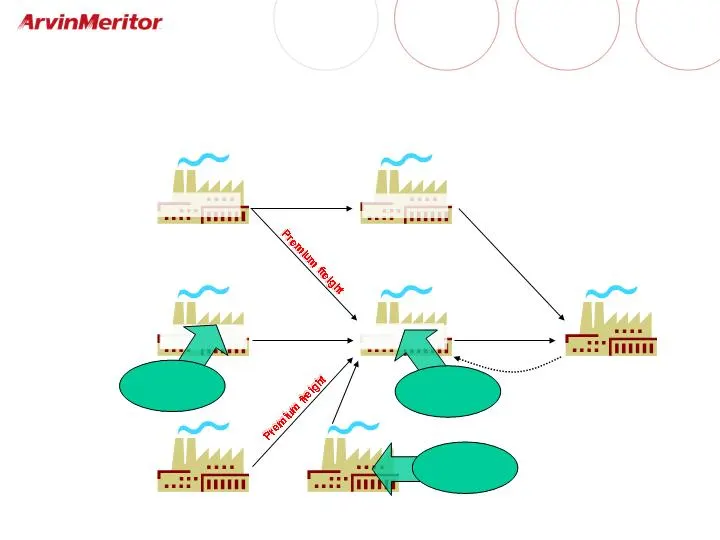
Premium freight CVS Europe Supply Constraints Western European Suppliers ArvinMeritor Eastern European & Asian Suppliers Components Systems Assembly Vehicle Assembly Capacity Constrained Capacity Constrained Capacity Constrained Premium freight Scheduling Challenged Late changes Qualify new supplier
Slide 14: Revised Outlook for 2007
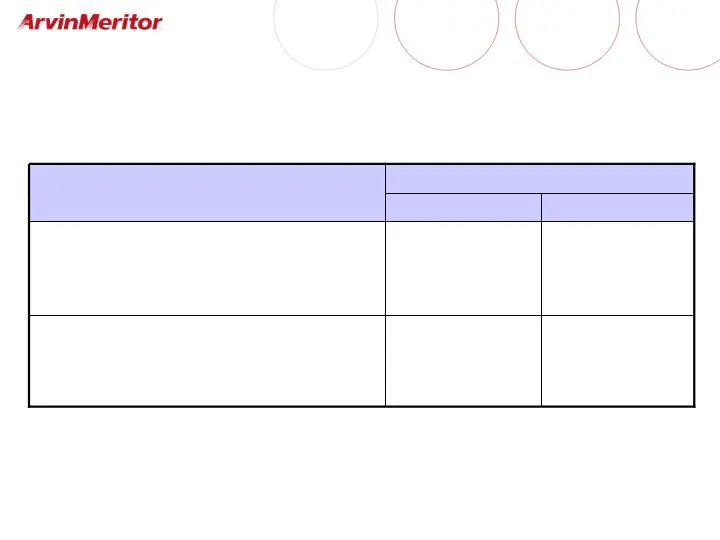
Revised Outlook for 2007 Earnings Per Share EPS Impact Element None ($0.20) Non-recurring items in Q4 - Supplier reorganizations - German tax law change 1H flowthrough ($0.20) Ongoing operational issues - Weak U.S. economy - Supply shortages in Europe
Slide 15: 2008 Guidance Compared to 2007
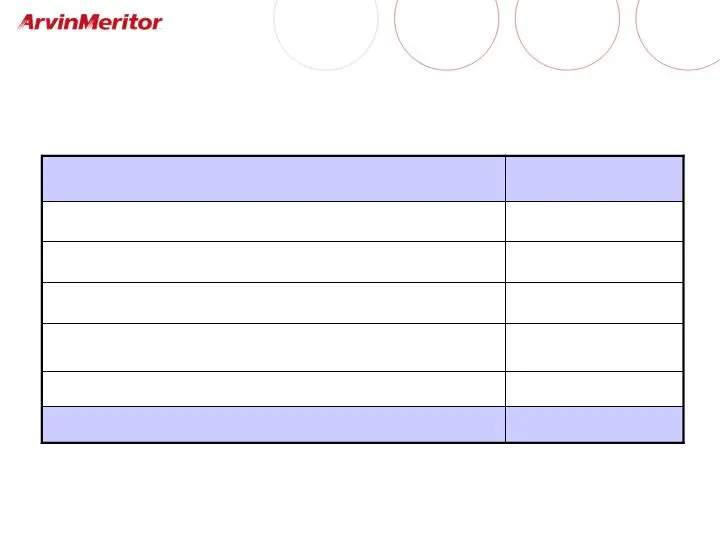
2008 Guidance Compared to 2007 Diluted EPS for Continuing Operations Before Special Items 0.25 - 0.35 Performance Plus product & growth actions including improved customer terms 0.10 - 0.15 Pension and retiree medical (0.20) - (0.30) 1H flowthrough of Q4 operational issues (0.10) - (0.20) North Amer
Slide 16: Term Debt Profile
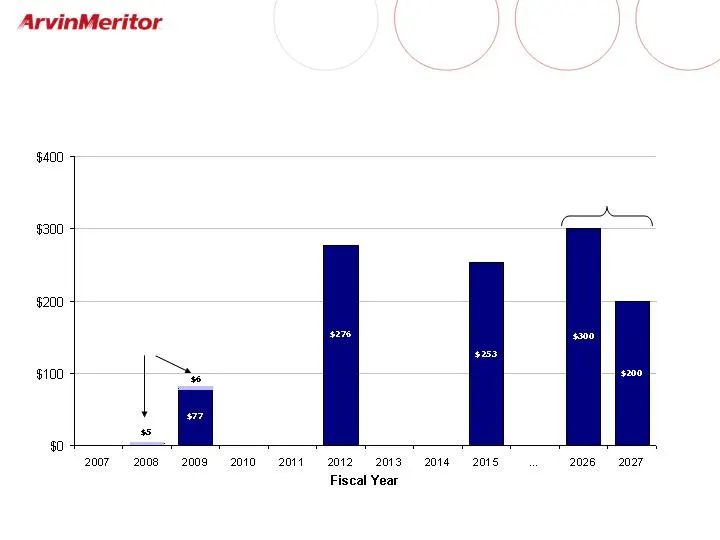
Convertible Newest Issue Term Debt Profile (Maturities in millions) Defeased
Slide 17: Retiree Healthcare
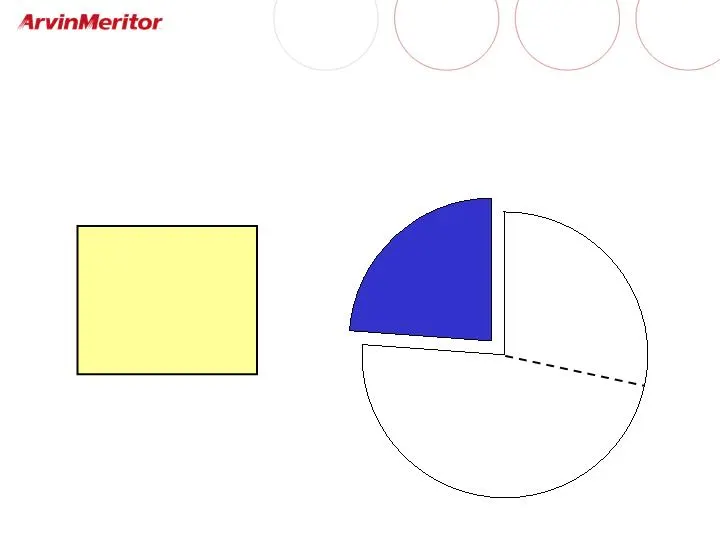
Retiree Healthcare June 30, 2007 estimate Unfunded Position: $587 million Disputed Amount $168 UAW Plants $447 Salaried and Other $140 Annual spend: $50-$55 million expense and cash
Slide 18: Medium-term Investment Thesis Intact
Medium-term Investment Thesis Intact Strong commercial vehicle volumes Solid 2H 2008 in North America, followed by 2009 pre-buy Continuing strong industry in Europe, with improving ability to capitalize Continuing rapid growth in Asia Performance Plus profit improvement plan $75 million cost reducti
Source: SEC EDGAR · 8-K filed Oct 4, 2007
More decks from Meritor Inc
 Merger or Acquisition (March 2022)12 slides · Mar 7, 2022
 Merger or Acquisition (February 2022)8 slides · Feb 22, 2022
 Investor Day (December 2021)66 slides · Dec 7, 2021
 Merger or Acquisition (May 2019)14 slides · May 8, 2019
 Investor Day (December 2018)66 slides · Dec 6, 2018
 Investor Day (December 2017)70 slides · Dec 7, 2017