Nedbank Group · JSE:NED
Nedbank — H1 2016 Earnings Presentation
73 slides from Nedbank's earnings presentation, August 2016
Slide 1: Interim Results for the six months ended 30 June 2016
NEDBANK GROUP LIMITED INTERIM RESULTS For the six months ended 30 June 2016 NEDBANK GROUP LIMITED A Member of the Group
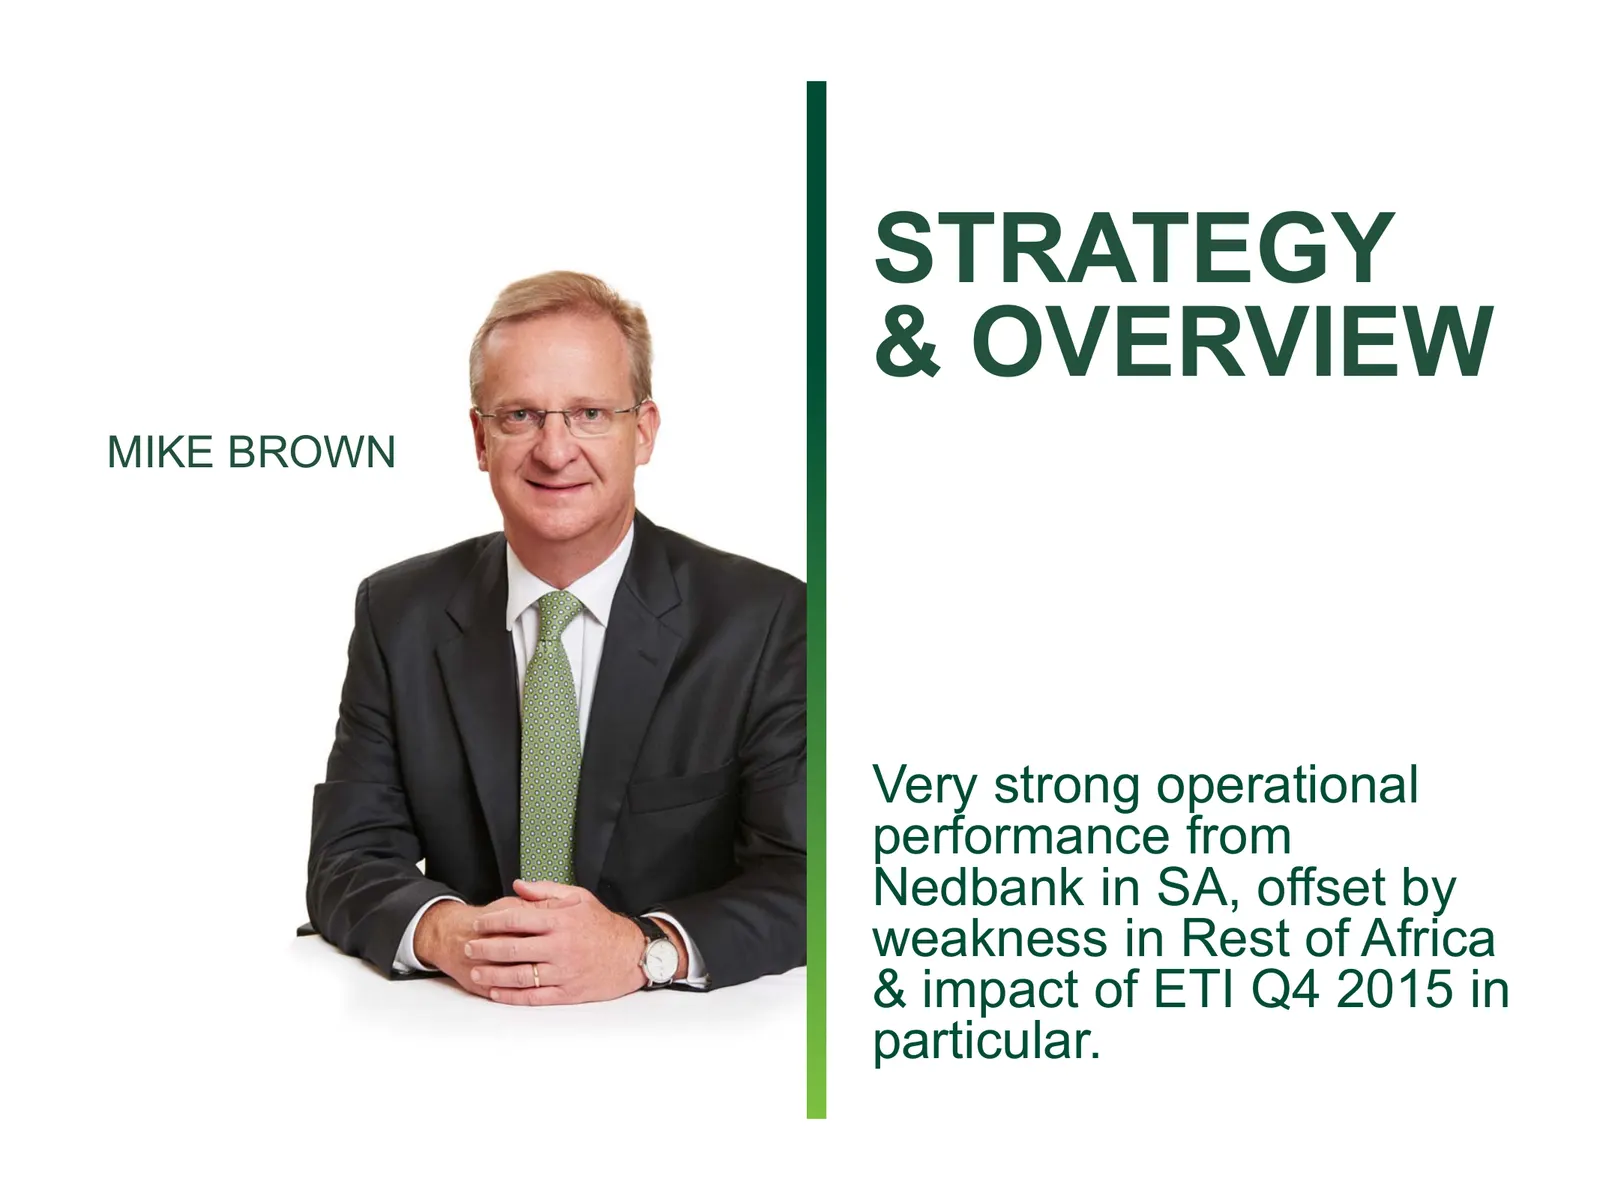
Slide 2: Strategy & Overview
STRATEGY & OVERVIEW MIKE BROWN Very strong operational performance from Nedbank in SA, offset by weakness in Rest of Africa & impact of ETI Q4 2015 in particular.
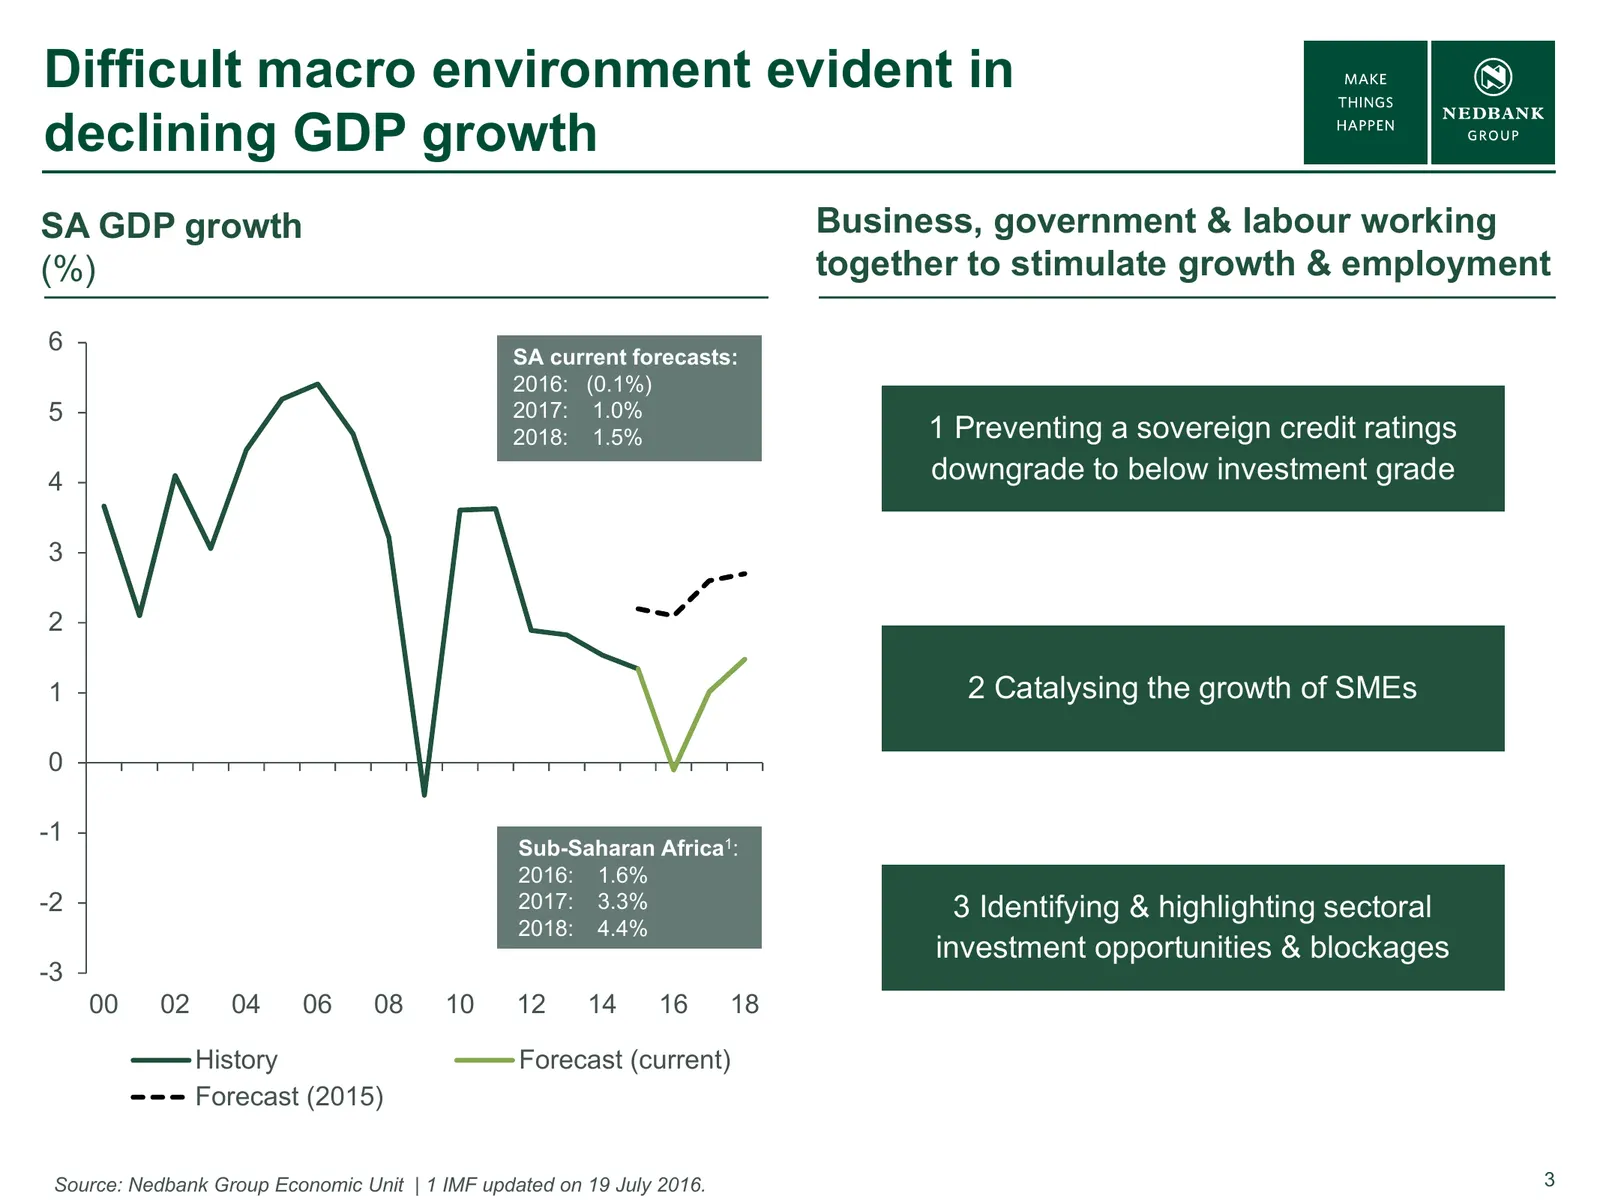
Slide 3: Difficult macro environment evident in declining GDP growth
Difficult macro environment evident in declining GDP growth SA GDP growth Business, government & labour working (%) together to stimulate growth & employment 6 SA current forecasts: 2016: (0.1%) 5 2017: 1.0% 2018: 1.5% 1 Preventing a sovereign credit ratings 4 downgrade to below investment grade 3 2
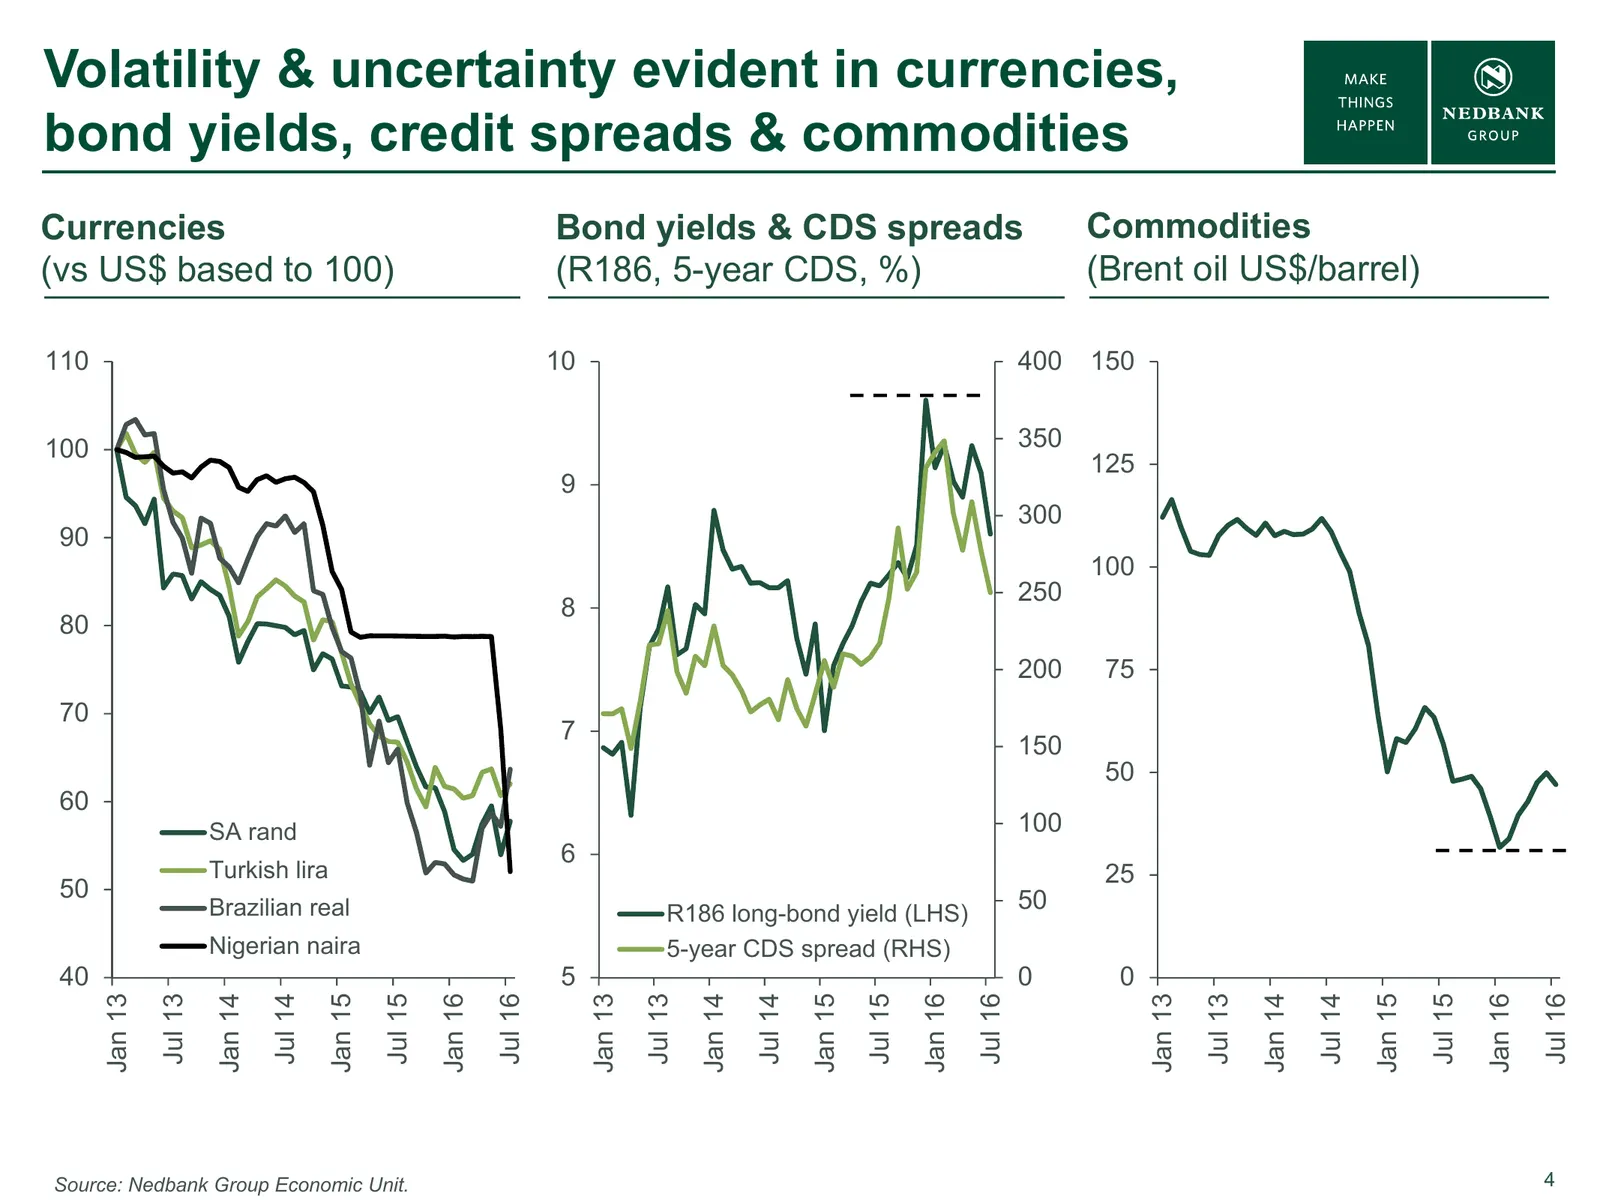
Slide 4: Volatility & uncertainty evident in currencies, bond yields, credit spreads & commodities
Volatility & uncertainty evident in currencies, bond yields, credit spreads & commodities Currencies Bond yields & CDS spreads Commodities (vs US$ based to 100) (R186, 5-year CDS, %) (Brent oil US$/barrel) 110 10 400 150 100 350 125 9 300 90 100 250 8 80 200 75 70 7 150 50 60 SA rand 100 6 Turkish l
Slide 5: Higher interest rates & weaker economic environment resulting in slower credit growth
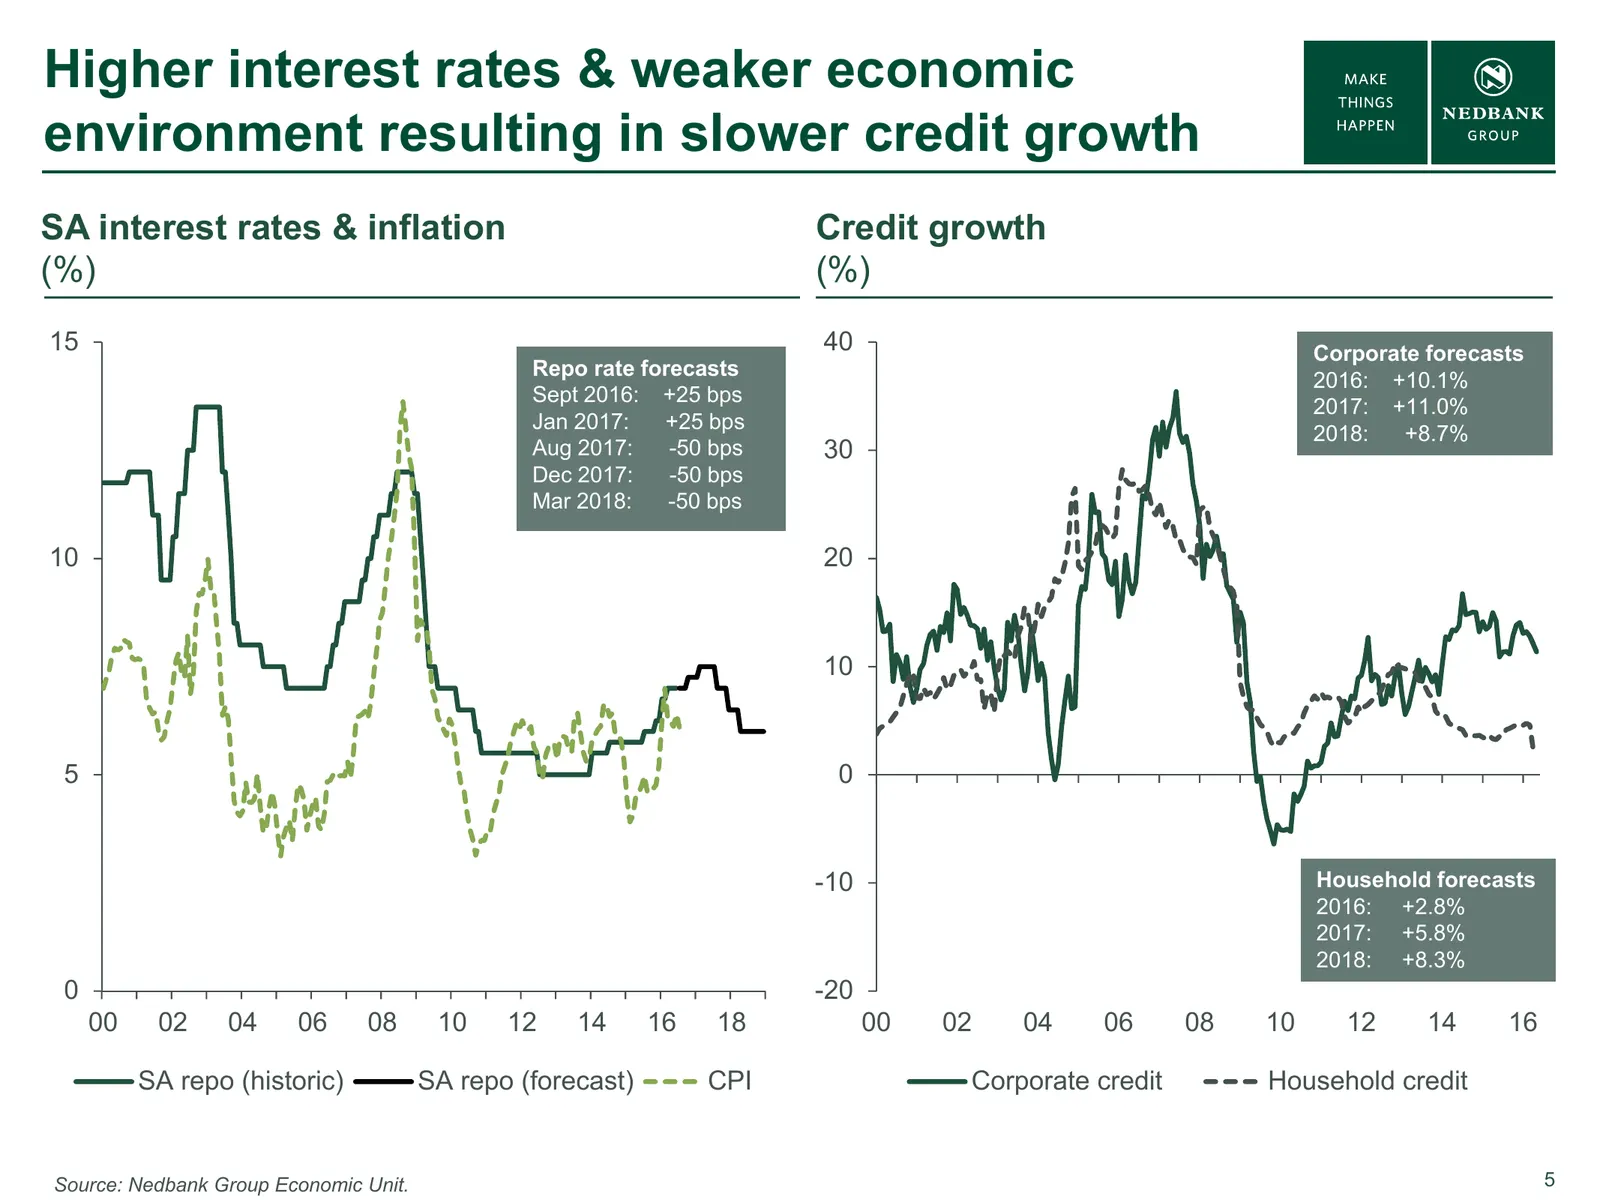
Higher interest rates & weaker economic environment resulting in slower credit growth SA interest rates & inflation Credit growth (%) (%) 15 40 Corporate forecasts Repo rate forecasts 2016: +10.1% Sept 2016: +25 bps 2017: +11.0% Jan 2017: +25 bps 2018: +8.7% Aug 2017: -50 bps 30 Dec 2017: -50 bps Ma
Slide 6: Strategic highlights: Client-centred innovation
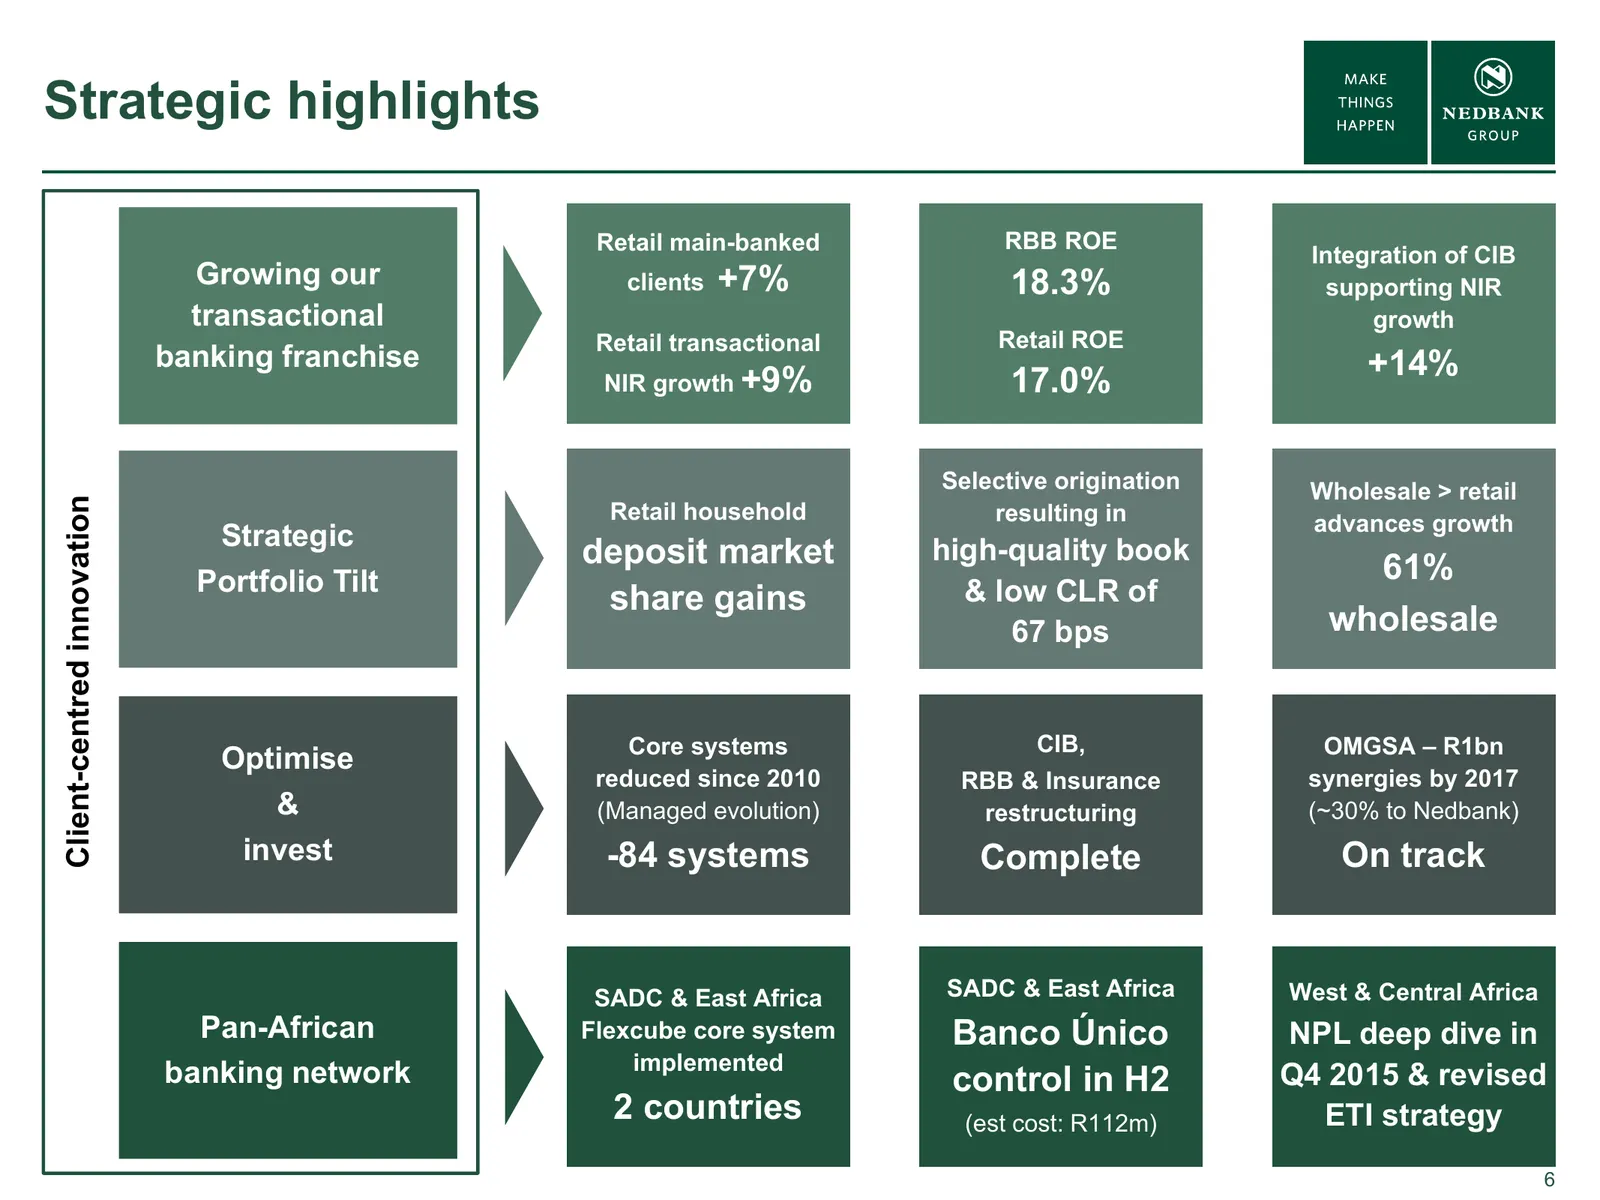
Strategic highlights Retail main-banked RBB ROE Integration of CIB Growing our clients +7% 18.3% supporting NIR transactional growth Retail transactional Retail ROE banking franchise +14% NIR growth +9% 17.0% Selective origination Wholesale > retail Client-centred innovation Retail household resulti
Slide 7: Delivering value to all stakeholders
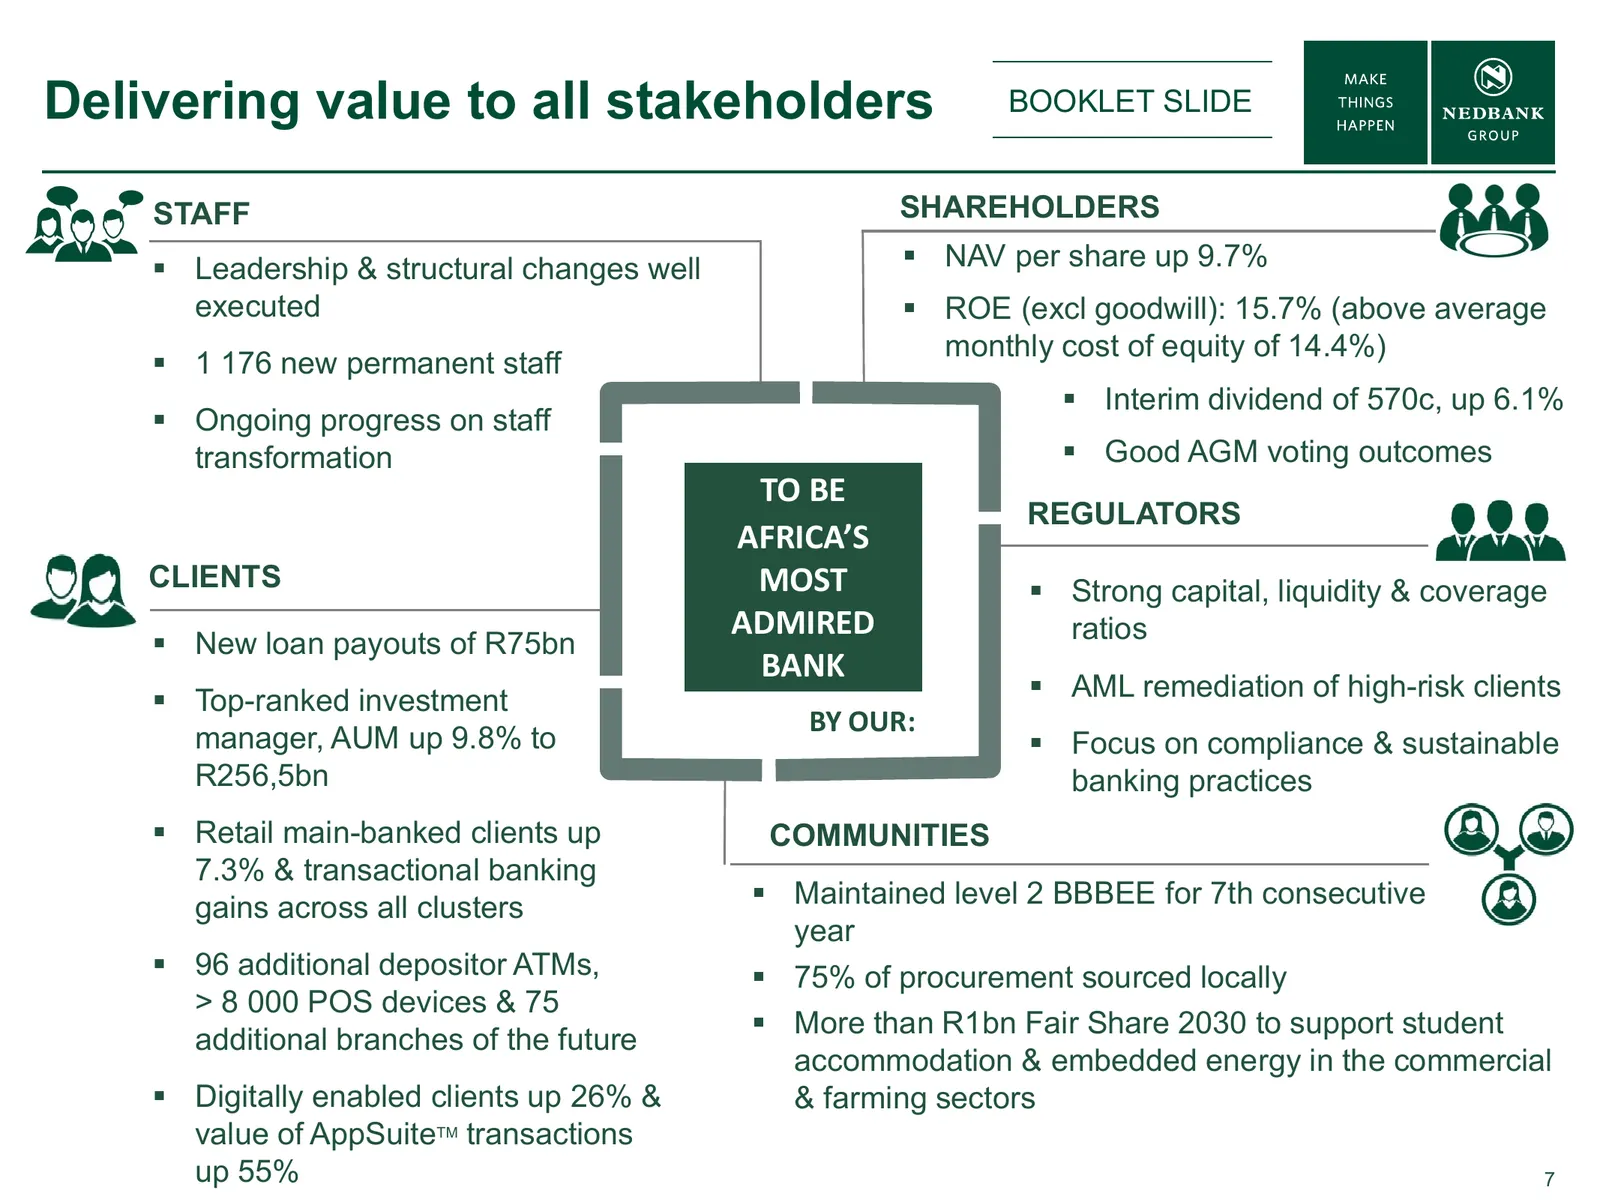
Delivering value to all stakeholders BOOKLET SLIDE STAFF SHAREHOLDERS Leadership & structural changes well NAV per share up 9.7% executed ROE (excl goodwill): 15.7% (above average monthly cost of equity of 14.4%) 1 176 new permanent staff Interim dividend of 570c, up 6.1% Ongoing progres
Slide 8: Delivering value to shareholders
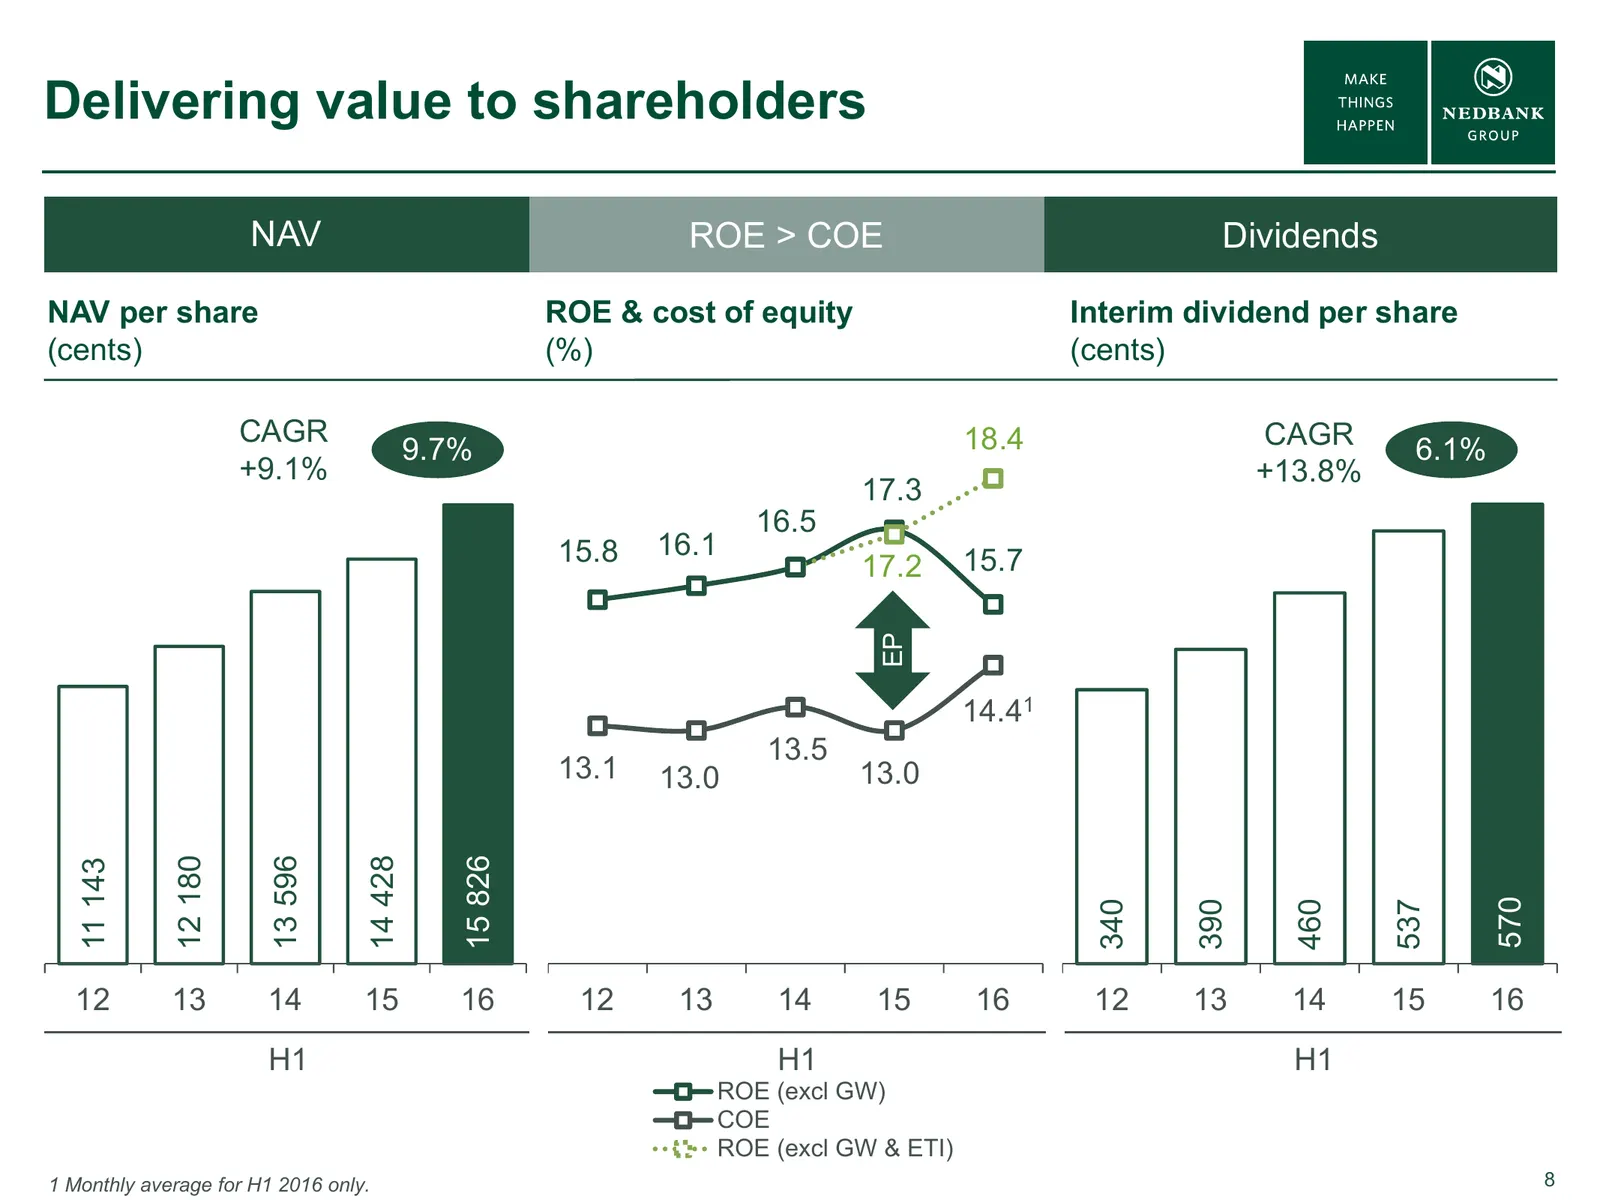
Delivering value to shareholders NAV ROE > COE Dividends NAV per share ROE & cost of equity Interim dividend per share (cents) (%) (cents) CAGR 18.4 CAGR 9.7% 6.1% +9.1% +13.8% 17.3 16.5 15.8 16.1 17.2 15.7 EP 14.41 13.5 13.1 13.0 13.0 12 180 13 596 14 428 15 826 11 143 570 340 390 460 537 12 13 14
Slide 9: Financial Overview
FINANCIAL OVERVIEW RAISIBE MORATHI Strong revenue growth & well- managed risk environment.
Slide 10: Growth driven by strong revenue performance & good credit risk management
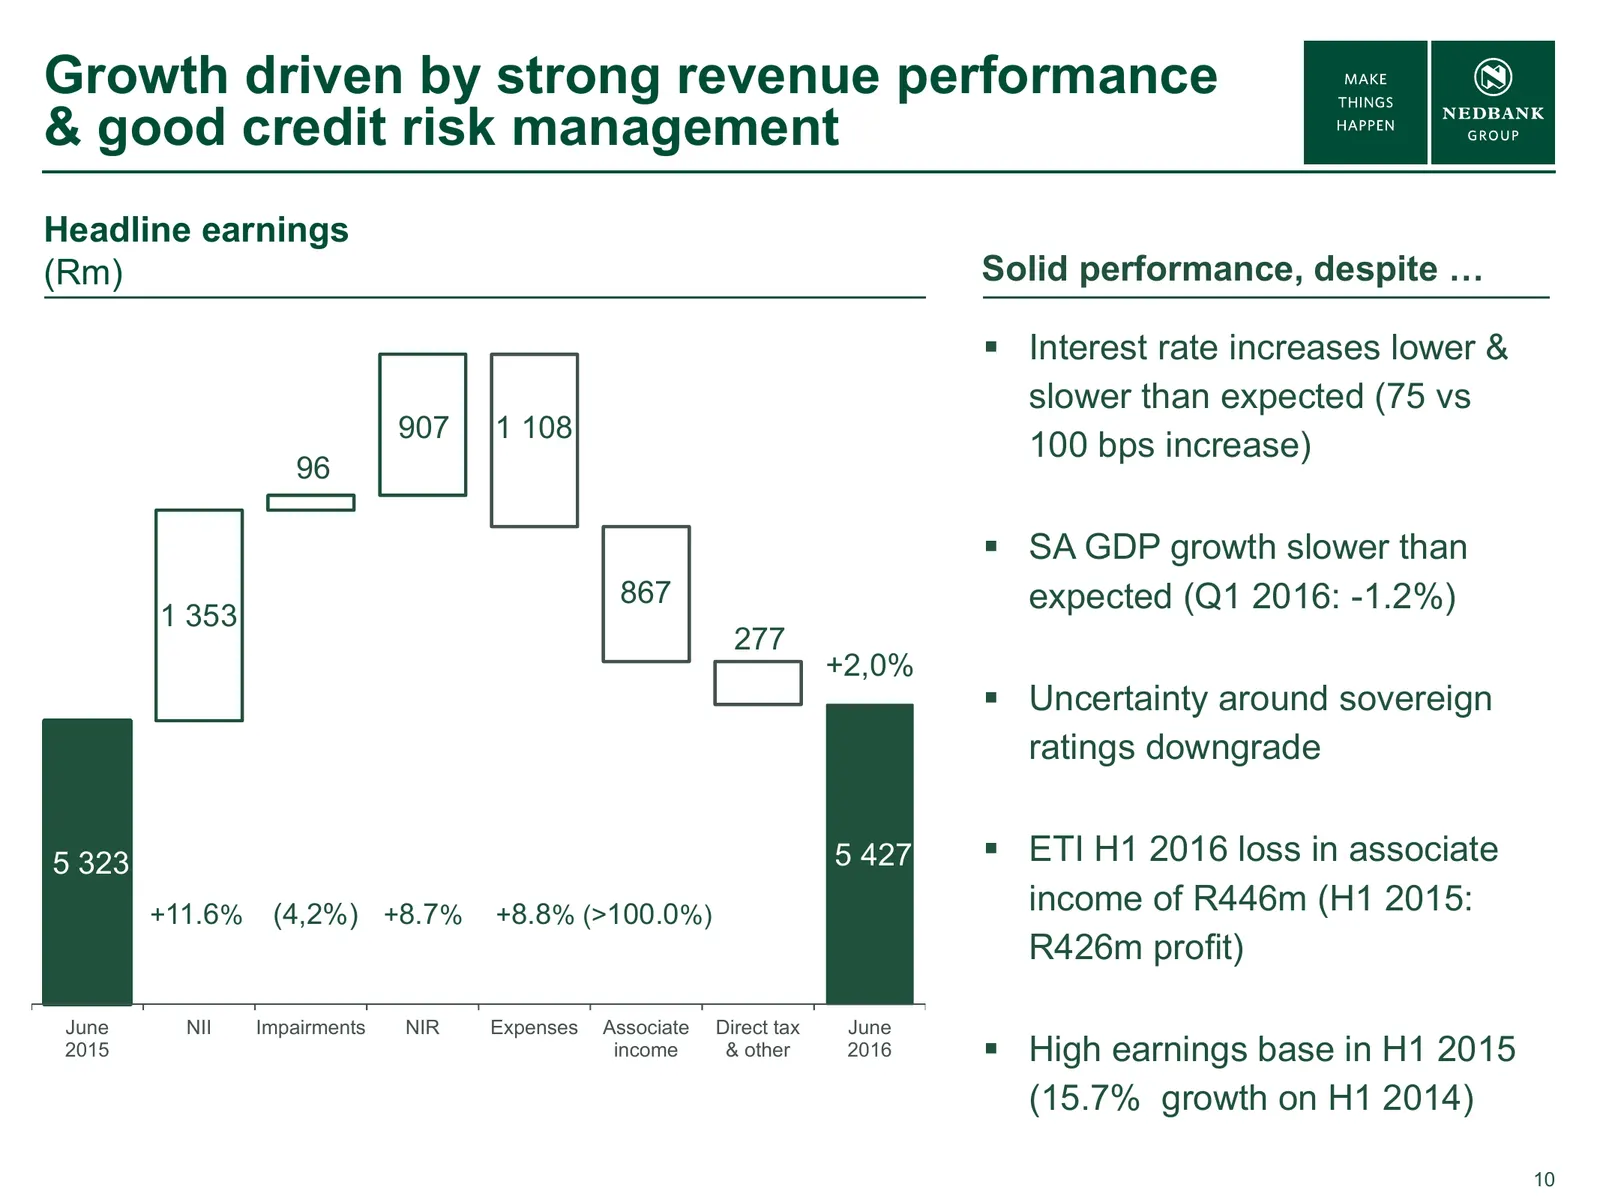
Growth driven by strong revenue performance & good credit risk management Headline earnings (Rm) Solid performance, despite … Interest rate increases lower & slower than expected (75 vs 907 1 108 100 bps increase) 96 SA GDP growth slower than 867 expected (Q1 2016: -1.2%) 1 353 277 +2,0% Uncer
Slide 11: Key performance indicators
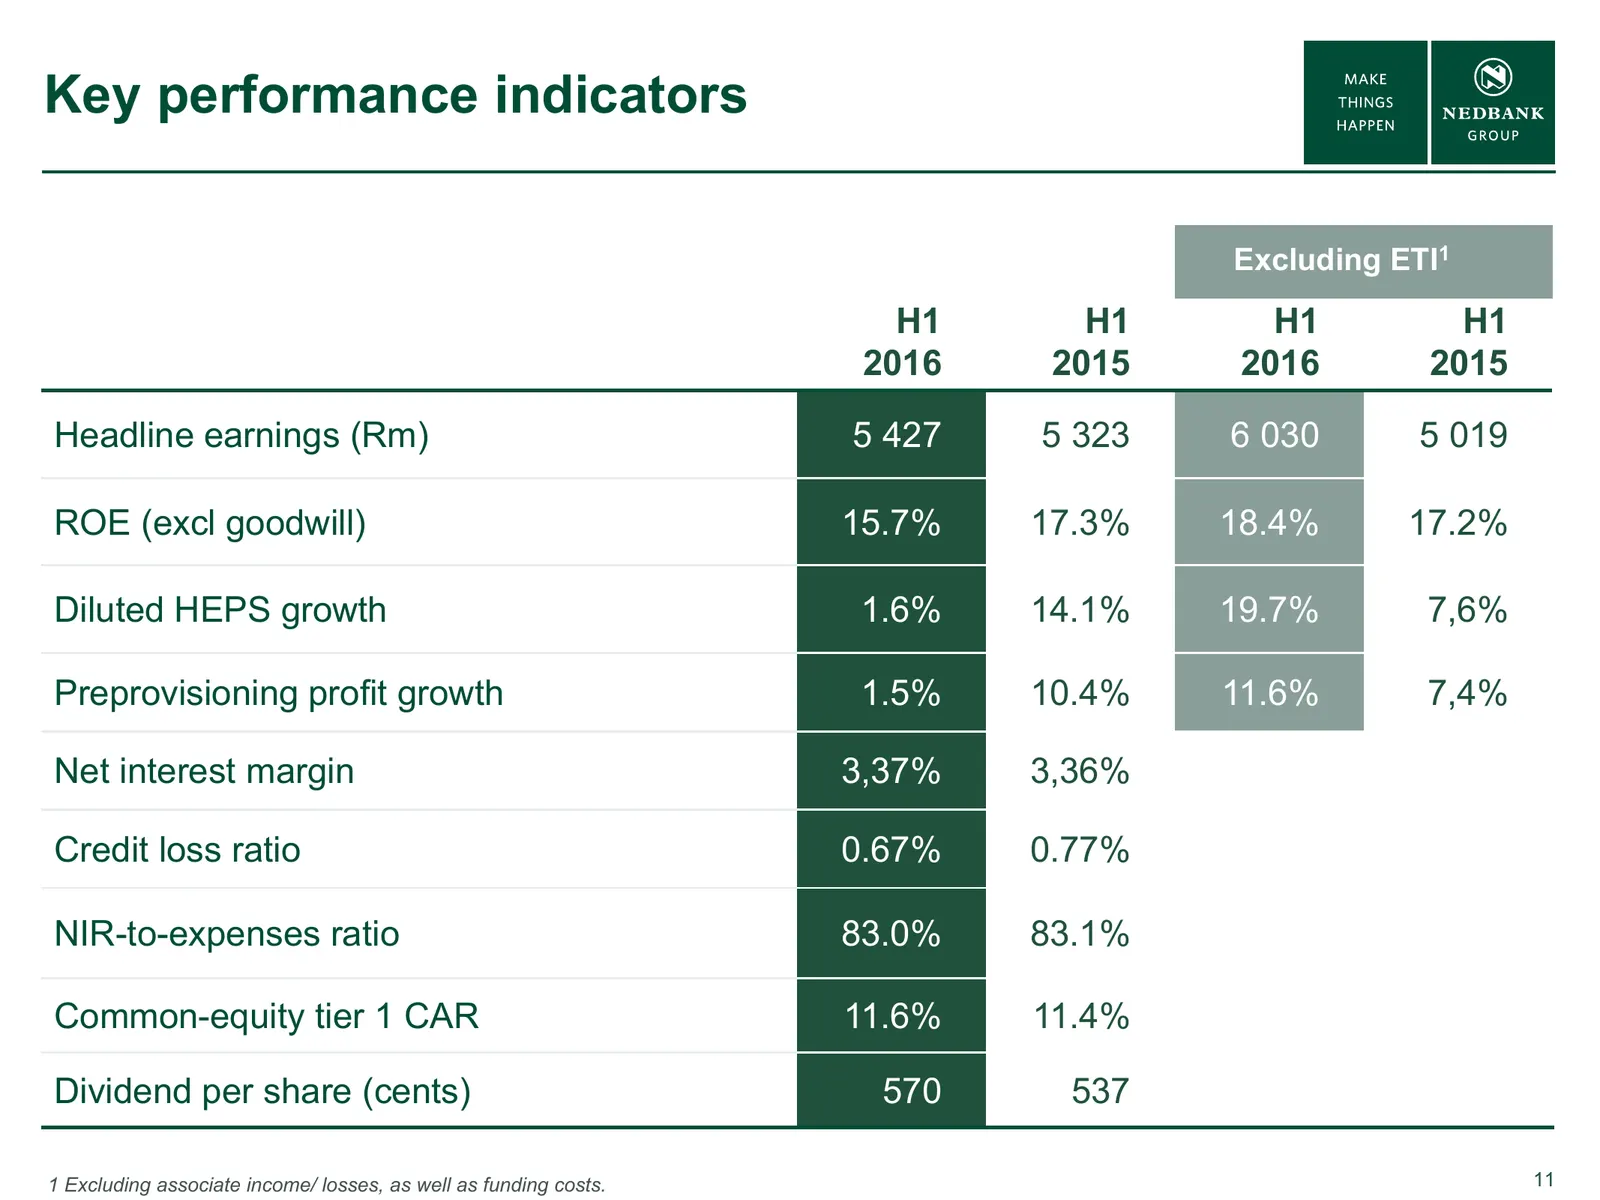
Key performance indicators Excluding ETI1 H1 H1 H1 H1 2016 2015 2016 2015 Headline earnings (Rm) 5 427 5 323 6 030 5 019 ROE (excl goodwill) 15.7% 17.3% 18.4% 17.2% Diluted HEPS growth 1.6% 14.1% 19.7% 7,6% Preprovisioning profit growth 1.5% 10.4% 11.6% 7,4% Net interest margin 3,37% 3,36% Credit lo
Slide 12: Adjusted ROE, excluding ETI, continued to increase & gearing reduced further
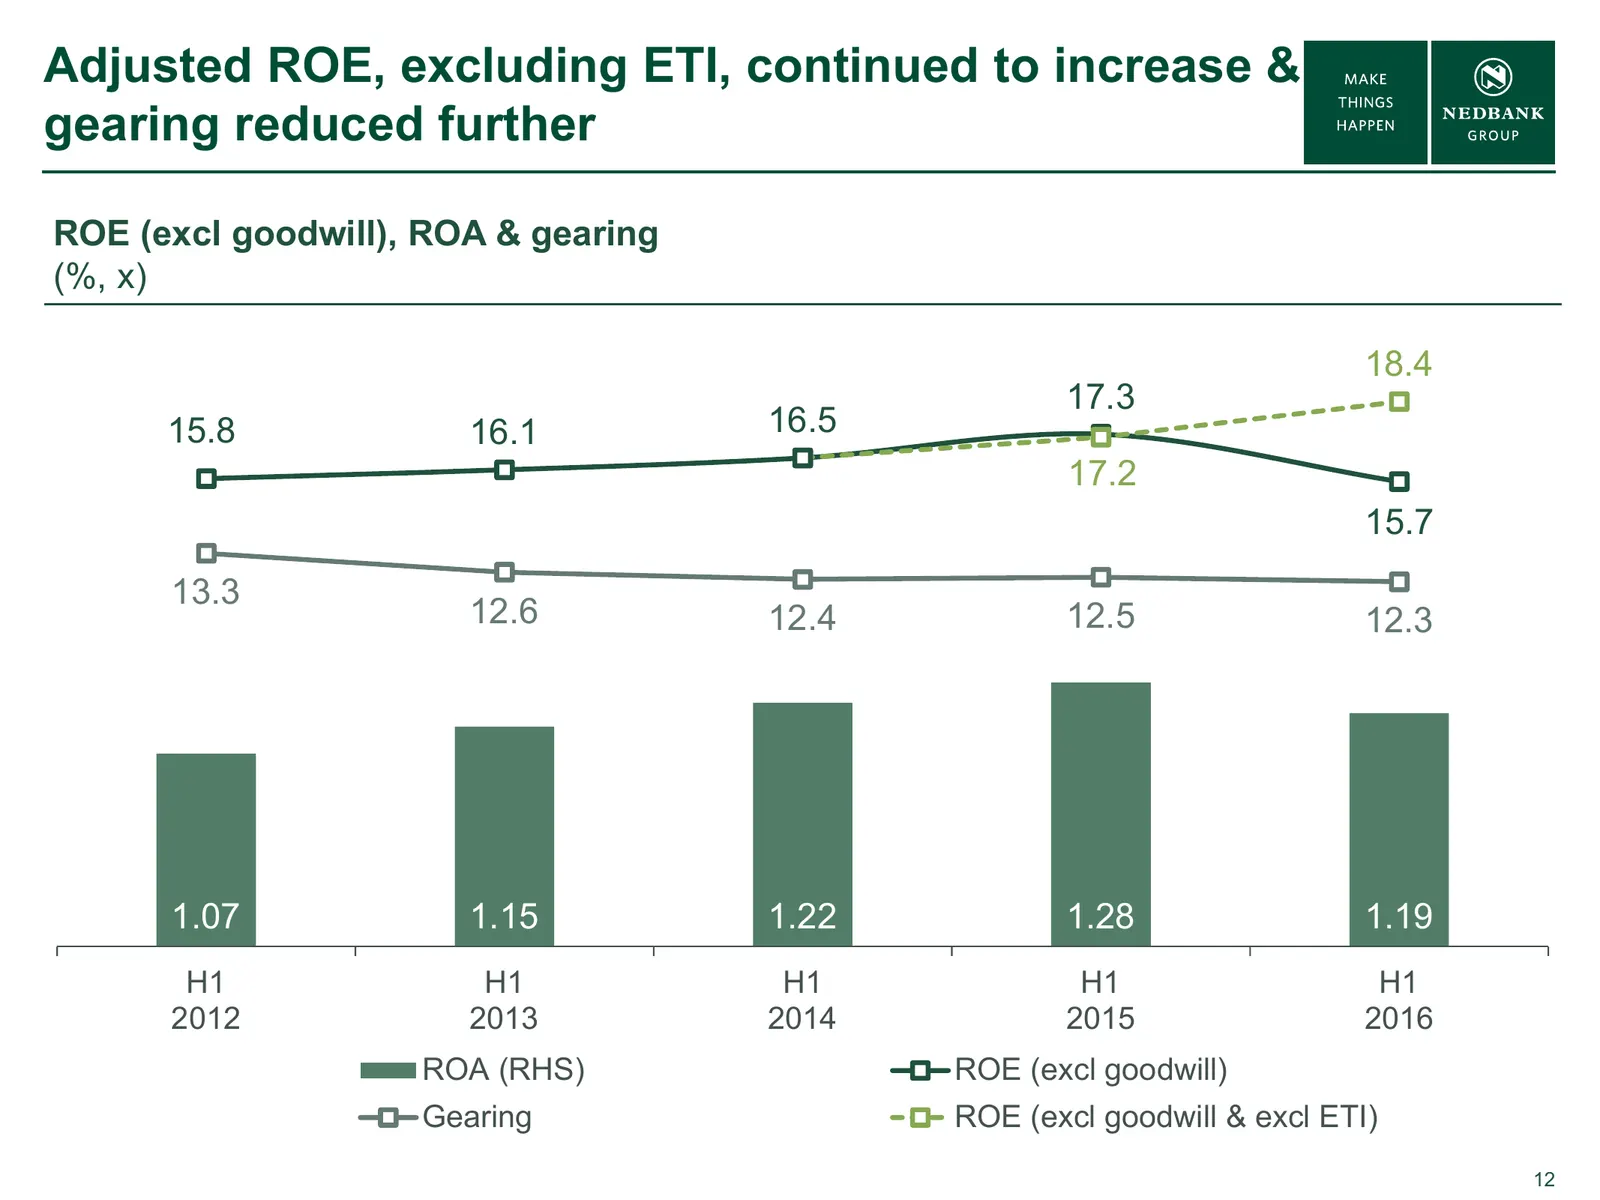
Adjusted ROE, excluding ETI, continued to increase & gearing reduced further ROE (excl goodwill), ROA & gearing (%, x) 18.4 20 17.3 15.8 16.5 18 16.1 2 16 17.2 14 15.7 12 13.3 12.6 12.4 12.5 12.3 1.5 10 8 6 1 4 2 1.07 1.15 1.22 1.28 1.19 0 0.5 H1 H1 H1 H1 H1 2012 2013 2014 2015 2016 ROA (RHS) ROE (e
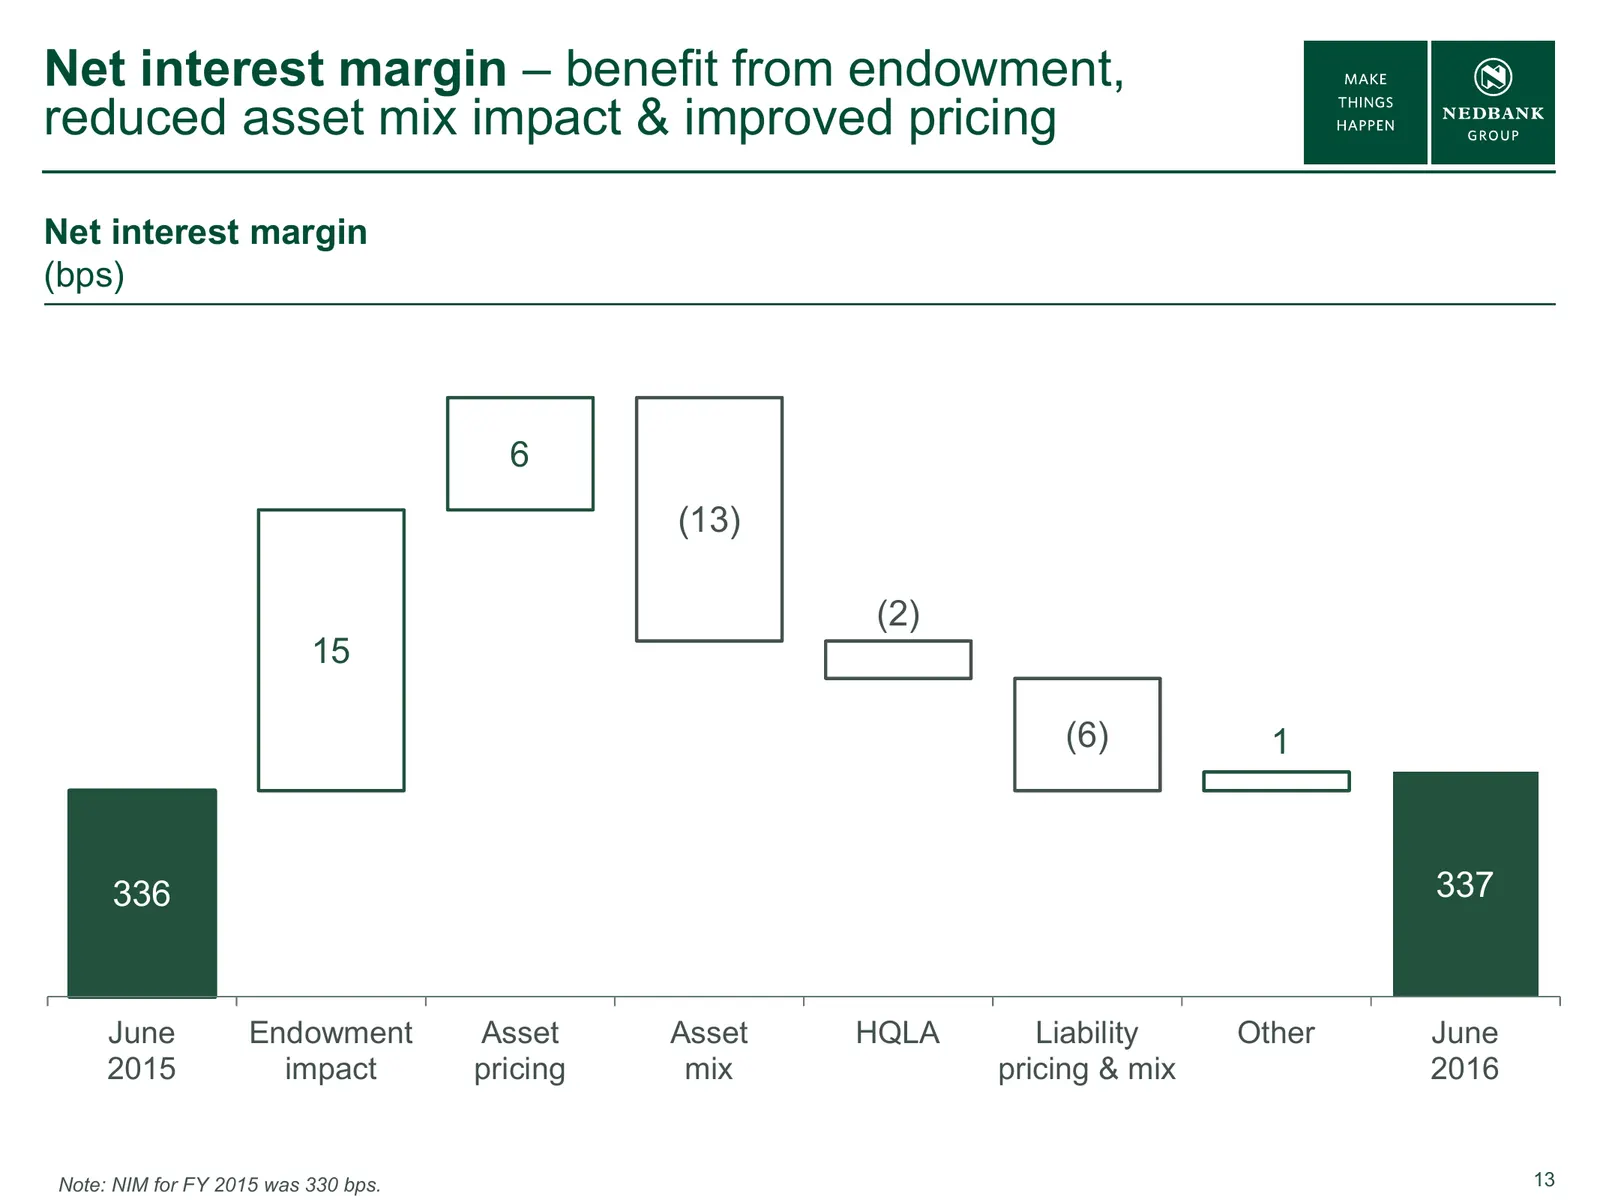
Slide 13: Net interest margin – benefit from endowment, reduced asset mix impact & improved pricing
Net interest margin – benefit from endowment, reduced asset mix impact & improved pricing Net interest margin (bps) 6 (13) (2) 15 (6) 1 336 334 337 June Endowment Asset Asset HQLA Liability Other June 2015 impact pricing mix pricing & mix 2016 Note: NIM for FY 2015 was 330 bps. 13
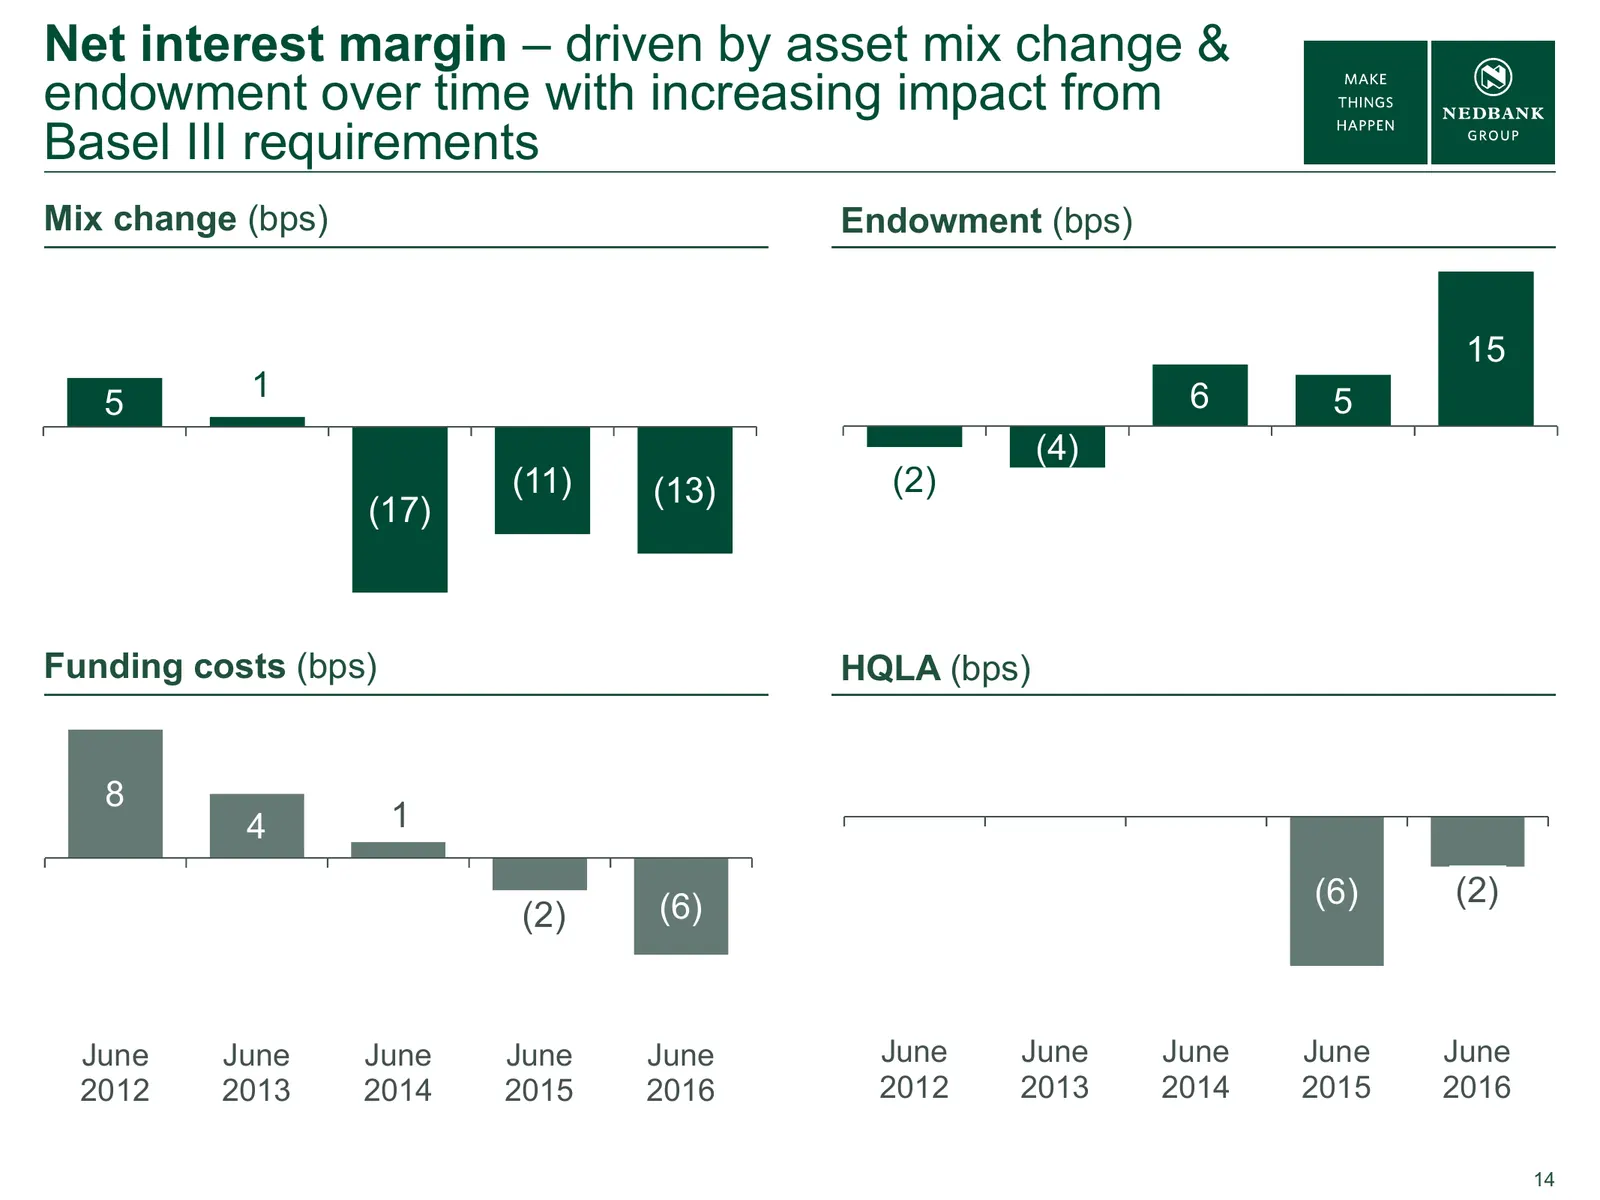
Slide 14: Net interest margin – driven by asset mix change & endowment over time
Net interest margin – driven by asset mix change & endowment over time with increasing impact from Basel III requirements Mix change (bps) Endowment (bps) 15 1 6 5 5 (4) (11) (13) (2) (17) Funding costs (bps) HQLA (bps) 8 4 1 (6) (6) (2) (2) June June June June June June June June June June 2012 201
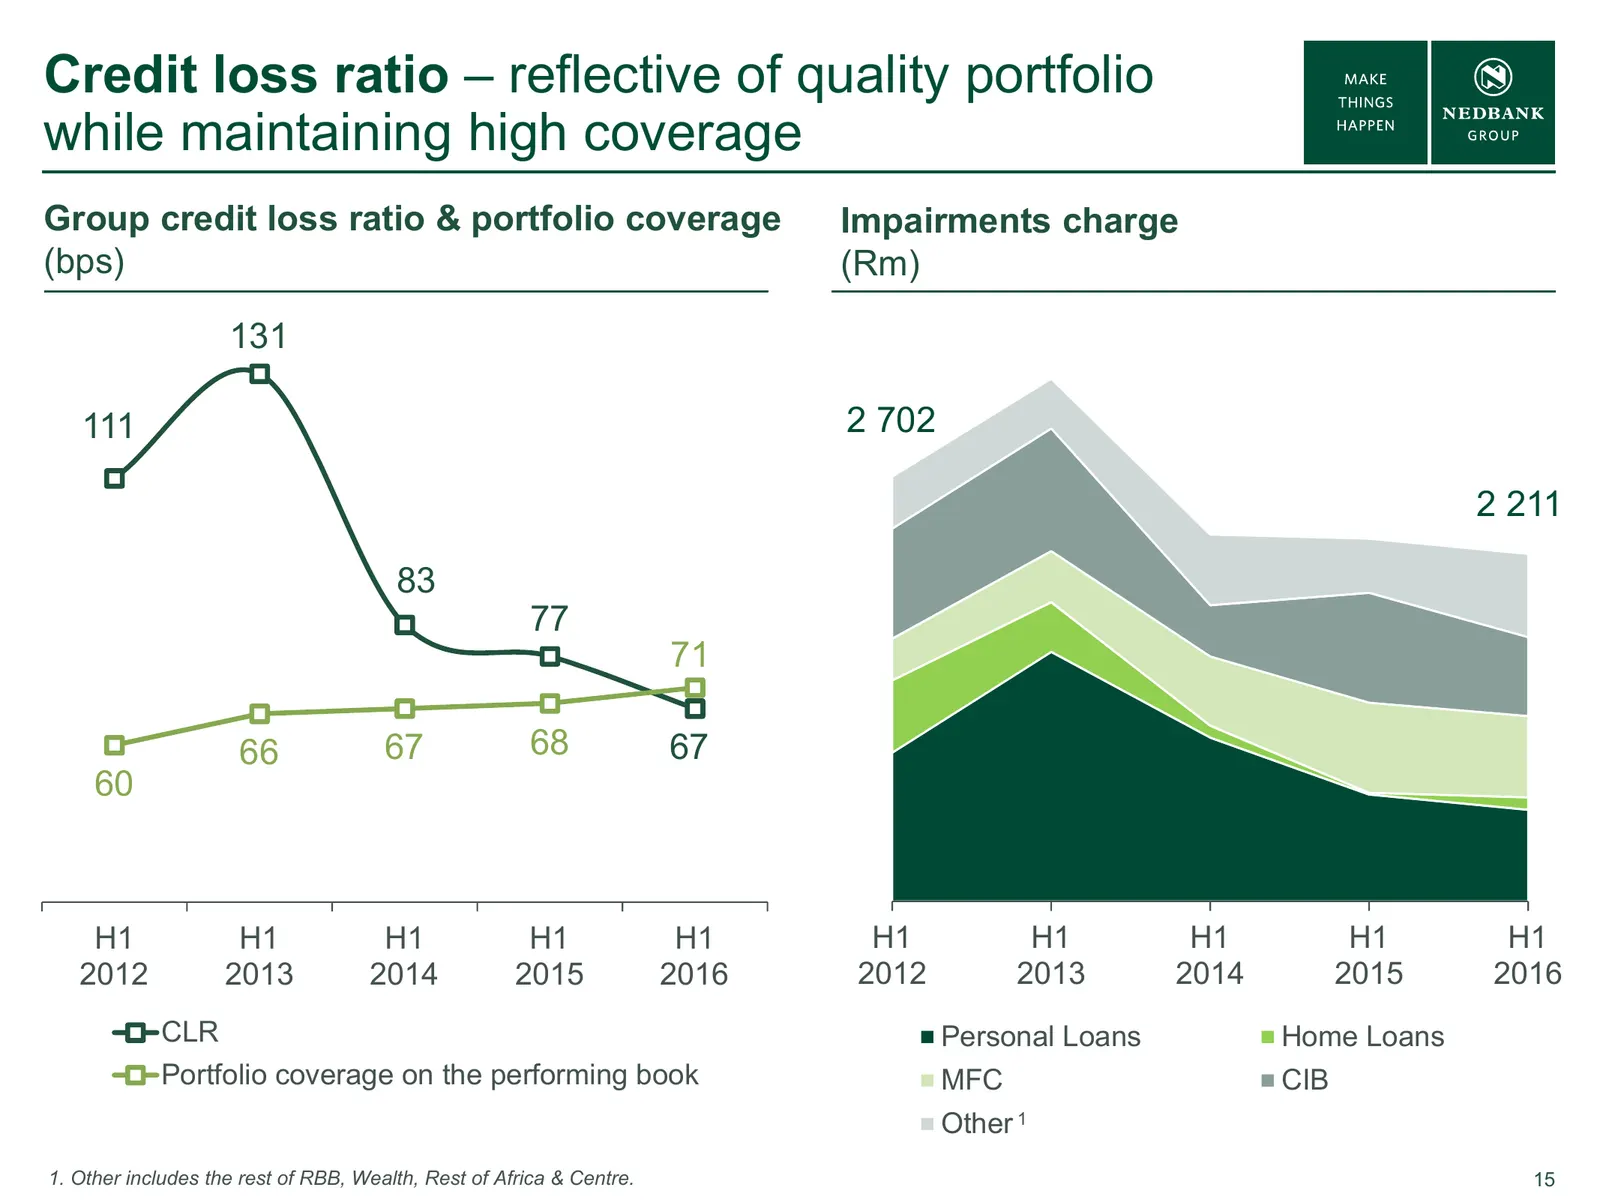
Slide 15: Credit loss ratio – reflective of quality portfolio while maintaining high coverage
Credit loss ratio – reflective of quality portfolio while maintaining high coverage Group credit loss ratio & portfolio coverage Impairments charge (bps) (Rm) 131 111 2 702 2 211 83 77 71 66 67 68 67 60 H1 H1 H1 H1 H1 H1 H1 H1 H1 H1 2012 2013 2014 2015 2016 2012 2013 2014 2015 2016 CLR Personal Loan
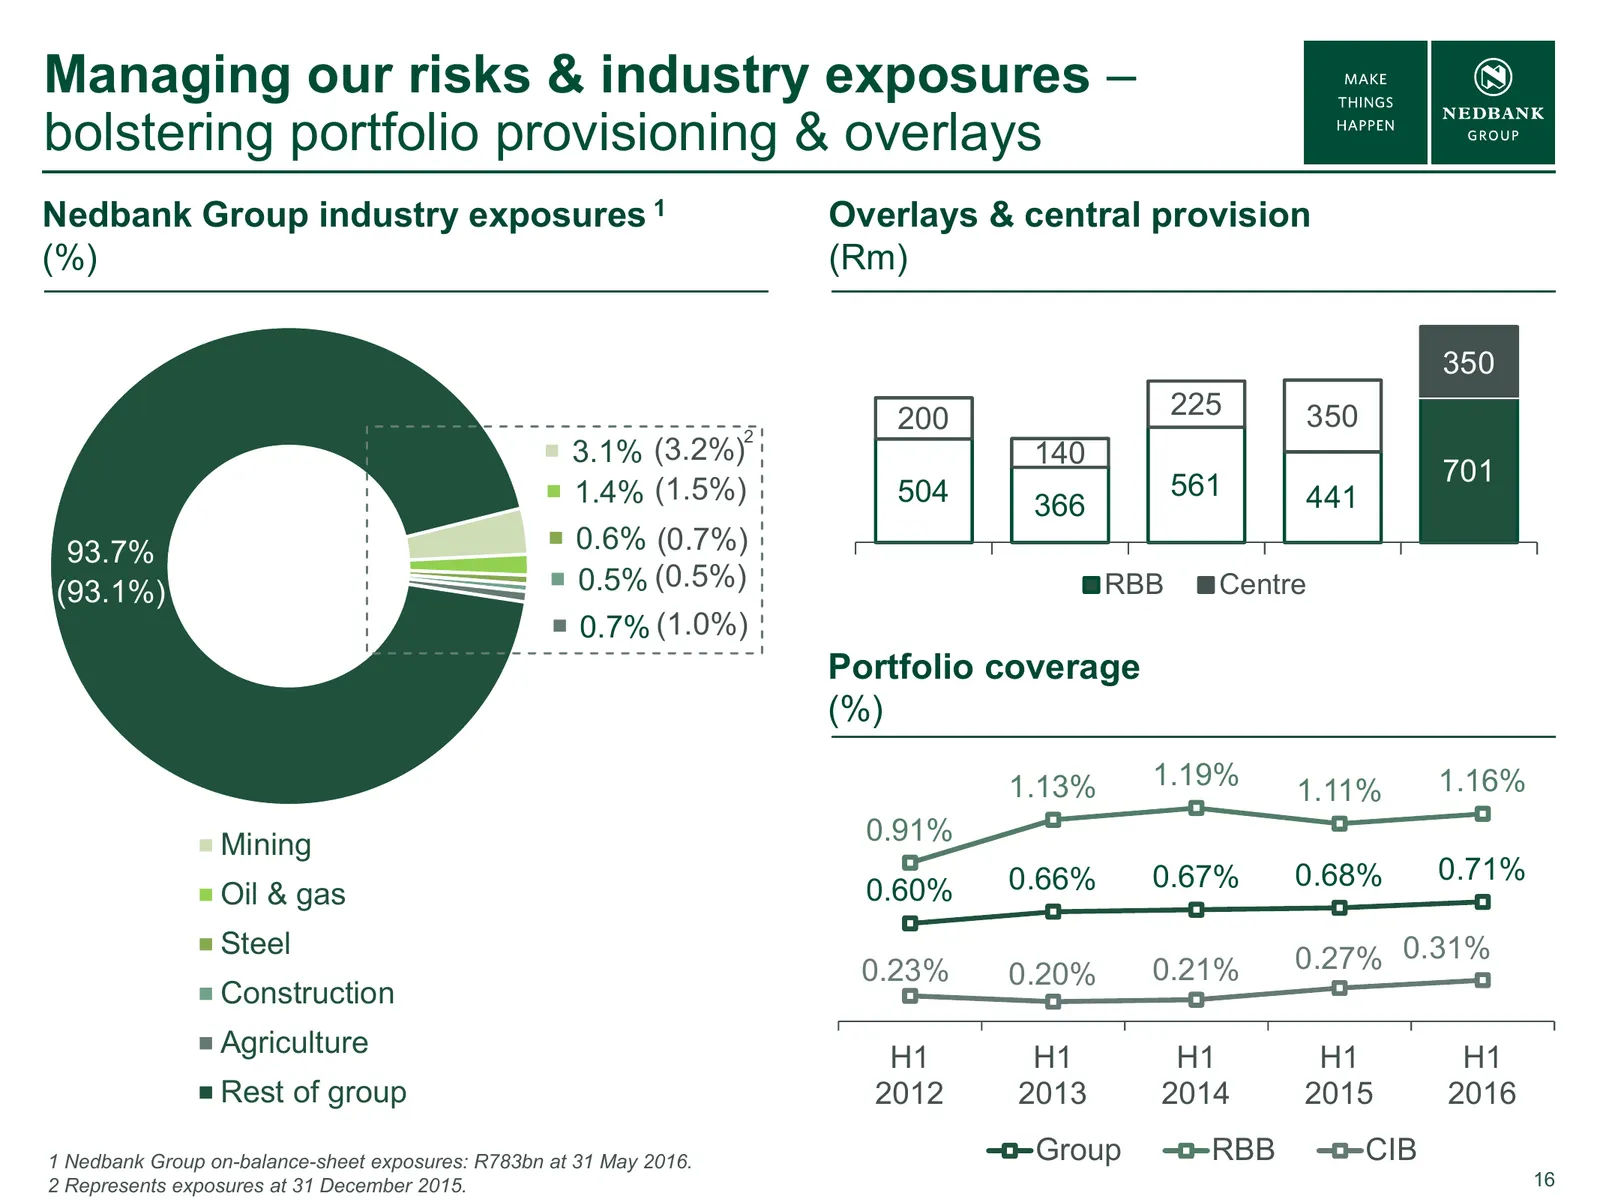
Slide 16: Managing our risks & industry exposures
Managing our risks & industry exposures – bolstering portfolio provisioning & overlays Nedbank Group industry exposures 1 Overlays & central provision (%) (Rm) 350 200 225 350 2 3.1% (3.2%) 140 561 701 1.4% (1.5%) 504 366 441 93.7% 0.6% (0.7%) (93.1%) 0.5% (0.5%) RBB Centre 0.7% (1.0%) Portfolio cov
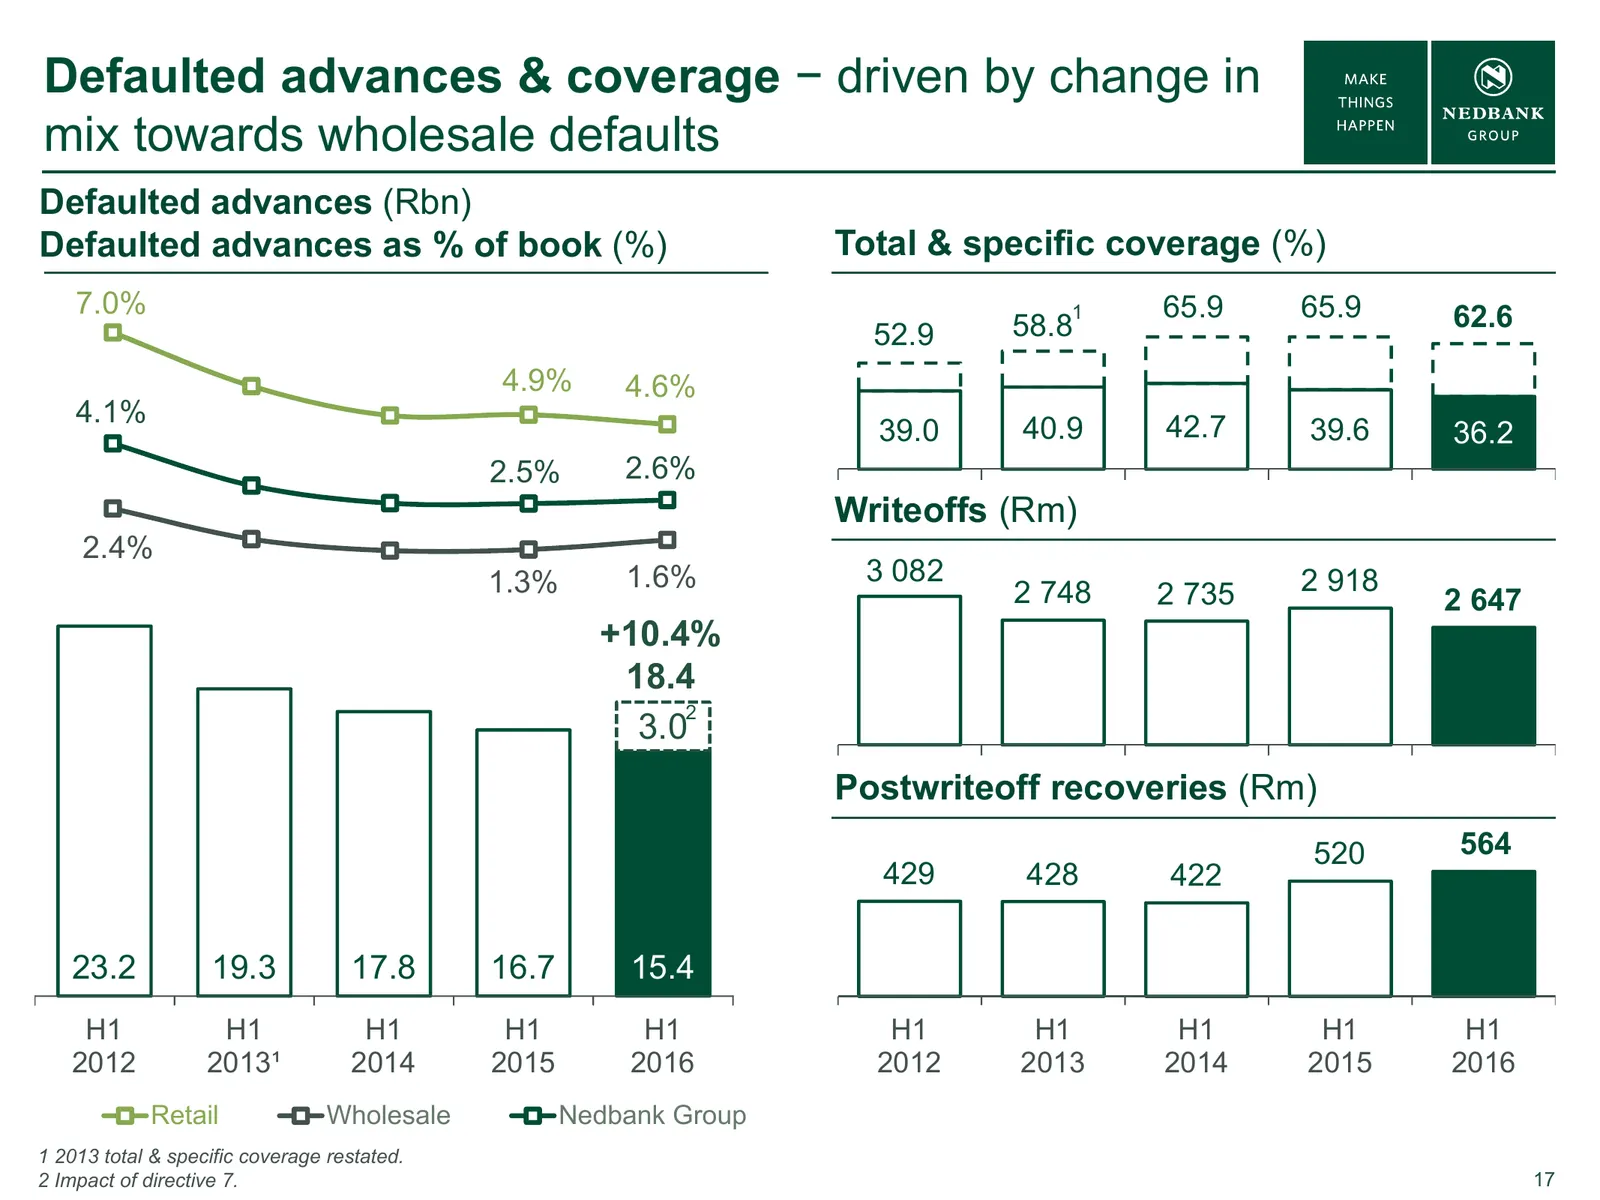
Slide 17: Defaulted advances & coverage
Defaulted advances & coverage − driven by change in mix towards wholesale defaults Defaulted advances (Rbn) Defaulted advances as % of book (%) Total & specific coverage (%) 7.0% 1 65.9 65.9 62.6 52.9 58.8 4.9% 4.6% 4.1% 42.7 39.0 40.9 39.6 36.2 2.5% 2.6% Writeoffs (Rm) 2.4% 1.3% 1.6% 3 082 2 918 2
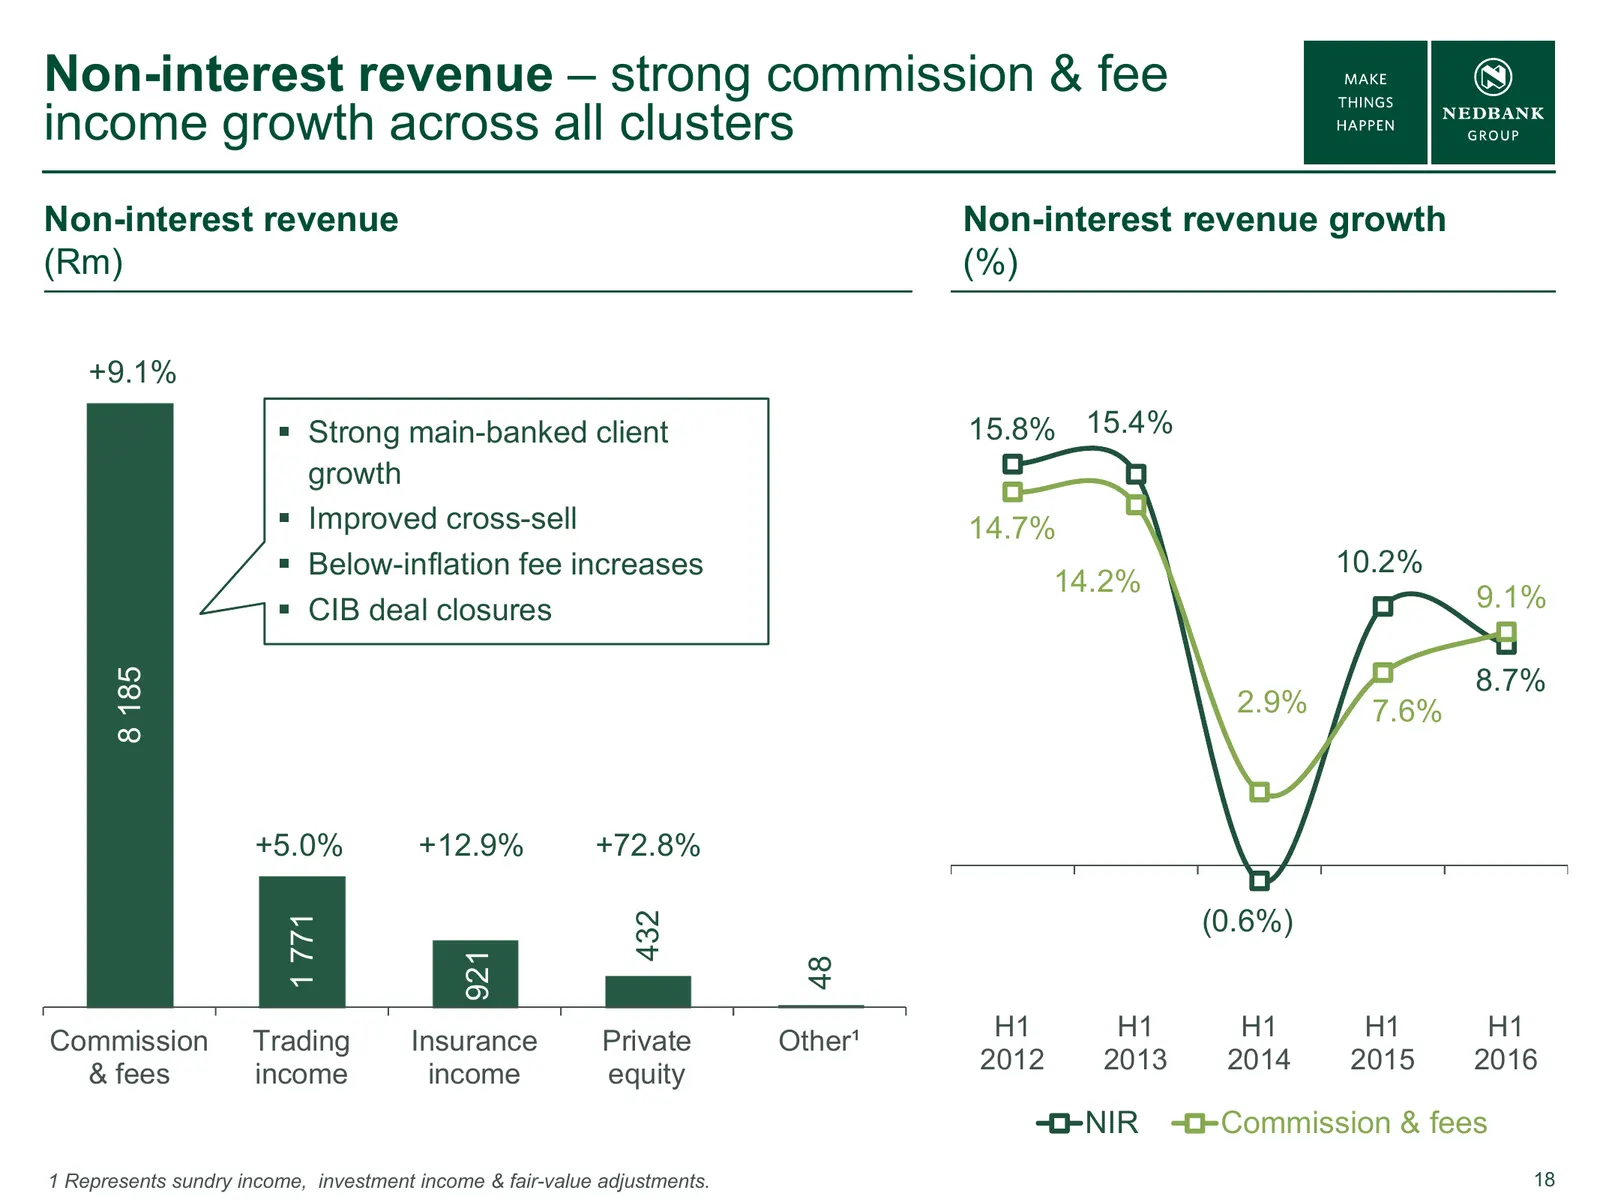
Slide 18: Non-interest revenue – strong commission & fee income growth
Non-interest revenue – strong commission & fee income growth across all clusters Non-interest revenue Non-interest revenue growth (Rm) (%) +9.1% Strong main-banked client 15.8% 15.4% growth Improved cross-sell 14.7% Below-inflation fee increases 10.2% 14.2% CIB deal closures 9.1% 8.7% 8 185
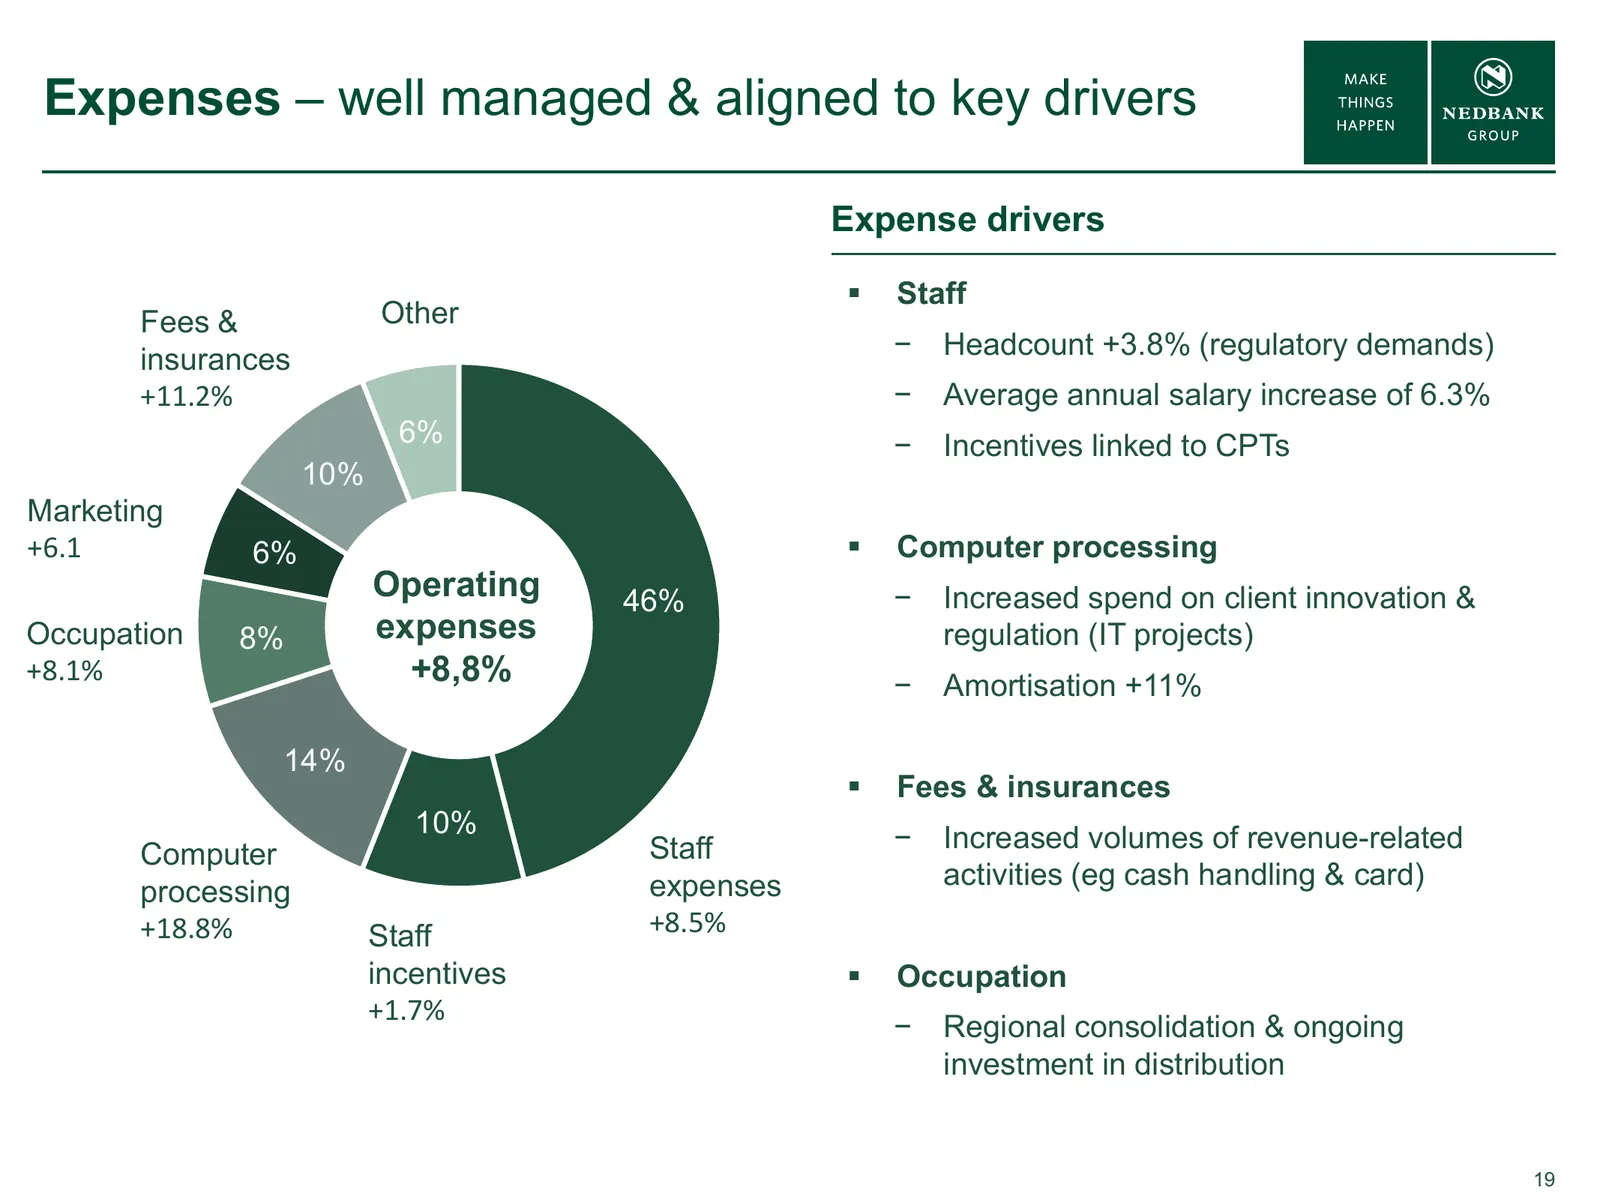
Slide 19: Expenses – well managed & aligned to key drivers
Expenses – well managed & aligned to key drivers Expense drivers Staff Fees & Other insurances − Headcount +3.8% (regulatory demands) +11.2% − Average annual salary increase of 6.3% 6% − Incentives linked to CPTs 10% Marketing +6.1 6% Computer processing Operating 46% − Increased spend on client
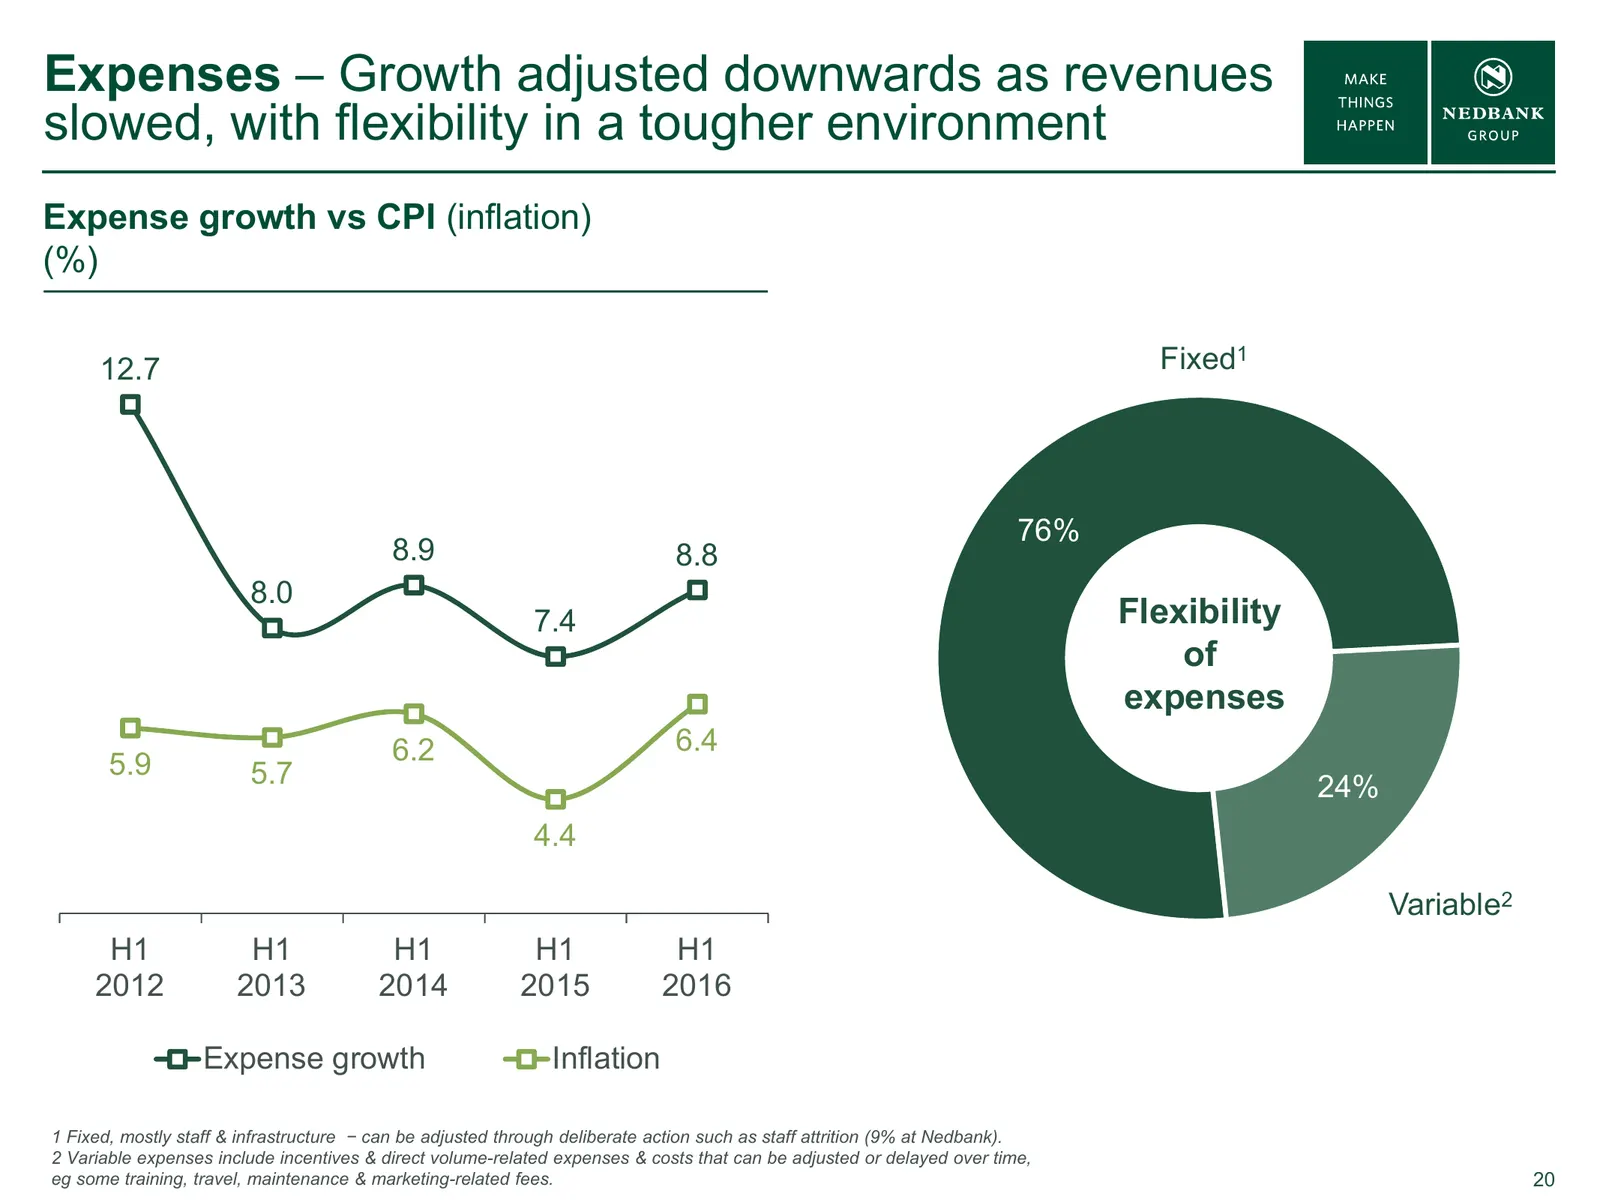
Slide 20: Expenses – growth adjusted downwards as revenues slowed
Expenses – Growth adjusted downwards as revenues slowed, with flexibility in a tougher environment Expense growth vs CPI (inflation) (%) 12.7 Fixed1 76% 8.9 8.8 8.0 7.4 Flexibility of expenses 6.2 6.4 5.9 5.7 24% 4.4 Variable2 H1 H1 H1 H1 H1 2012 2013 2014 2015 2016 Expense growth Inflation 1 Fixed,
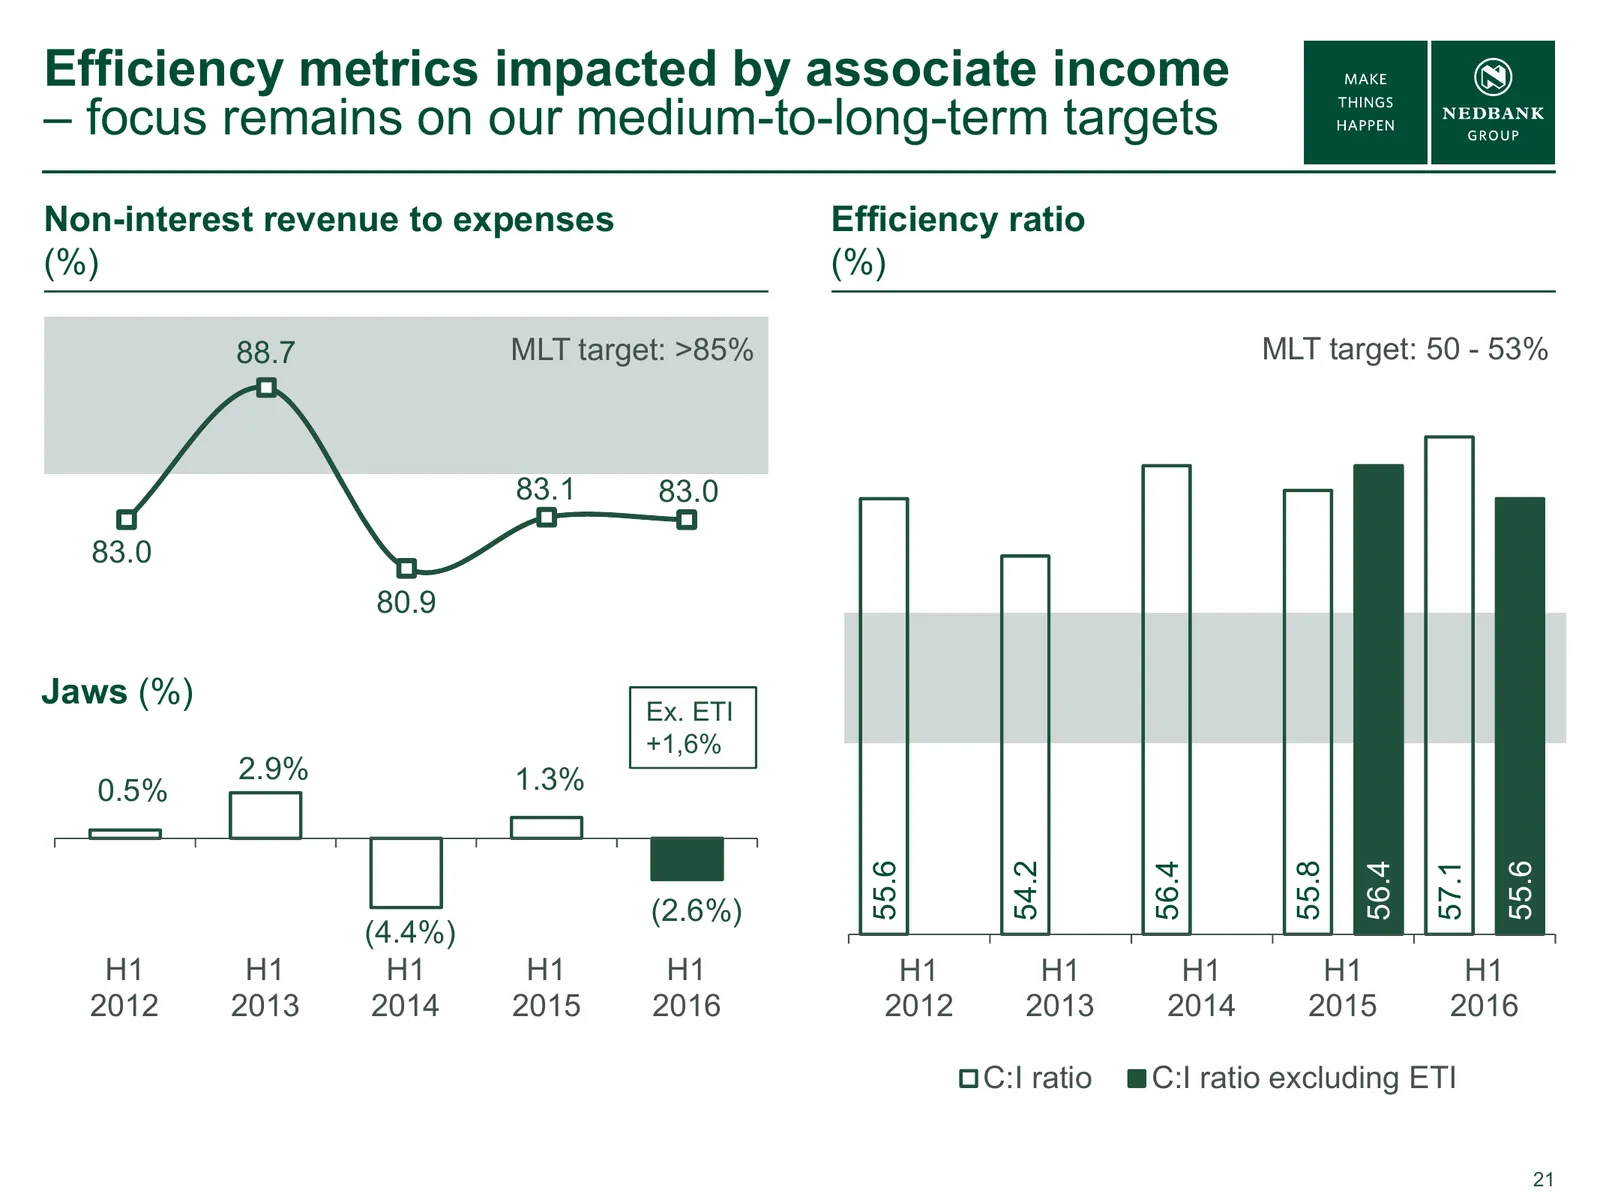
Slide 21: Efficiency metrics impacted by associate income
Efficiency metrics impacted by associate income – focus remains on our medium-to-long-term targets Non-interest revenue to expenses Efficiency ratio (%) (%) 88.7 MLT target: >85% MLT target: 50 - 53% 83.1 83.0 83.0 80.9 Jaws (%) Ex. ETI +1,6% 2.9% 1.3% 0.5% 55.6 54.2 56.4 55.8 56.4 57.1 55.6 (2.6%)
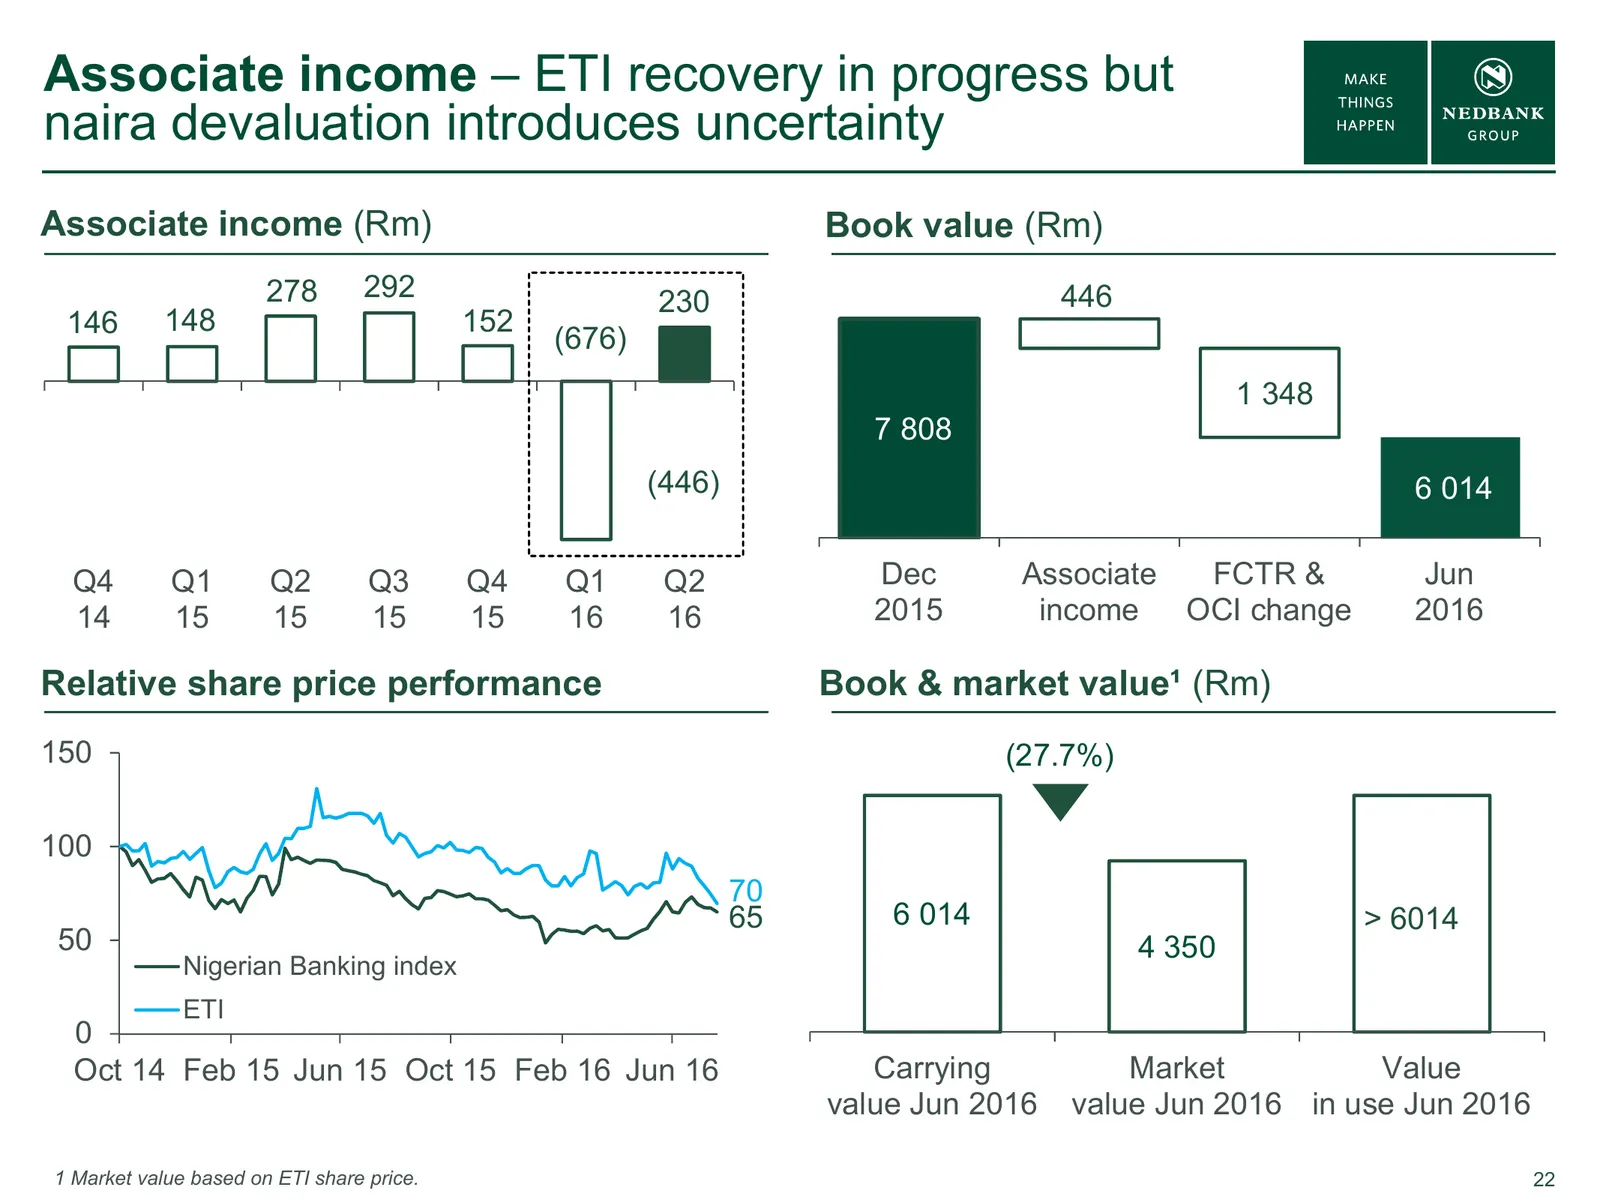
Slide 22: Associate income – ETI recovery in progress but naira devaluation introduces uncertainty
Associate income – ETI recovery in progress but naira devaluation introduces uncertainty Associate income (Rm) Book value (Rm) 278 292 230 446 146 148 152 (676) 1 348 7 808 (446) 6 014 Q4 Q1 Q2 Q3 Q4 Q1 Q2 Dec Associate FCTR & Jun 14 15 15 15 15 16 16 2015 income OCI change 2016 Relative share price
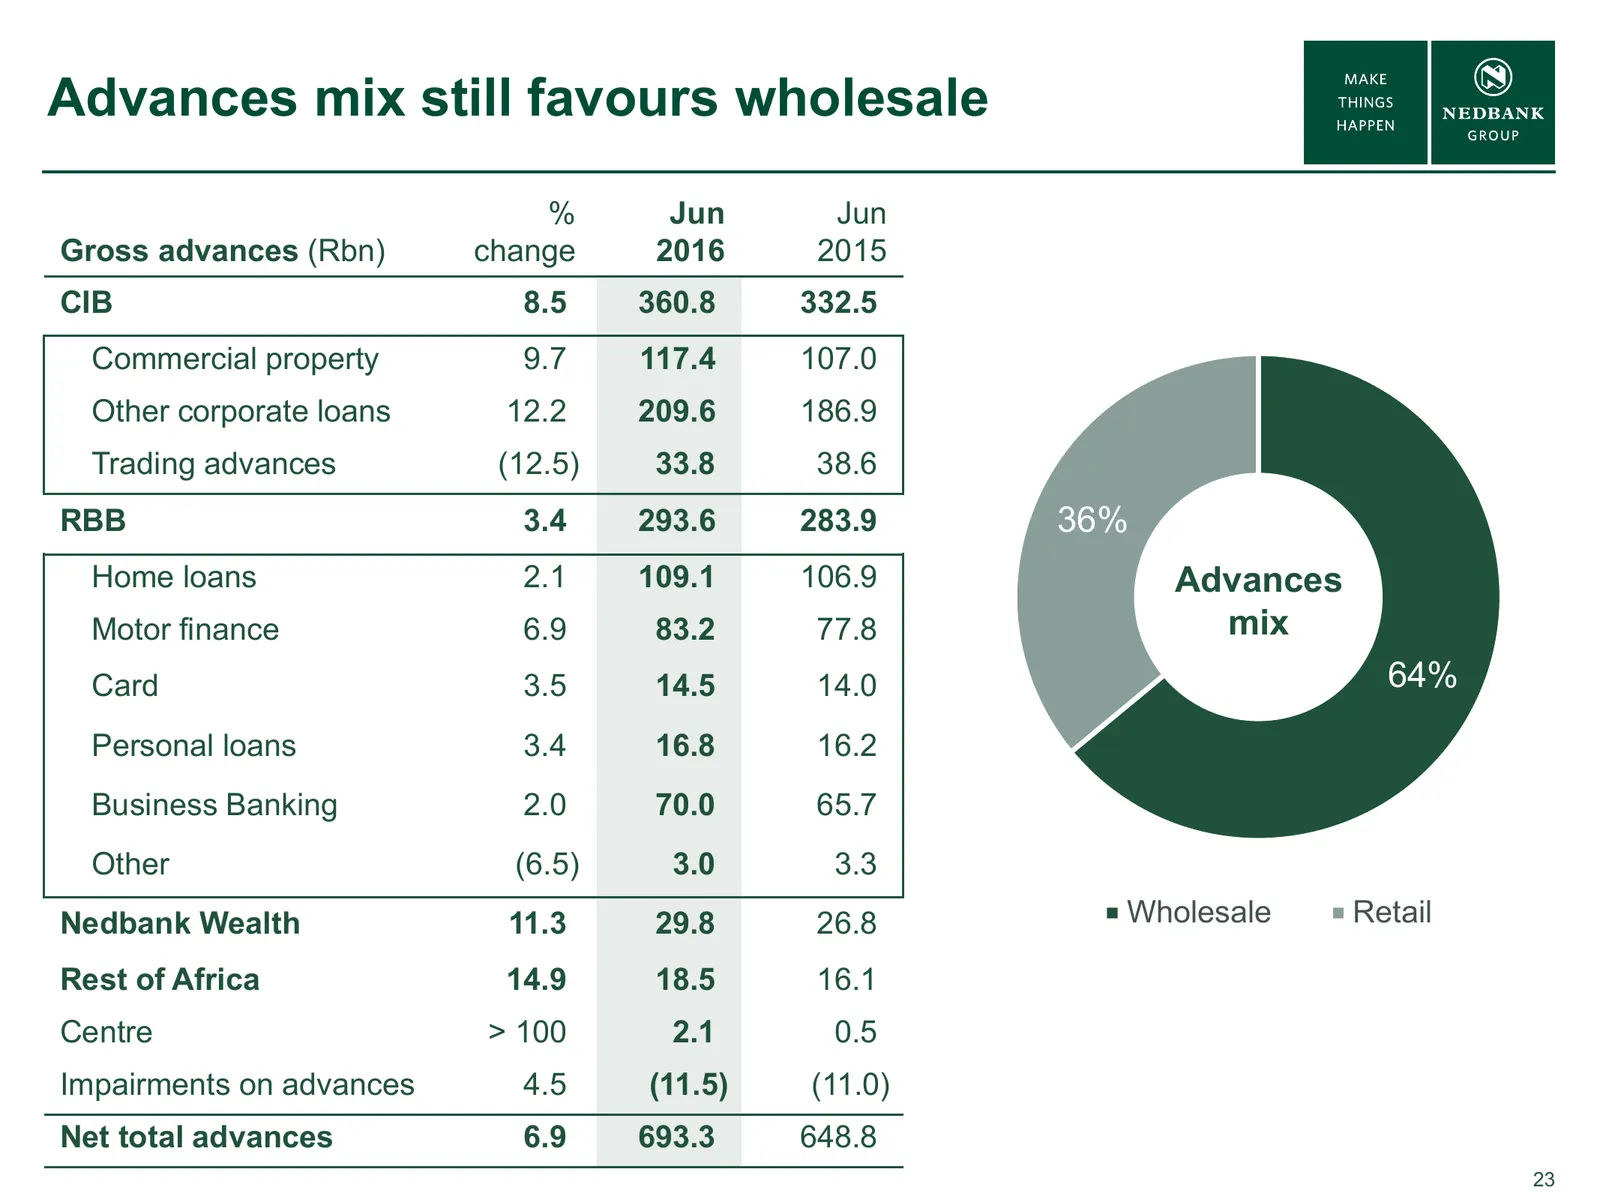
Slide 23: Advances mix still favours wholesale
Advances mix still favours wholesale % Jun Jun Gross advances (Rbn) change 2016 2015 CIB 8.5 360.8 332.5 Commercial property 9.7 117.4 107.0 Other corporate loans 12.2 209.6 186.9 Trading advances (12.5) 33.8 38.6 RBB 3.4 293.6 283.9 36% Home loans 2.1 109.1 106.9 Advances Motor finance 6.9 83.2 77.
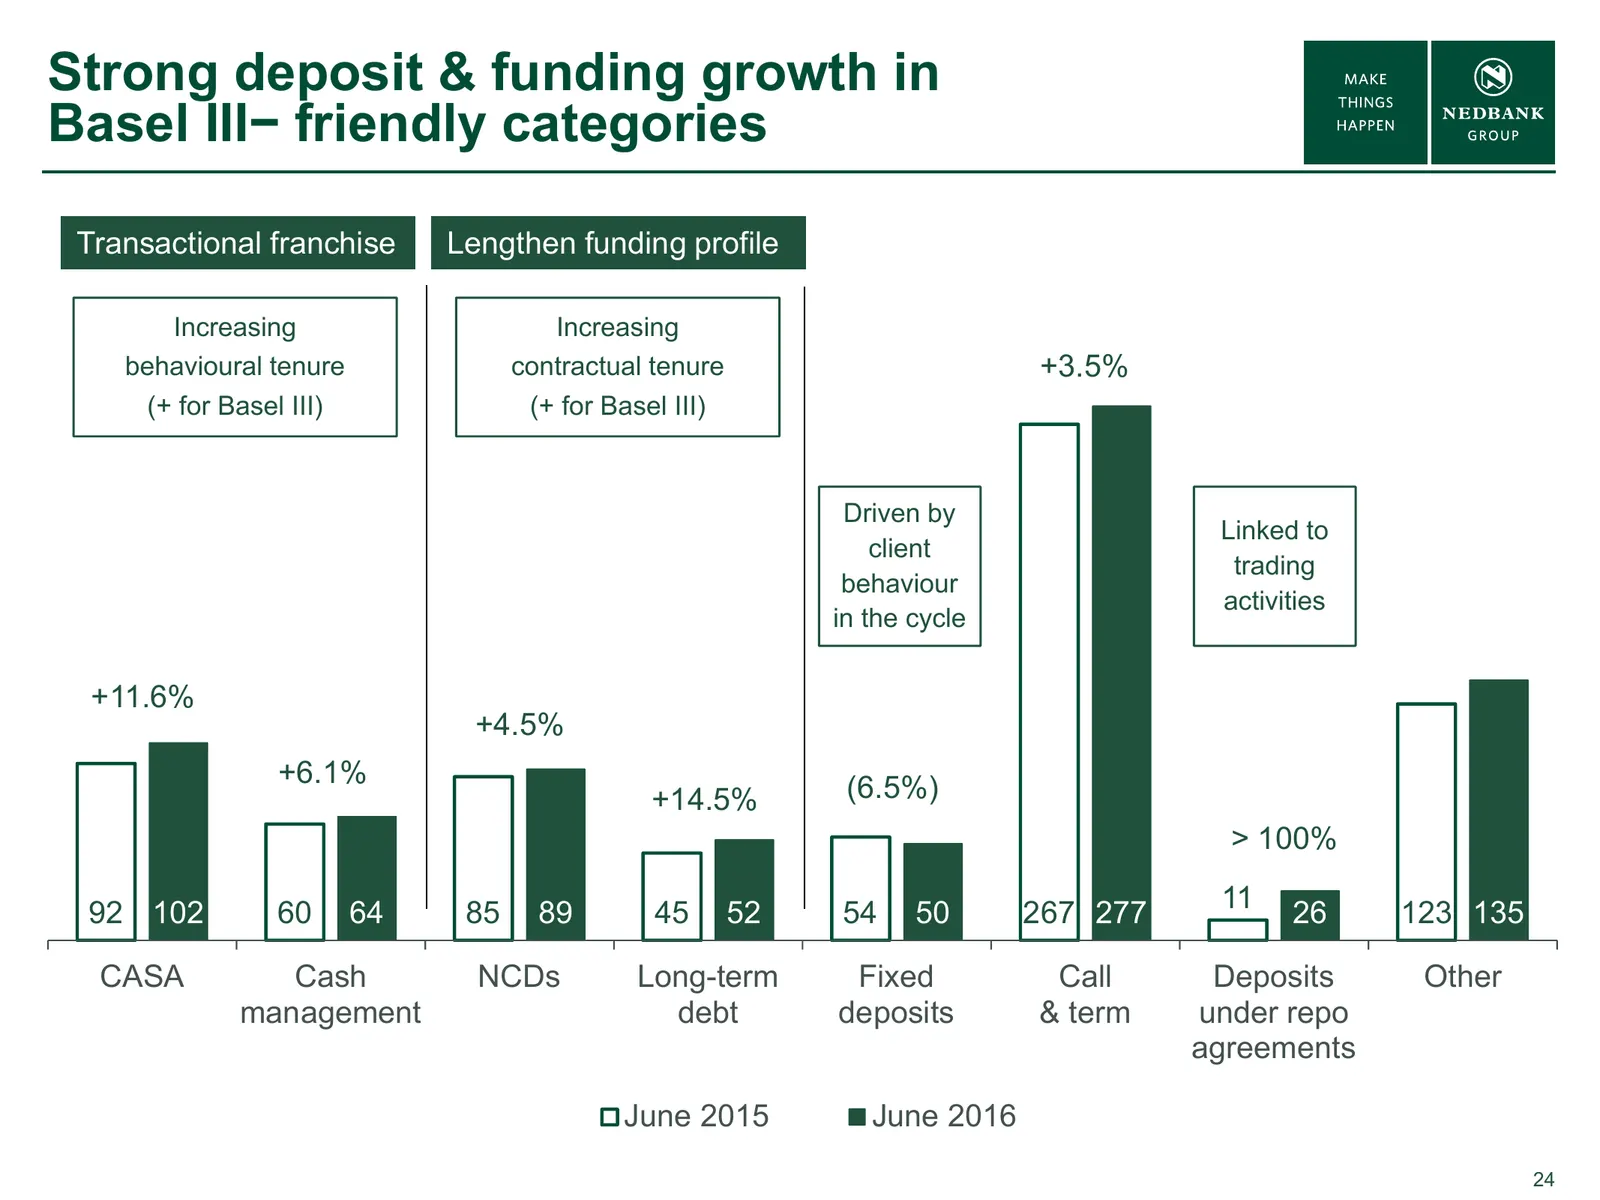
Slide 24: Strong deposit & funding growth in Basel III-friendly categories
Strong deposit & funding growth in Basel III− friendly categories Transactional franchise Lengthen funding profile Increasing Increasing behavioural tenure contractual tenure +3.5% (+ for Basel III) (+ for Basel III) Driven by Linked to client trading behaviour activities in the cycle +11.6% +4.5% +
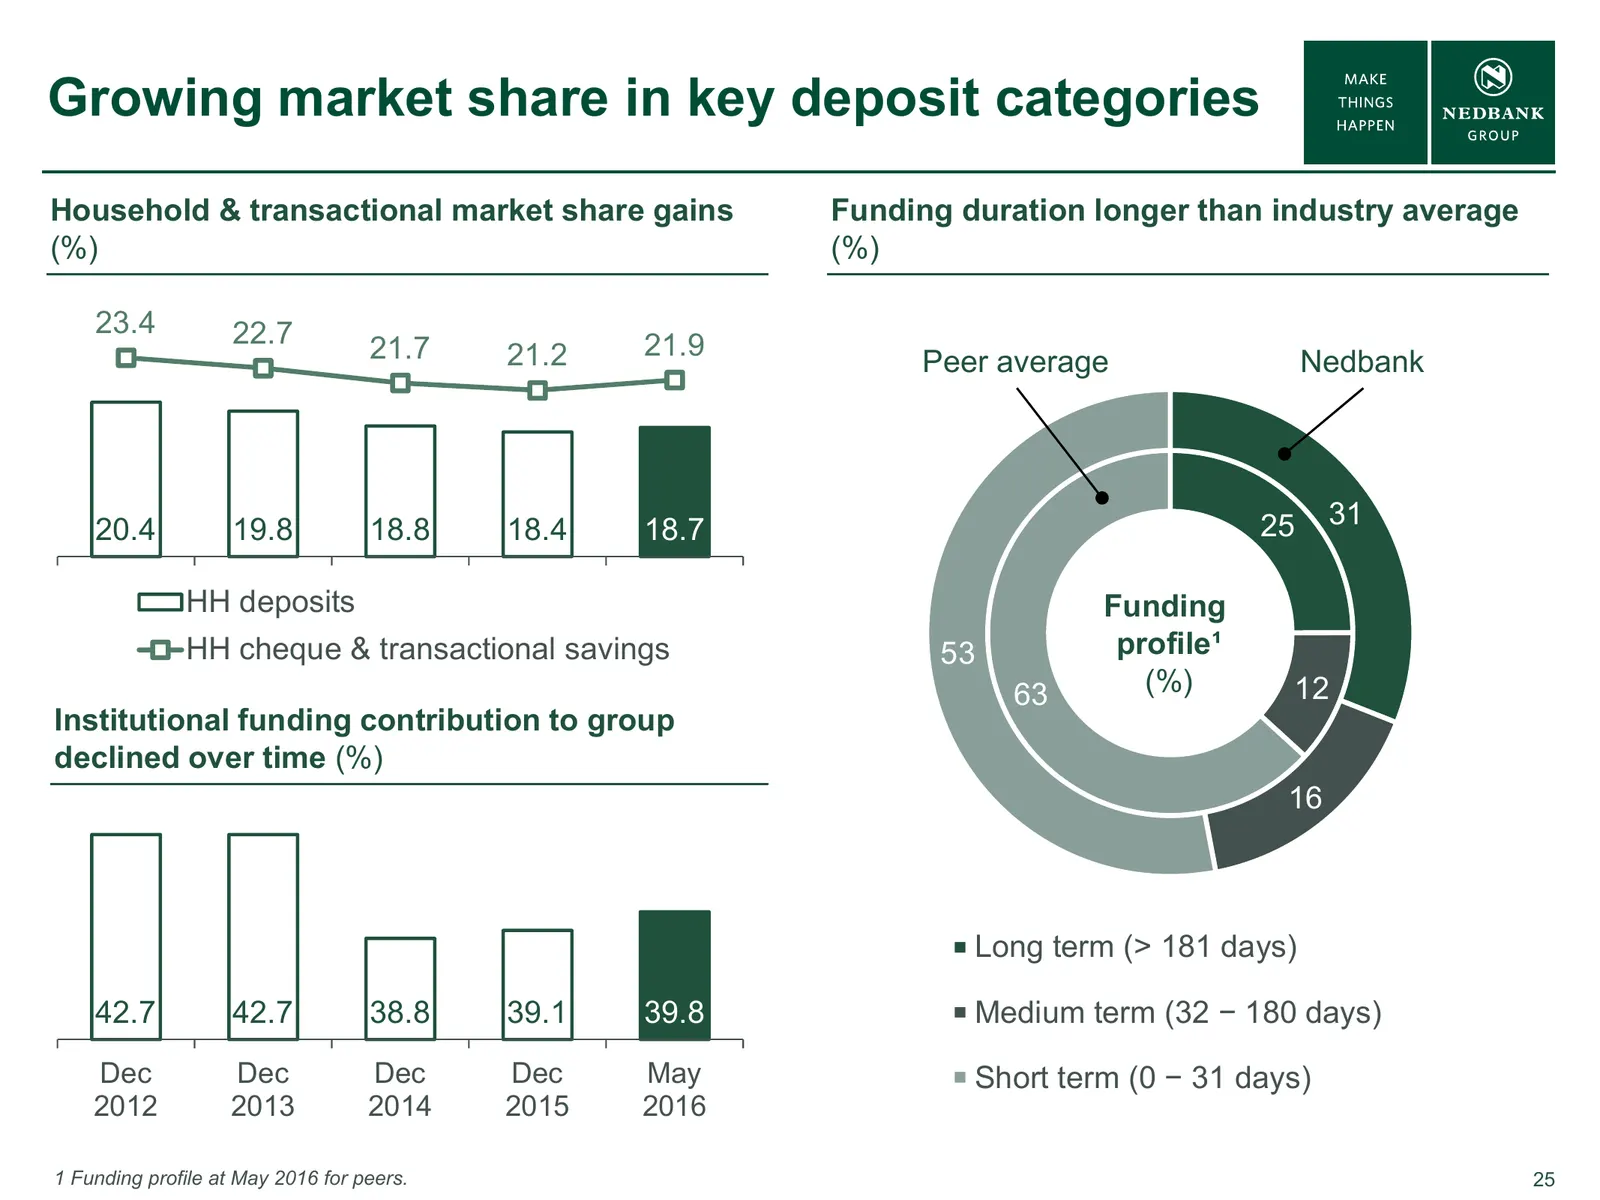
Slide 25: Growing market share in key deposit categories
Growing market share in key deposit categories Household & transactional market share gains Funding duration longer than industry average (%) (%) 23.4 22.7 21.7 21.2 21.9 Peer average Nedbank 25 31 20.4 19.8 18.8 18.4 18.7 HH deposits Funding HH cheque & transactional savings 53 profile¹ 63 (%) 12 I
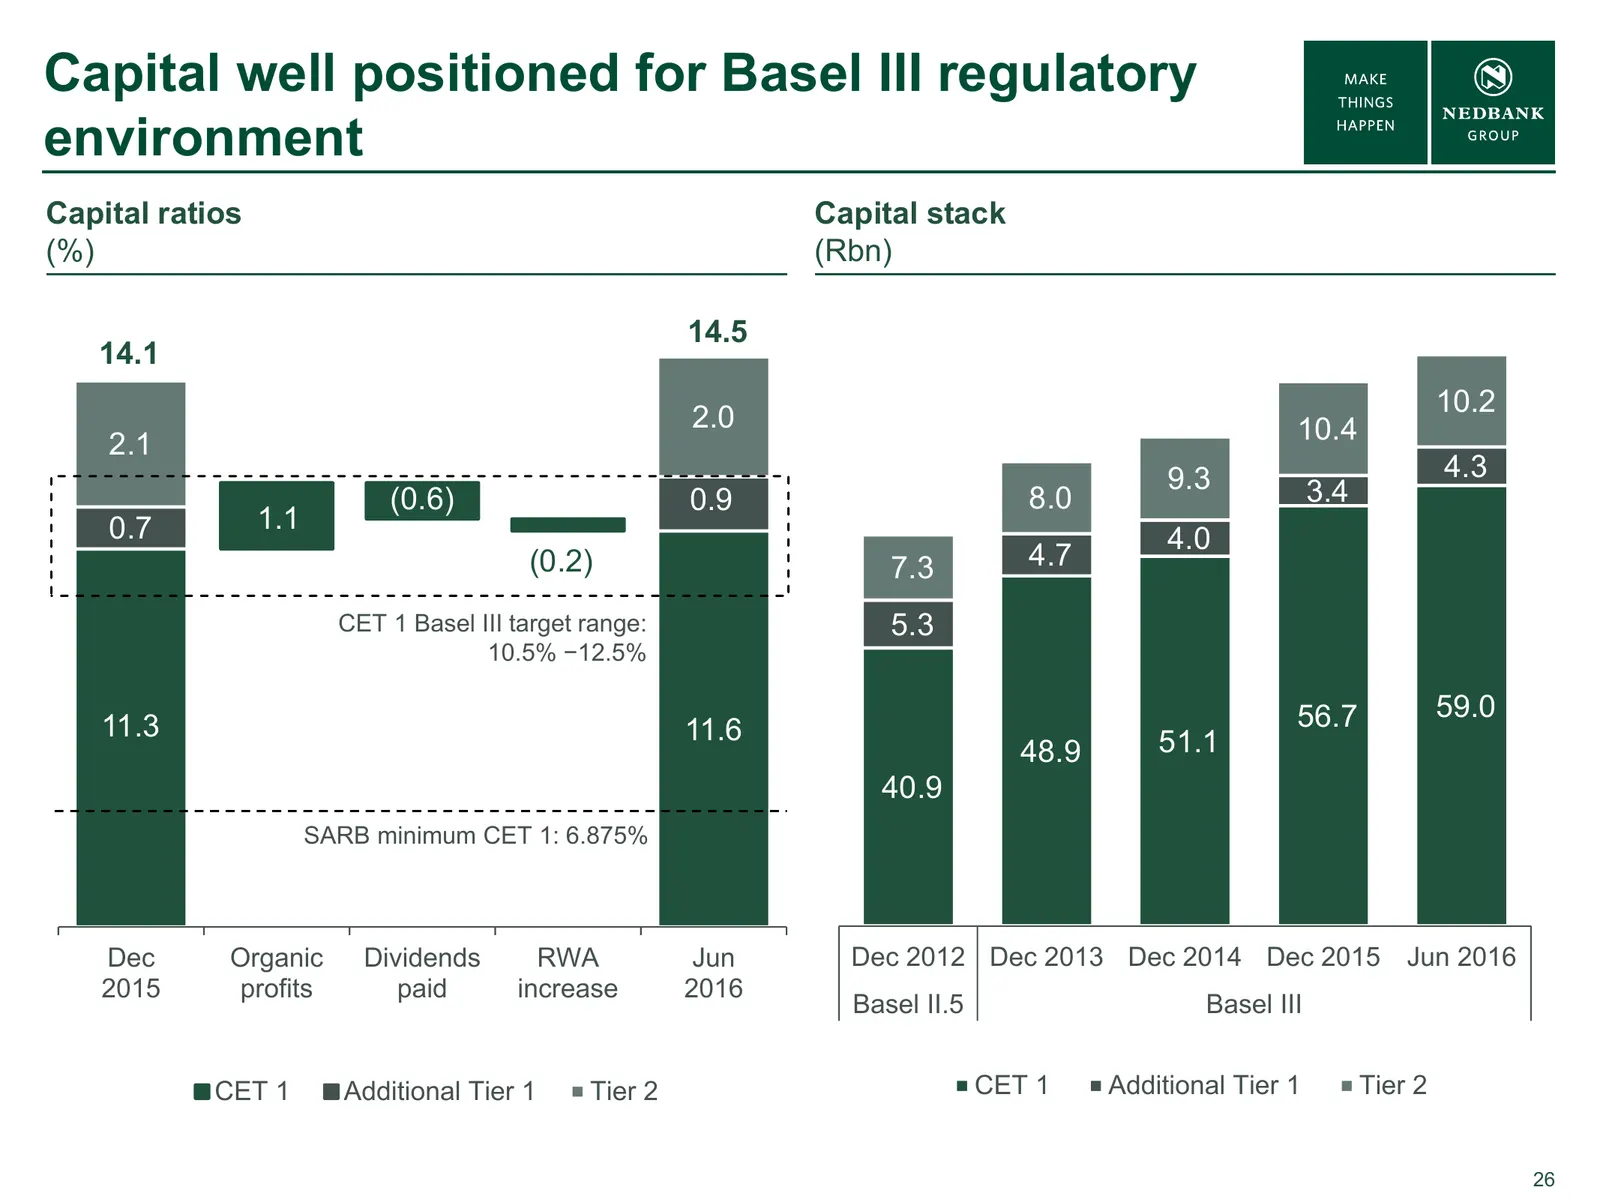
Slide 26: Capital well positioned for Basel III regulatory environment
Capital well positioned for Basel III regulatory environment Capital ratios Capital stack (%) (Rbn) 14.5 14.1 10.2 2.0 10.4 2.1 9.3 4.3 (0.6) 0.9 8.0 3.4 0.7 1.1 4.0 (0.2) 7.3 4.7 CET 1 Basel III target range: 5.3 10.5% −12.5% 56.7 59.0 11.3 11.6 51.1 48.9 40.9 SARB minimum CET 1: 6.875% Dec Organic
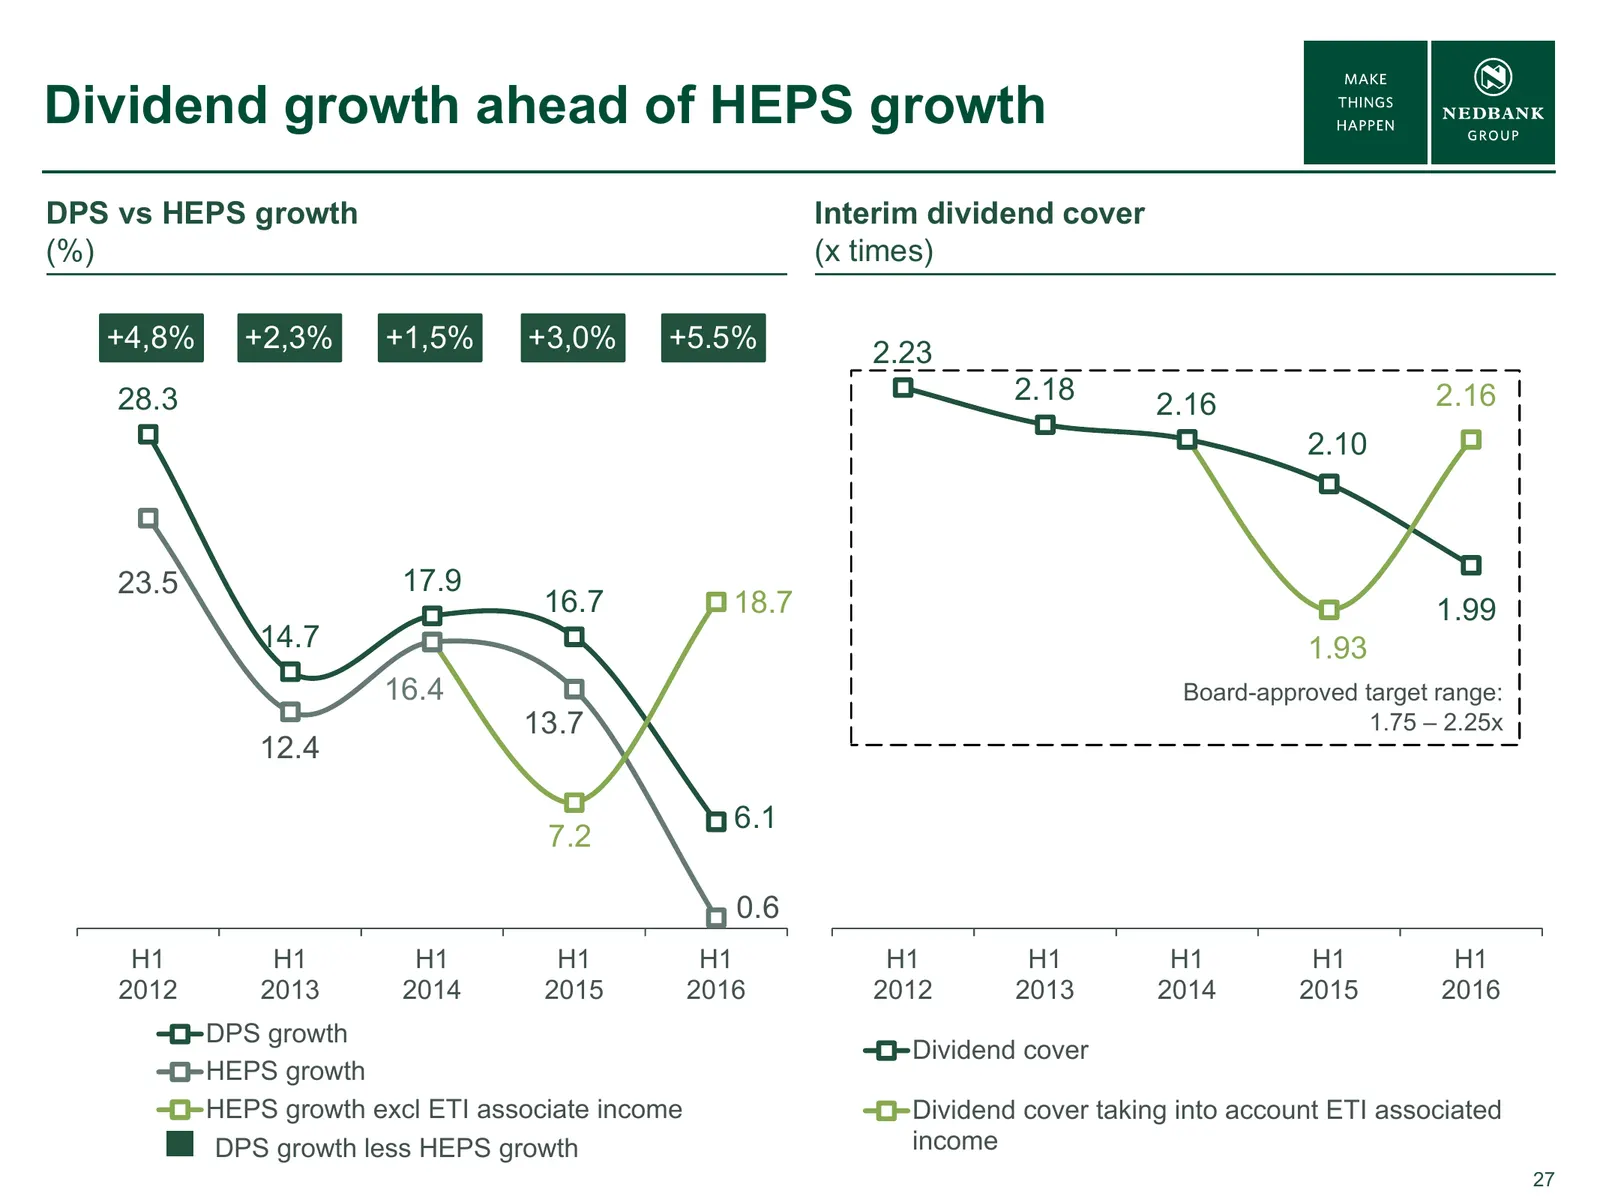
Slide 27: Dividend growth ahead of HEPS growth
Dividend growth ahead of HEPS growth DPS vs HEPS growth Interim dividend cover (%) (x times) +4,8% +2,3% +1,5% +3,0% +5.5% 2.23 28.3 2.18 2.16 2.16 2.10 23.5 17.9 16.7 18.7 1.99 14.7 1.93 16.4 Board-approved target range: 13.7 1.75 – 2.25x 12.4 6.1 7.2 0.6 H1 H1 H1 H1 H1 H1 H1 H1 H1 H1 2012 2013 201
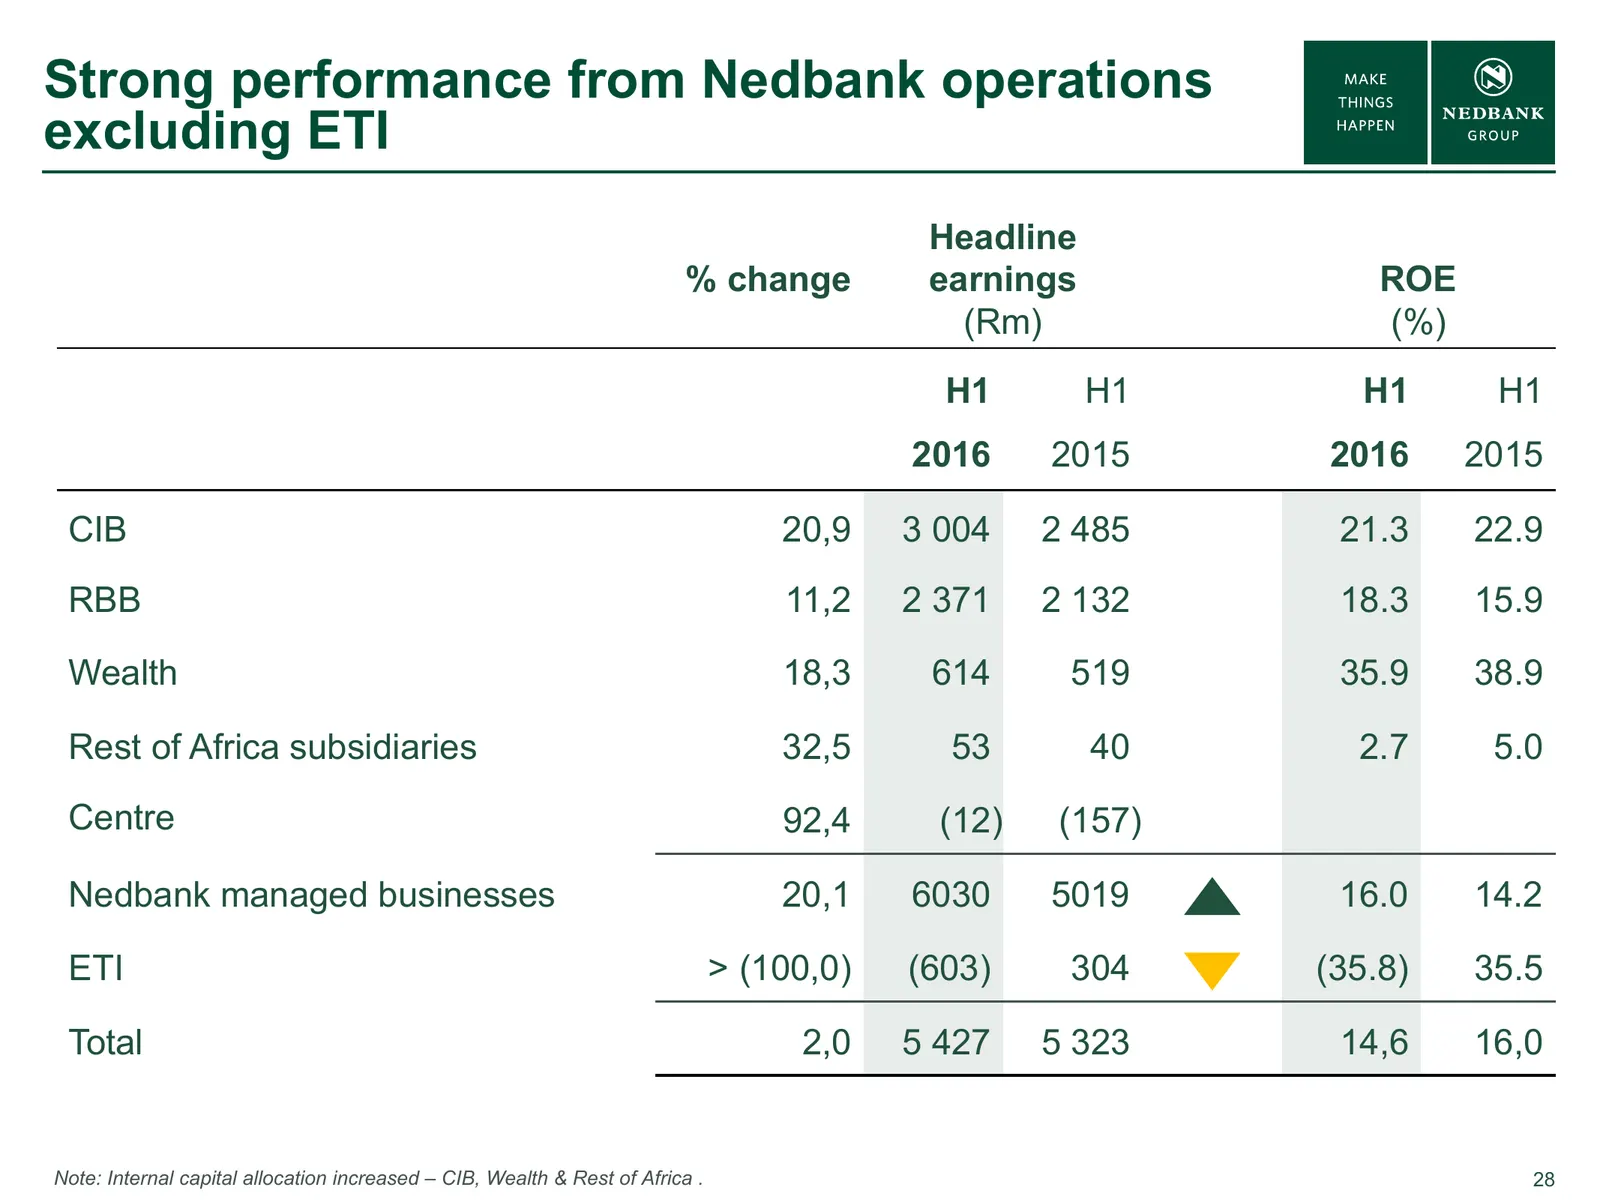
Slide 28: Strong performance from Nedbank operations excluding ETI
Strong performance from Nedbank operations excluding ETI Headline % change earnings ROE (Rm) (%) H1 H1 H1 H1 2016 2015 2016 2015 CIB 20,9 3 004 2 485 21.3 22.9 RBB 11,2 2 371 2 132 18.3 15.9 Wealth 18,3 614 519 35.9 38.9 Rest of Africa subsidiaries 32,5 53 40 2.7 5.0 Centre 92,4 (12) (157) Nedbank m
Slide 29: Nedbank Corporate & Investment Banking
NEDBANK CORPORATE & INVESTMENT BRIAN KENNEDY BANKING Building an integrated corporate & investment bank.
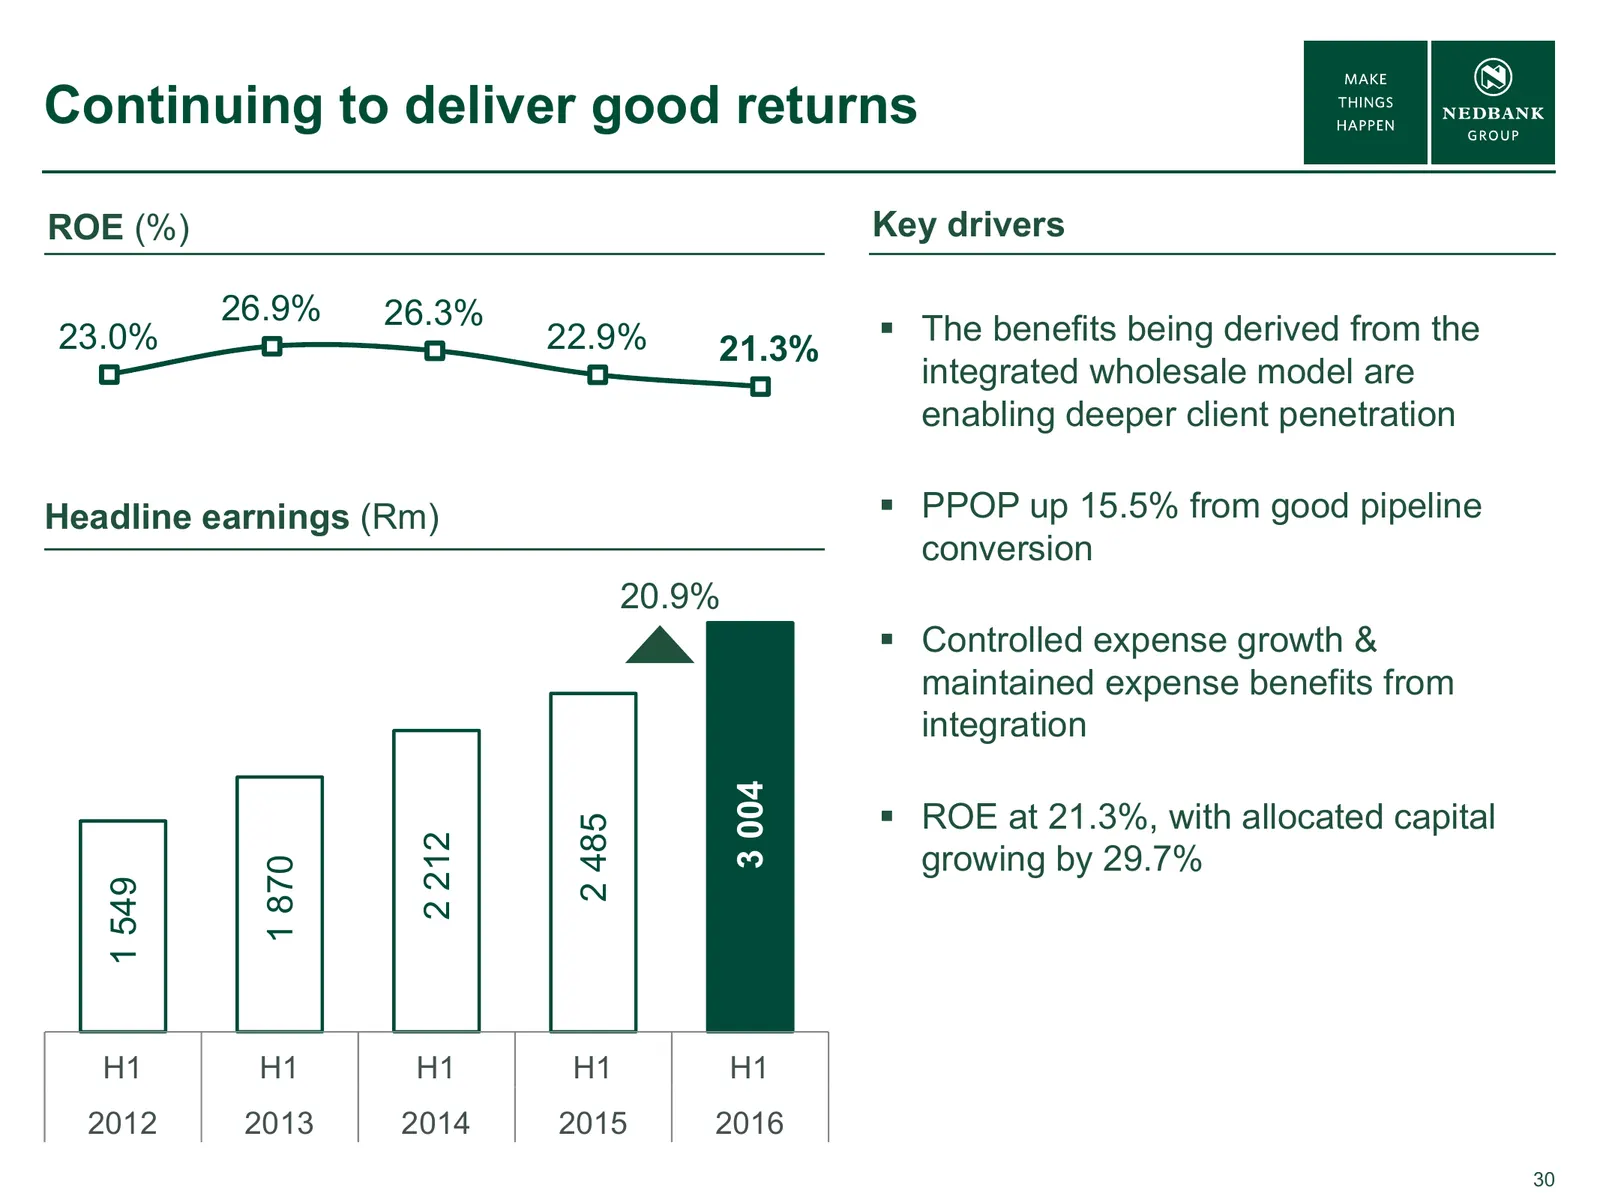
Slide 30: Continuing to deliver good returns
Continuing to deliver good returns ROE (%) Key drivers 26.9% 26.3% 23.0% 22.9% The benefits being derived from the 21.3% integrated wholesale model are enabling deeper client penetration Headline earnings (Rm) PPOP up 15.5% from good pipeline conversion 20.9% Controlled expense growth & mainta
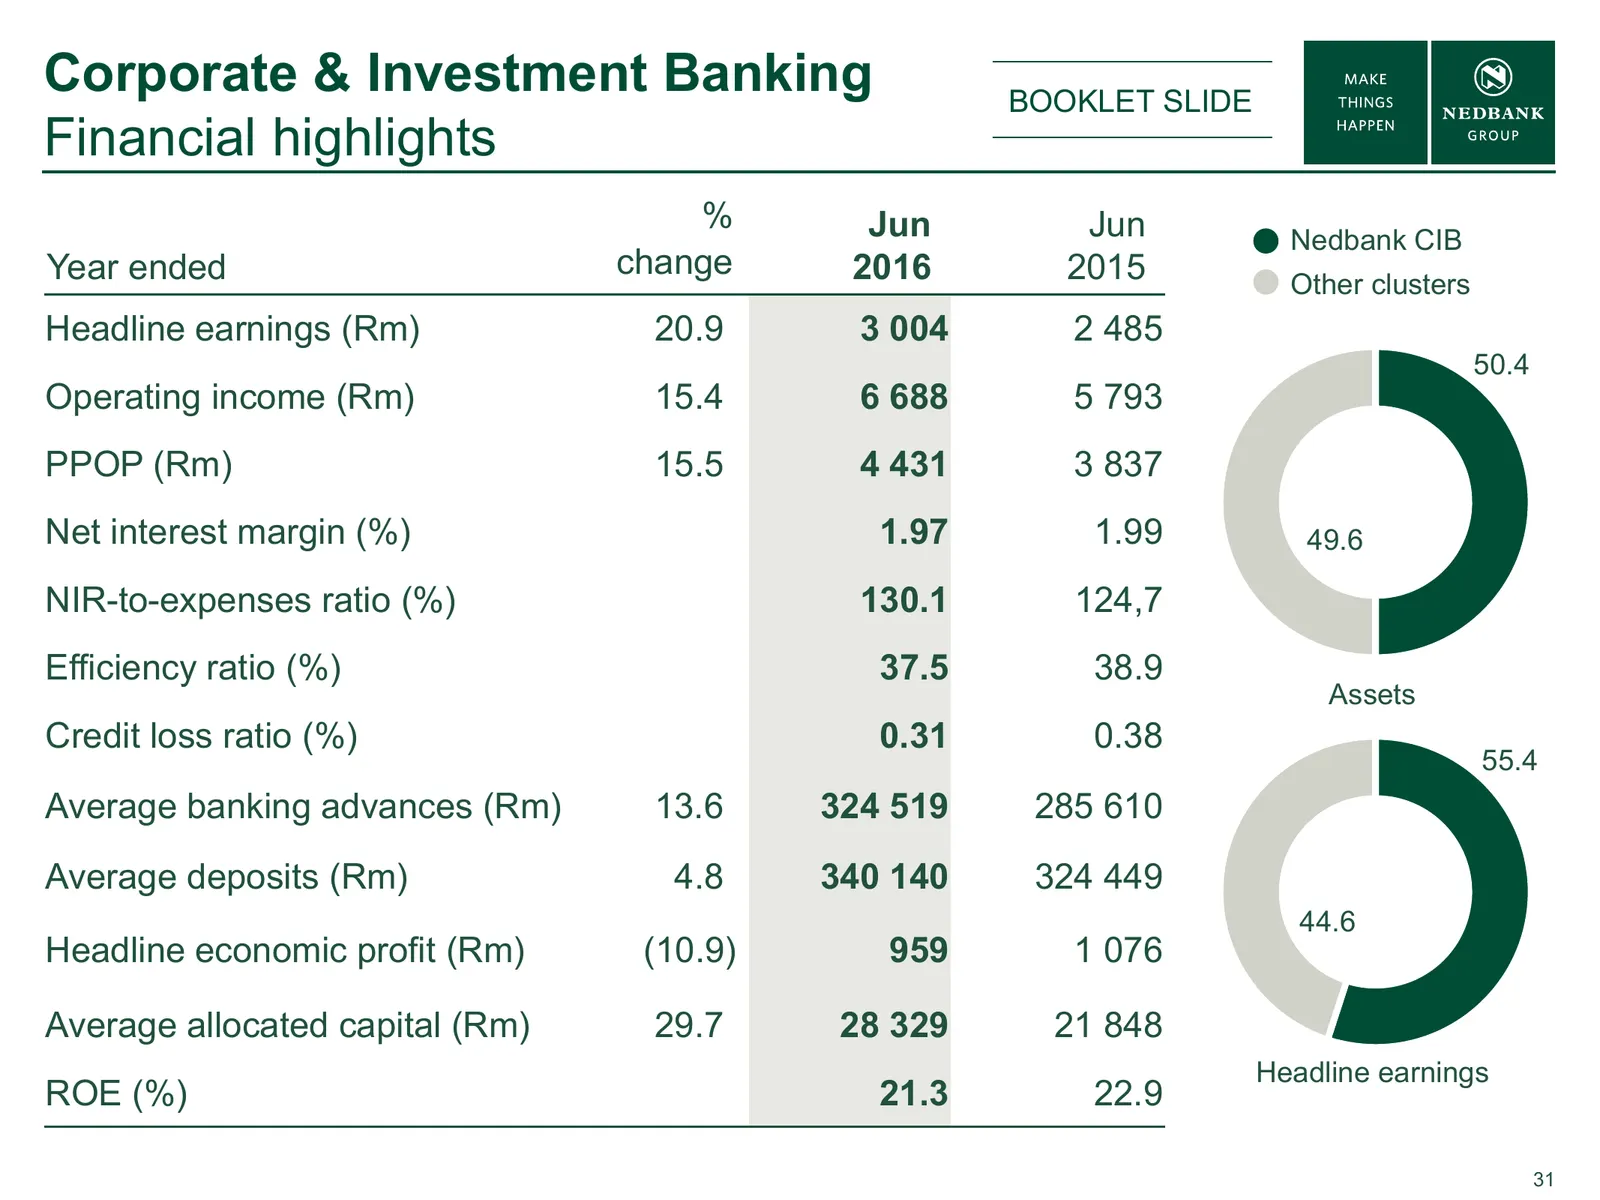
Slide 31: Corporate & Investment Banking Financial highlights
Corporate & Investment Banking BOOKLET SLIDE Financial highlights % Jun Jun Nedbank CIB Year ended change 2016 2015 Other clusters Headline earnings (Rm) 20.9 3 004 2 485 50.4 Operating income (Rm) 15.4 6 688 5 793 PPOP (Rm) 15.5 4 431 3 837 Net interest margin (%) 1.97 1.99 49.6 NIR-to-expenses rat
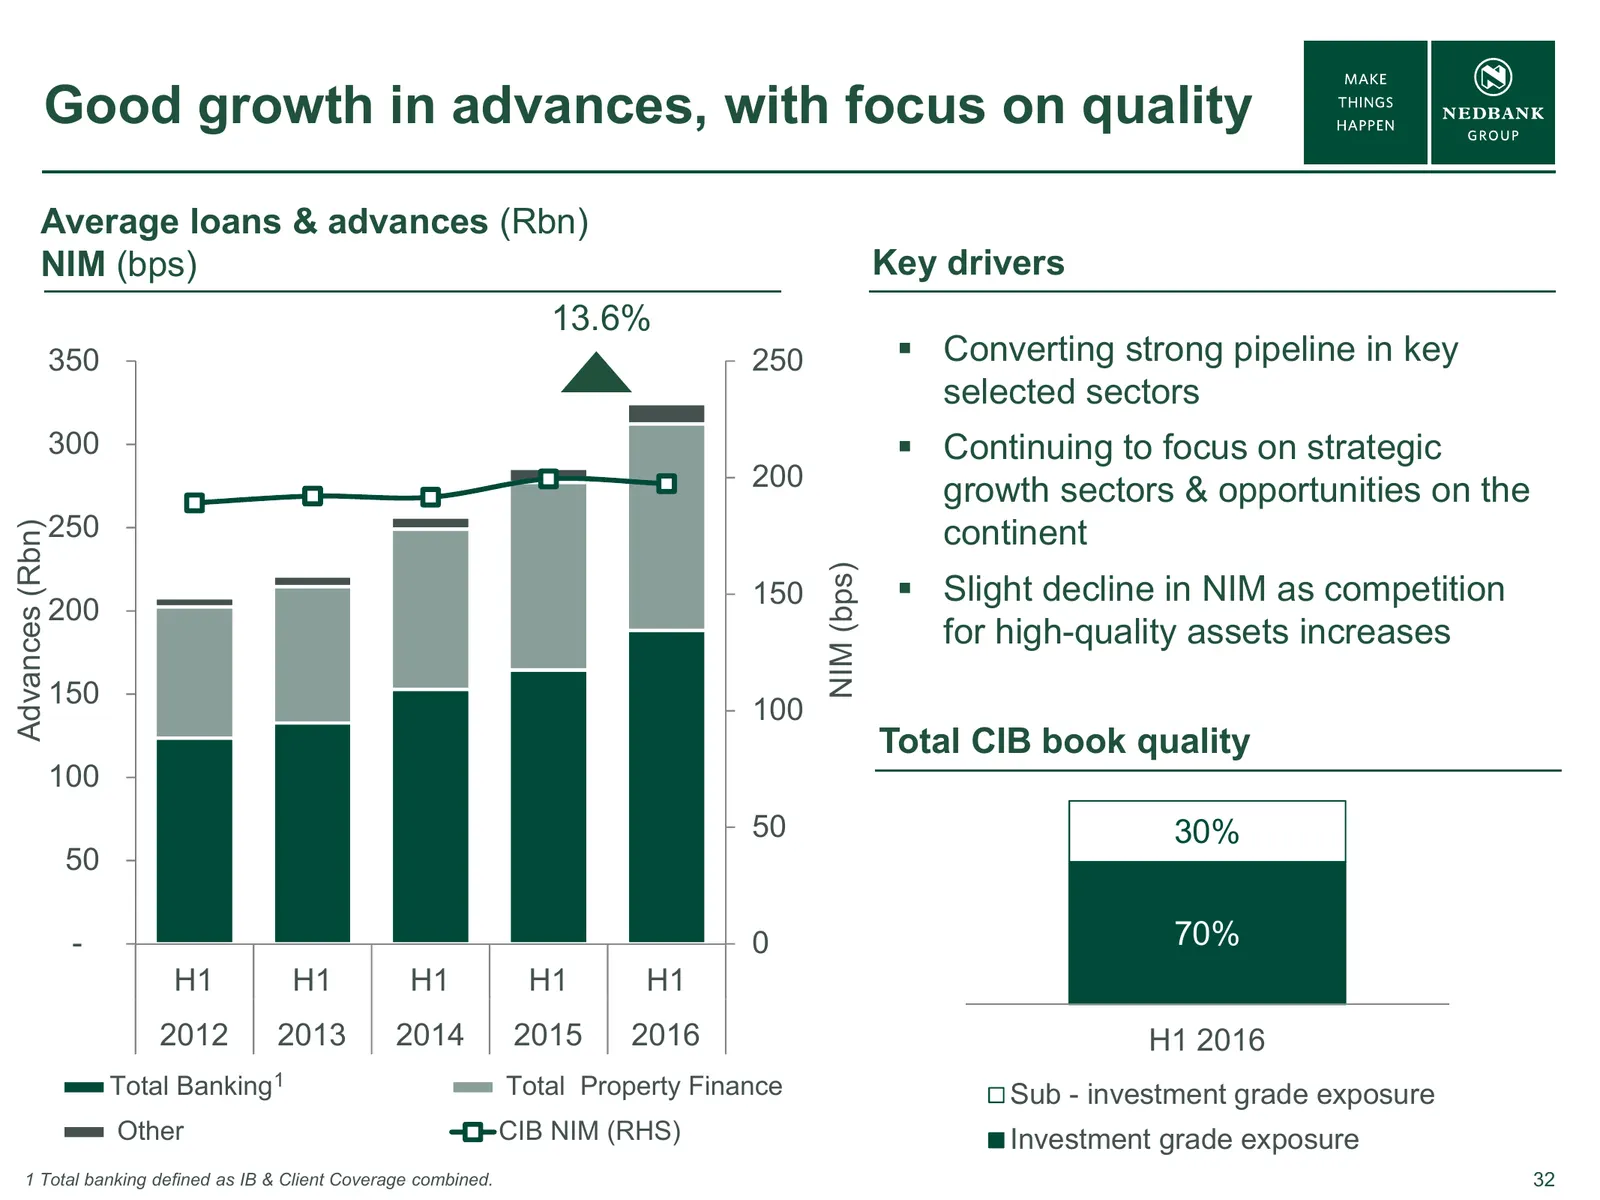
Slide 32: Good growth in advances, with focus on quality
Good growth in advances, with focus on quality Average loans & advances (Rbn) NIM (bps) Key drivers 13.6% 350 250 Converting strong pipeline in key selected sectors 300 Continuing to focus on strategic 200 growth sectors & opportunities on the 250 continent Advances (Rbn) NIM (bps) 150 Slight
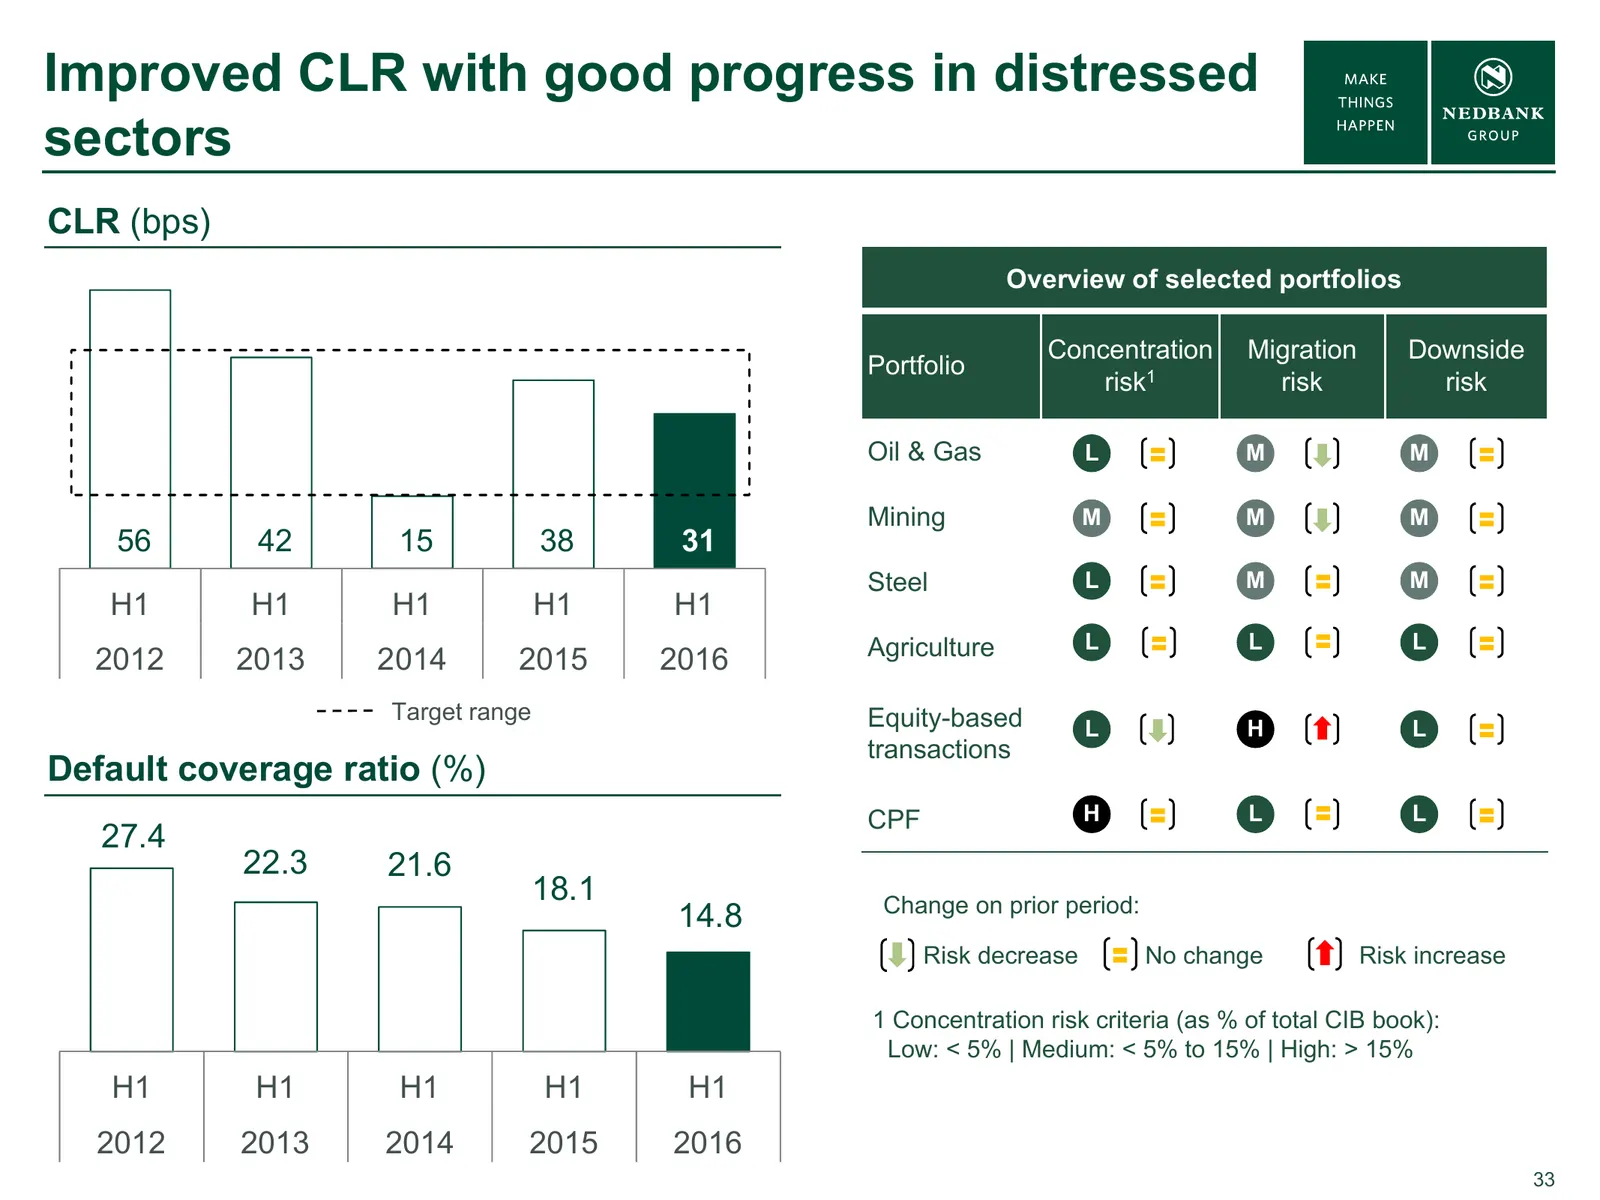
Slide 33: Improved CLR with good progress in distressed sectors
Improved CLR with good progress in distressed sectors CLR (bps) Overview of selected portfolios Concentration Migration Downside Portfolio risk1 risk risk Oil & Gas L M M Mining M M M 56 42 15 38 31 Steel L M M H1 H1 H1 H1 H1 Agriculture L L L 2012 2013 2014 2015 2016 Target range Equity-based L H L
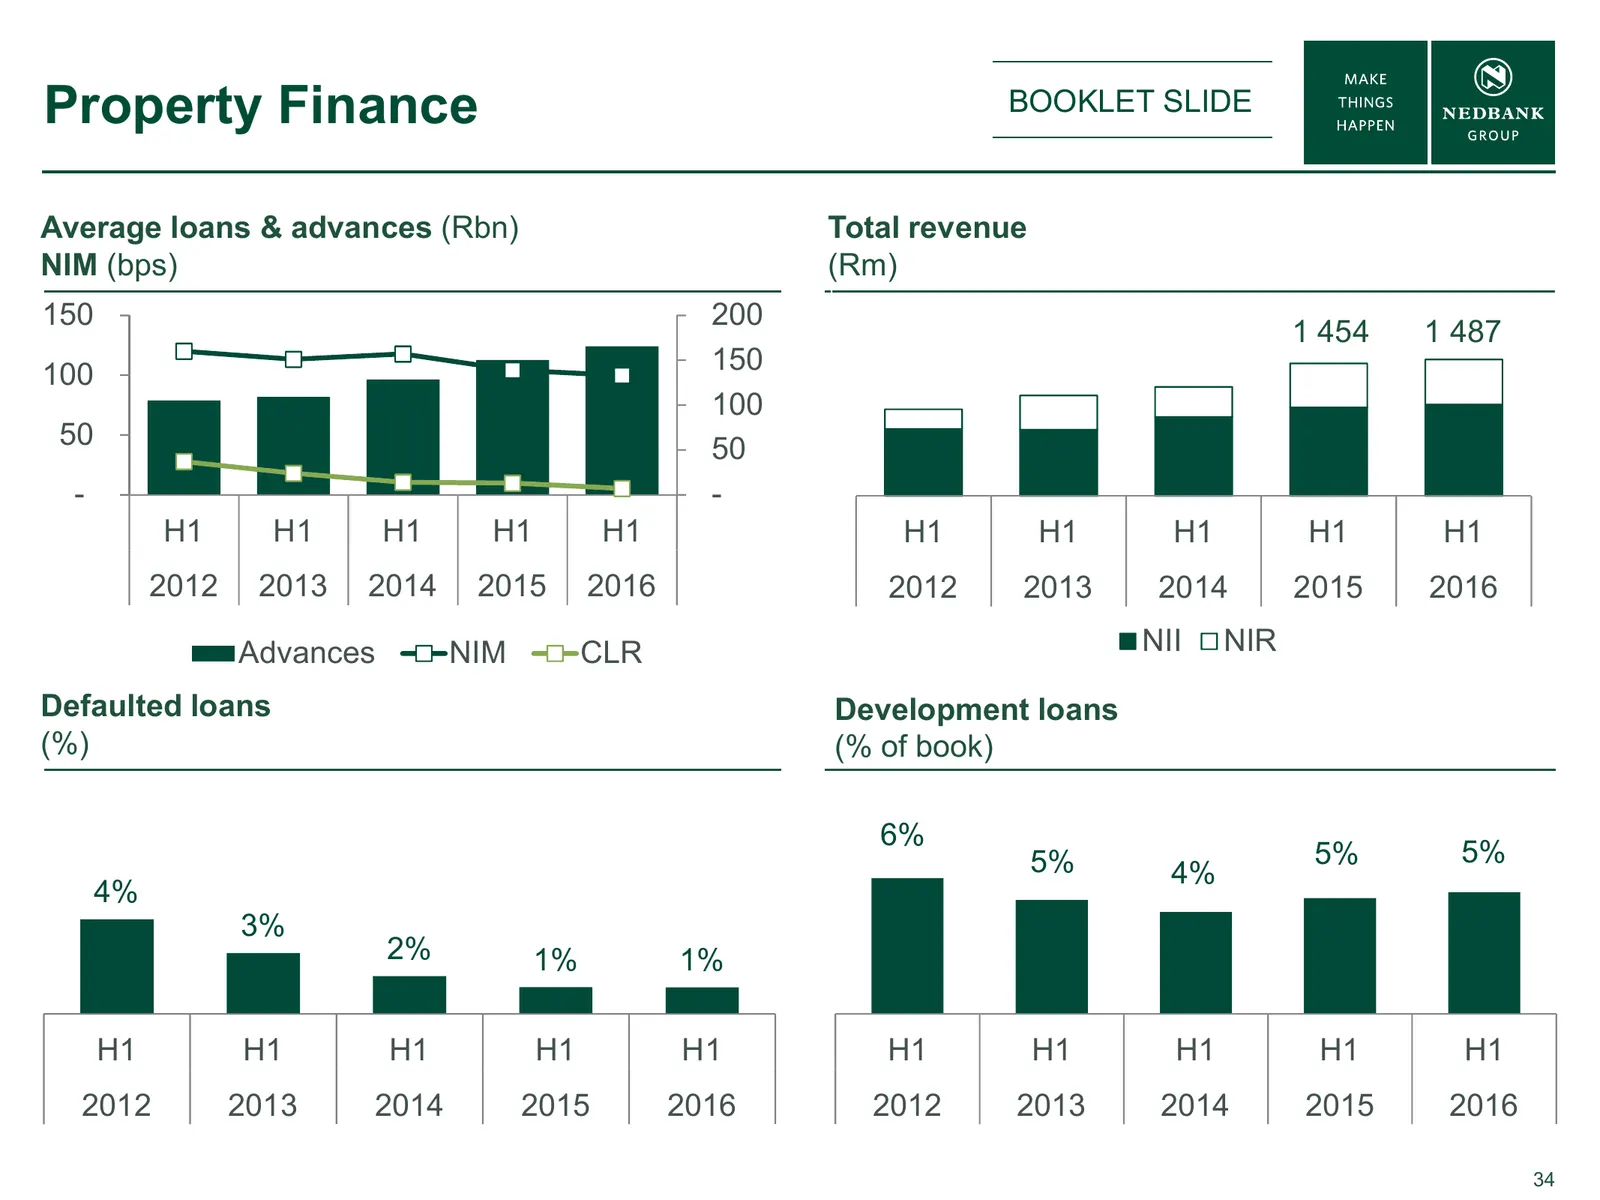
Slide 34: Property Finance
Property Finance BOOKLET SLIDE Average loans & advances (Rbn) Total revenue NIM (bps) (Rm) 150 200 1 454 1 487 100 150 100 50 50 - - H1 H1 H1 H1 H1 H1 H1 H1 H1 H1 2012 2013 2014 2015 2016 2012 2013 2014 2015 2016 Advances NIM CLR NII NIR Defaulted loans Development loans (%) (% of book) 6% 5% 5% 5%
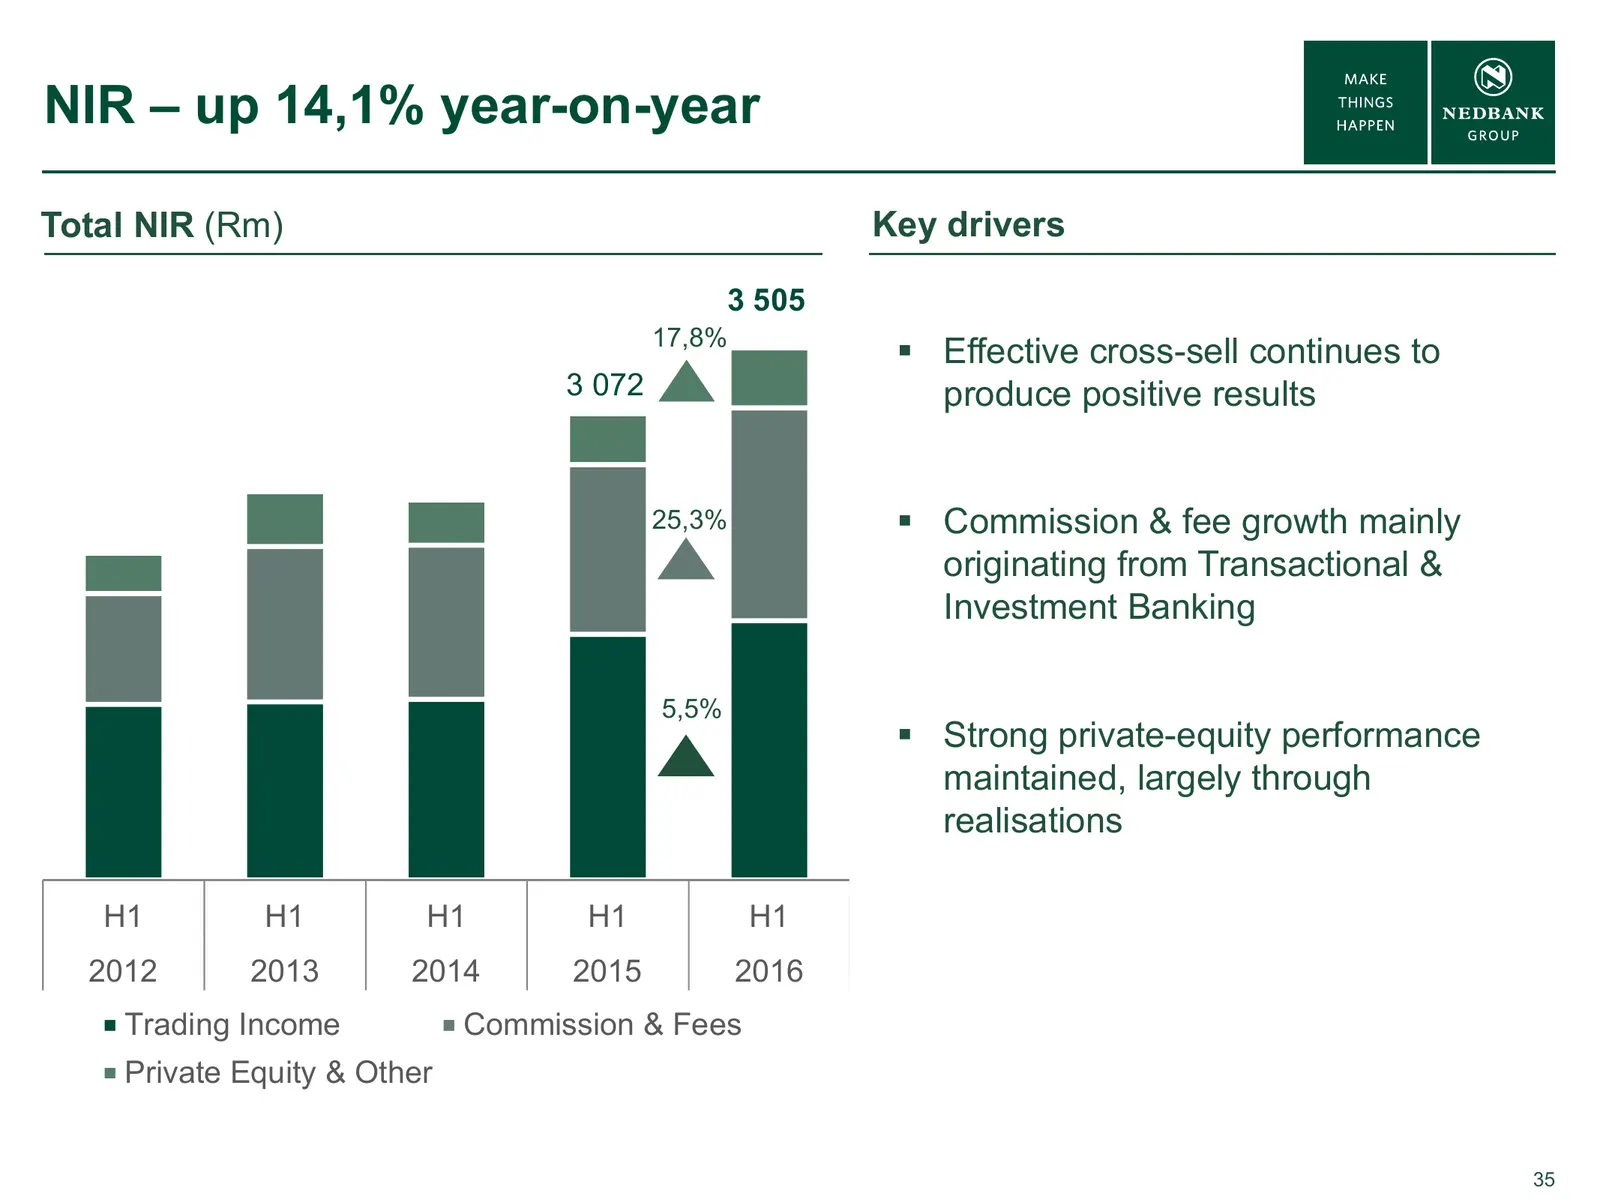
Slide 35: NIR – up 14,1% year-on-year
NIR – up 14,1% year-on-year Total NIR (Rm) Key drivers 3 505 17,8% Effective cross-sell continues to 3 072 produce positive results 25,3% Commission & fee growth mainly originating from Transactional & Investment Banking 5,5% Strong private-equity performance maintained, largely through realis
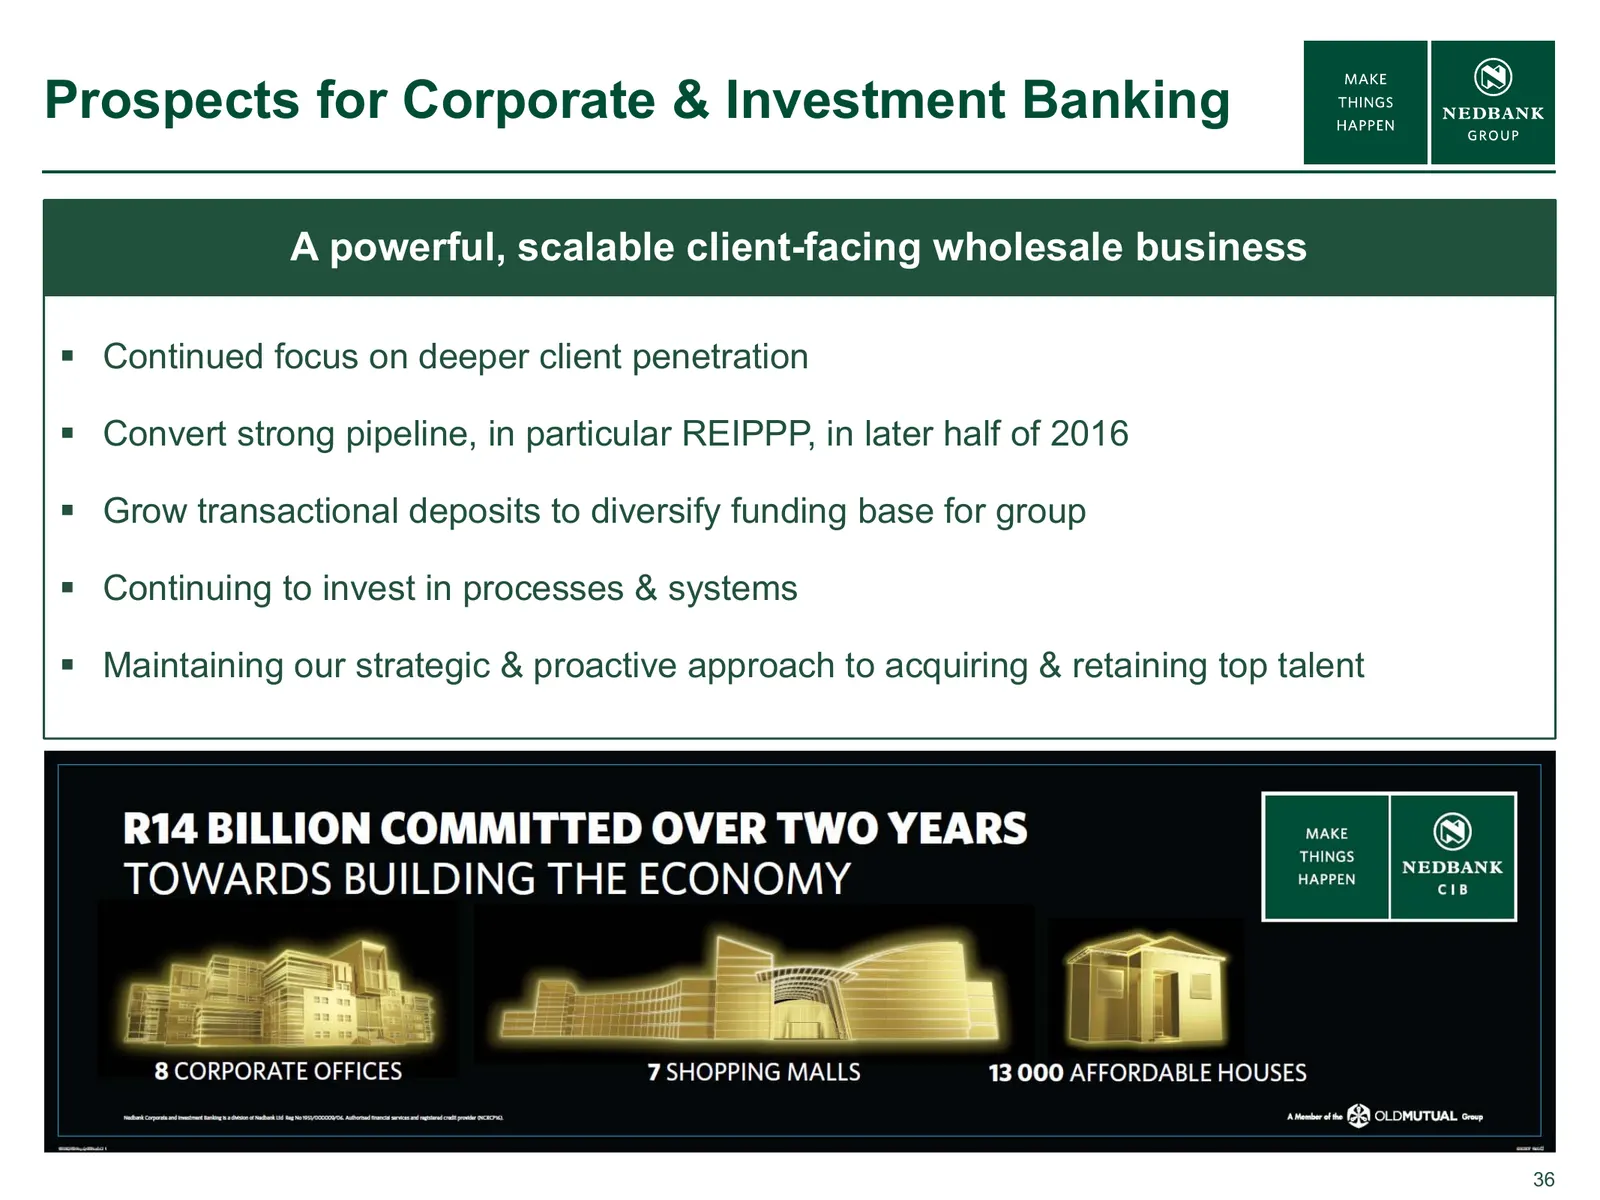
Slide 36: Prospects for Corporate & Investment Banking
Prospects for Corporate & Investment Banking A powerful, scalable client-facing wholesale business Continued focus on deeper client penetration Convert strong pipeline, in particular REIPPP, in later half of 2016 Grow transactional deposits to diversify funding base for group Continuing to i
Slide 37: Nedbank Retail & Business Banking
NEDBANK RETAIL & BUSINESS BANKING CIKO THOMAS Improving returns on equity, while growing the franchise.
Slide 38: Resilient performance in a challenging macro environment
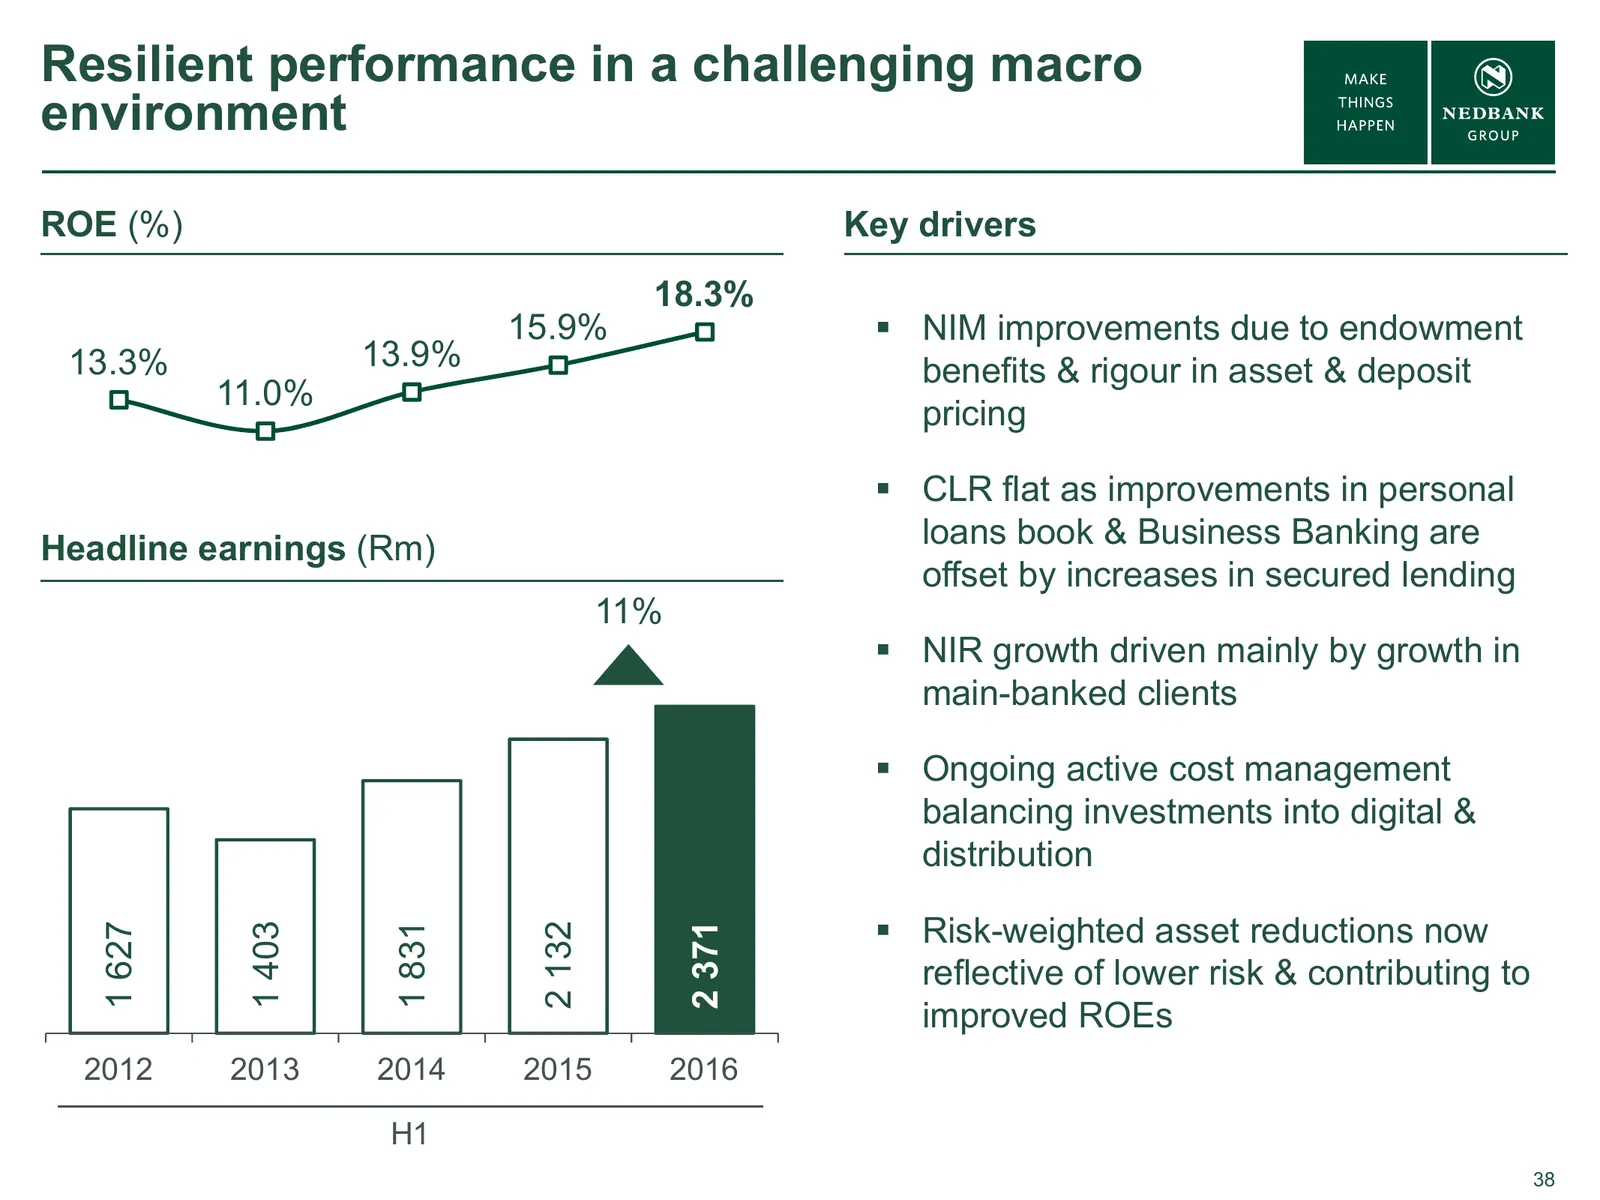
Resilient performance in a challenging macro environment ROE (%) Key drivers 18.3% 15.9% NIM improvements due to endowment 13.3% 13.9% benefits & rigour in asset & deposit 11.0% pricing CLR flat as improvements in personal Headline earnings (Rm) loans book & Business Banking are offset by increa
Slide 39: Nedbank Retail & Business Banking Financial Highlights
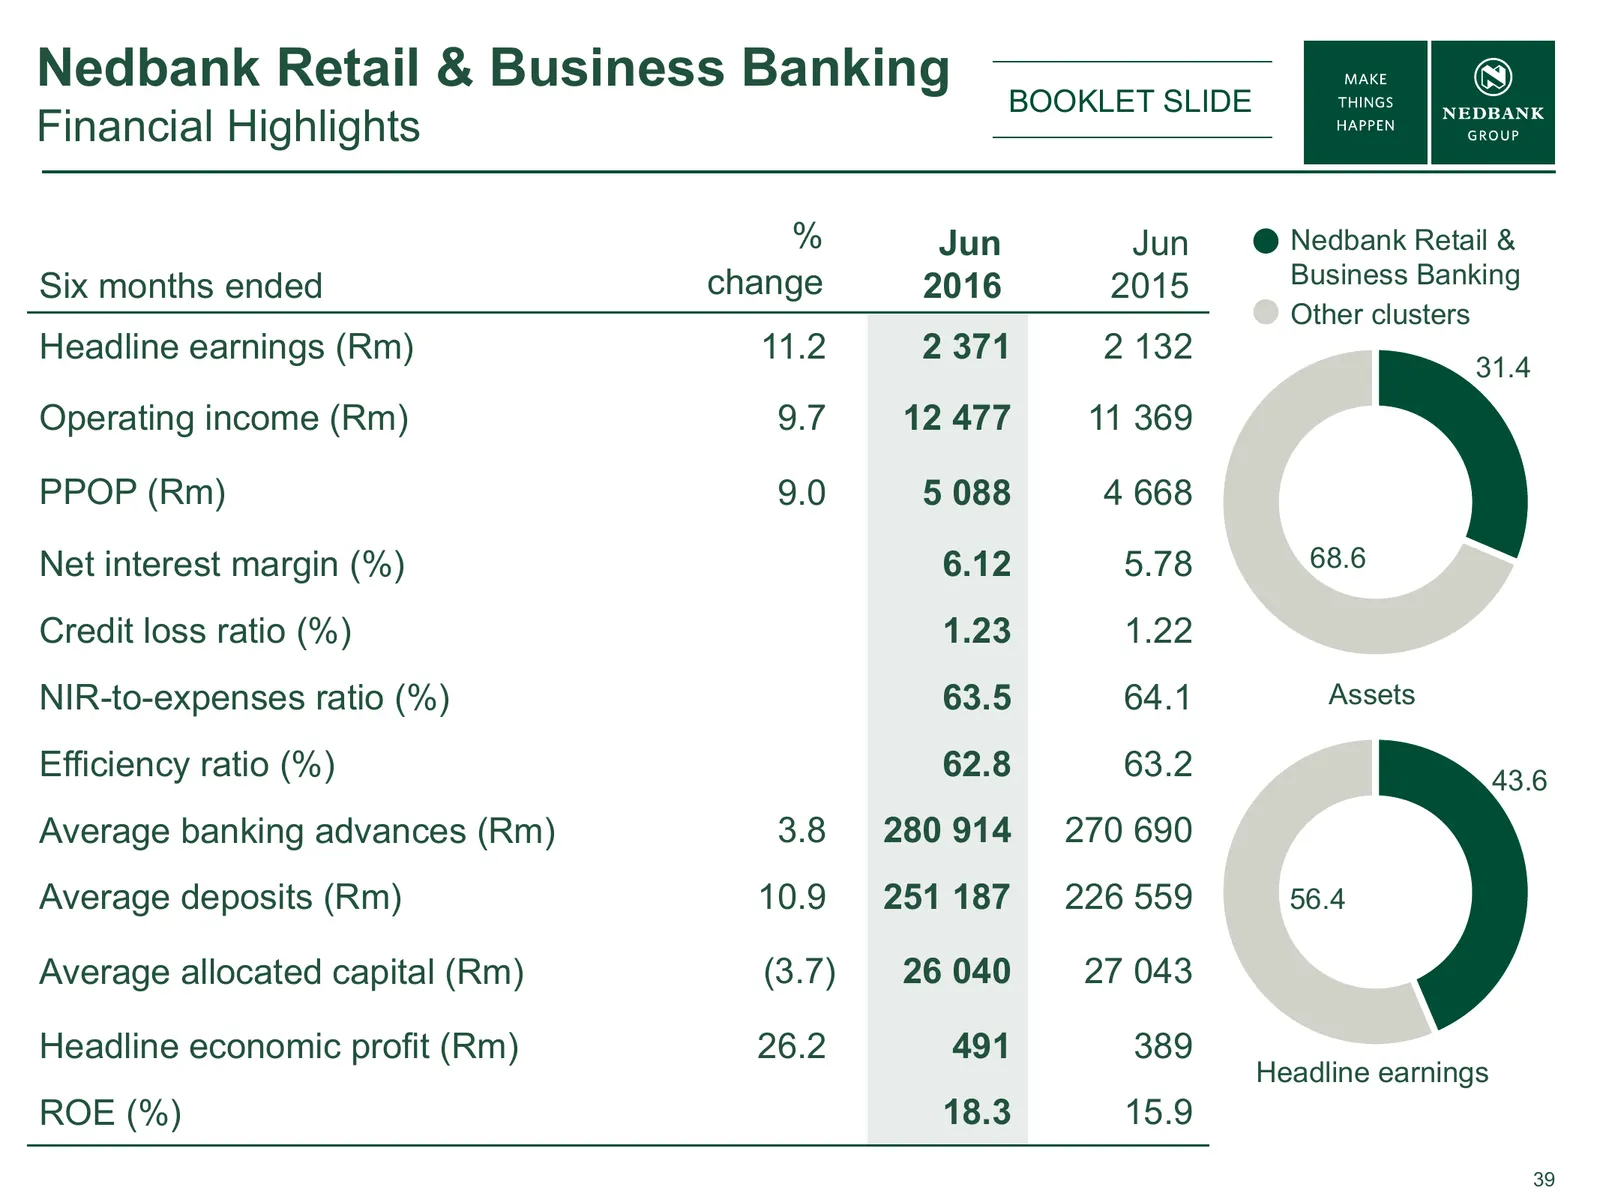
Nedbank Retail & Business Banking BOOKLET SLIDE Financial Highlights % Jun Jun Nedbank Retail & Six months ended change 2016 2015 Business Banking Other clusters Headline earnings (Rm) 11.2 2 371 2 132 31.4 Operating income (Rm) 9.7 12 477 11 369 PPOP (Rm) 9.0 5 088 4 668 Net interest margin (%) 6.1
Slide 40: Underlying business showed improved performance given the market dynamics
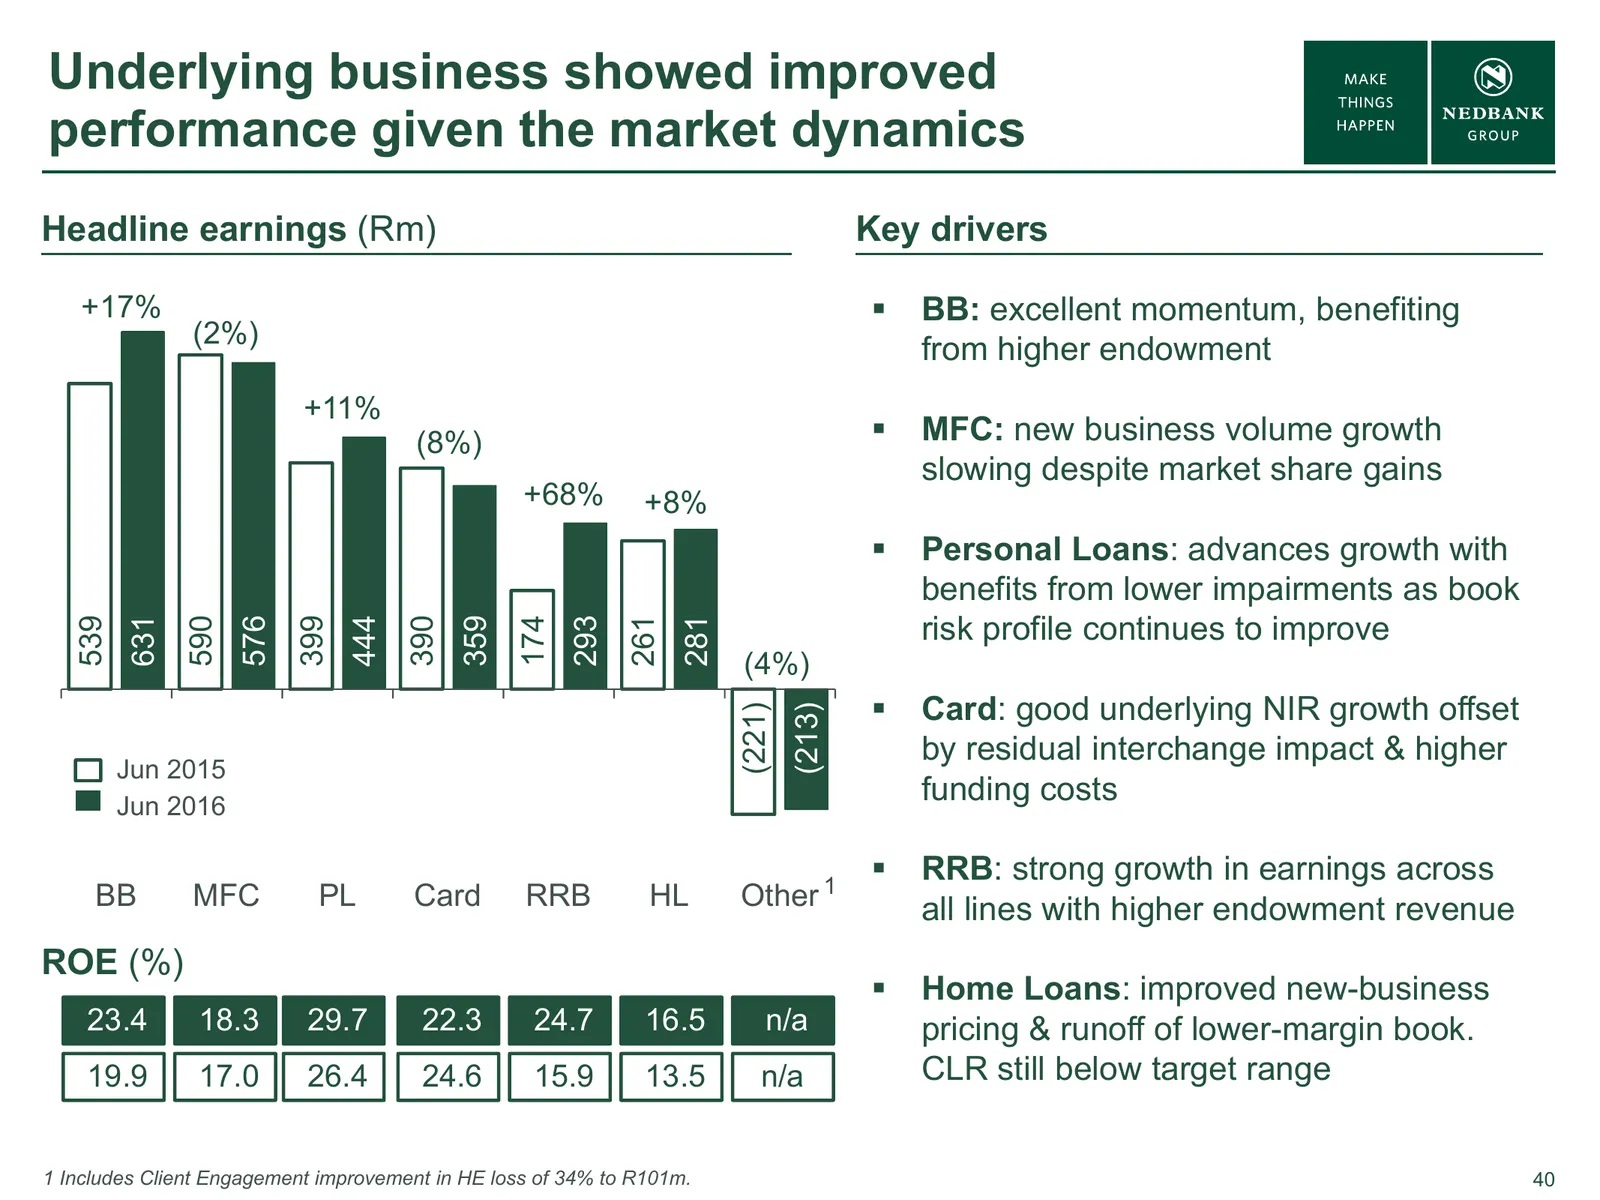
Underlying business showed improved performance given the market dynamics Headline earnings (Rm) Key drivers +17% BB: excellent momentum, benefiting (2%) from higher endowment +11% (8%) MFC: new business volume growth slowing despite market share gains +68% +8% Personal Loans: advances growth
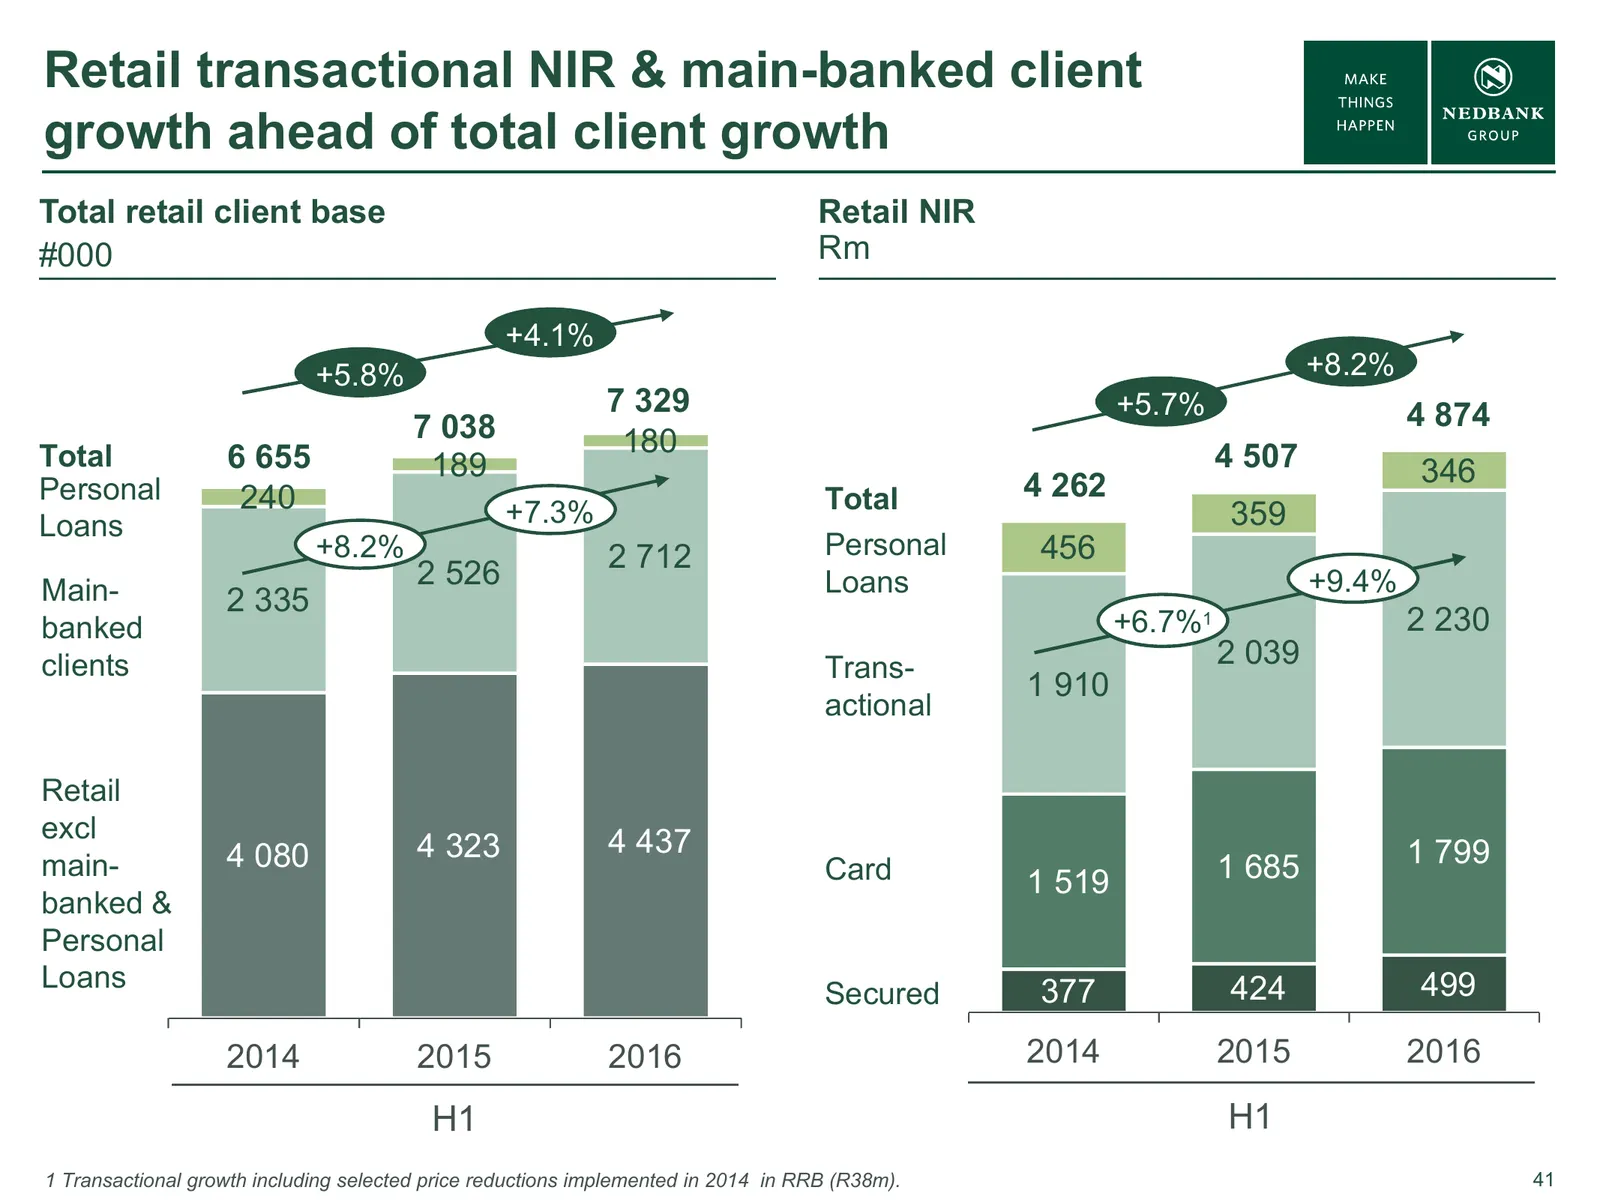
Slide 41: Retail transactional NIR & main-banked client growth ahead of total client growth
Retail transactional NIR & main-banked client growth ahead of total client growth Total retail client base Retail NIR #000 Rm +4.1% +5.8% +8.2% 7 329 +5.7% 4 874 7 038 180 Total 6 655 189 4 507 346 Personal 240 Total 4 262 Loans +7.3% 359 +8.2% 2 712 Personal 456 Main- 2 526 Loans +9.4% 2 335 banked
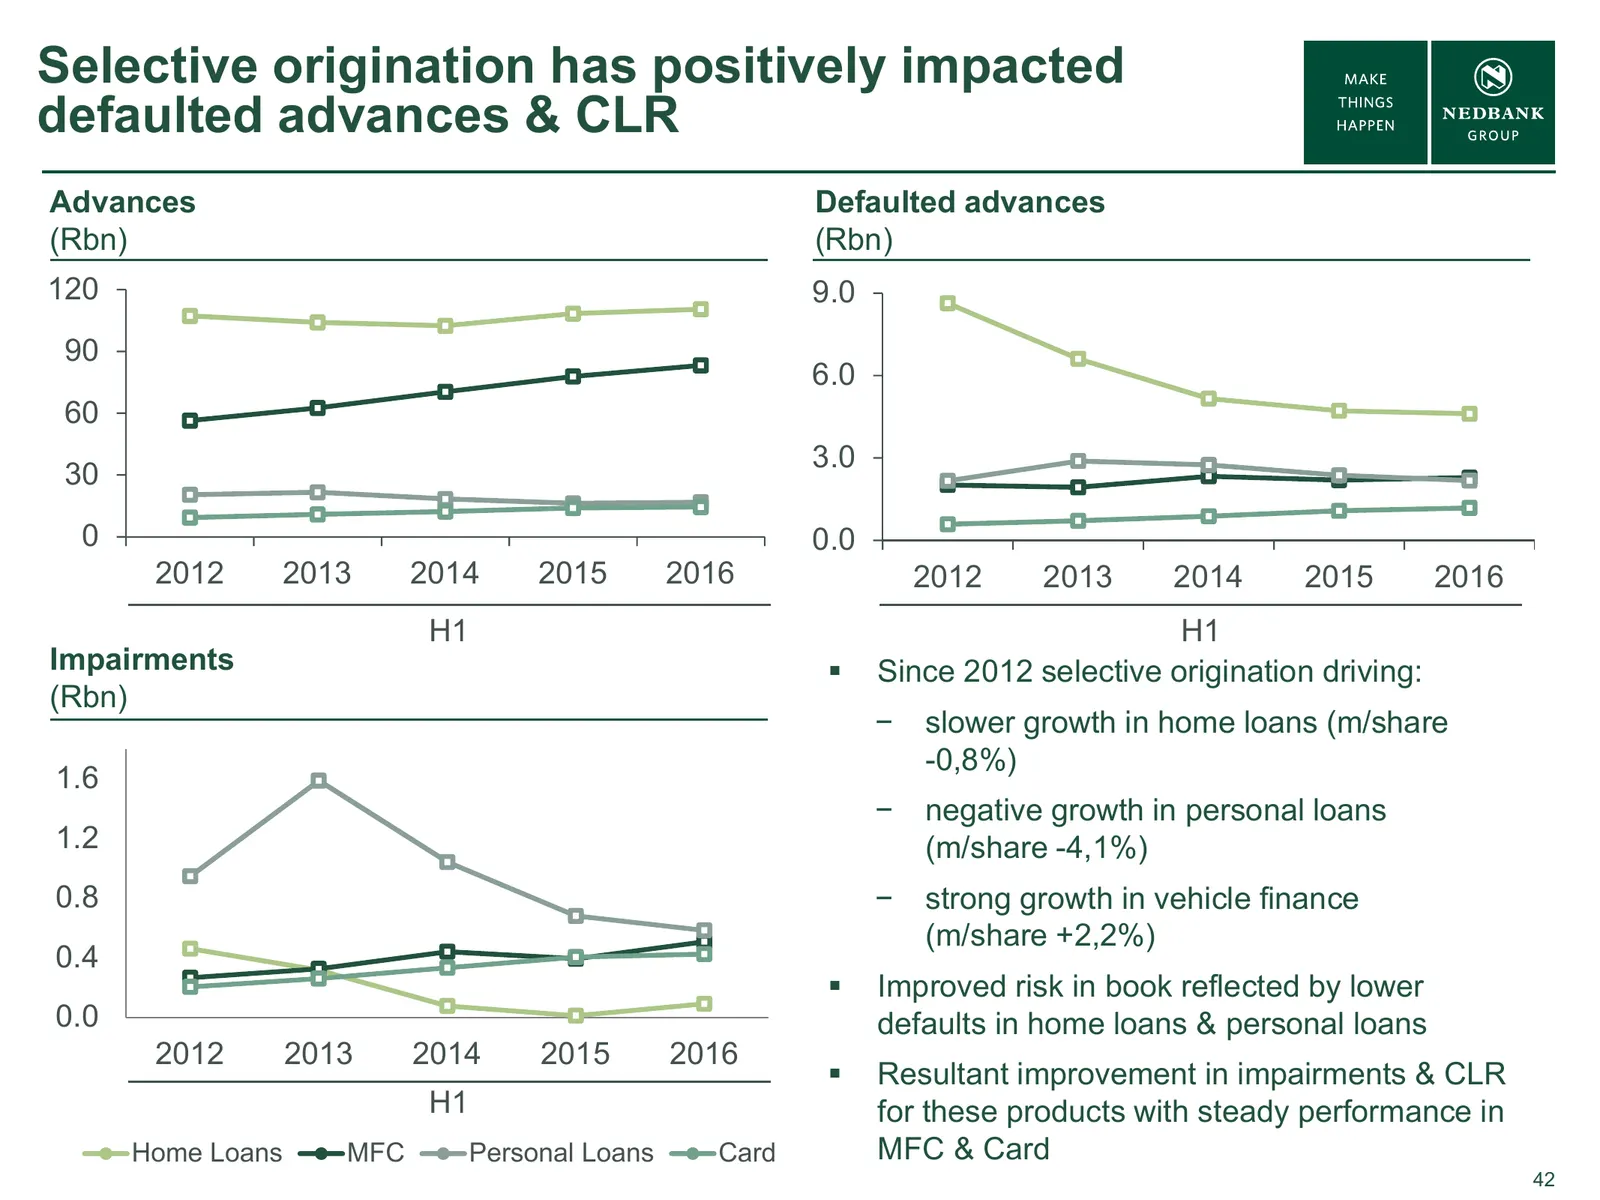
Slide 42: Selective origination has positively impacted defaulted advances & CLR
Selective origination has positively impacted defaulted advances & CLR Advances Defaulted advances (Rbn) (Rbn) 120 9.0 90 6.0 60 3.0 30 0 0.0 2012 2013 2014 2015 2016 2012 2013 2014 2015 2016 H1 H1 Impairments Since 2012 selective origination driving: (Rbn) − slower growth in home loans (m/share -
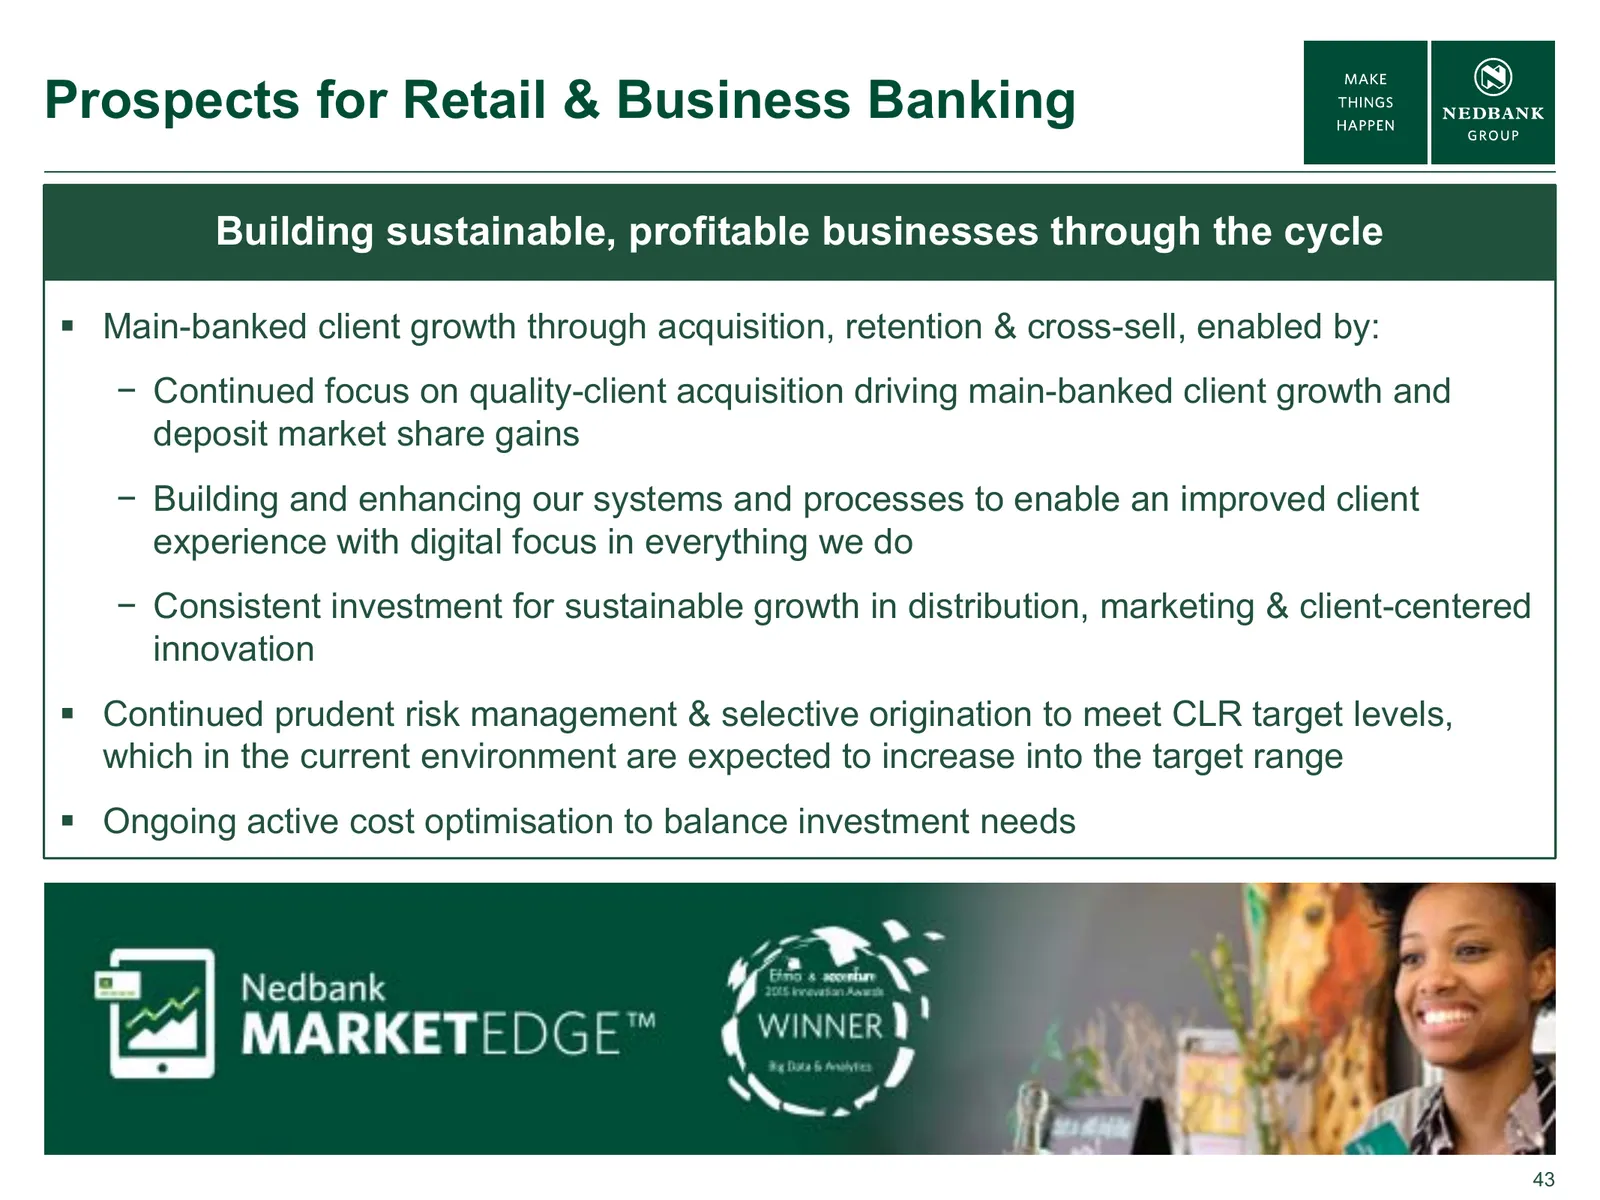
Slide 43: Prospects for Retail & Business Banking
Prospects for Retail & Business Banking Building sustainable, profitable businesses through the cycle Main-banked client growth through acquisition, retention & cross-sell, enabled by: − Continued focus on quality-client acquisition driving main-banked client growth and deposit market share gains

Slide 44: Nedbank Wealth
NEDBANK WEALTH IOLANDA RUGGIERO Strong performance & return on equity in challenging times.
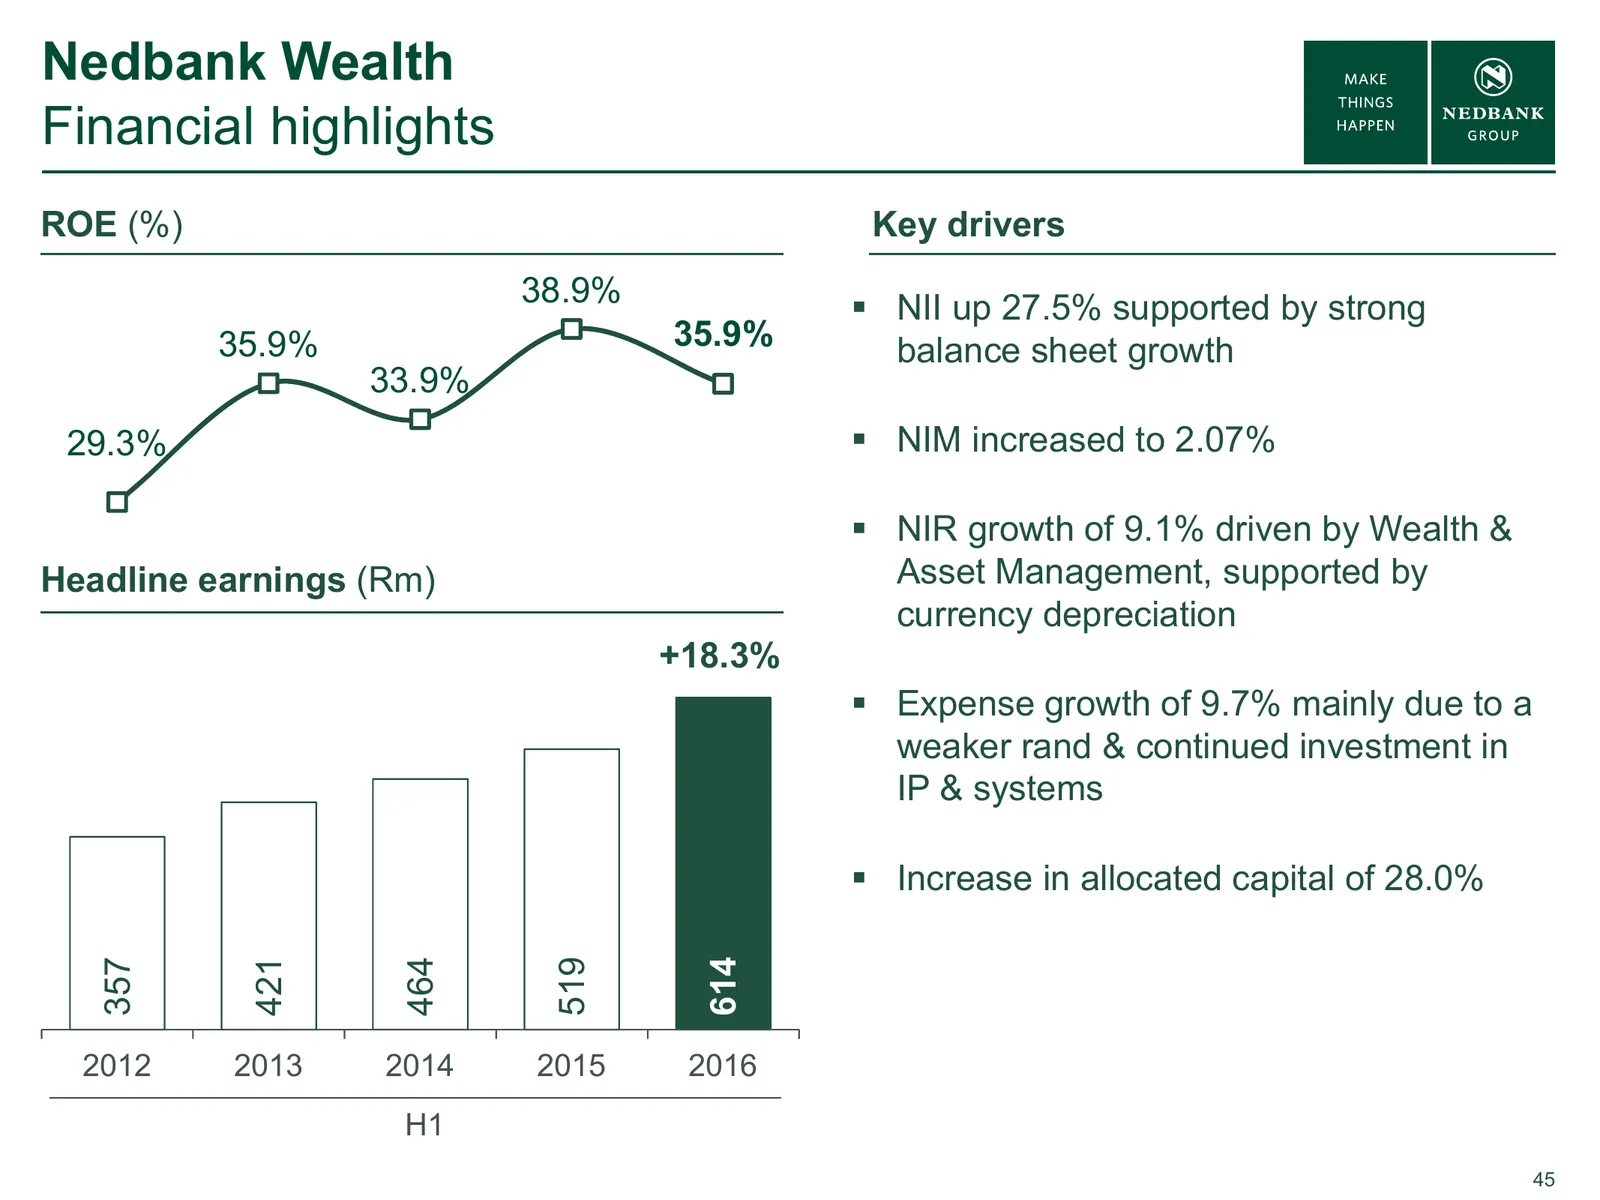
Slide 45: Nedbank Wealth Financial highlights
Nedbank Wealth Financial highlights ROE (%) Key drivers 38.9% NII up 27.5% supported by strong 35.9% 35.9% balance sheet growth 33.9% 29.3% NIM increased to 2.07% NIR growth of 9.1% driven by Wealth & Headline earnings (Rm) Asset Management, supported by currency depreciation +18.3% Expense
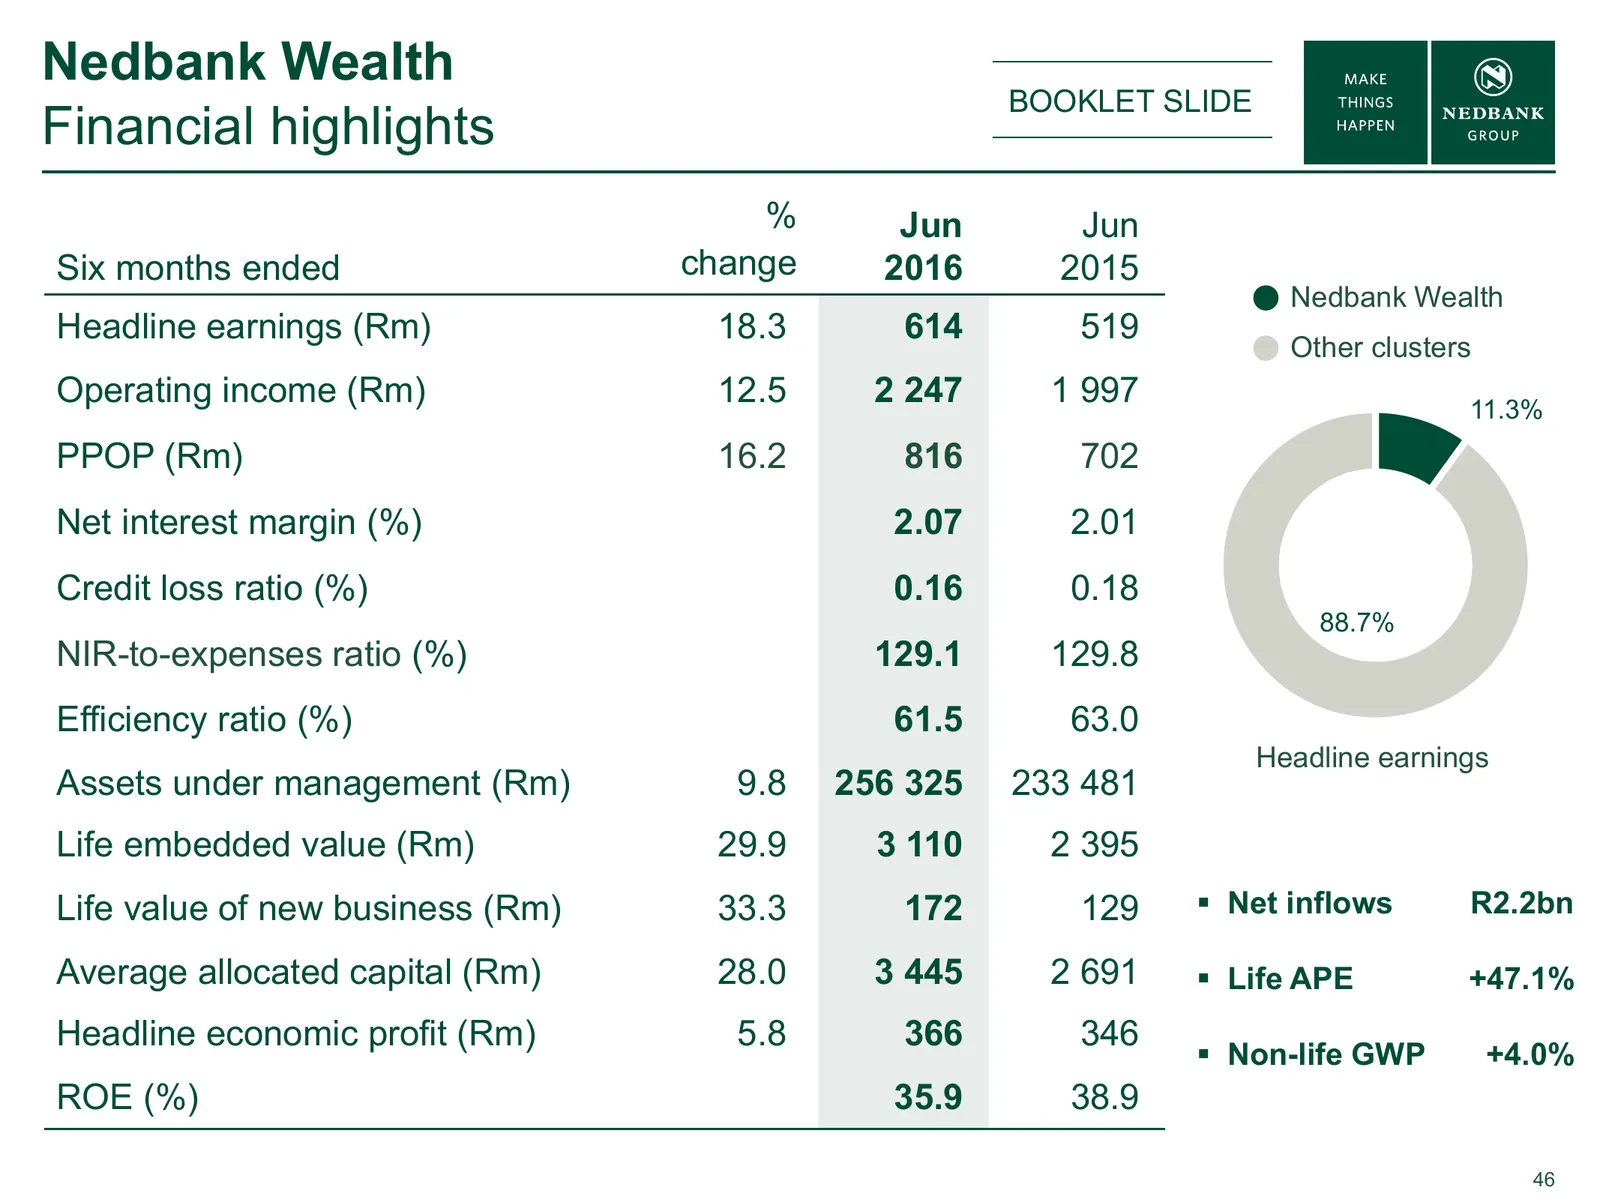
Slide 46: Nedbank Wealth Financial highlights
Nedbank Wealth BOOKLET SLIDE Financial highlights % Jun Jun Six months ended change 2016 2015 Nedbank Wealth Headline earnings (Rm) 18.3 614 519 Other clusters Operating income (Rm) 12.5 2 247 1 997 11.3% PPOP (Rm) 16.2 816 702 Net interest margin (%) 2.07 2.01 Credit loss ratio (%) 0.16 0.18 88.7%
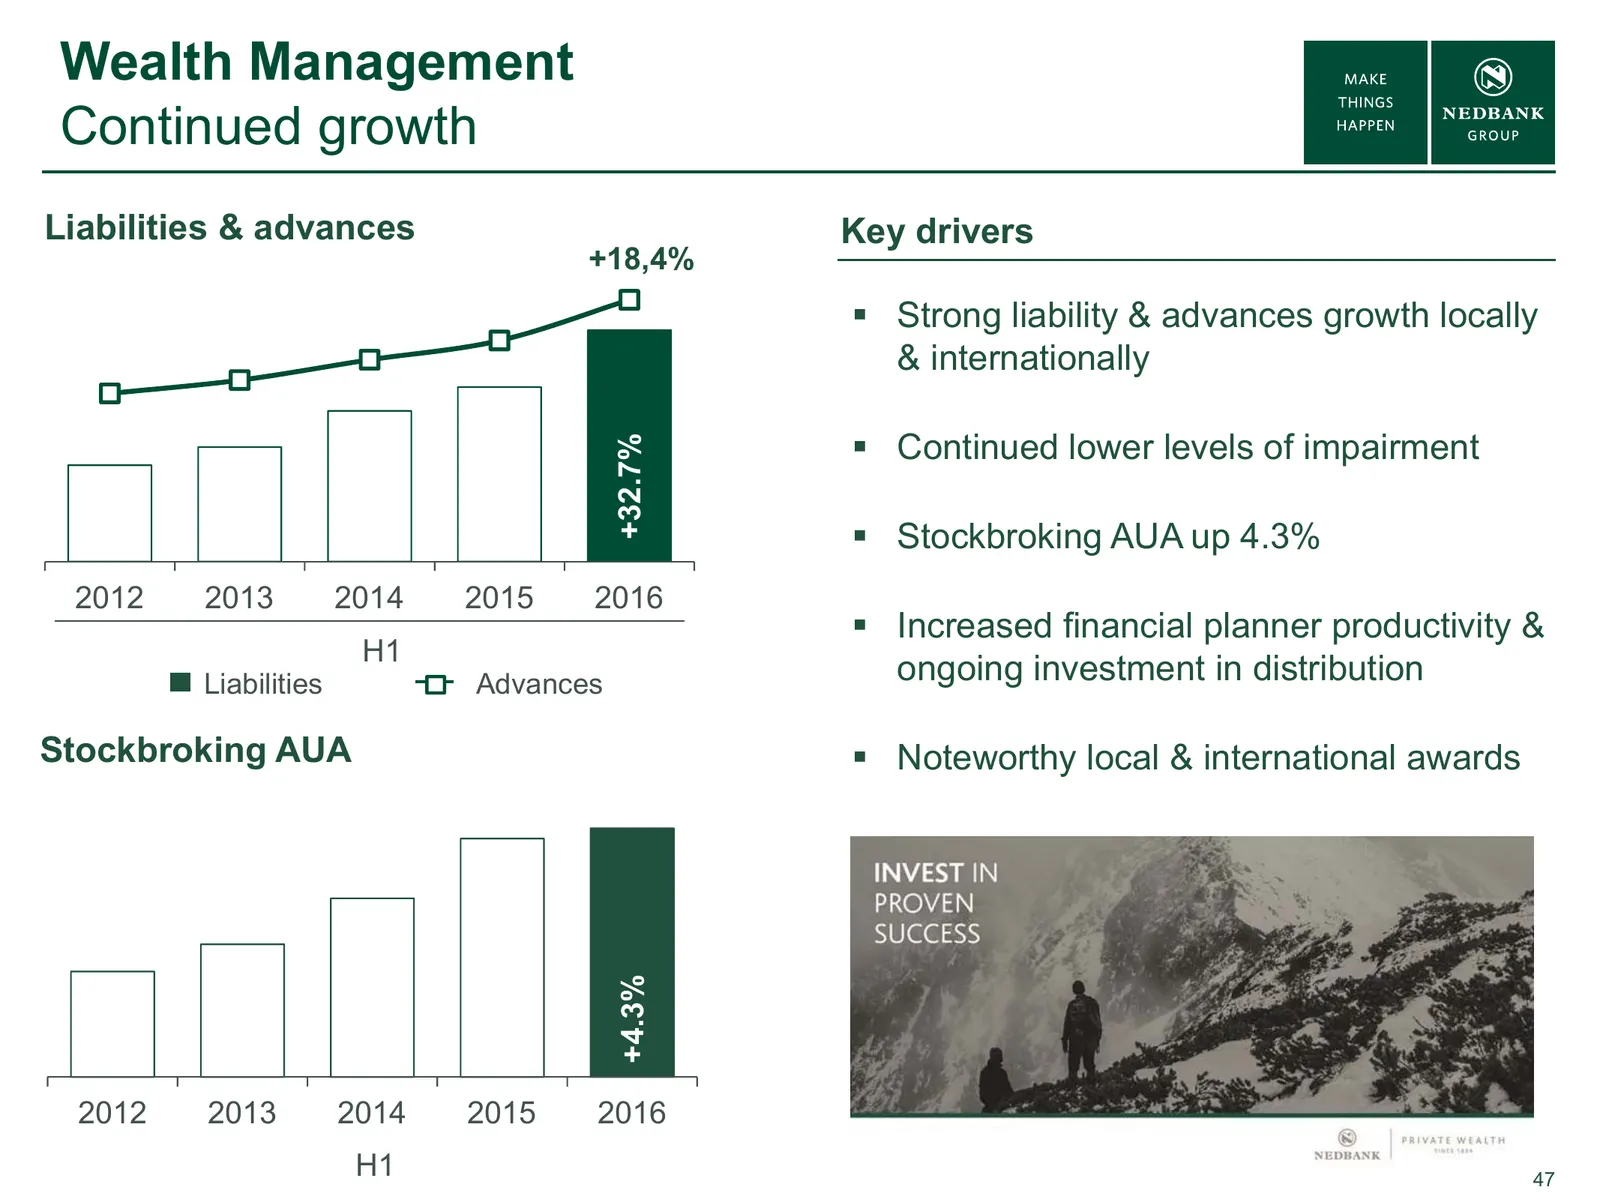
Slide 47: Wealth Management Continued growth
Wealth Management Continued growth Liabilities & advances Key drivers +18,4% Strong liability & advances growth locally & internationally Continued lower levels of impairment +32.7% Stockbroking AUA up 4.3% 2012 2013 2014 2015 2016 Increased financial planner productivity & H1 Liabilities Ad
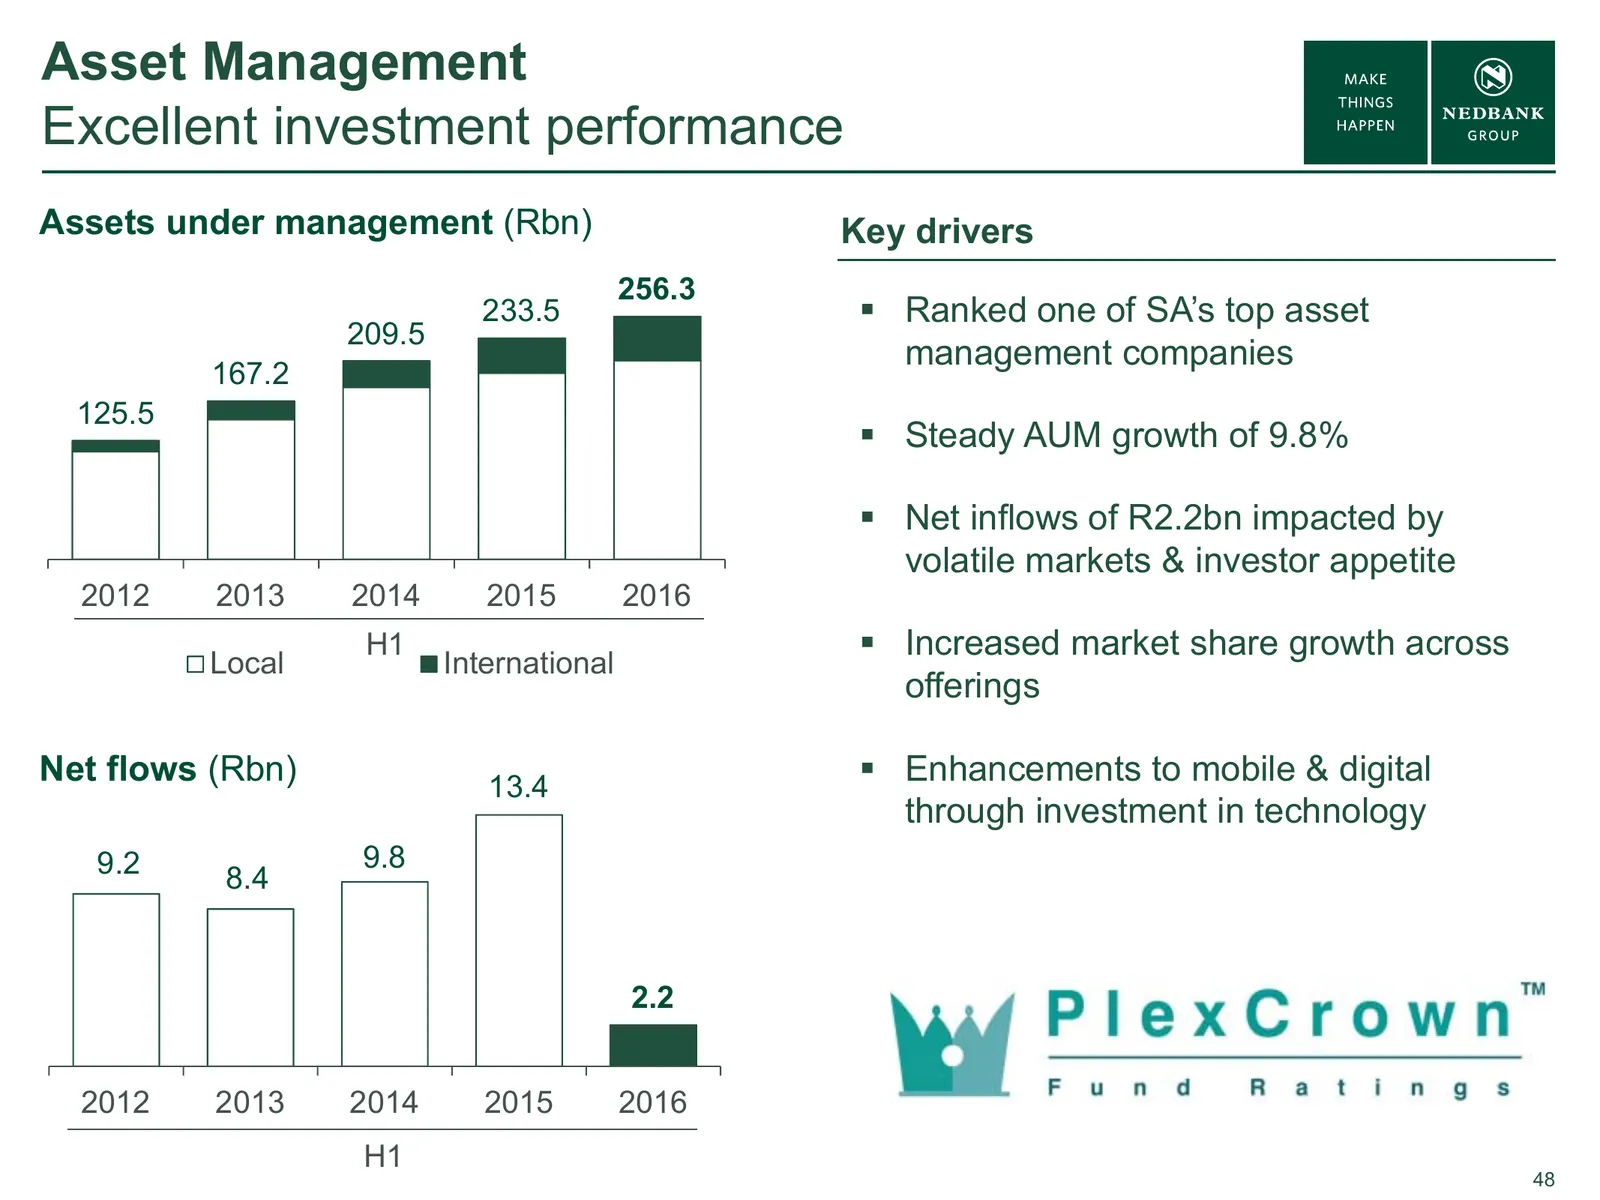
Slide 48: Asset Management Excellent investment performance
Asset Management Excellent investment performance Assets under management (Rbn) Key drivers 256.3 233.5 Ranked one of SA’s top asset 209.5 management companies 167.2 125.5 Steady AUM growth of 9.8% Net inflows of R2.2bn impacted by volatile markets & investor appetite 2012 2013 2014 2015 2016
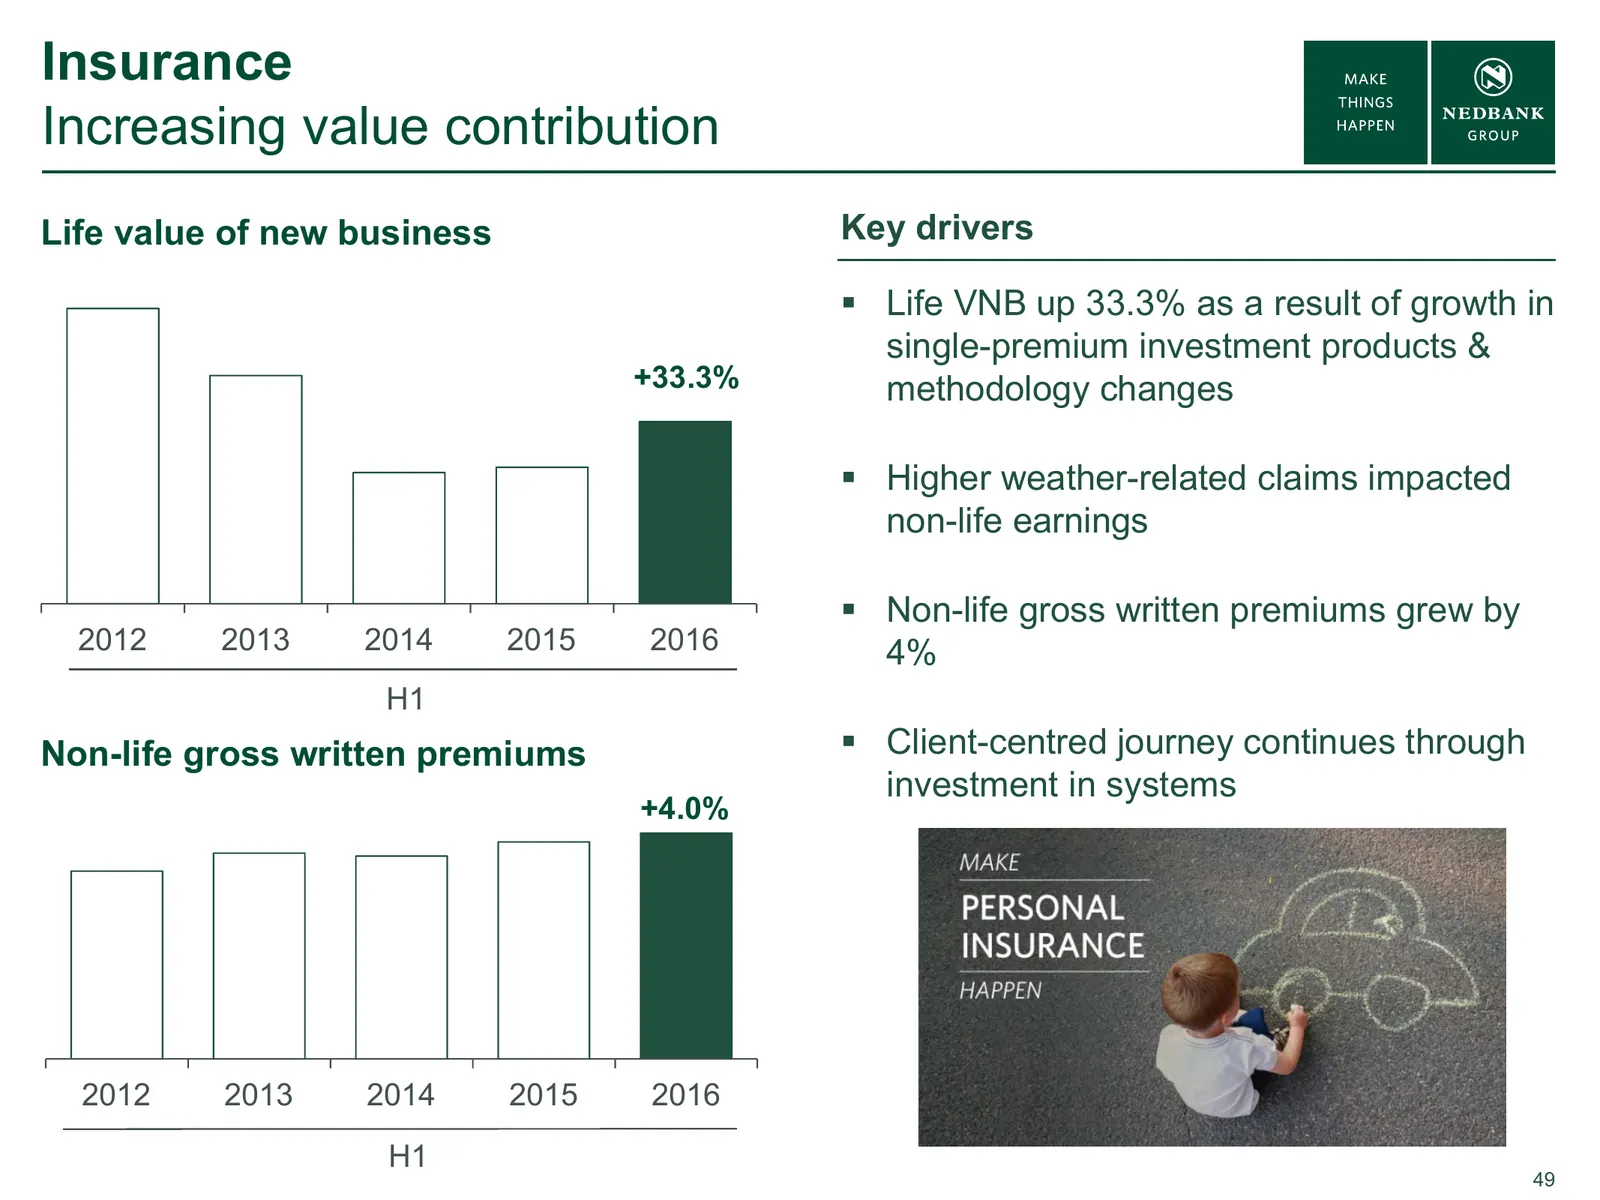
Slide 49: Insurance Increasing value contribution
Insurance Increasing value contribution Life value of new business Key drivers Life VNB up 33.3% as a result of growth in single-premium investment products & +33.3% methodology changes +4,0% Higher weather-related claims impacted non-life earnings Non-life gross written premiums grew by 2012
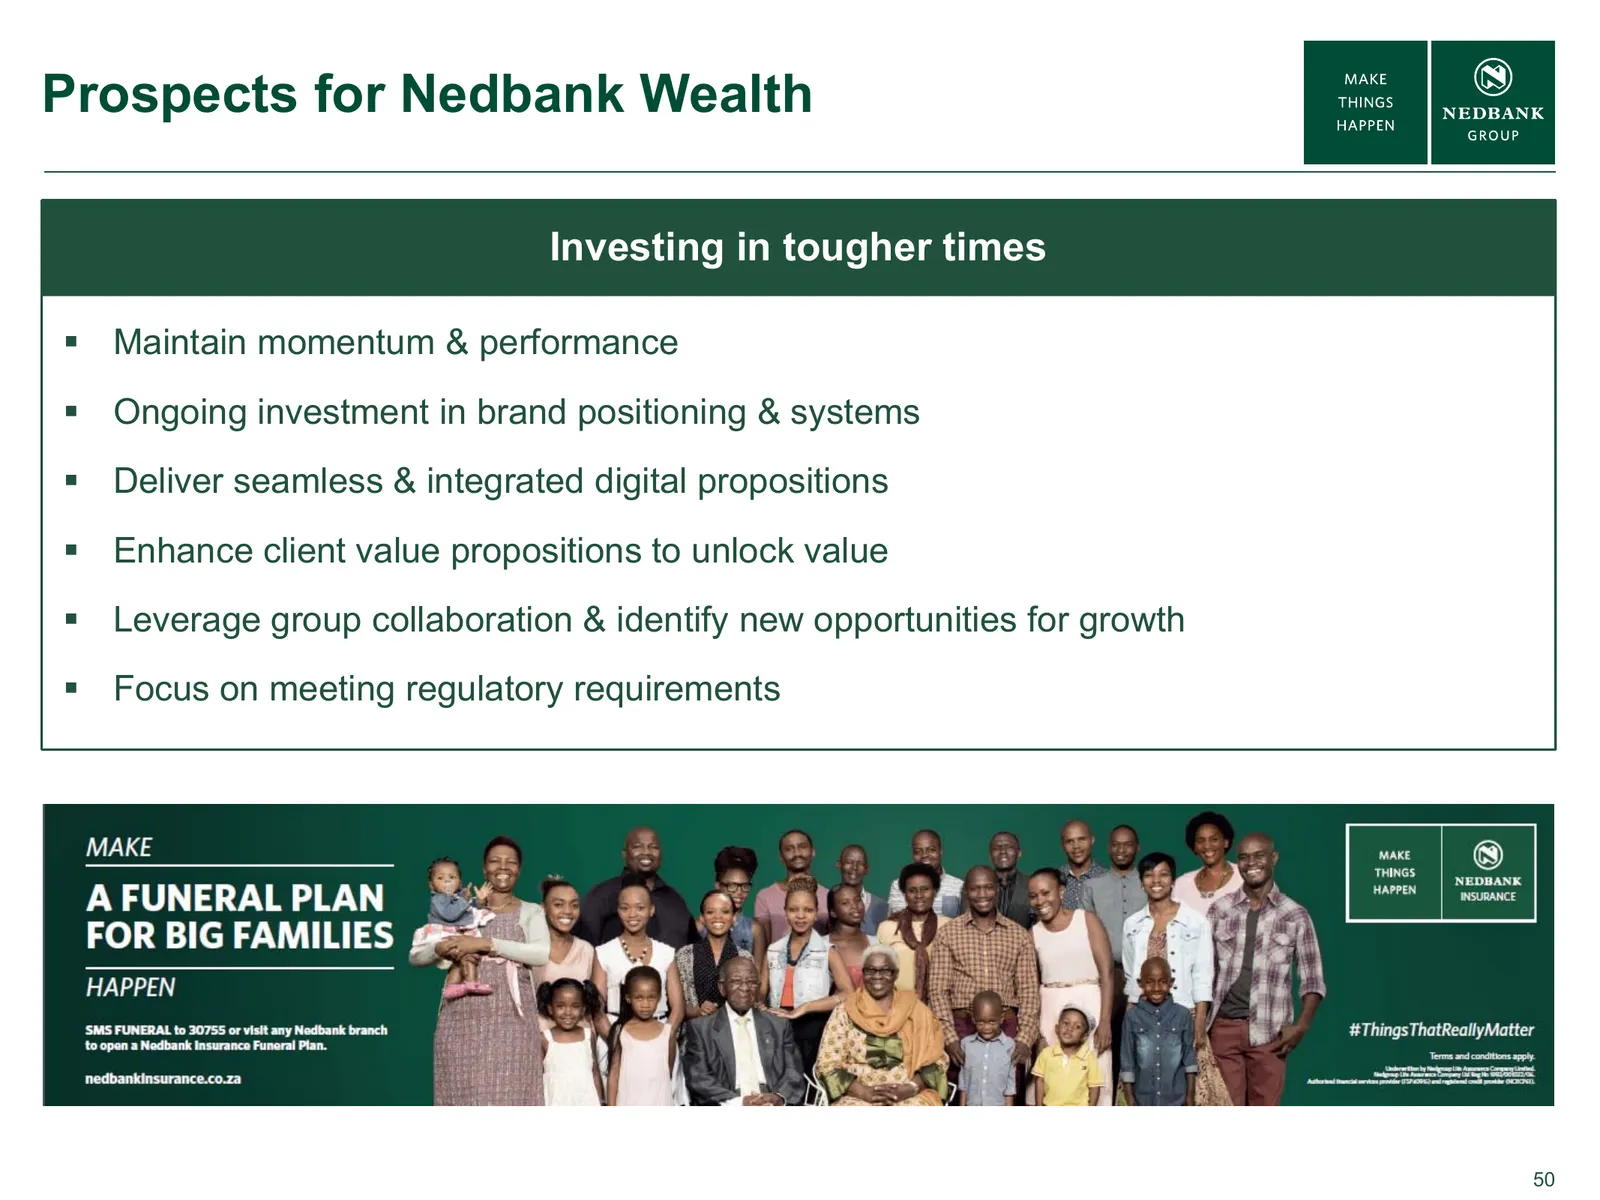
Slide 50: Prospects for Nedbank Wealth
Prospects for Nedbank Wealth Investing in tougher times Maintain momentum & performance Ongoing investment in brand positioning & systems Deliver seamless & integrated digital propositions Enhance client value propositions to unlock value Leverage group collaboration & identify new opportu

Slide 51: Rest of Africa
REST OF AFRICA MFUNDO NKUHLU Building a regional champion with access to a pan-African network.
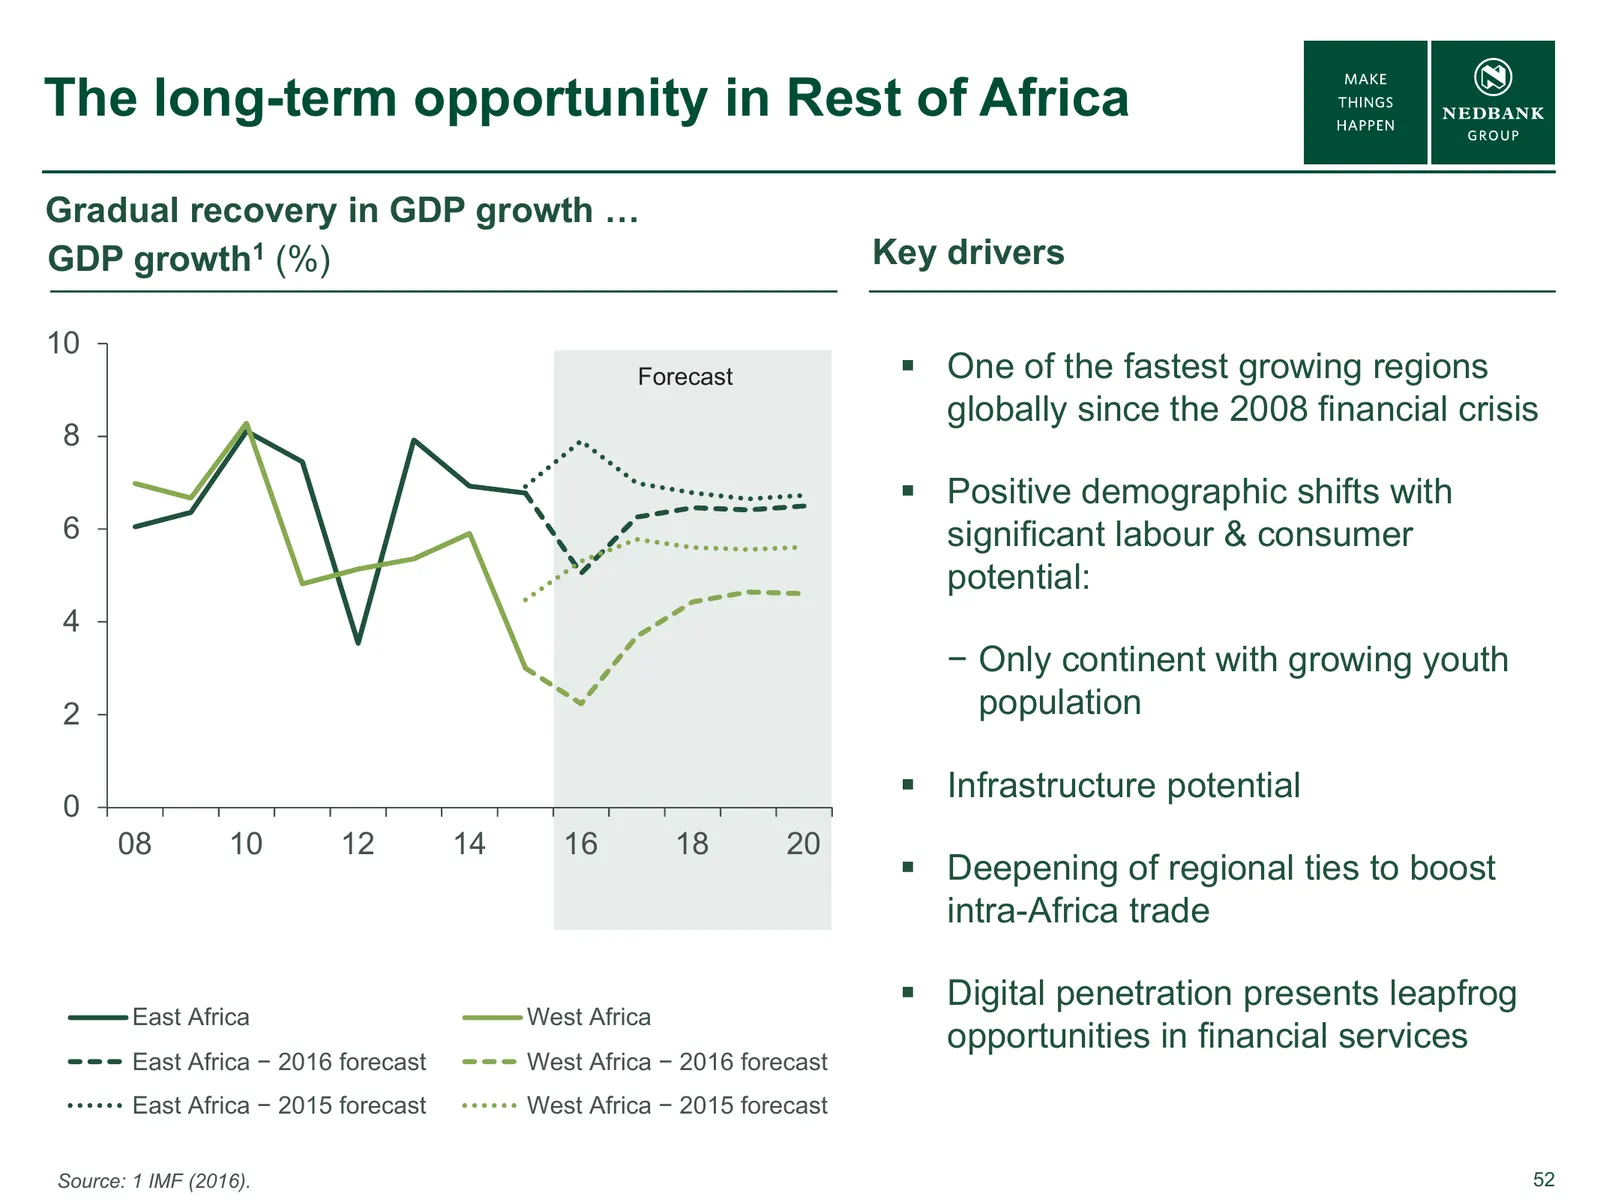
Slide 52: The long-term opportunity in Rest of Africa
The long-term opportunity in Rest of Africa Gradual recovery in GDP growth … GDP growth1 (%) Key drivers 10 Forecast One of the fastest growing regions globally since the 2008 financial crisis 8 Positive demographic shifts with 6 significant labour & consumer potential: 4 − Only continent with g
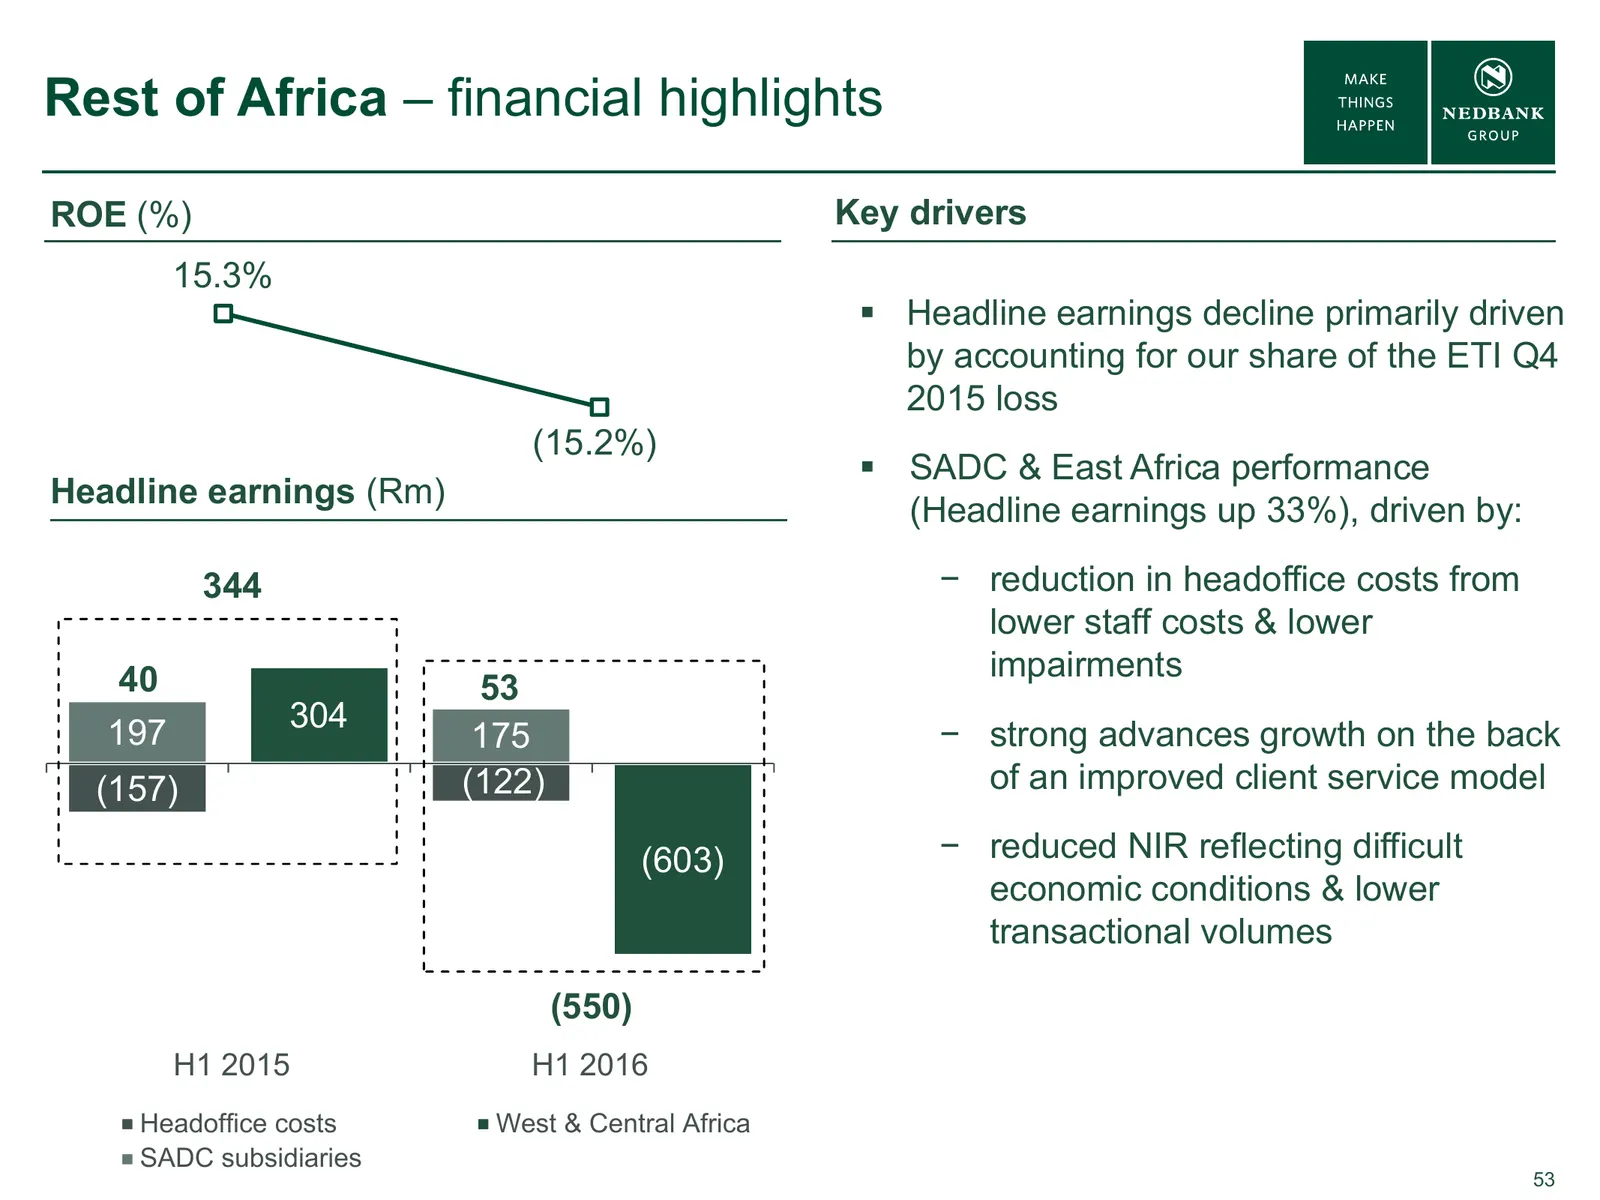
Slide 53: Rest of Africa – financial highlights
Rest of Africa – financial highlights ROE (%) Key drivers 15.3% Headline earnings decline primarily driven by accounting for our share of the ETI Q4 2015 loss (15.2%) SADC & East Africa performance Headline earnings (Rm) (Headline earnings up 33%), driven by: 344 − reduction in headoffice costs
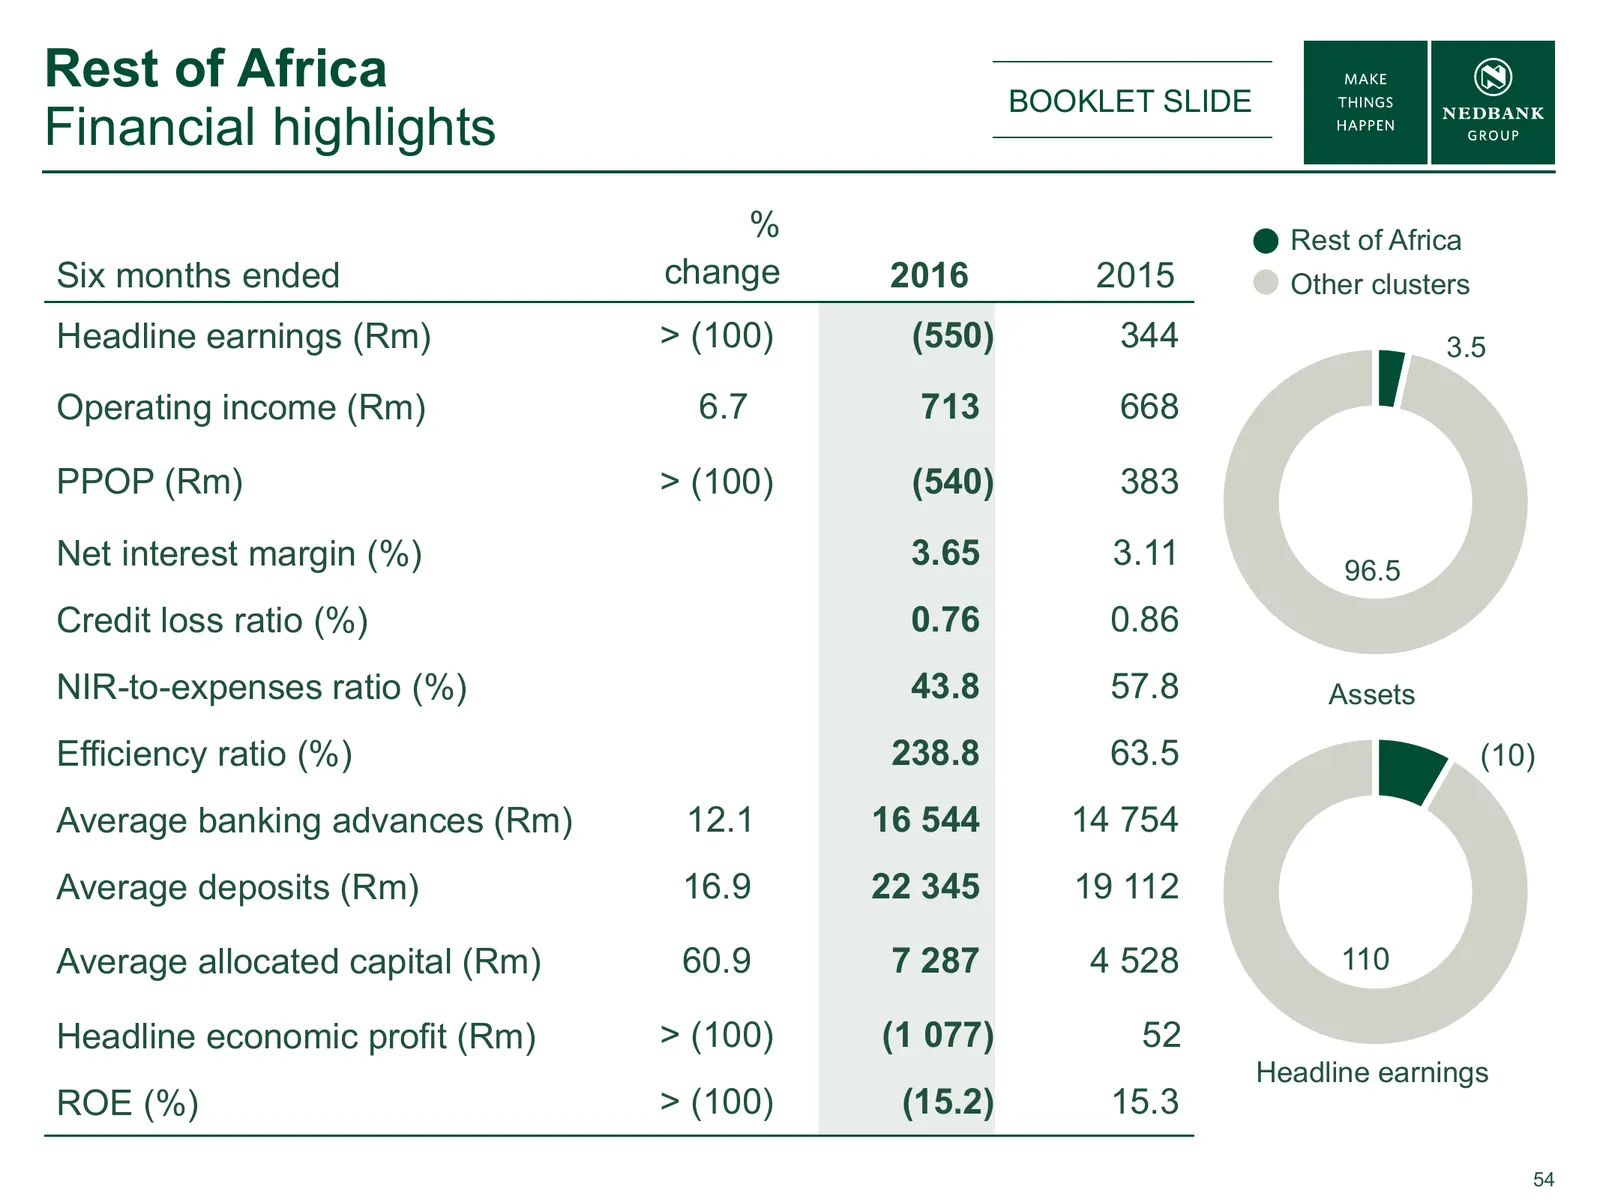
Slide 54: Rest of Africa Financial highlights
Rest of Africa BOOKLET SLIDE Financial highlights % Rest of Africa Six months ended change 2016 2015 Other clusters Headline earnings (Rm) > (100) (550) 344 3.5 Operating income (Rm) 6.7 713 668 PPOP (Rm) > (100) (540) 383 Net interest margin (%) 3.65 3.11 96.5 Credit loss ratio (%) 0.76 0.86 NIR-to
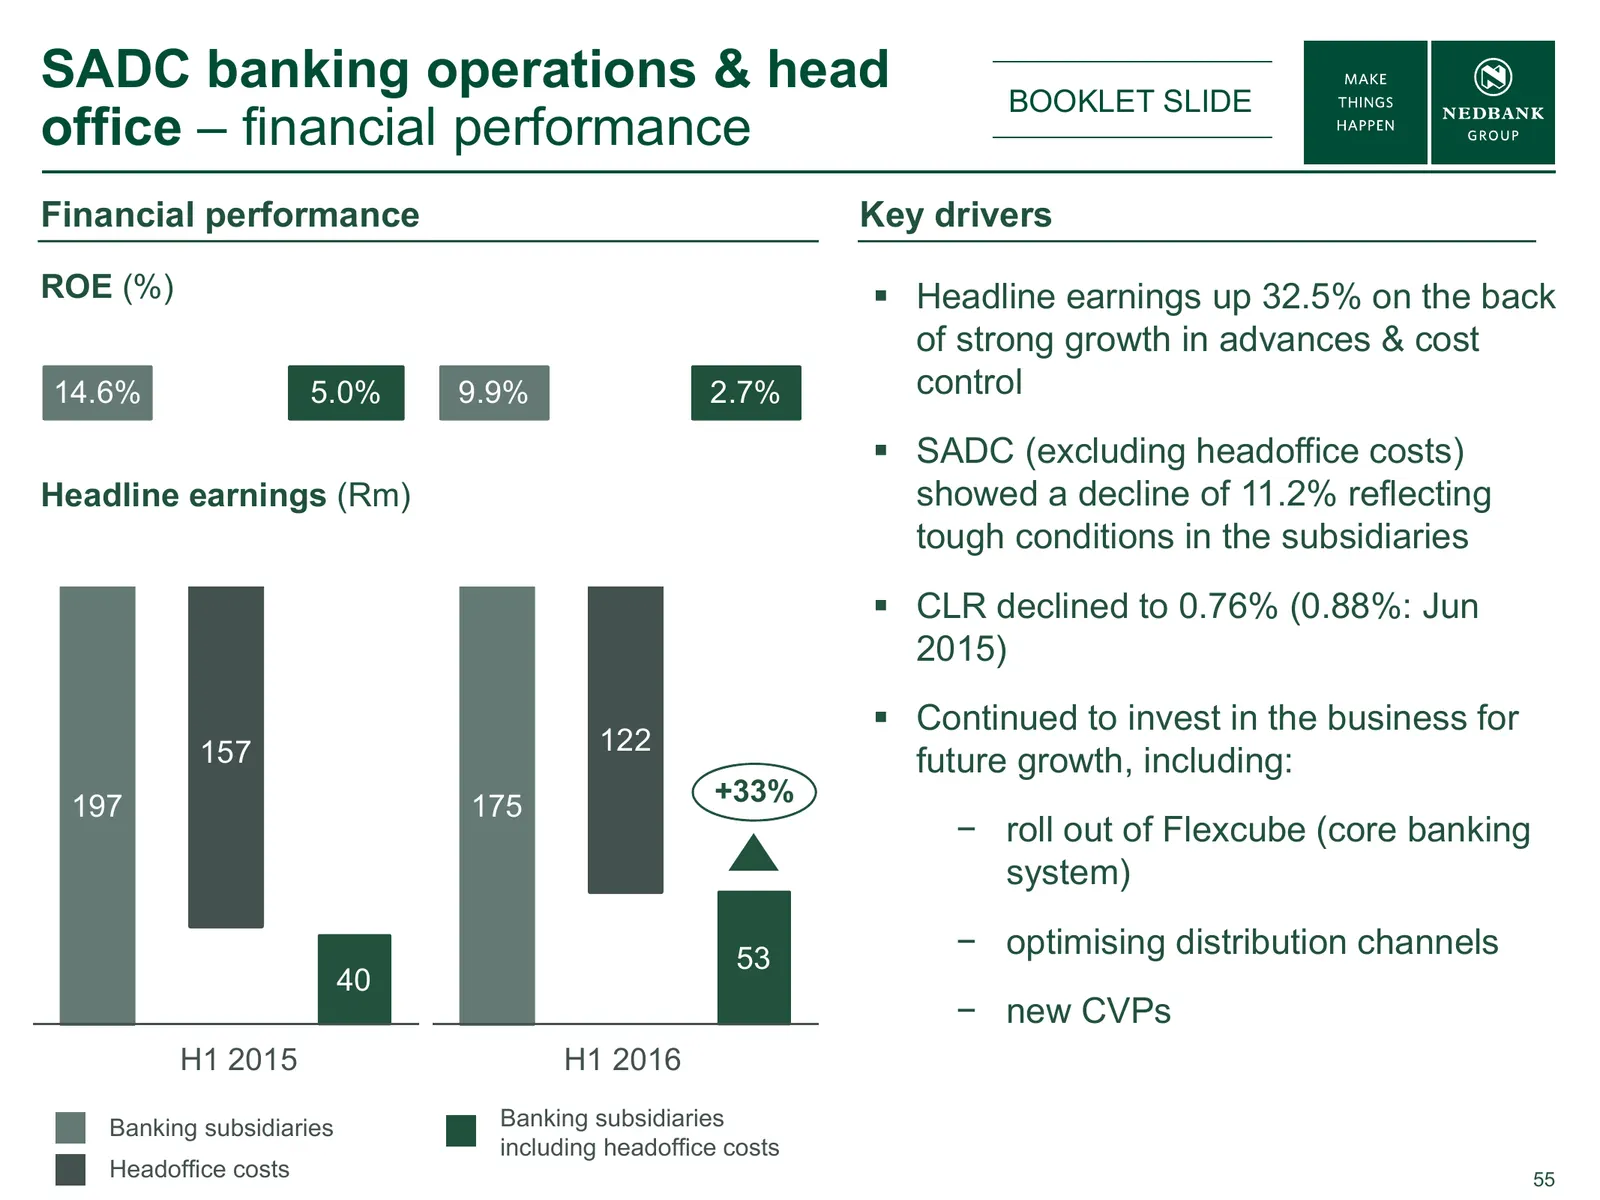
Slide 55: SADC banking operations & head office – financial performance
SADC banking operations & head BOOKLET SLIDE office – financial performance Financial performance Key drivers ROE (%) Headline earnings up 32.5% on the back of strong growth in advances & cost 14.6% 5.0% 9.9% 2.7% control SADC (excluding headoffice costs) Headline earnings (Rm) showed a decline
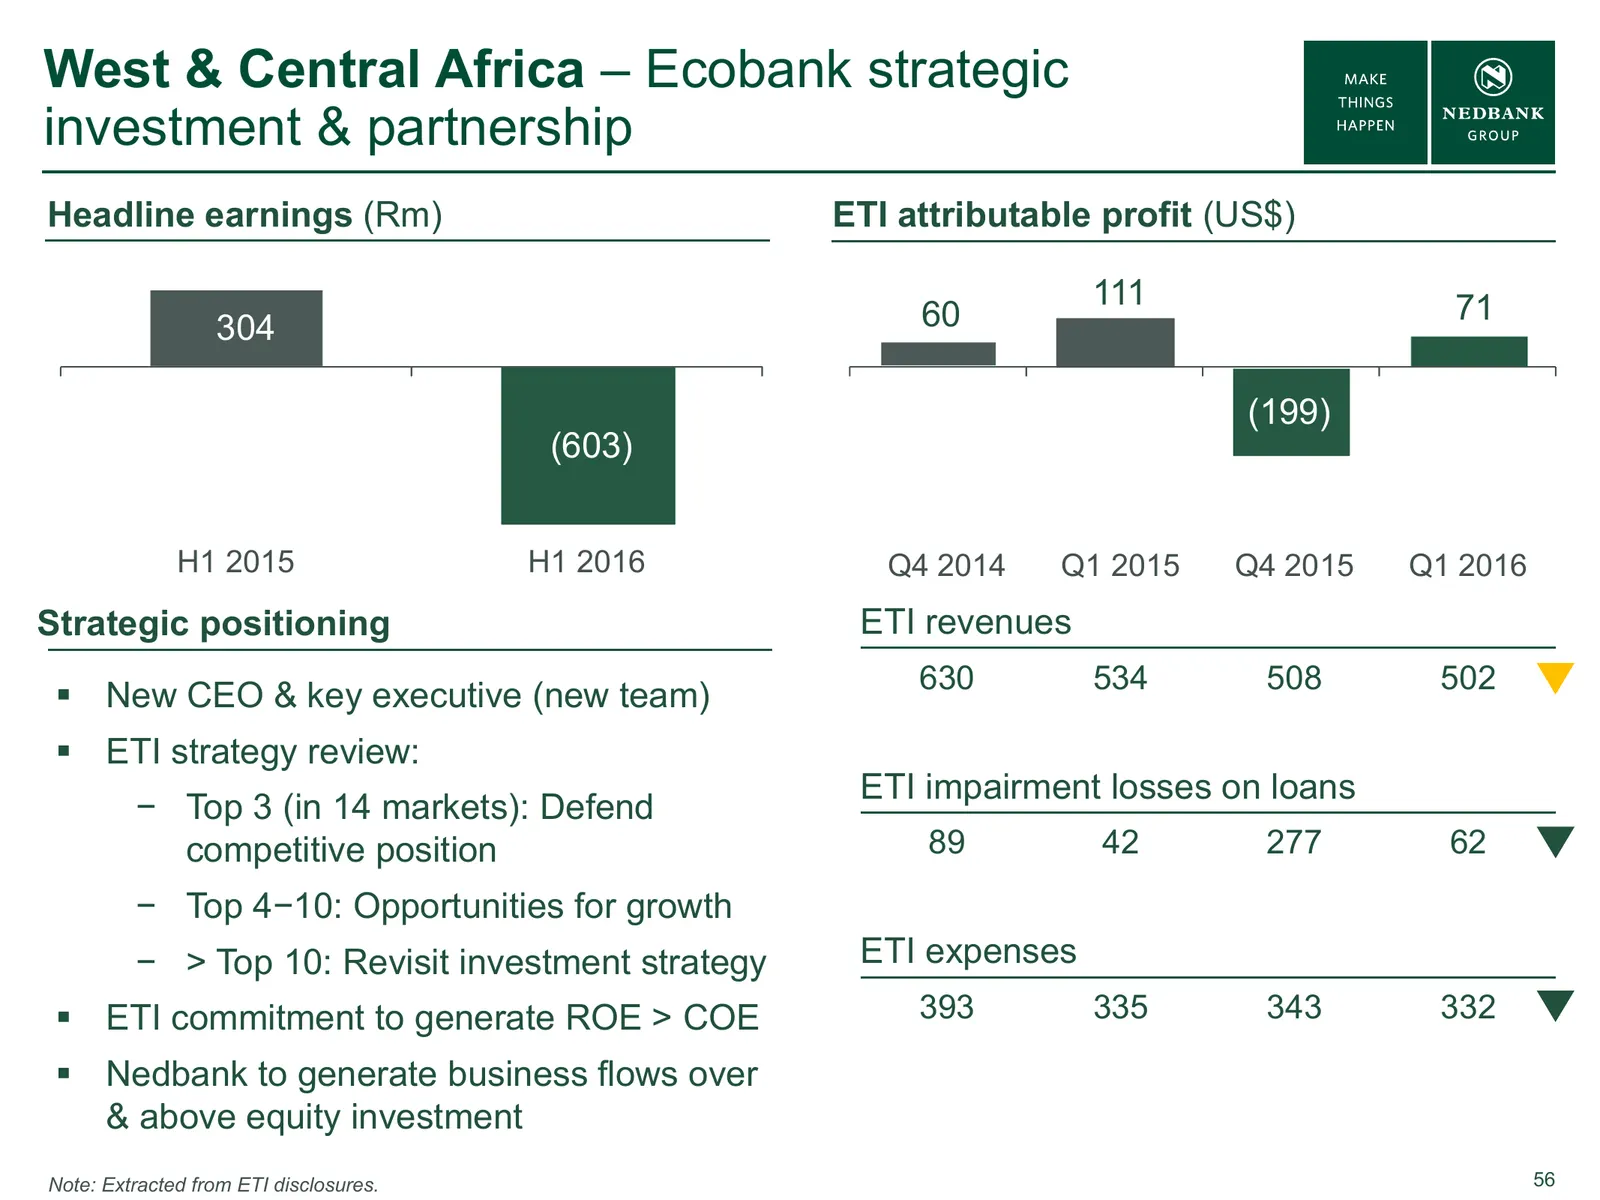
Slide 56: West & Central Africa – Ecobank strategic investment & partnership
West & Central Africa – Ecobank strategic investment & partnership Headline earnings (Rm) ETI attributable profit (US$) 111 71 304 60 (199) (603) H1 2015 H1 2016 Q4 Q42014 2014 Q1 Q1 2015 2015 Q4 Q4 2015 2015 Q1 2016 Strategic positioning ETI revenues 630 534 508 502 New CEO & key executive (new t
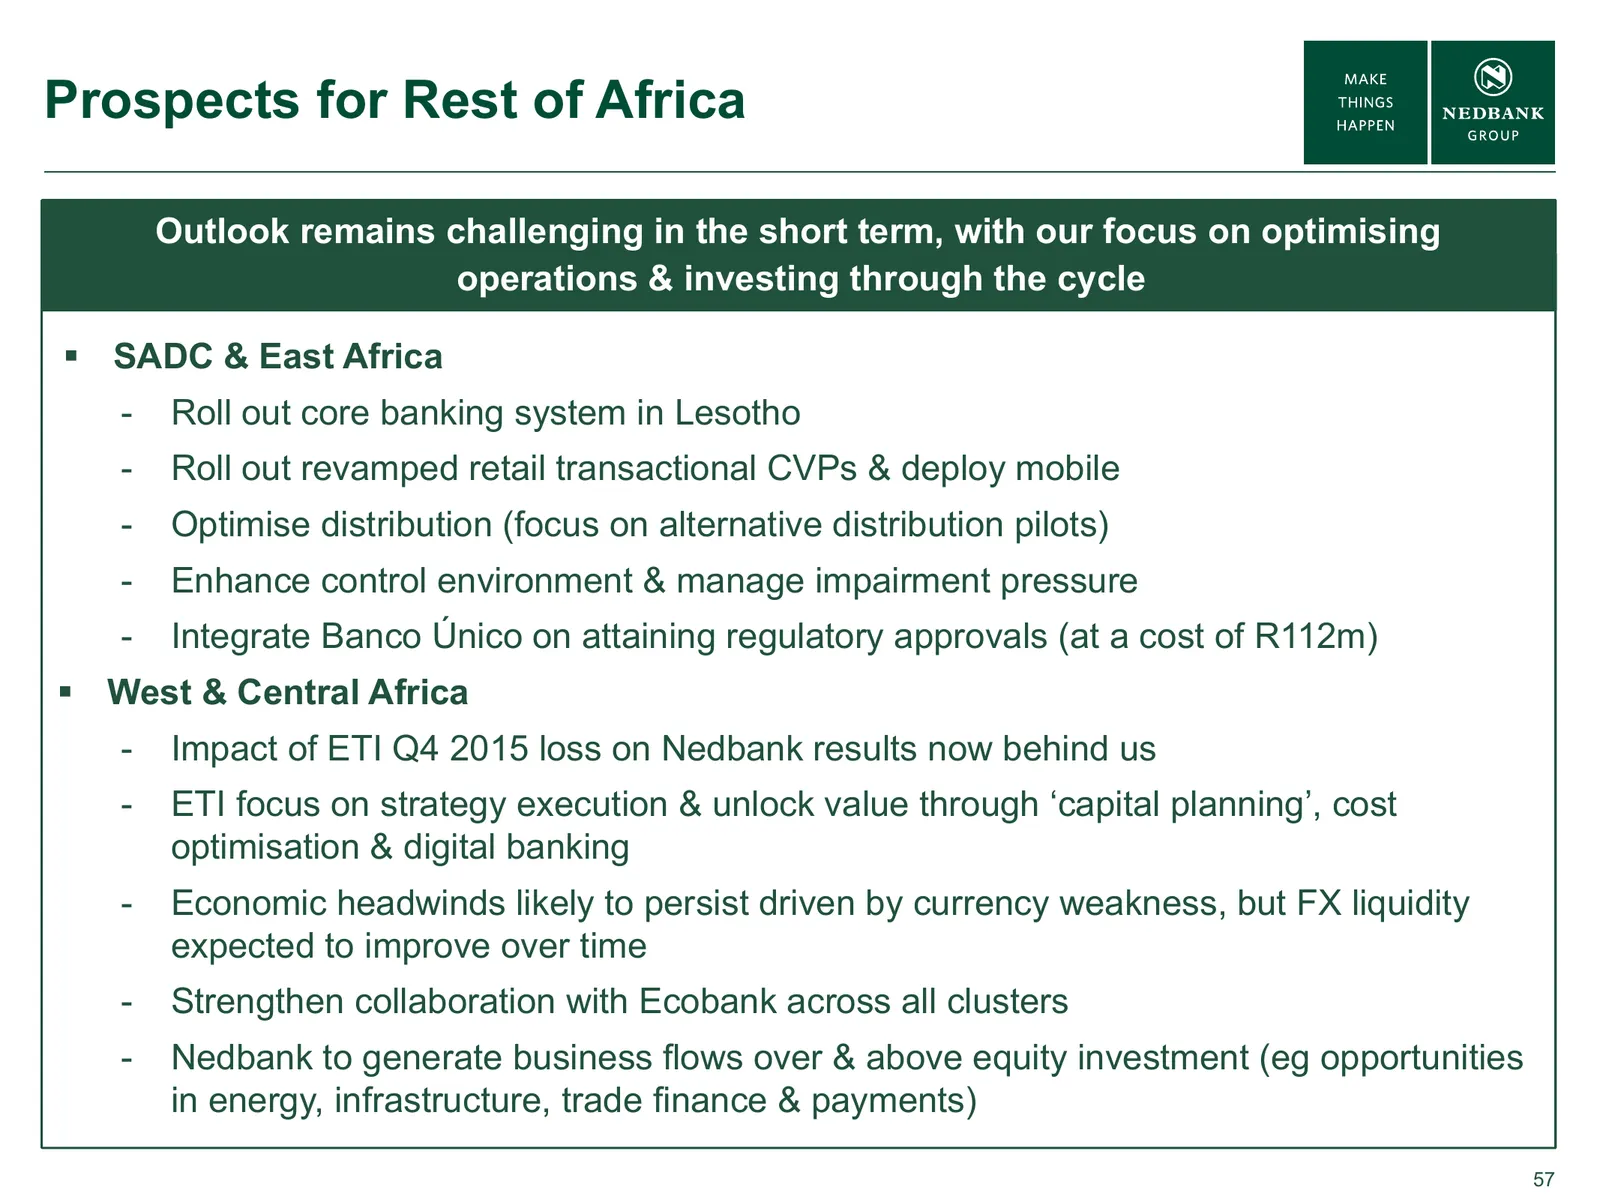
Slide 57: Prospects for Rest of Africa
Prospects for Rest of Africa Outlook remains challenging in the short term, with our focus on optimising operations & investing through the cycle SADC & East Africa - Roll out core banking system in Lesotho - Roll out revamped retail transactional CVPs & deploy mobile - Optimise distribution (focu
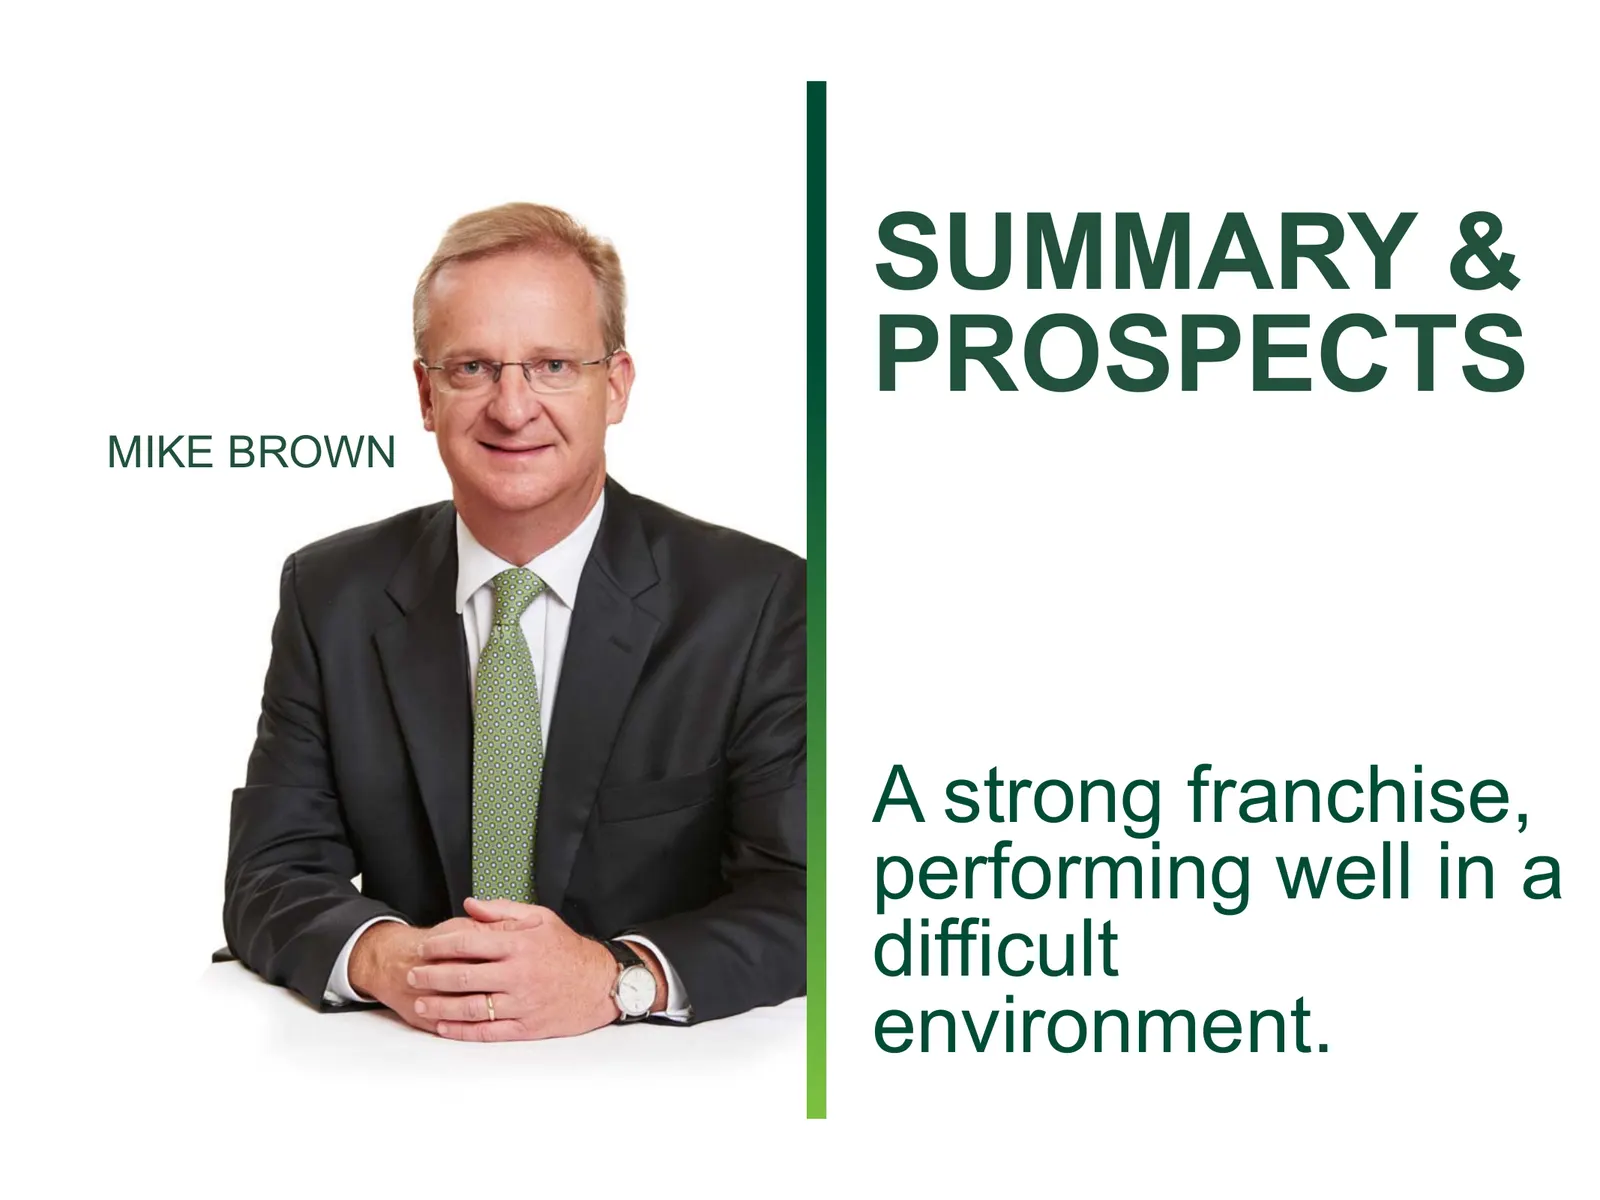
Slide 58: Summary & Prospects
SUMMARY & PROSPECTS MIKE BROWN A strong franchise, performing well in a difficult environment.
Slide 59: Managed separation update
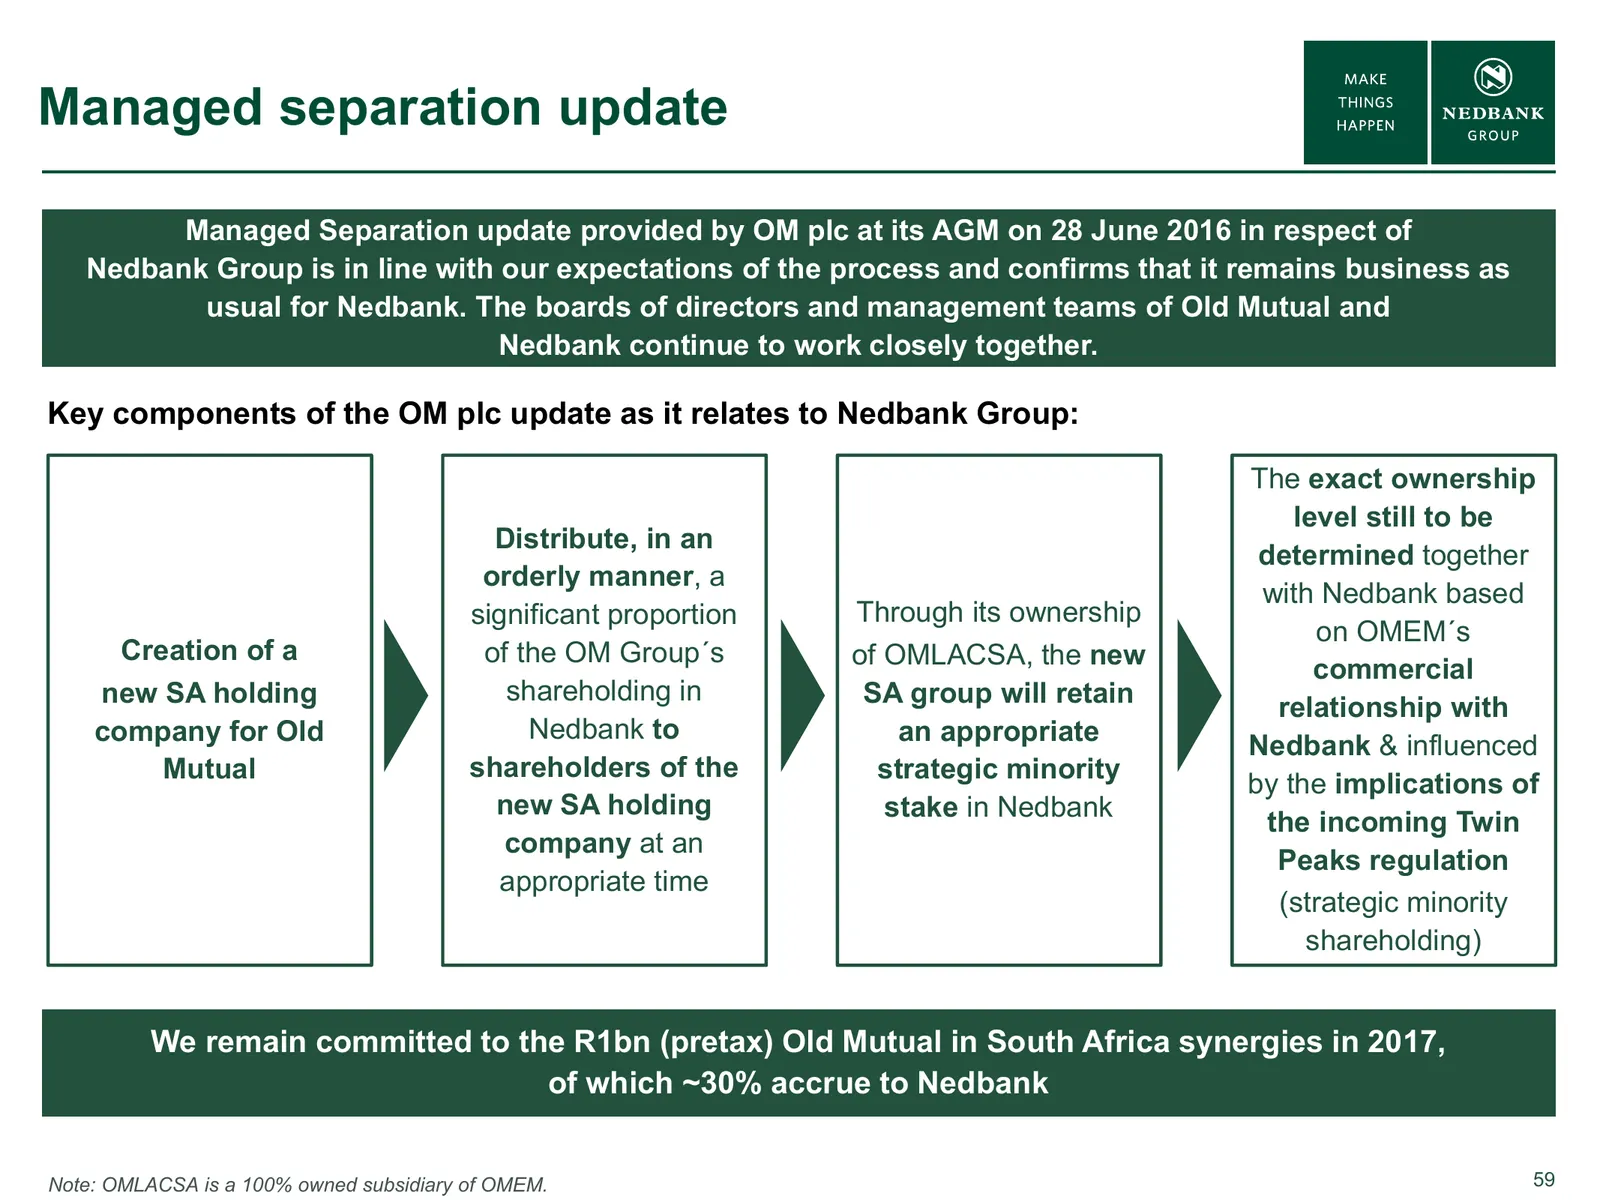
Managed separation update Managed Separation update provided by OM plc at its AGM on 28 June 2016 in respect of Nedbank Group is in line with our expectations of the process and confirms that it remains business as usual for Nedbank. The boards of directors and management teams of Old Mutual and Ned
Slide 60: Macro & industry environment
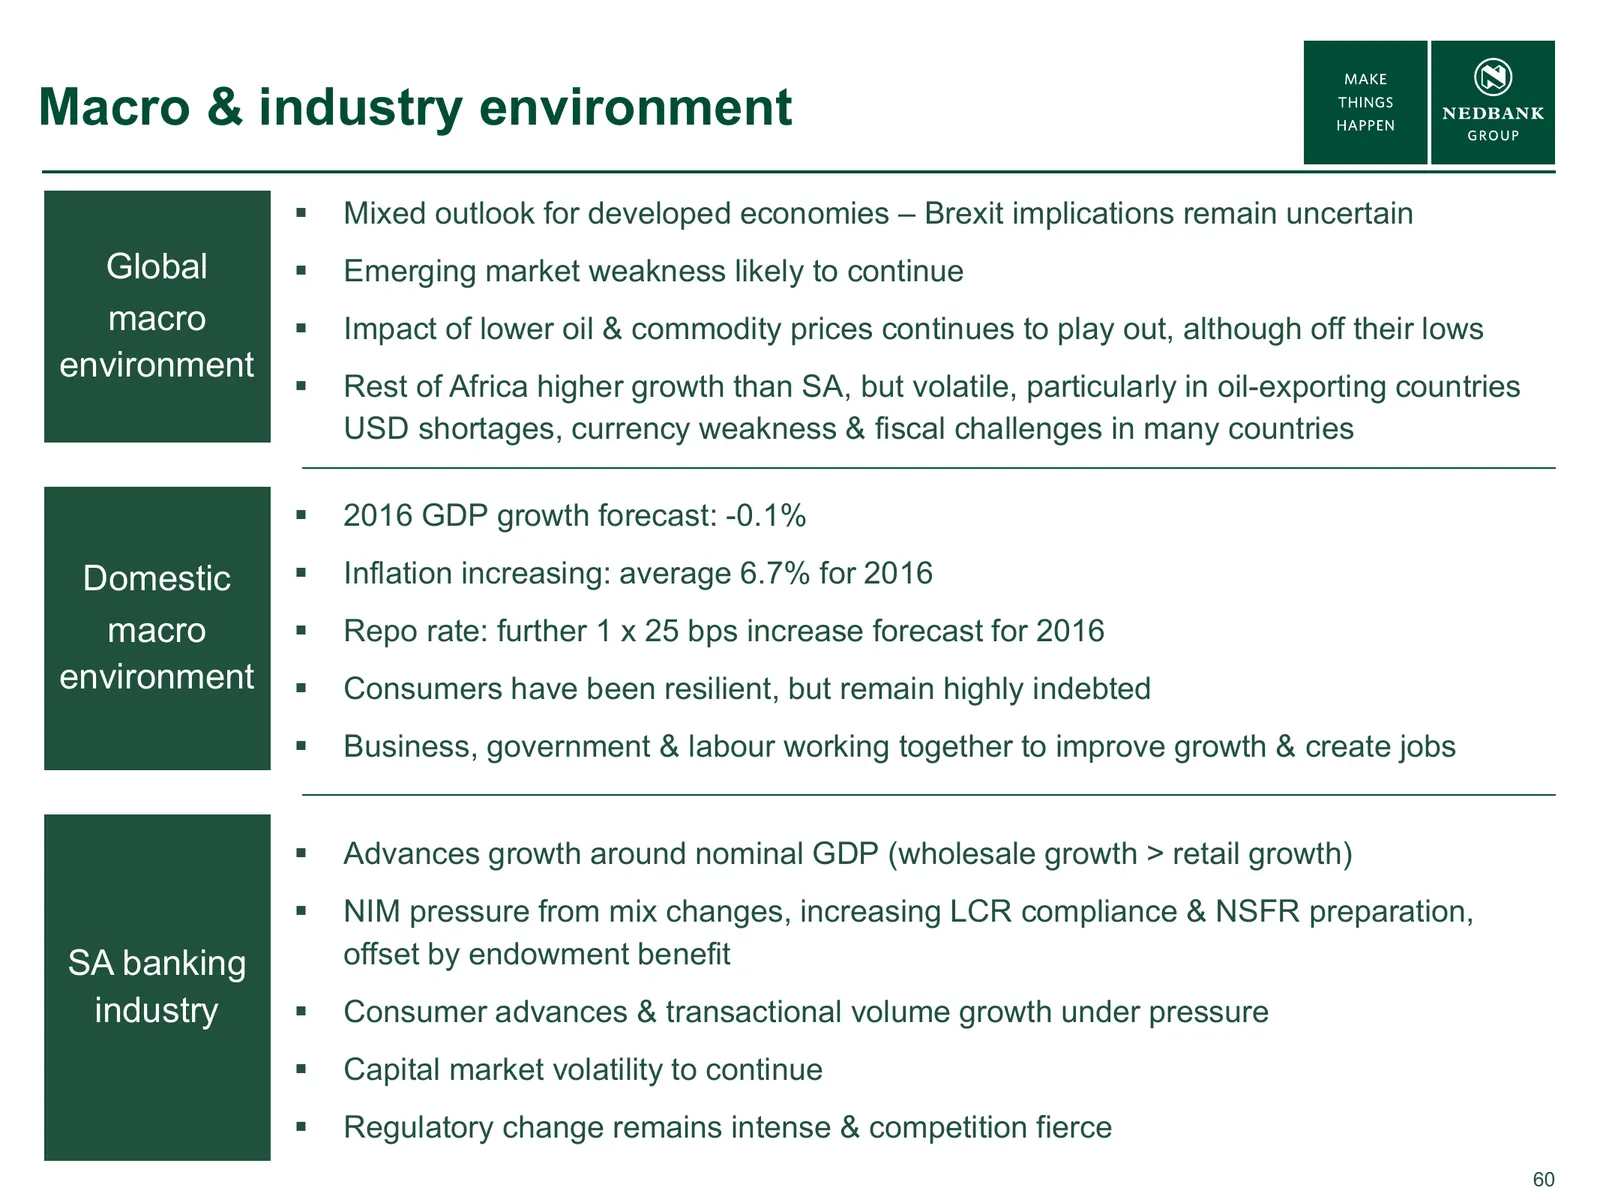
Macro & industry environment Mixed outlook for developed economies – Brexit implications remain uncertain Global Emerging market weakness likely to continue macro Impact of lower oil & commodity prices continues to play out, although off their lows environment Rest of Africa higher growth th
Slide 61: 2016 guidance – updated
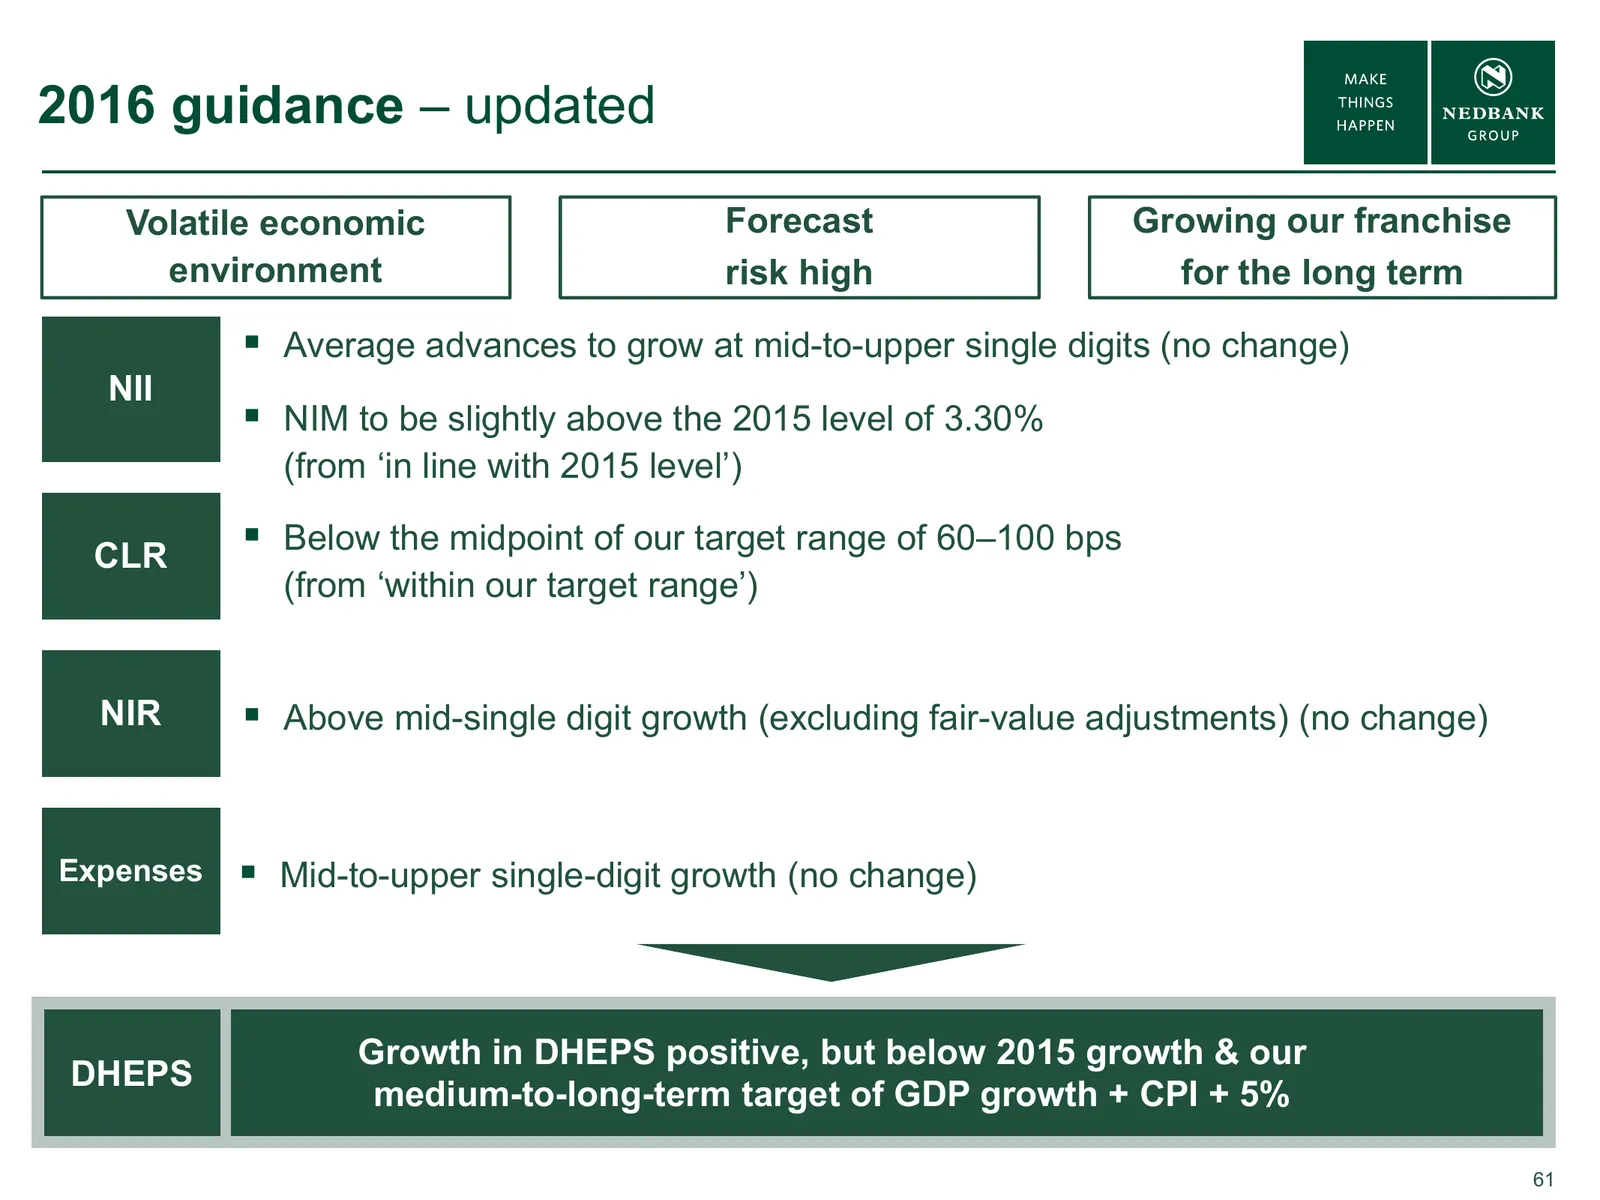
2016 guidance – updated Volatile economic Forecast Growing our franchise environment risk high for the long term Average advances to grow at mid-to-upper single digits (no change) NII NIM to be slightly above the 2015 level of 3.30% (from ‘in line with 2015 level’) CLR Below the midpoint of ou

Slide 62: Thank you
MAKE THINGS HAPPEN NEDBANK GROUP THANK YOU al Me ] = | =: — —— —— = Se sah bt ans | at NS lp yy) i iN obs —— hi U—BM MDDS. —S
Slide 63: Nedbank Group in a strong position
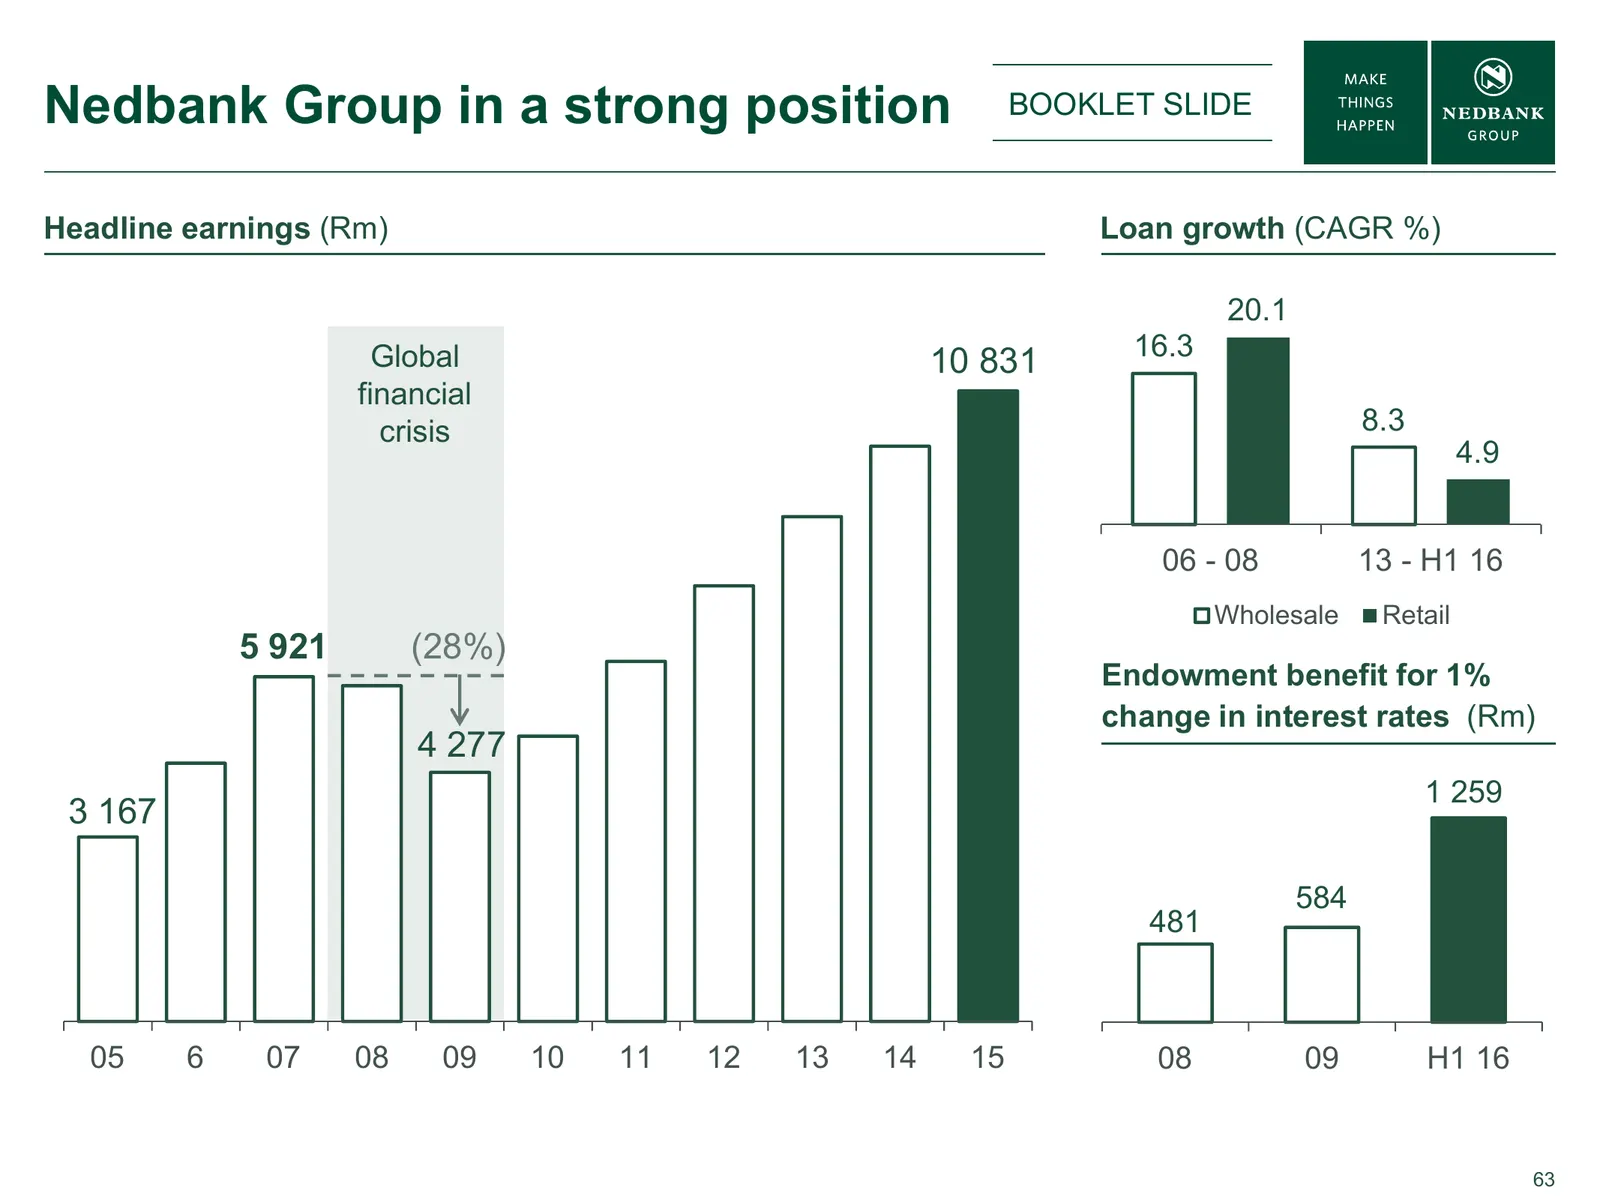
Nedbank Group in a strong position BOOKLET SLIDE Headline earnings (Rm) Loan growth (CAGR %) 20.1 Global 16.3 10 831 financial crisis 8.3 4.9 06 - 08 13 - H1 16 Wholesale Retail 5 921 (28%) Endowment benefit for 1% change in interest rates (Rm) 4 277 1 259 3 167 584 481 05 6 07 08 09 10 11 12 13 14
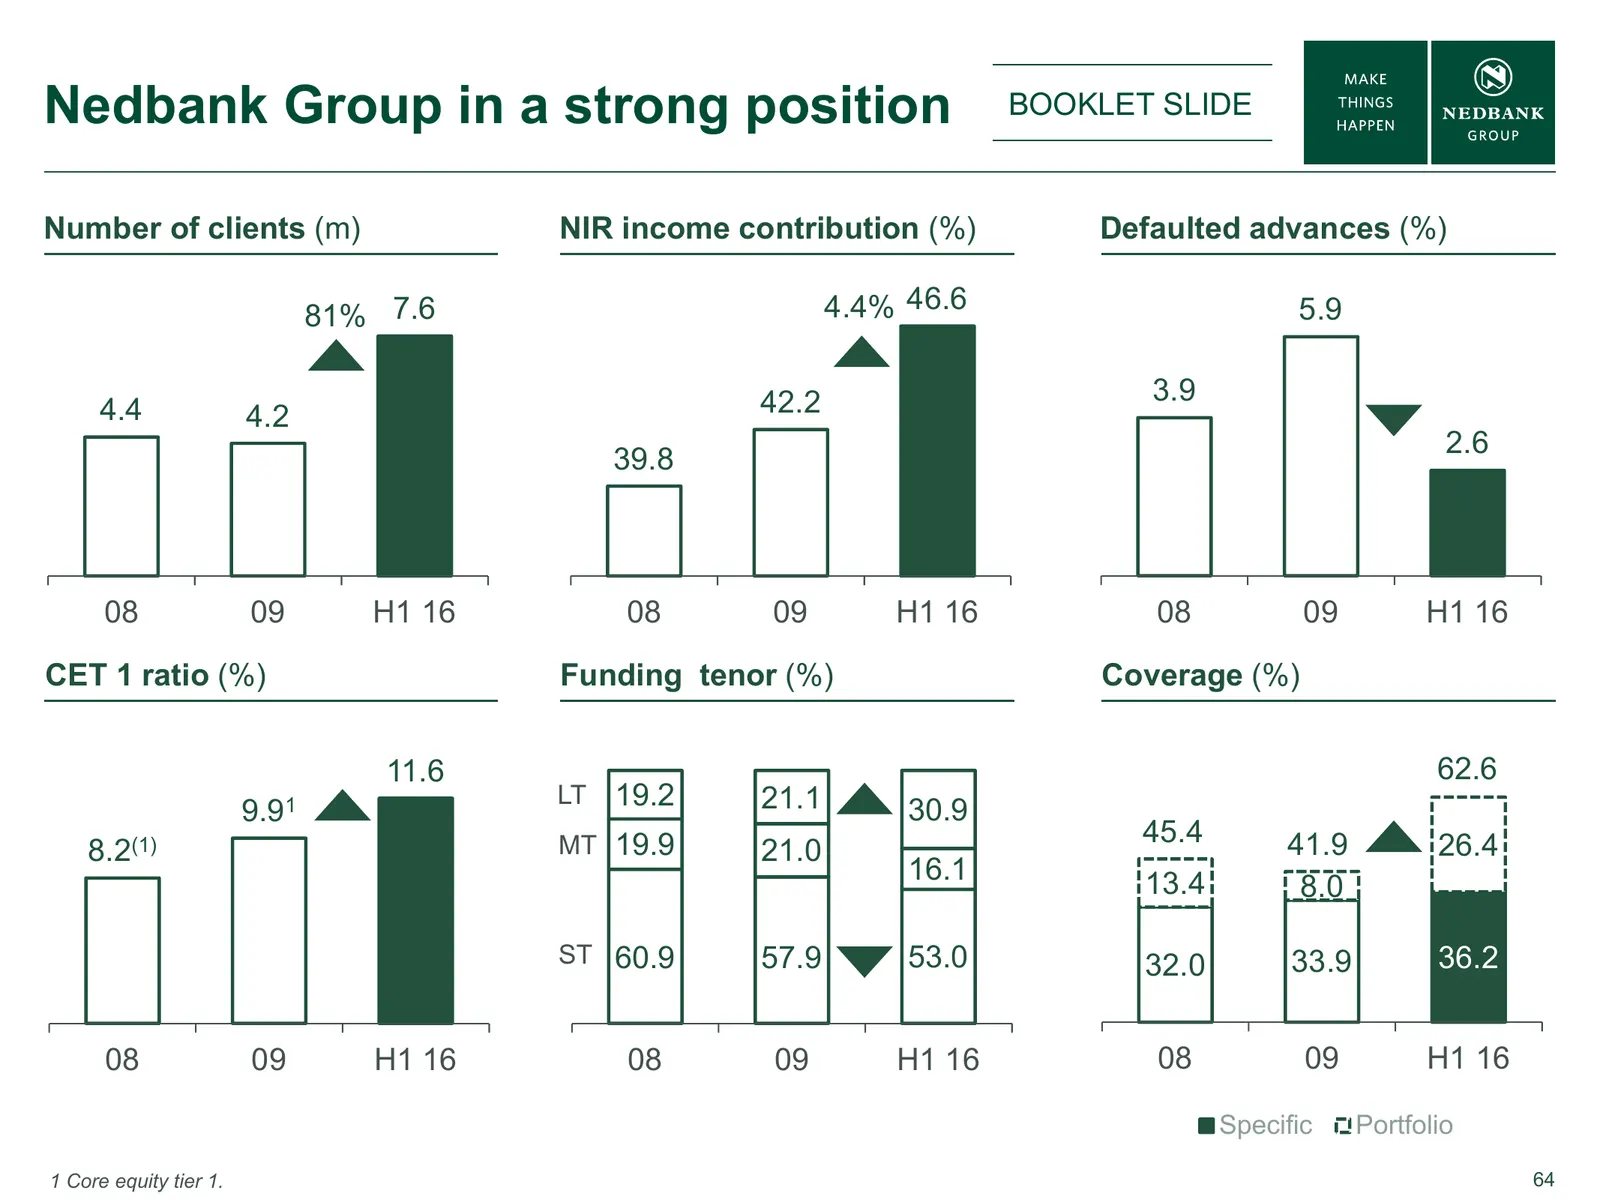
Slide 64: Nedbank Group in a strong position
Nedbank Group in a strong position BOOKLET SLIDE Number of clients (m) NIR income contribution (%) Defaulted advances (%) 81% 7.6 4.4% 46.6 5.9 42.2 3.9 4.4 4.2 2.6 39.8 08 09 H1 16 08 09 H1 16 08 09 H1 16 CET 1 ratio (%) Funding tenor (%) Coverage (%) 11.6 62.6 LT 19.2 21.1 30.9 9.91 MT 19.9 45.4 4
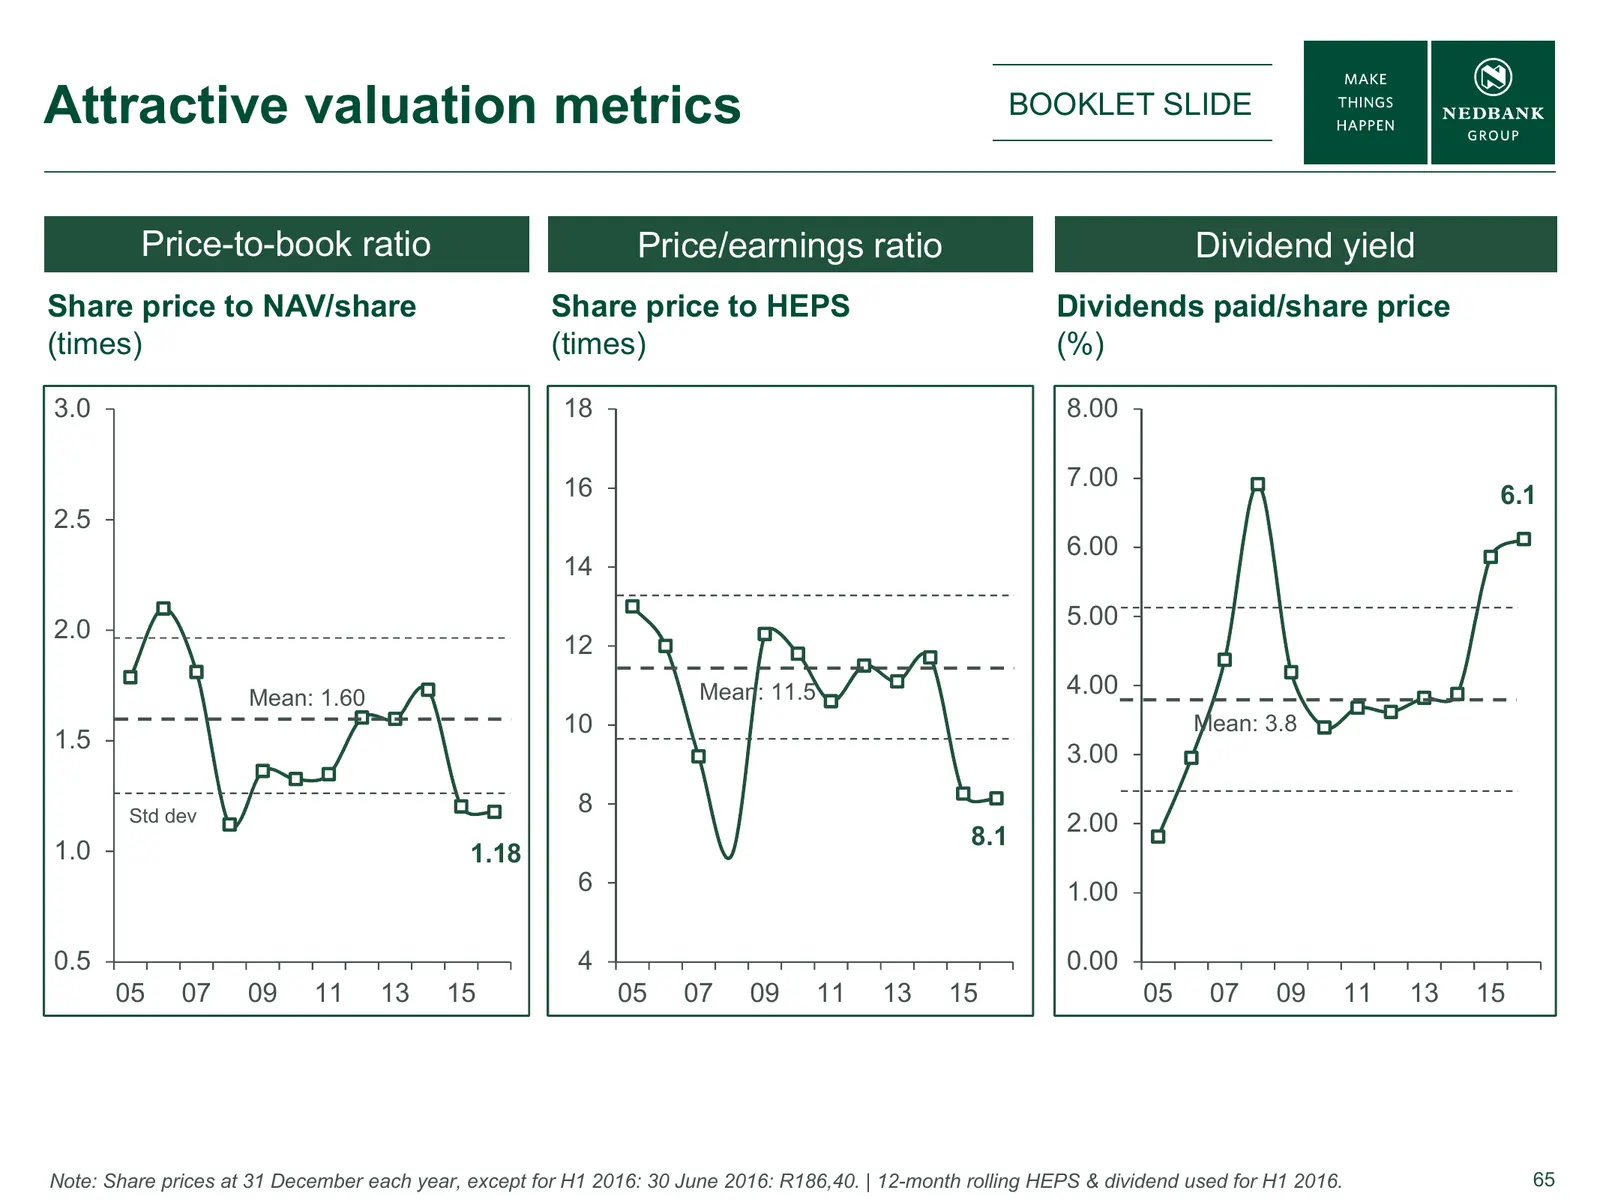
Slide 65: Attractive valuation metrics
Attractive valuation metrics BOOKLET SLIDE Price-to-book ratio Price/earnings ratio Dividend yield Share price to NAV/share Share price to HEPS Dividends paid/share price (times) (times) (%) 3.0 18 8.00 16 7.00 6.1 2.5 6.00 14 5.00 2.0 12 Mean: 1.60 Mean: 11.5 4.00 10 Mean: 3.8 1.5 3.00 Std dev 8 2.
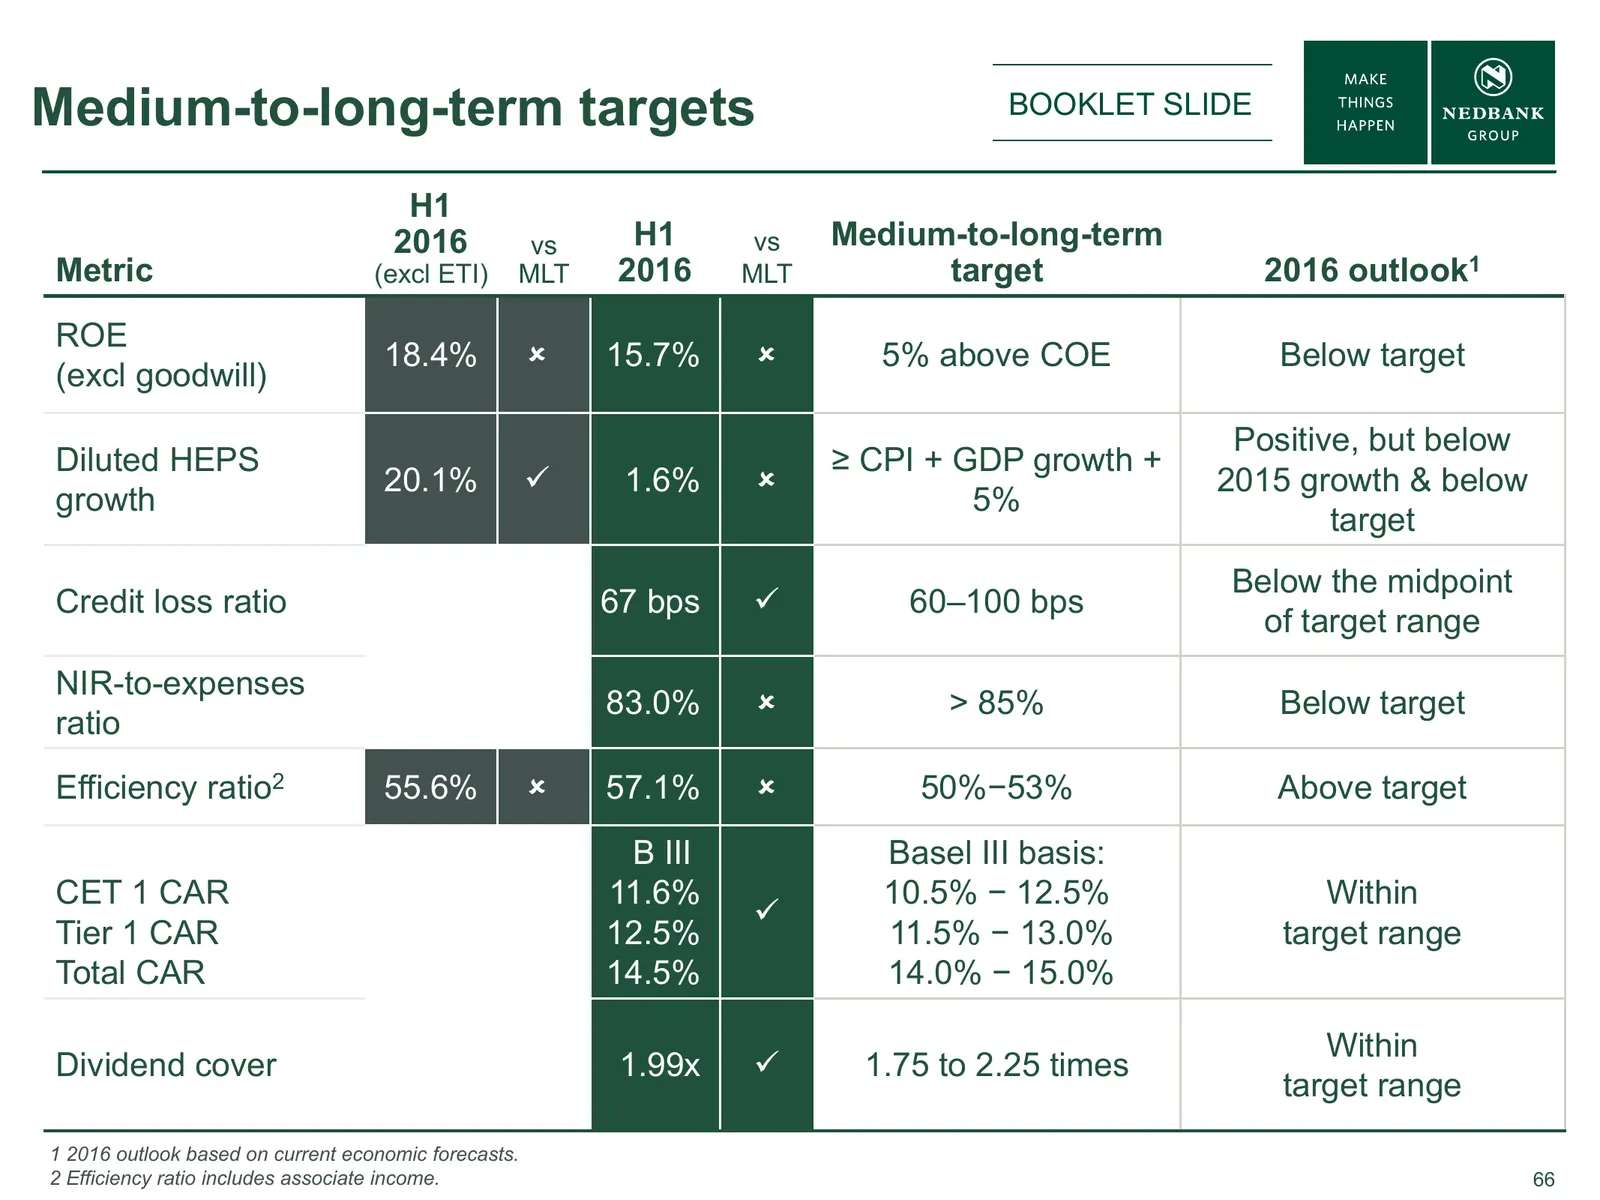
Slide 66: Medium-to-long-term targets
Medium-to-long-term targets BOOKLET SLIDE H1 2016 vs H1 vs Medium-to-long-term Metric (excl ETI) MLT 2016 MLT target 2016 outlook1 ROE 18.4% 15.7% 5% above COE Below target (excl goodwill) Positive, but below Diluted HEPS ≥ CPI + GDP growth + 20.1% 1.6% 2015 growth & below growth 5% target B
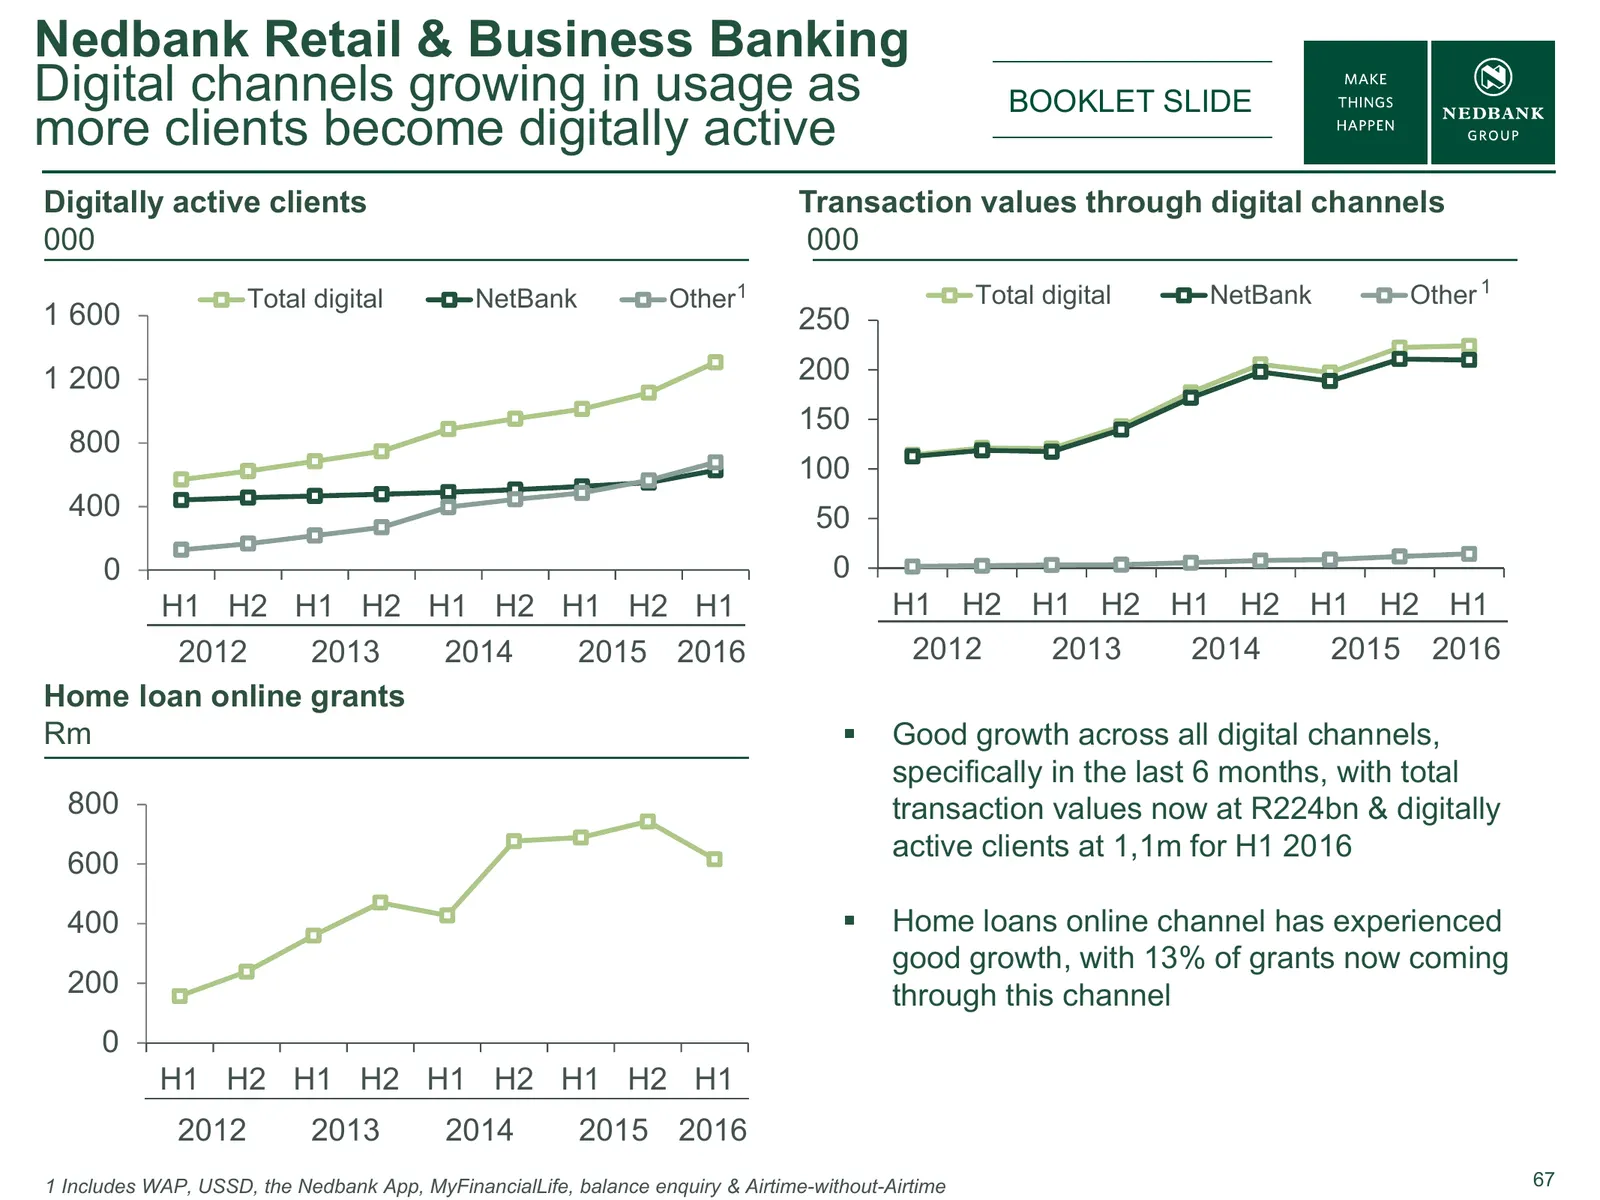
Slide 67: Digital channels growing in usage as more clients become digitally active
Nedbank Retail & Business Banking Digital channels growing in usage as BOOKLET SLIDE more clients become digitally active Digitally active clients Transaction values through digital channels 000 000 Total digital NetBank Other 1 Total digital NetBank Other 1 1 600 250 1 200 200 150 800 100 400 50 0
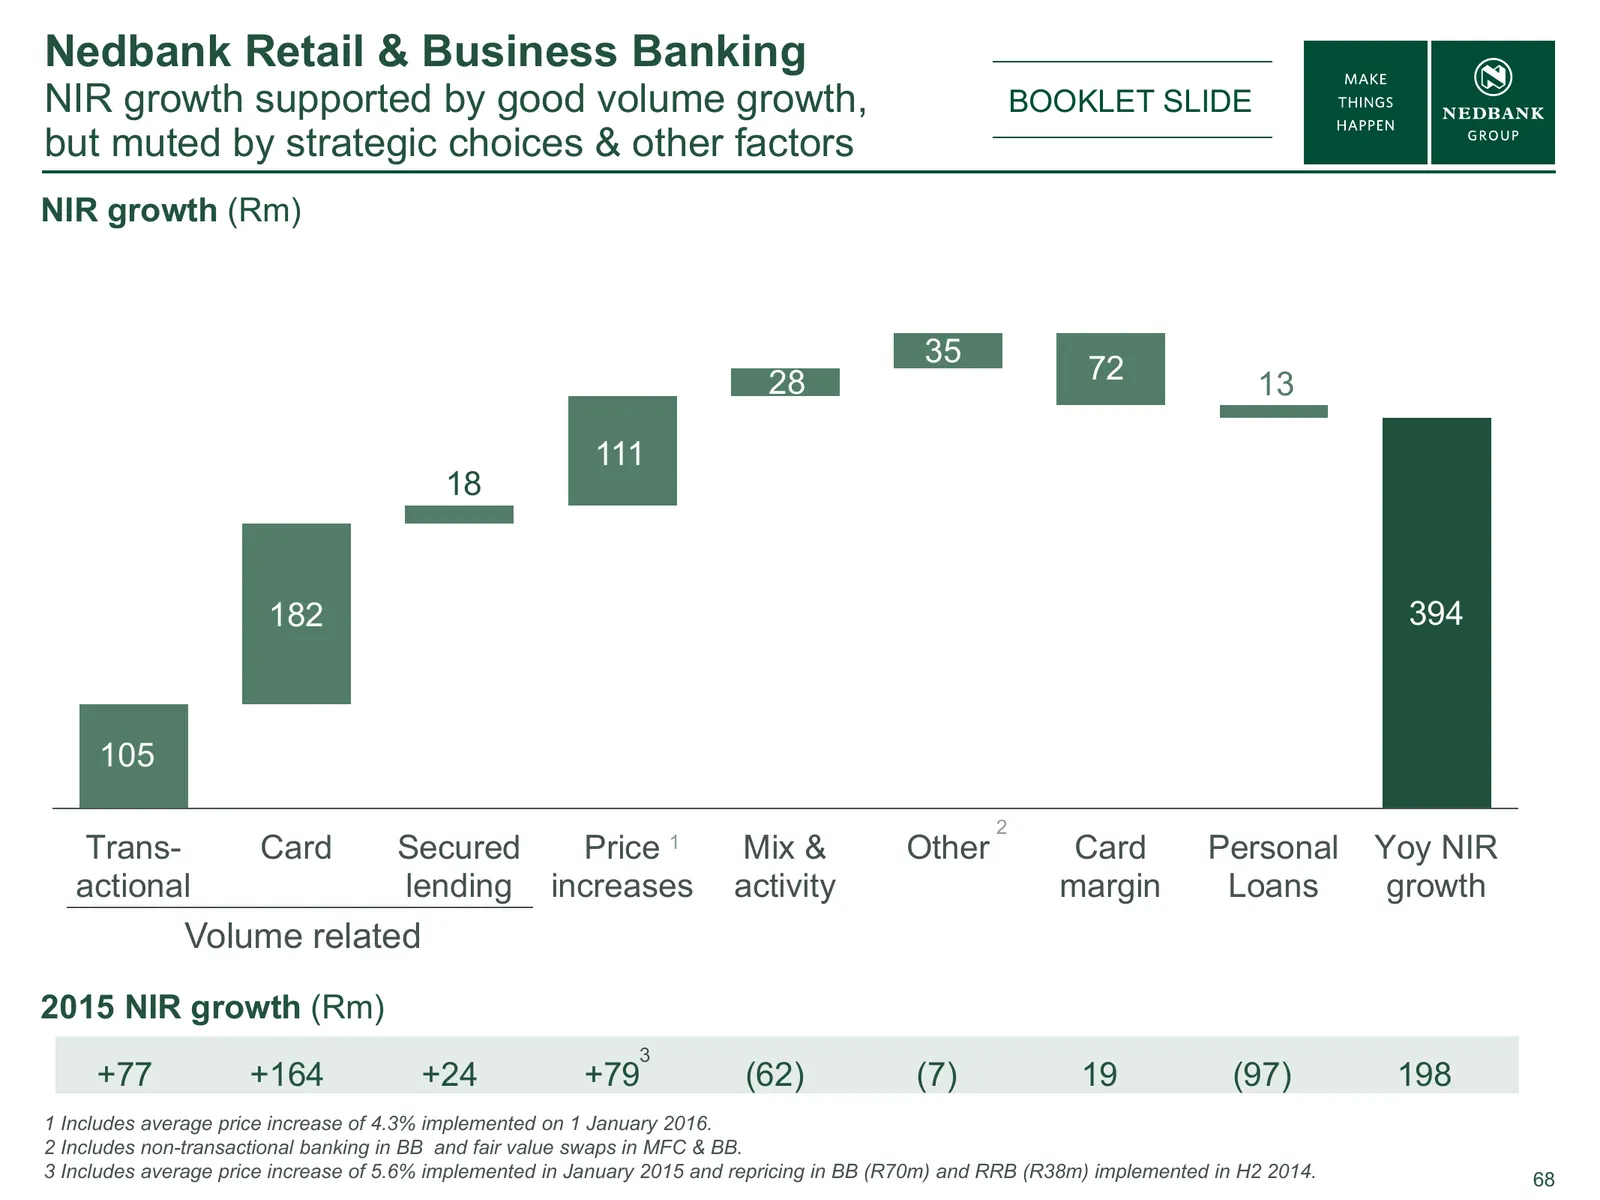
Slide 68: NIR growth supported by good volume growth, but muted by strategic choices
Nedbank Retail & Business Banking NIR growth supported by good volume growth, BOOKLET SLIDE but muted by strategic choices & other factors NIR growth (Rm) 35 28 72 13 111 18 182 394 105 2 Trans- Card Secured Price 1 Mix & Other Card Personal Yoy NIR actional lending increases activity margin Loans g
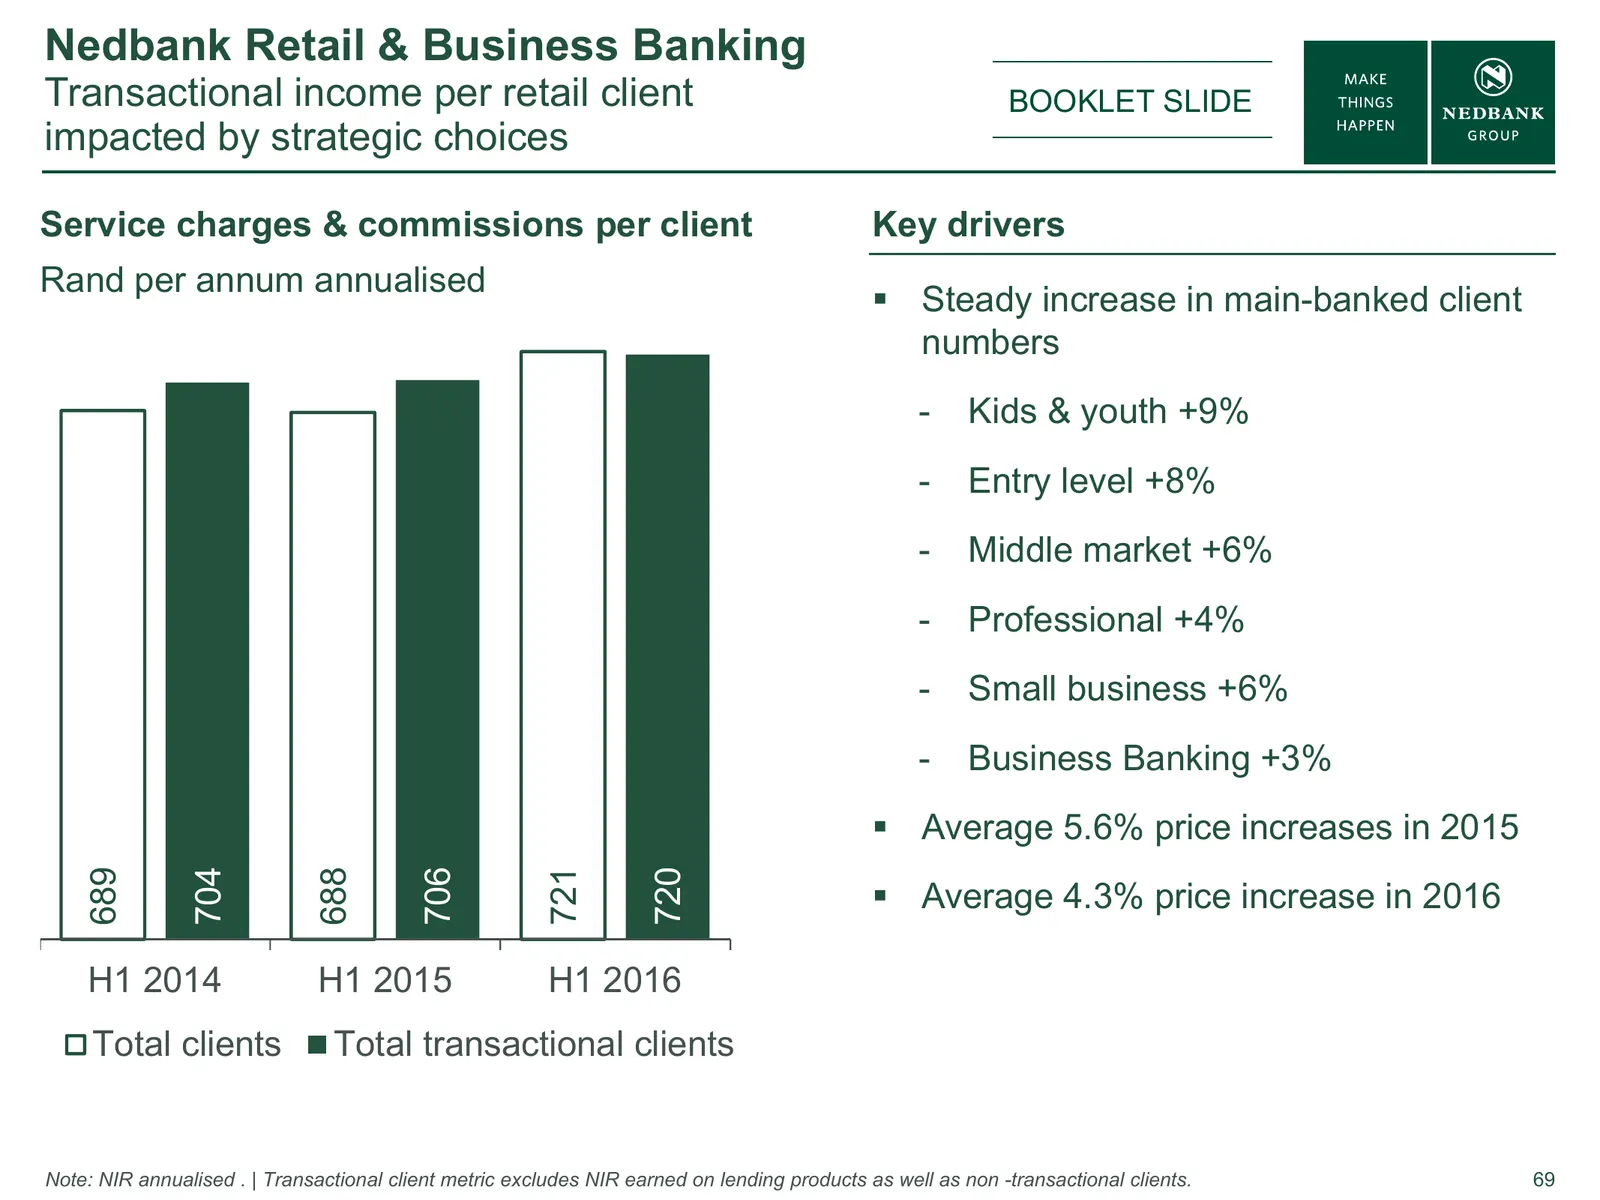
Slide 69: Transactional income per retail client impacted by strategic choices
Nedbank Retail & Business Banking Transactional income per retail client BOOKLET SLIDE impacted by strategic choices Service charges & commissions per client Key drivers Rand per annum annualised Steady increase in main-banked client numbers - Kids & youth +9% - Entry level +8% - Middle market +6%
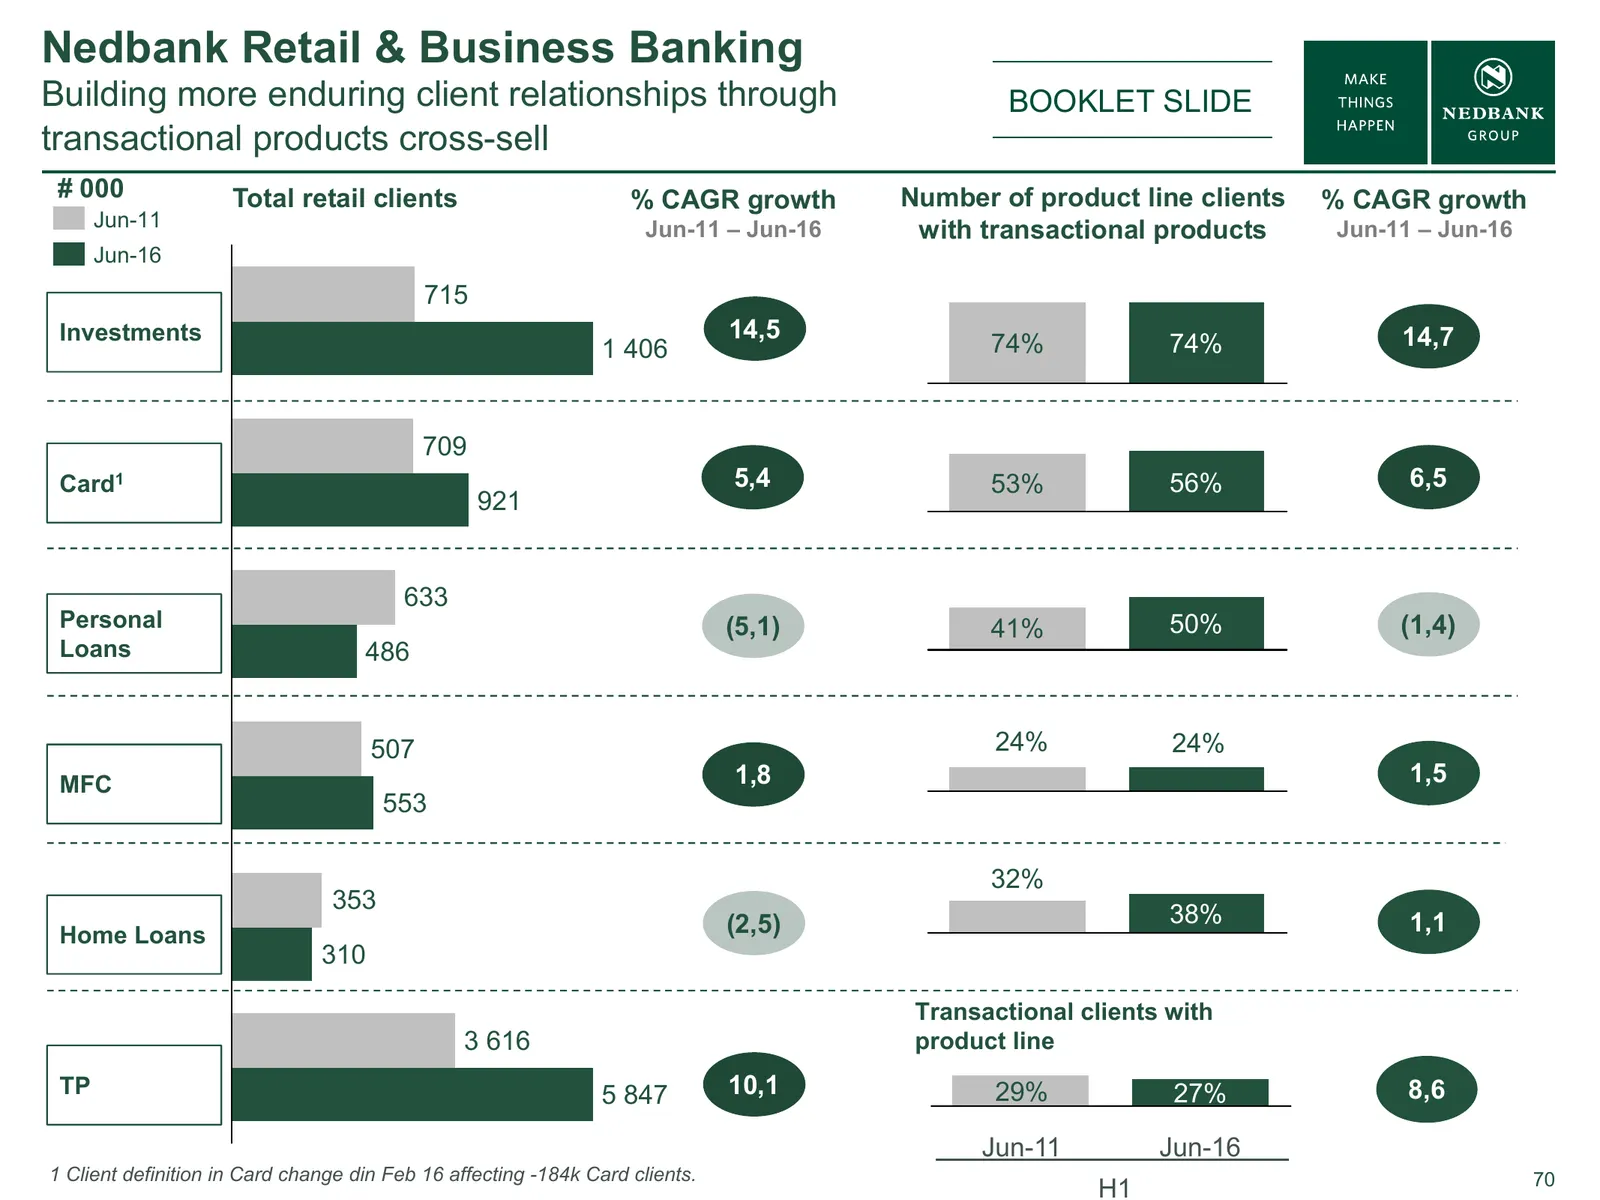
Slide 70: Building more enduring client relationships through transactional products cross-sell
Nedbank Retail & Business Banking Building more enduring client relationships through BOOKLET SLIDE transactional products cross-sell # 000 Total retail clients % CAGR growth Number of product line clients % CAGR growth Jun-11 Jun-11 – Jun-16 with transactional products Jun-11 – Jun-16 Jun-16 715 In
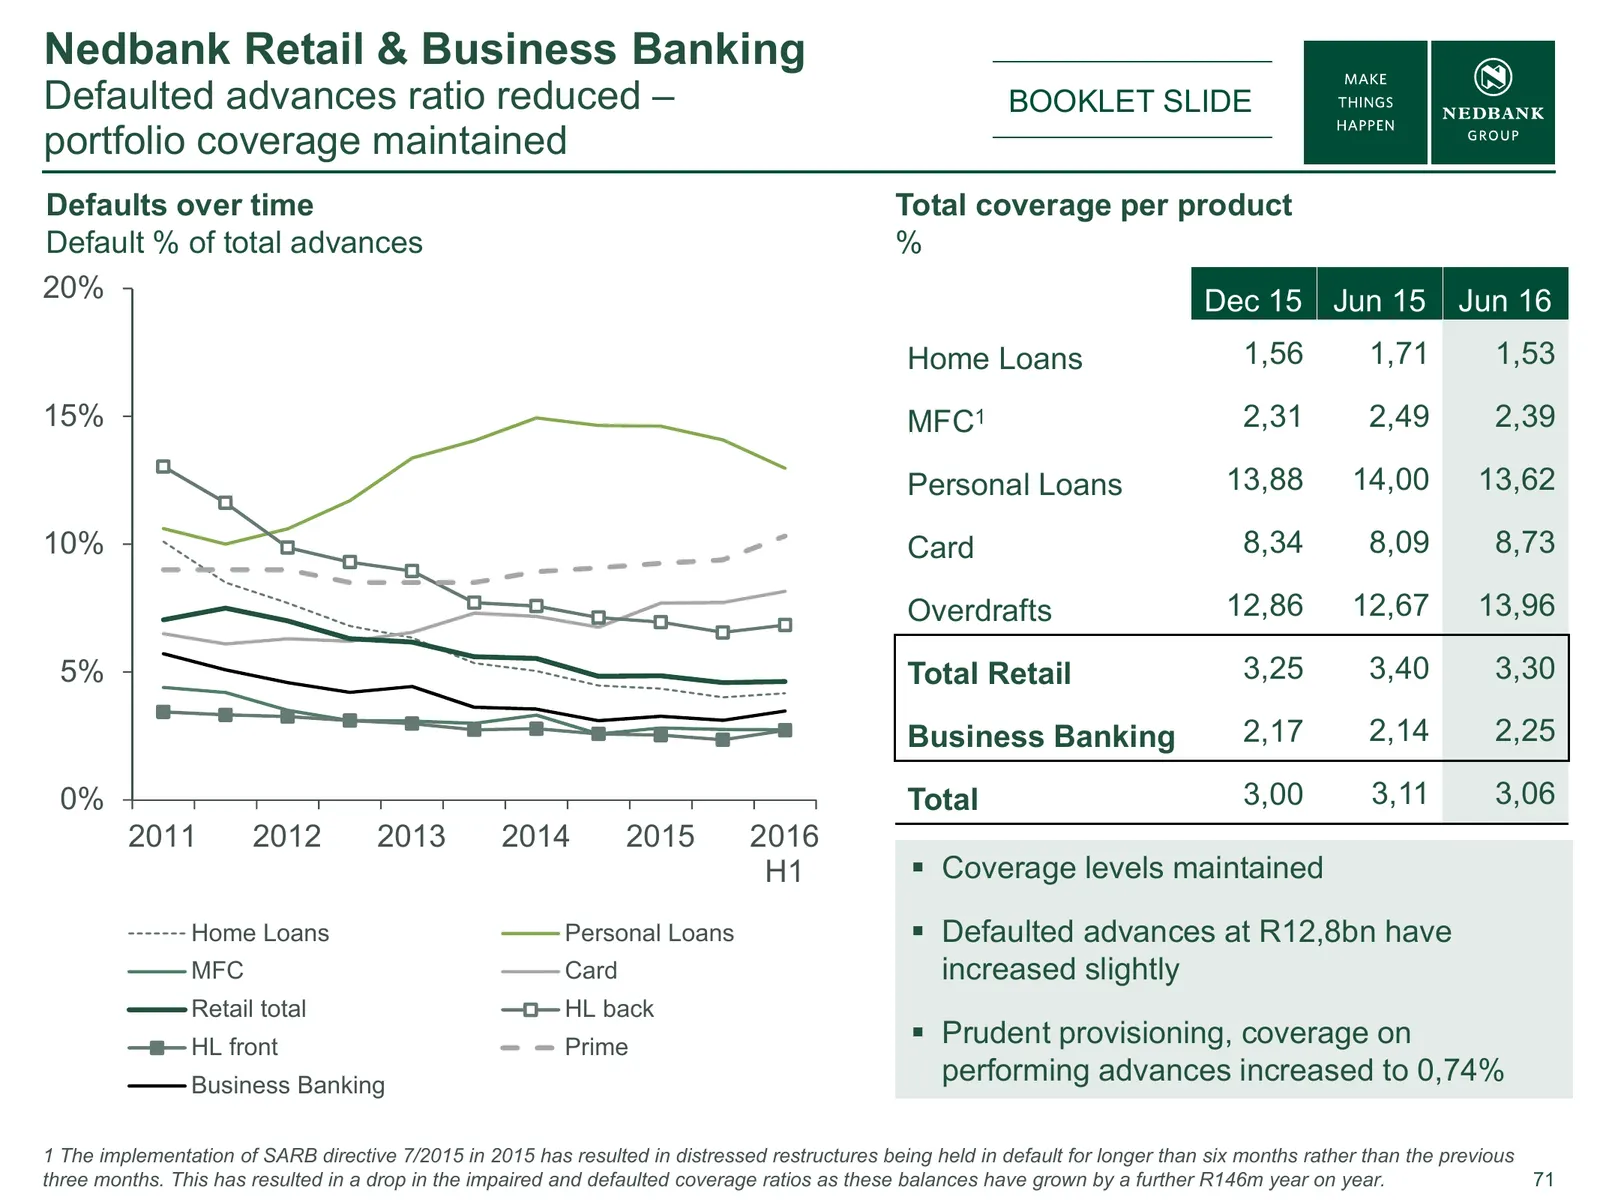
Slide 71: Defaulted advances ratio reduced – portfolio coverage maintained
Nedbank Retail & Business Banking Defaulted advances ratio reduced – BOOKLET SLIDE portfolio coverage maintained Defaults over time Total coverage per product Default % of total advances % 20% Dec 15 Jun 15 Jun 16 Home Loans 1,56 1,71 1,53 15% MFC1 2,31 2,49 2,39 Personal Loans 13,88 14,00 13,62 10%
Slide 72: Nedbank Retail – Home Loans
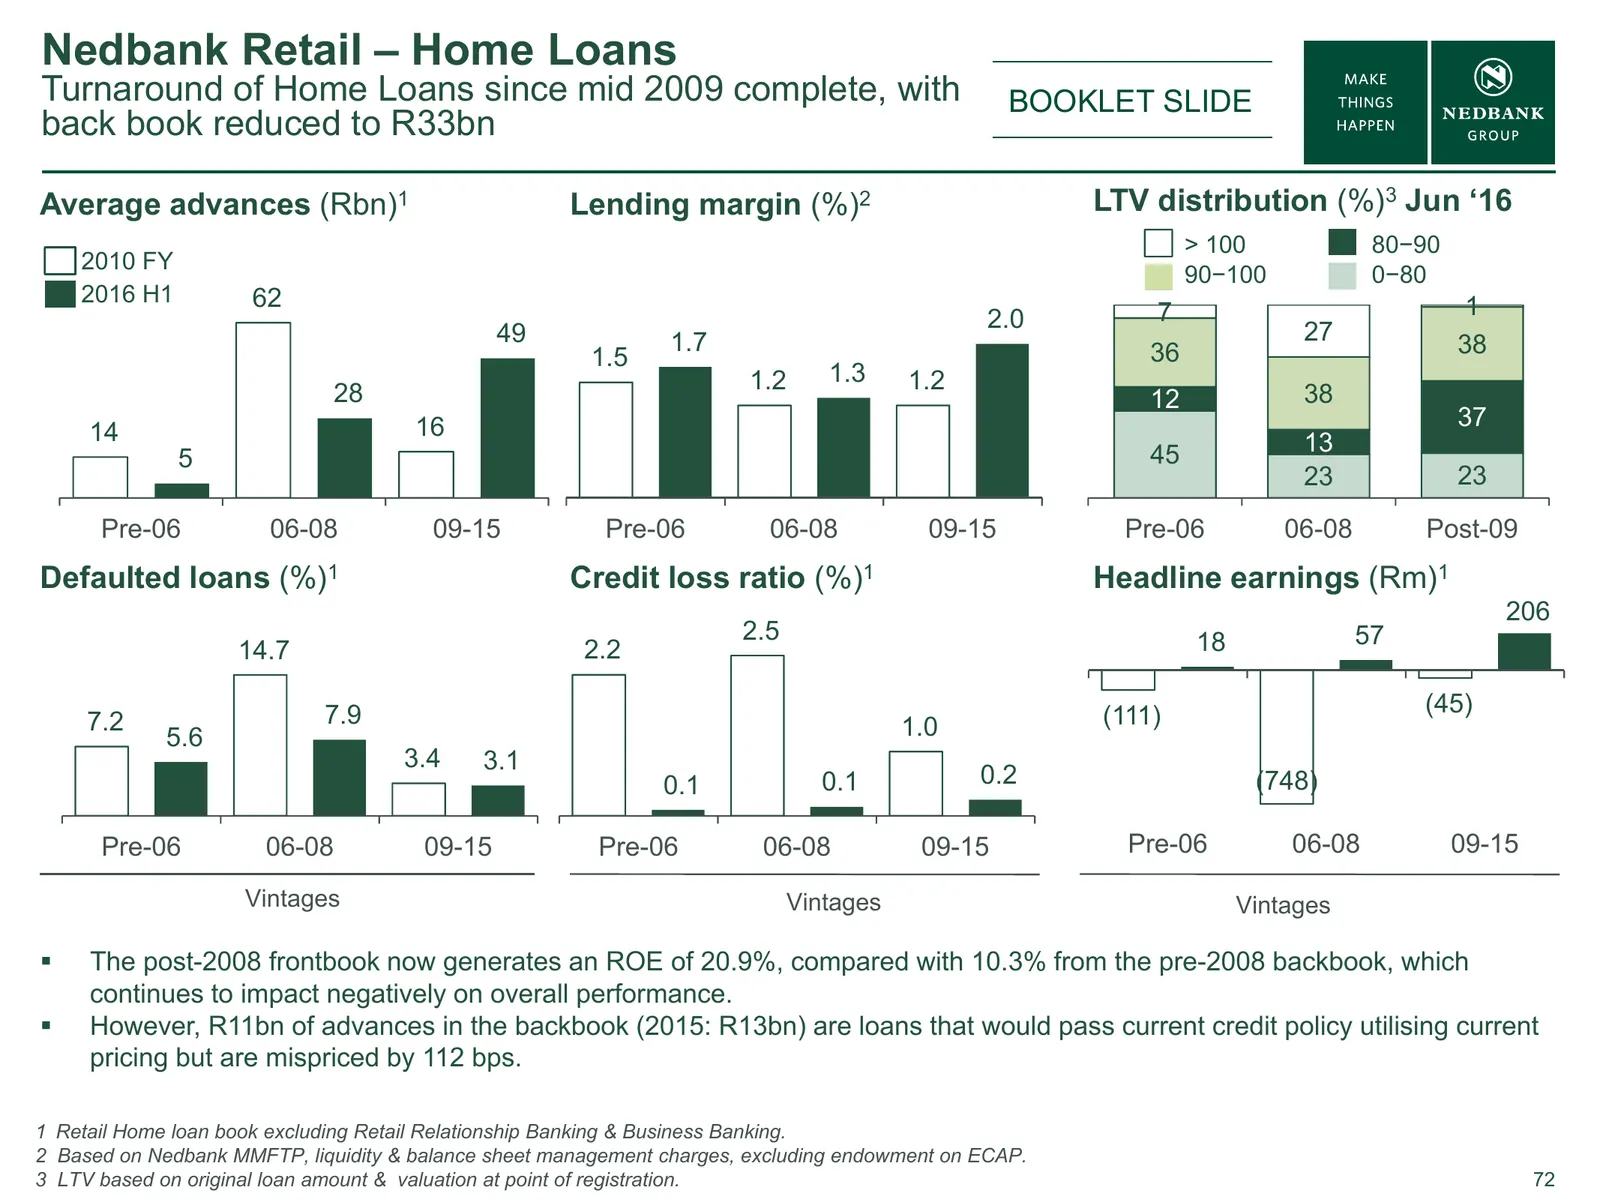
Nedbank Retail – Home Loans Turnaround of Home Loans since mid 2009 complete, with BOOKLET SLIDE back book reduced to R33bn Average advances (Rbn)1 Lending margin (%)2 LTV distribution (%)3 Jun ‘16 > 100 80−90 2010 FY 90−100 0−80 2016 H1 62 2.0 7 1 49 1.7 27 38 1.5 36 1.2 1.3 1.2 28 12 38 16 37 14 1
Slide 73: Disclaimer
Disclaimer Nedbank Group has acted in good faith and has made every reasonable effort to ensure the accuracy and completeness of the information contained in this document, including all information that may be defined as 'forward-looking statements' within the meaning of United States securities le
Source: Internet Archive copy of nedbank.co.za
More decks from Nedbank Group
 FY2025 Earnings Presentation50 slides · February 2026
 FY2024 Earnings Presentation63 slides · March 2025
 27th UBS SA Financial Services Conference 202424 slides · October 2024
 Investor Presentation (October 2024)20 slides · October 2024
 Emerge — Nedbank Investment Conference (2024)22 slides · Sep 10, 2024
 H1 2024 Earnings Presentation85 slides · Aug 6, 2024