C&J Energy Services — Investor Presentation (November 2018)
27 slides from C&J Energy Services's investor presentation, Nov 7, 2018
Slide 1: Management Presentation
Management Presentation NOVEMBER 6, 2018 1
Slide 2: Important Disclaimer
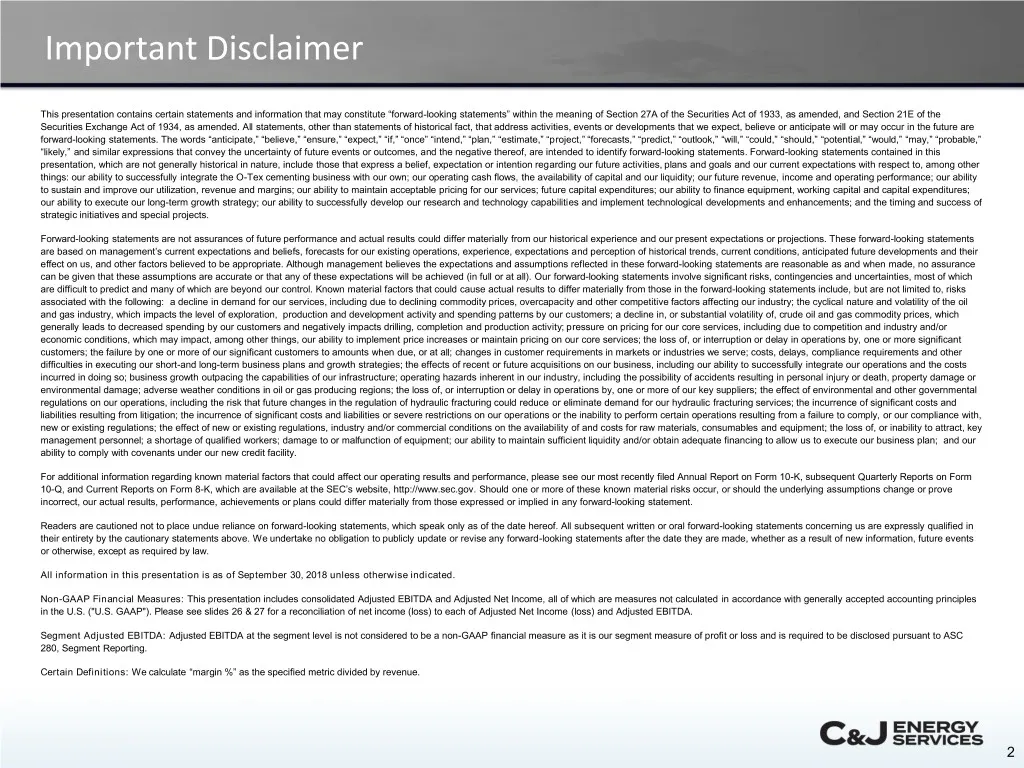
Important Disclaimer This presentation contains certain statements and information that may constitute “forward-looking statements” within the meaning of Section 27A of the Securities Act of 1933, as amended, and Section 21E of the Securities Exchange Act of 1934, as amended. All statements, other t
Slide 3: Why Invest in C&J Energy Services?
Why Invest in C&J Energy Services?
Slide 4: Diversified, New Well Focused Service Provider
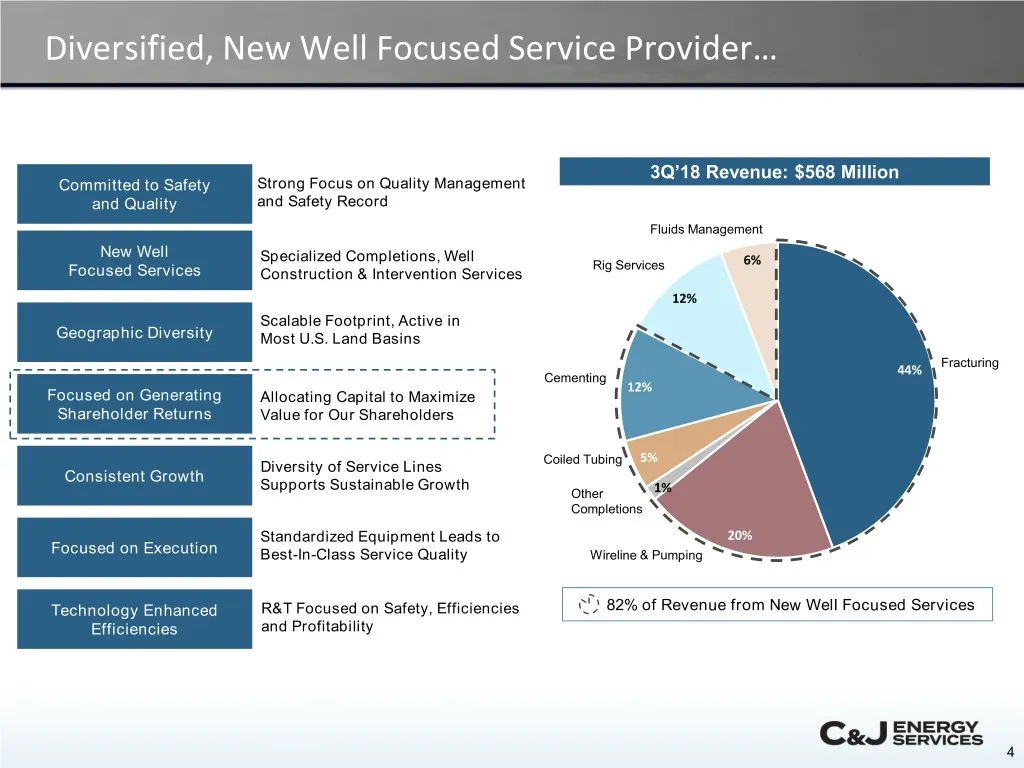
Diversified, New Well Focused Service Provider… 3Q’18 Revenue: $568 Million Committed to Safety Strong Focus on Quality Management and Quality and Safety Record Fluids Management New Well Specialized Completions, Well Rig Services 6% Focused Services Construction & Intervention Services 12% Scalable
Slide 5: Leading Presence in the Most Active U.S. Basins
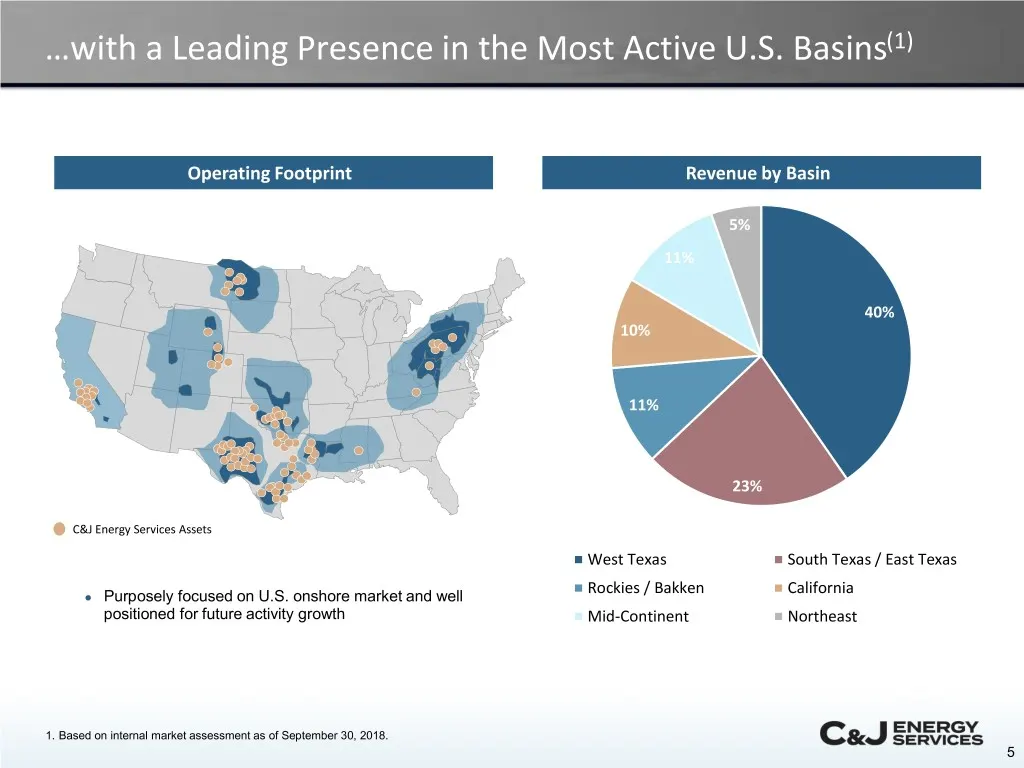
…with a Leading Presence in the Most Active U.S. Basins(1) Operating Footprint Revenue by Basin 5% 11% 40% 10% 11% 23% C&J Energy Services Assets West Texas South Texas / East Texas Rockies / Bakken California ● Purposely focused on U.S. onshore market and well positioned for future activity growth
Slide 6: We Create Value for Our Shareholders
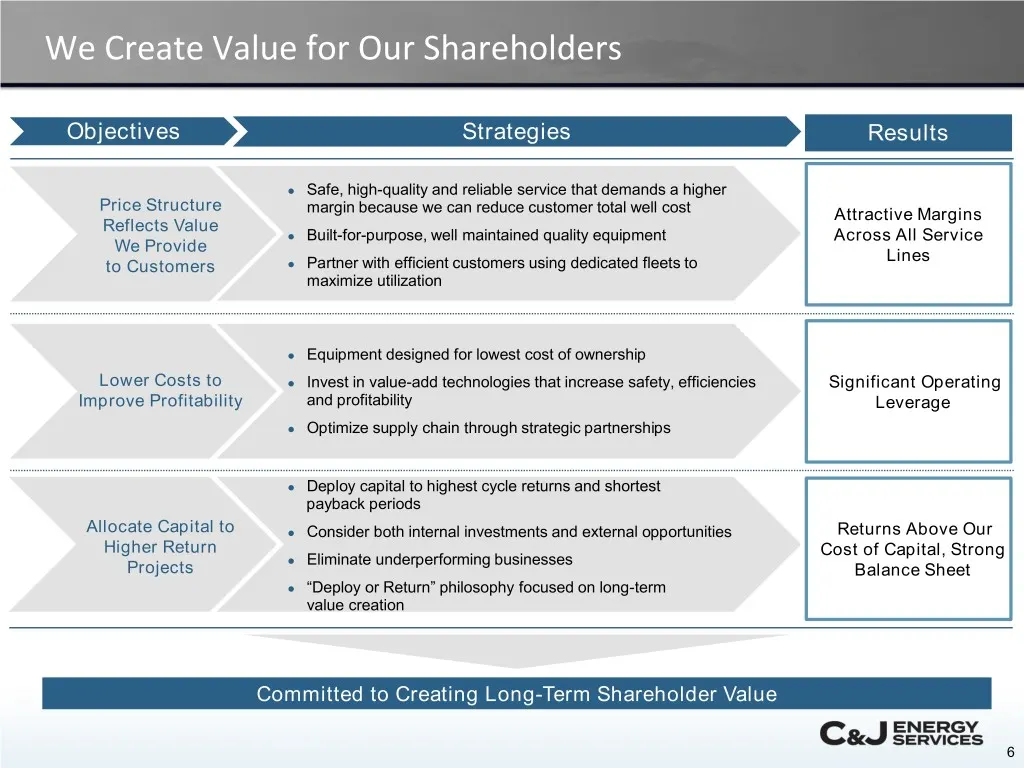
We Create Value for Our Shareholders Objectives Strategies Results ● Safe, high-quality and reliable service that demands a higher Price Structure margin because we can reduce customer total well cost Attractive Margins Reflects Value ● Built-for-purpose, well maintained quality equipment Across All
Slide 7: Disciplined Capital Deployment is Key to Sustainable Returns
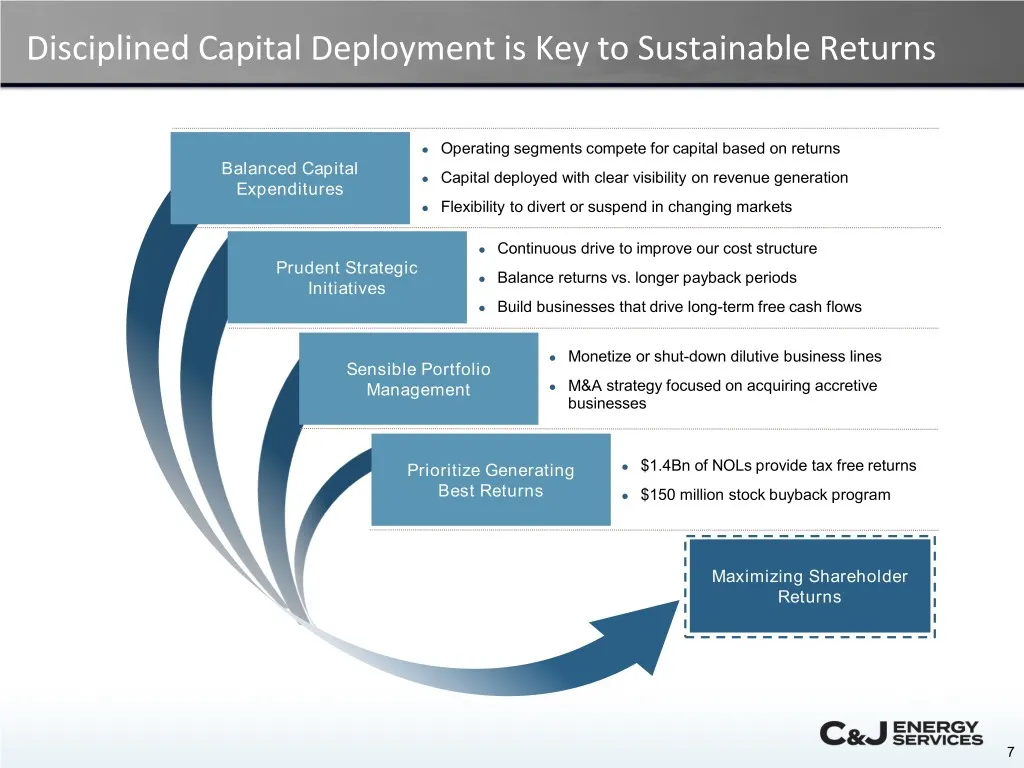
Disciplined Capital Deployment is Key to Sustainable Returns ● Operating segments compete for capital based on returns Balanced Capital ● Capital deployed with clear visibility on revenue generation Expenditures ● Flexibility to divert or suspend in changing markets ● Continuous drive to improve our
Slide 8: Diversified Customer Base
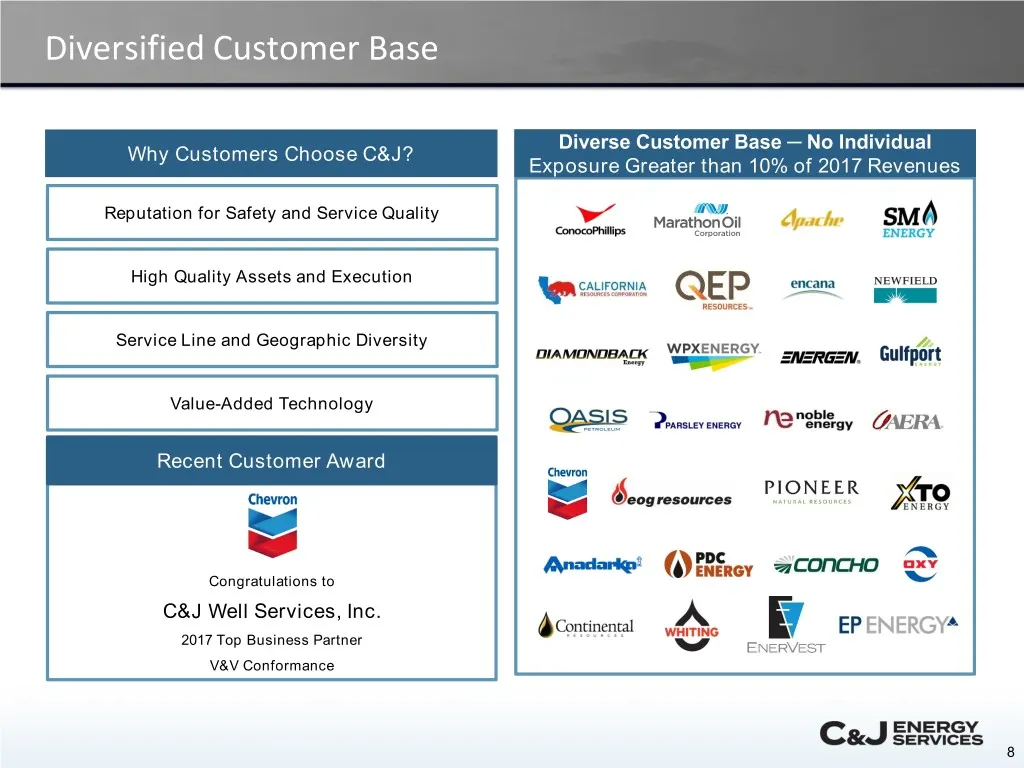
Diversified Customer Base Diverse Customer Base ─ No Individual Why Customers Choose C&J? Exposure Greater than 10% of 2017 Revenues Reputation for Safety and Service Quality High Quality Assets and Execution Service Line and Geographic Diversity Value-Added Technology Logos from next few pages Rece
Slide 9: Our Service Lines
Our Service Lines
Slide 10: 3Q'18 Financial Highlights & Market Conditions
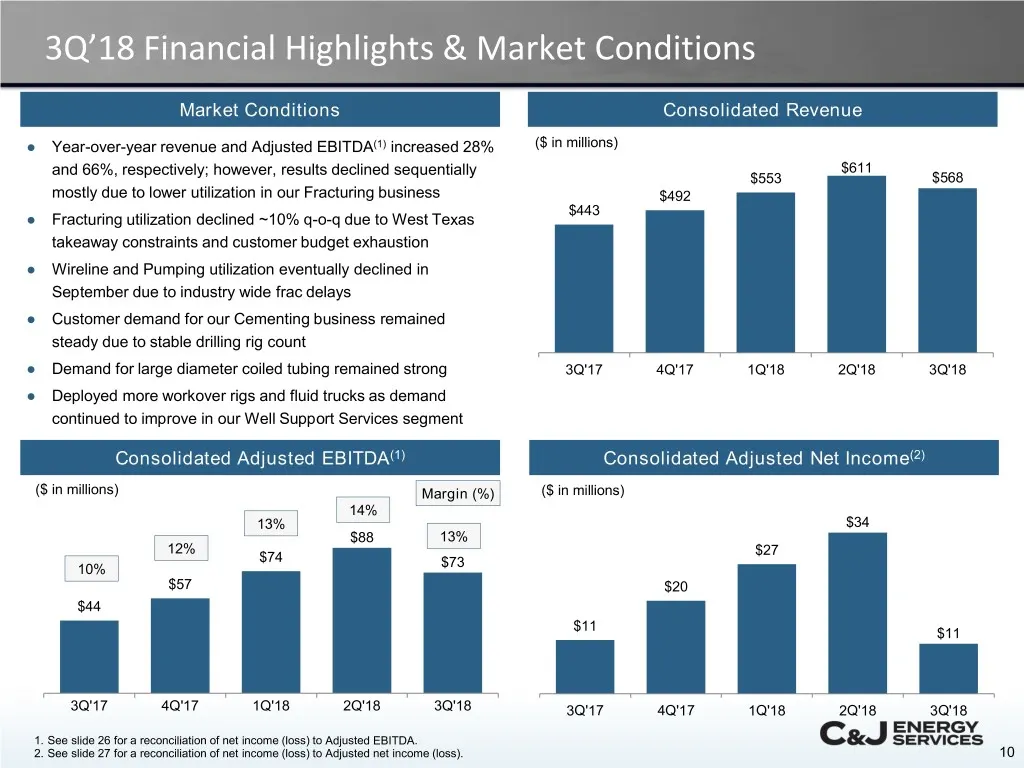
3Q’18 Financial Highlights & Market Conditions Market Conditions Consolidated Revenue ● Year-over-year revenue and Adjusted EBITDA(1) increased 28% ($ in millions) and 66%, respectively; however, results declined sequentially $611 $553 $568 mostly due to lower utilization in our Fracturing business
Slide 11: Completion Services Segment Overview
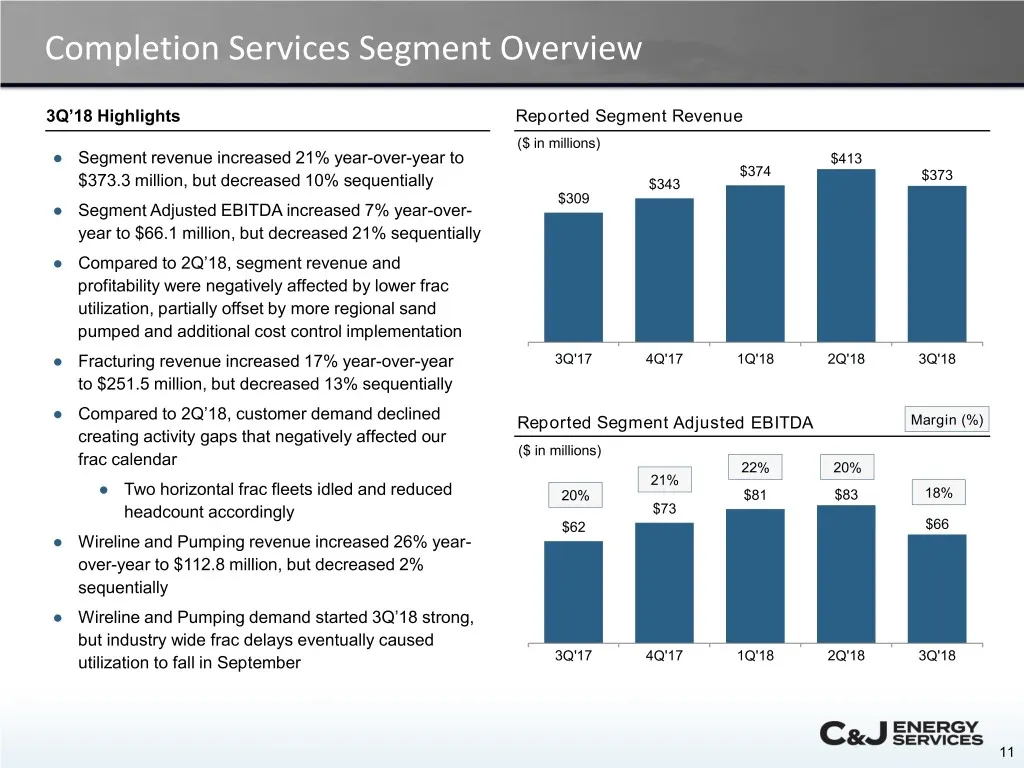
Completion Services Segment Overview 3Q’18 Highlights Reported Segment Revenue ($ in millions) ● Segment revenue increased 21% year-over-year to $413 $374 $373 $373.3 million, but decreased 10% sequentially $343 $309 ● Segment Adjusted EBITDA increased 7% year-over- year to $66.1 million, but decrea
Slide 12: Hydraulic Fracturing Is Our Biggest Business Line
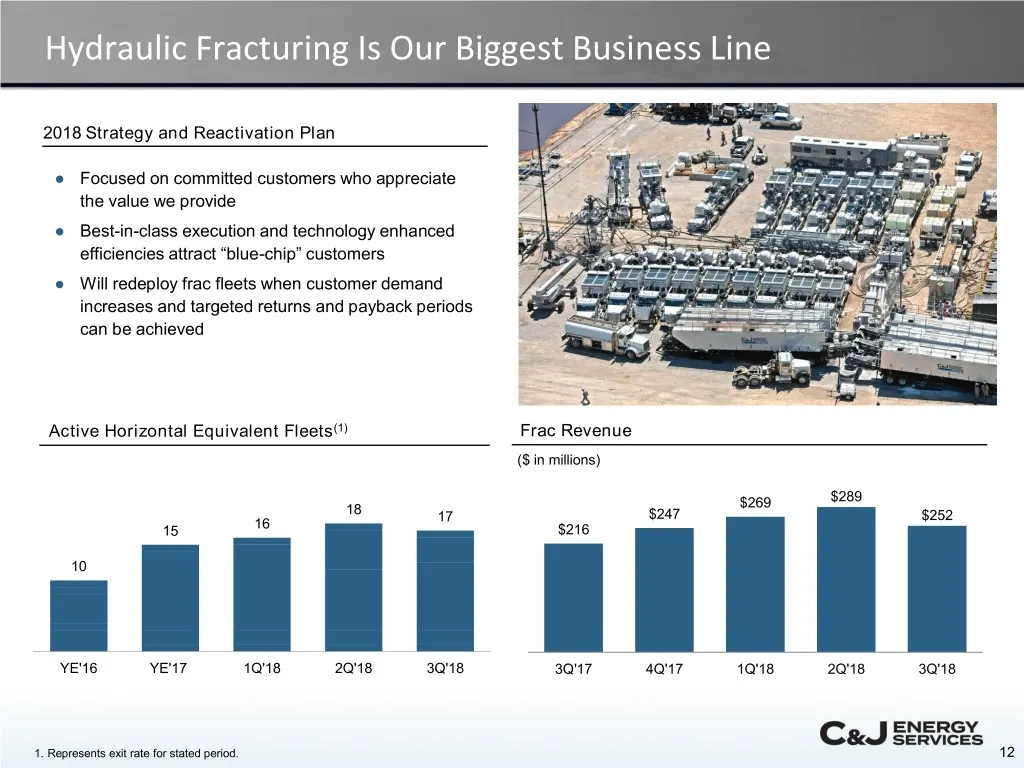
Hydraulic Fracturing Is Our Biggest Business Line 2018 Strategy and Reactivation Plan ● Focused on committed customers who appreciate the value we provide ● Best-in-class execution and technology enhanced efficiencies attract “blue-chip” customers ● Will redeploy frac fleets when customer demand inc
Slide 13: A Proven Market Leader in Wireline & Pumping
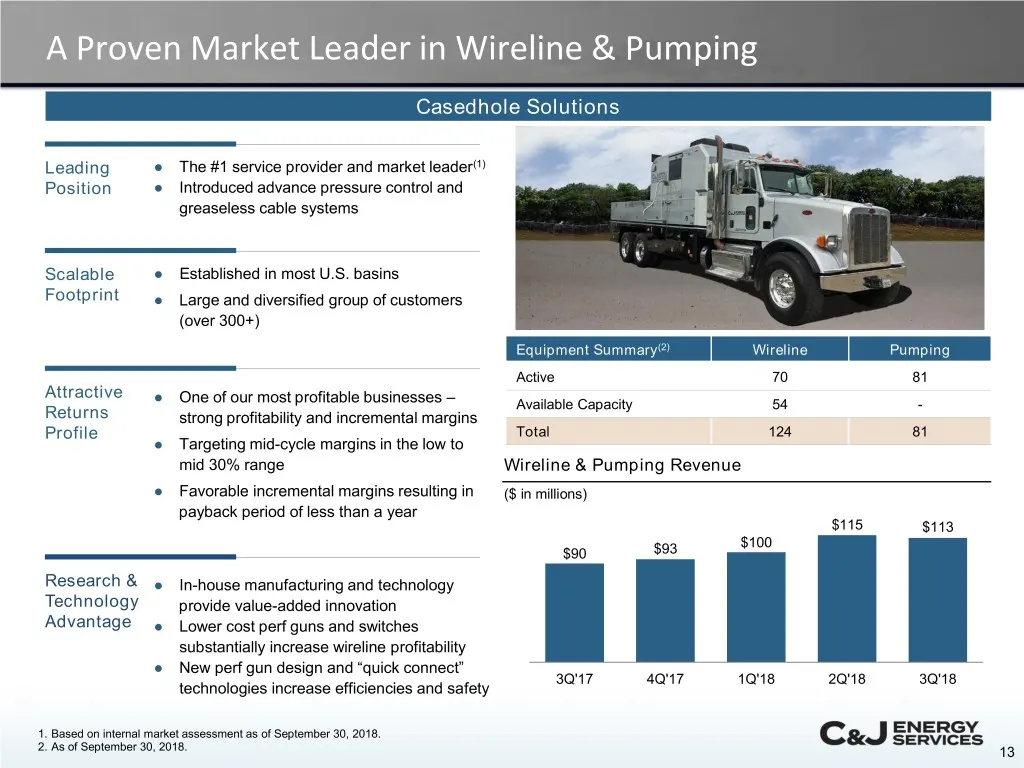
A Proven Market Leader in Wireline & Pumping Casedhole Solutions Leading ● The #1 service provider and market leader(1) Position ● Introduced advance pressure control and greaseless cable systems Scalable ● Established in most U.S. basins Footprint ● Large and diversified group of customers (over 30
Slide 14: Well Construction & Intervention Services Segment Overview
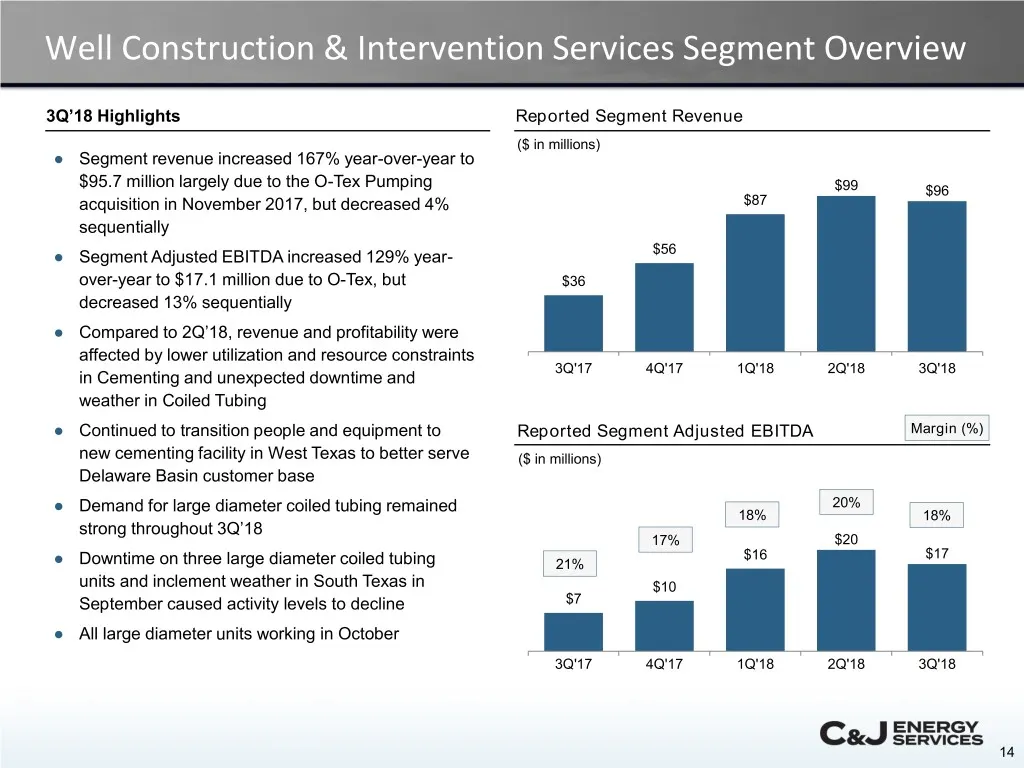
Well Construction & Intervention Services Segment Overview 3Q’18 Highlights Reported Segment Revenue ($ in millions) ● Segment revenue increased 167% year-over-year to $95.7 million largely due to the O-Tex Pumping $99 $96 acquisition in November 2017, but decreased 4% $87 sequentially ● Segment Adj
Slide 15: Expanding Presence in Cementing and Coiled Tubing Market
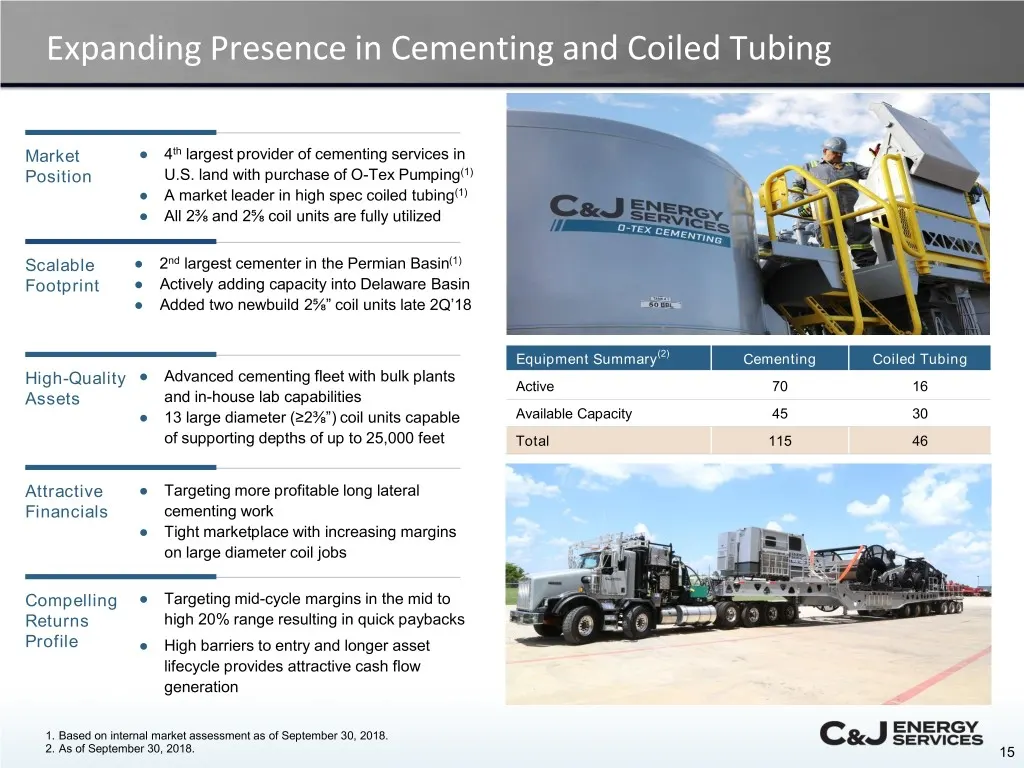
Expanding Presence in Cementing and Coiled Tubing Market ● 4th largest provider of cementing services in Position U.S. land with purchase of O-Tex Pumping(1) ● A market leader in high spec coiled tubing(1) ● All 2⅜ and 2⅝ coil units are fully utilized Scalable ● 2nd largest cementer in the Permian B
Slide 16: Well Support Services Segment Overview
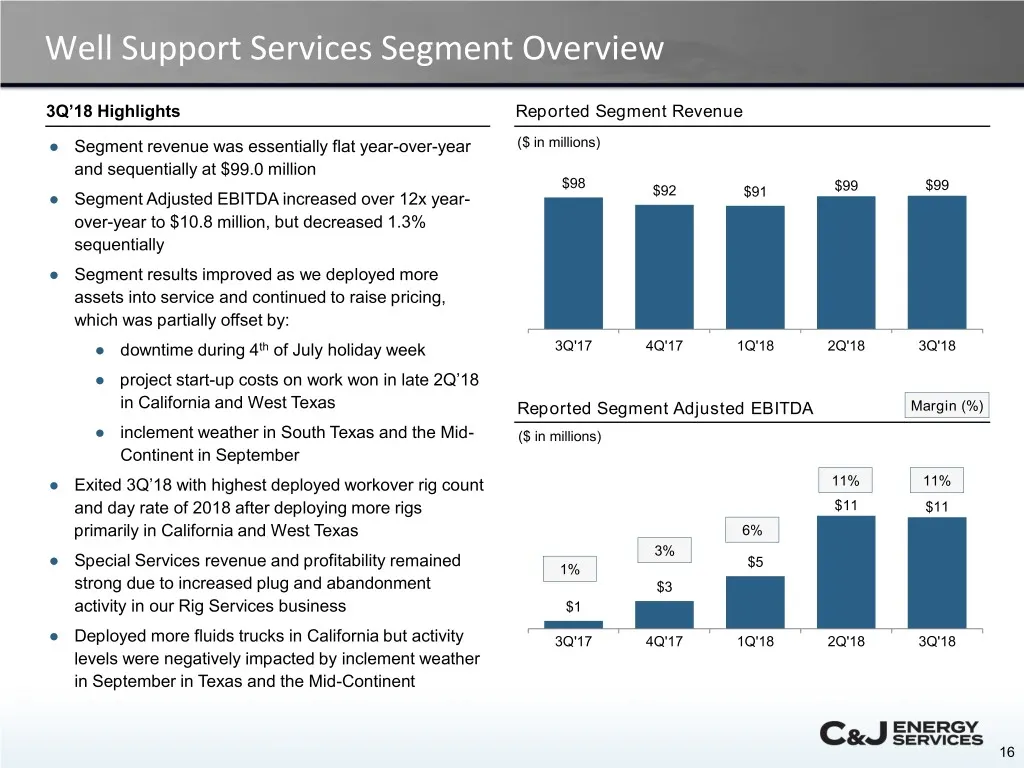
Well Support Services Segment Overview 3Q’18 Highlights Reported Segment Revenue ● Segment revenue was essentially flat year-over-year ($ in millions) and sequentially at $99.0 million $98 $99 $99 ● Segment Adjusted EBITDA increased over 12x year- $92 $91 over-year to $10.8 million, but decreased 1.
Slide 17: Established Provider of Well Support Services
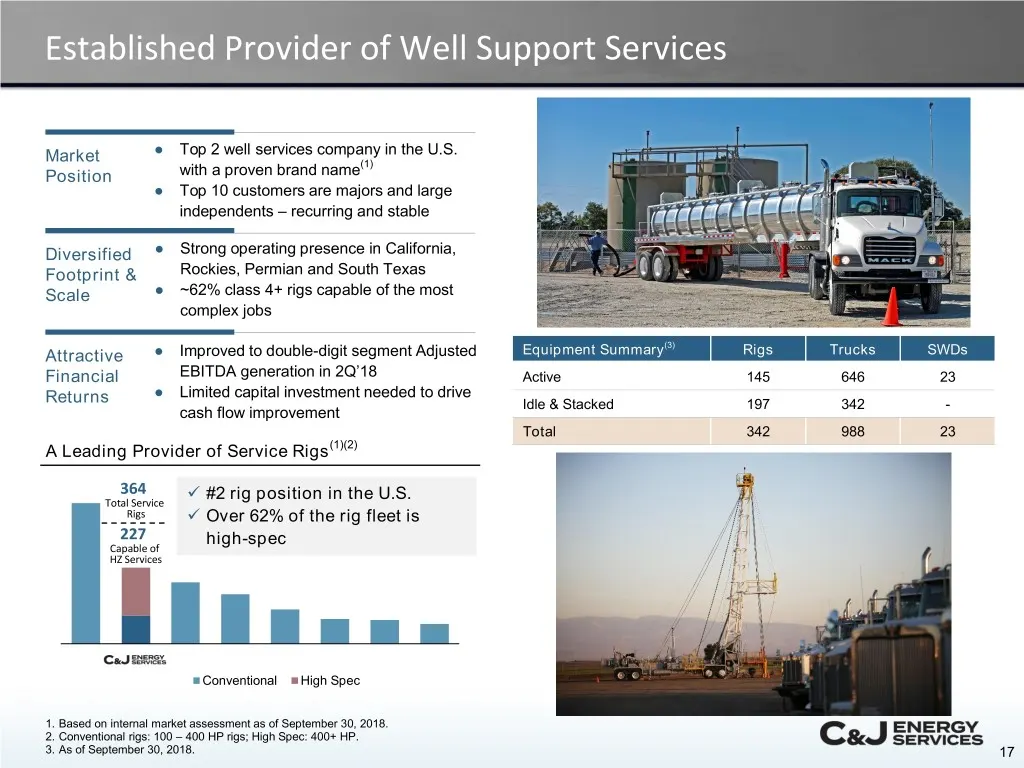
Established Provider of Well Support Services ● Top 2 well services company in the U.S. Market (1) Position with a proven brand name ● Top 10 customers are majors and large independents – recurring and stable Diversified ● Strong operating presence in California, Footprint & Rockies, Permian and Sou
Slide 18: Technology Innovation Drives Higher Margins
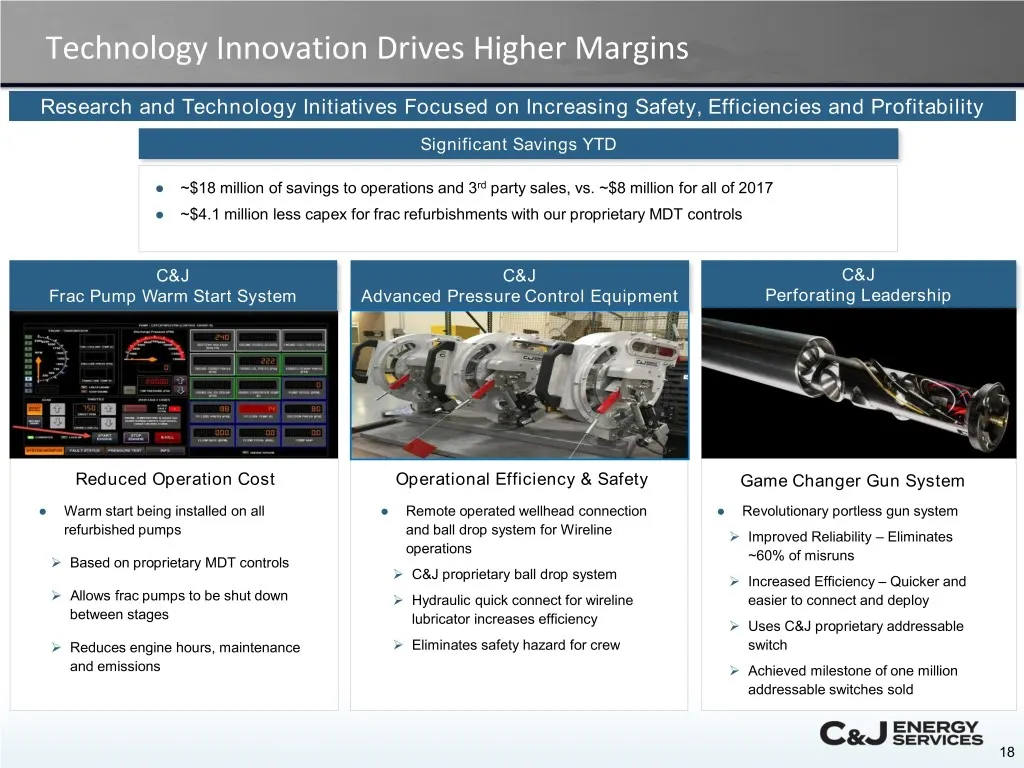
Technology Innovation Drives Higher Margins Research and Technology Initiatives Focused on Increasing Safety, Efficiencies and Profitability Significant Savings YTD ● ~$18 million of savings to operations and 3rd party sales, vs. ~$8 million for all of 2017 ● ~$4.1 million less capex for frac refurb
Slide 19: Continued Focus on Rightsizing Cost Structure
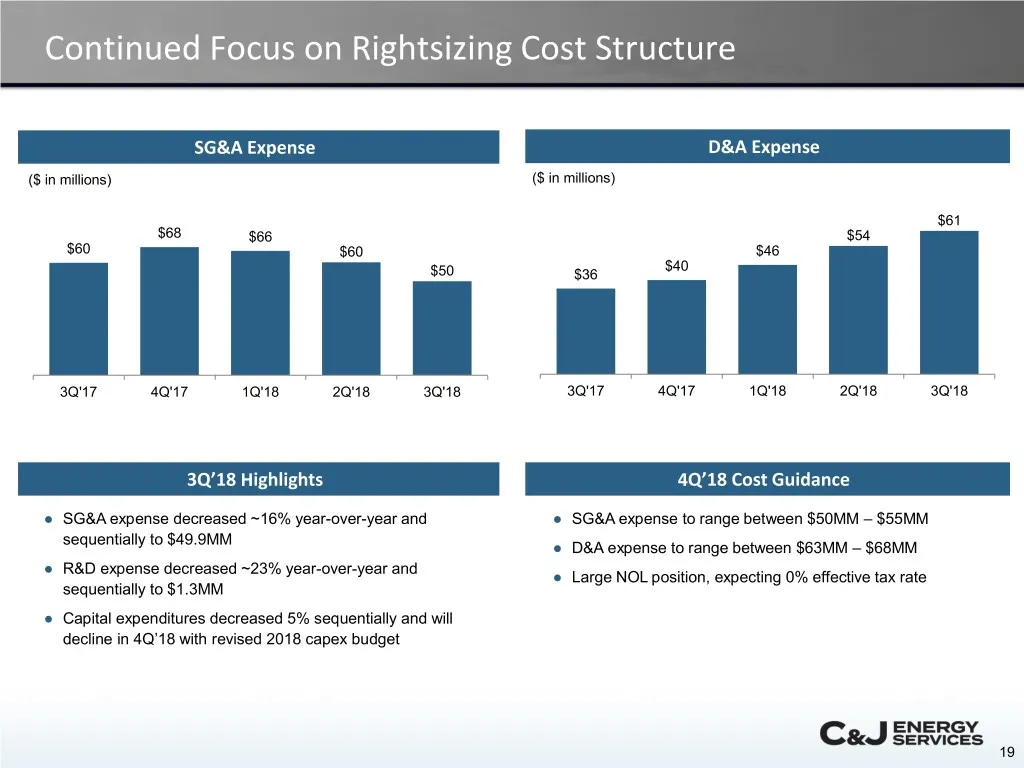
Continued Focus on Rightsizing Cost Structure SG&A Expense D&A Expense ($ in millions) ($ in millions) $61 $68 $66 $54 $60 $60 $46 $40 $50 $36 3Q'17 4Q'17 1Q'18 2Q'18 3Q'18 3Q'17 4Q'17 1Q'18 2Q'18 3Q'18 3Q’18 Highlights 4Q’18 Cost Guidance ● SG&A expense decreased ~16% year-over-year and ● SG&A expe
Slide 20: Strong Capital Structure and Reasonable Growth Plan
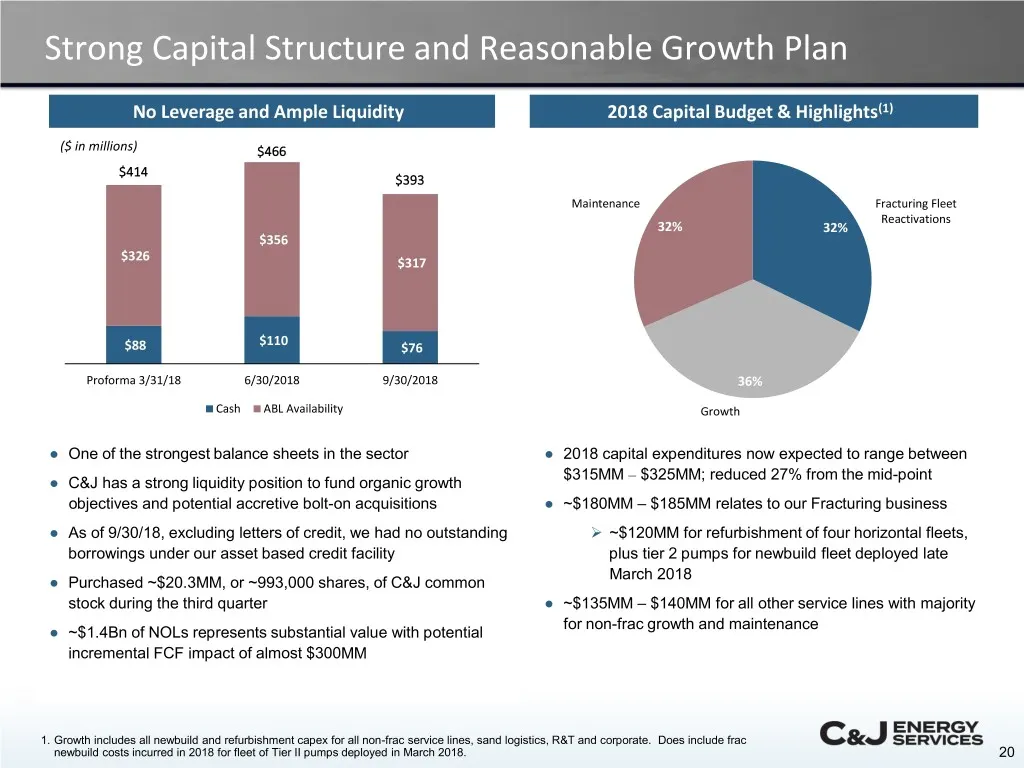
Strong Capital Structure and Reasonable Growth Plan No Leverage and Ample Liquidity 2018 Capital Budget & Highlights(1) ($ in millions) $466 $414 $393 Maintenance Fracturing Fleet Reactivations 32% 32% $356 $326 $317 $110 $88 $76 Proforma 3/31/18 6/30/2018 9/30/2018 36% Cash ABL Availability Growth
Slide 21: C&J Tenants: The Differentiated U.S. Oilfield Services Company
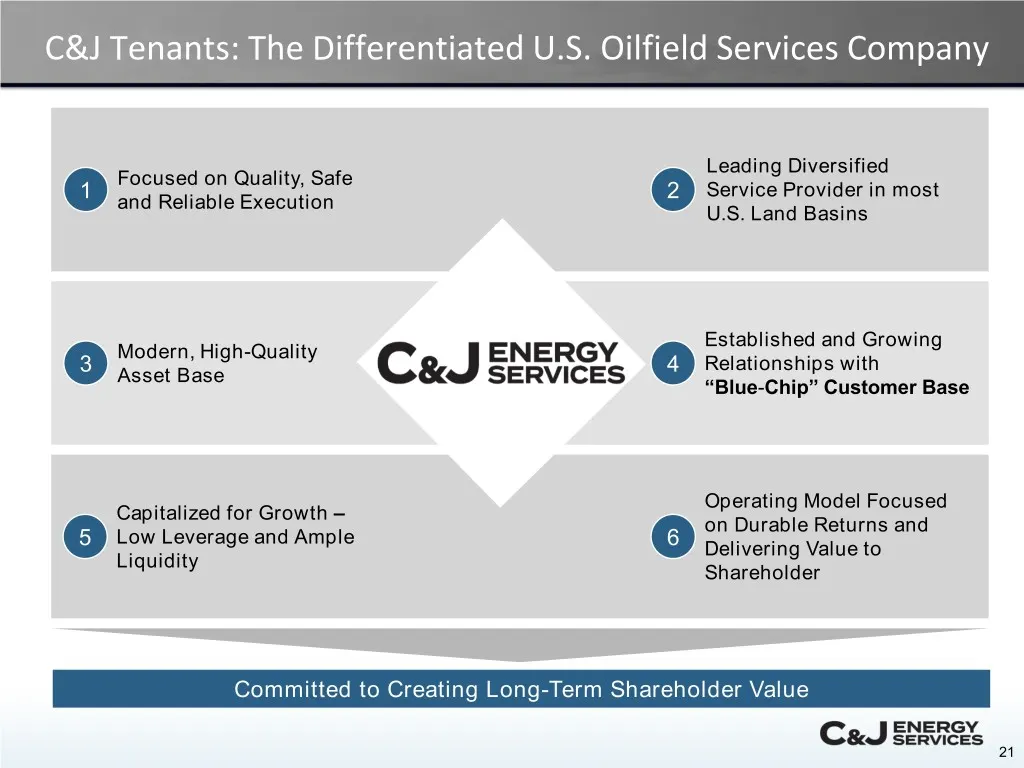
C&J Tenants: The Differentiated U.S. Oilfield Services Company Leading Diversified Focused on Quality, Safe 1 2 Service Provider in most and Reliable Execution U.S. Land Basins Established and Growing Modern, High-Quality Relationships with 3 Asset Base 4 “Blue-Chip” Customer Base Operating Model Fo
Slide 22: Appendix: Additional Information & Non-GAAP Reconciliation
APPENDIX: Additional Information & Non-GAAP Reconciliation
Slide 23: Thoughts on the Forward Outlook
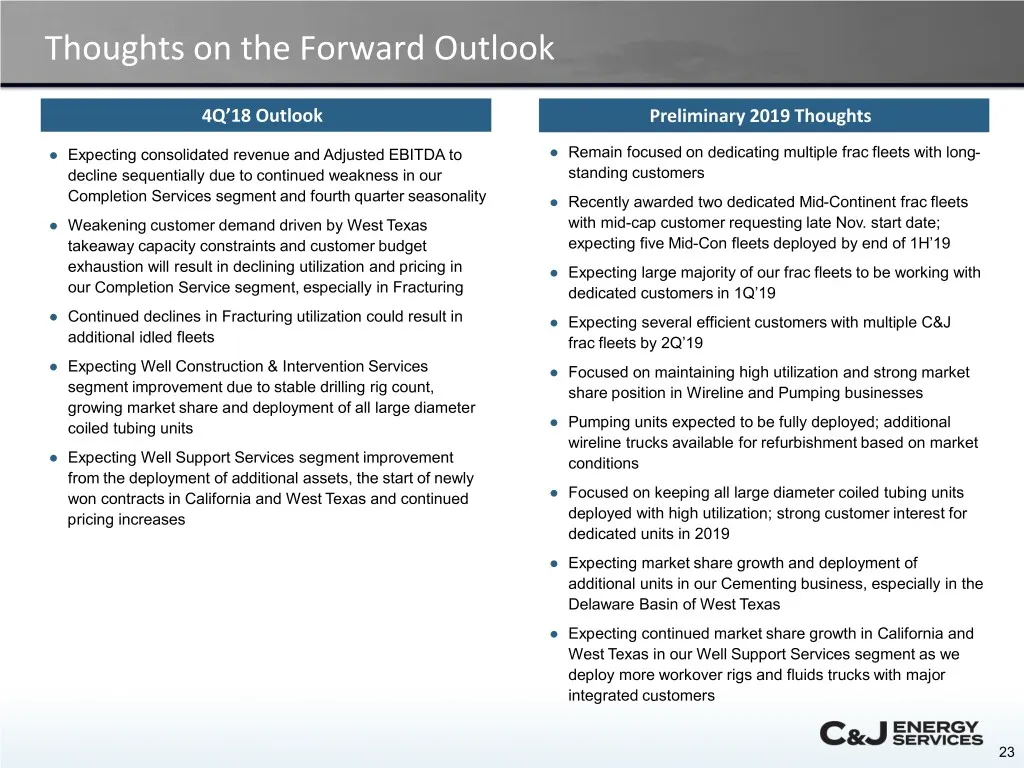
Thoughts on the Forward Outlook 4Q’18 Outlook Preliminary 2019 Thoughts ● Expecting consolidated revenue and Adjusted EBITDA to ● Remain focused on dedicating multiple frac fleets with long- decline sequentially due to continued weakness in our standing customers Completion Services segment and four
Slide 24: Returns Example: Fleet Reactivation vs. Newbuild
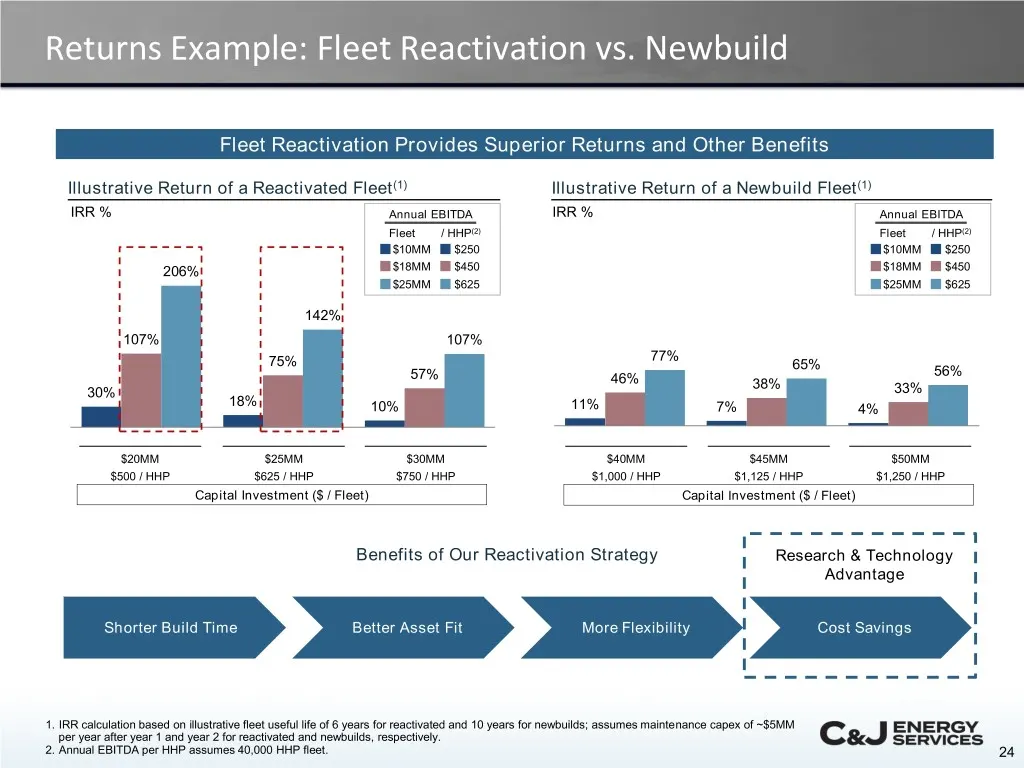
Returns Example: Fleet Reactivation vs. Newbuild Fleet Reactivation Provides Superior Returns and Other Benefits Illustrative Return of a Reactivated Fleet(1) Illustrative Return of a Newbuild Fleet(1) IRR % Annual EBITDA IRR % Annual EBITDA Fleet / HHP(2) Fleet / HHP(2) $10MM $250 $10MM $250 206% $
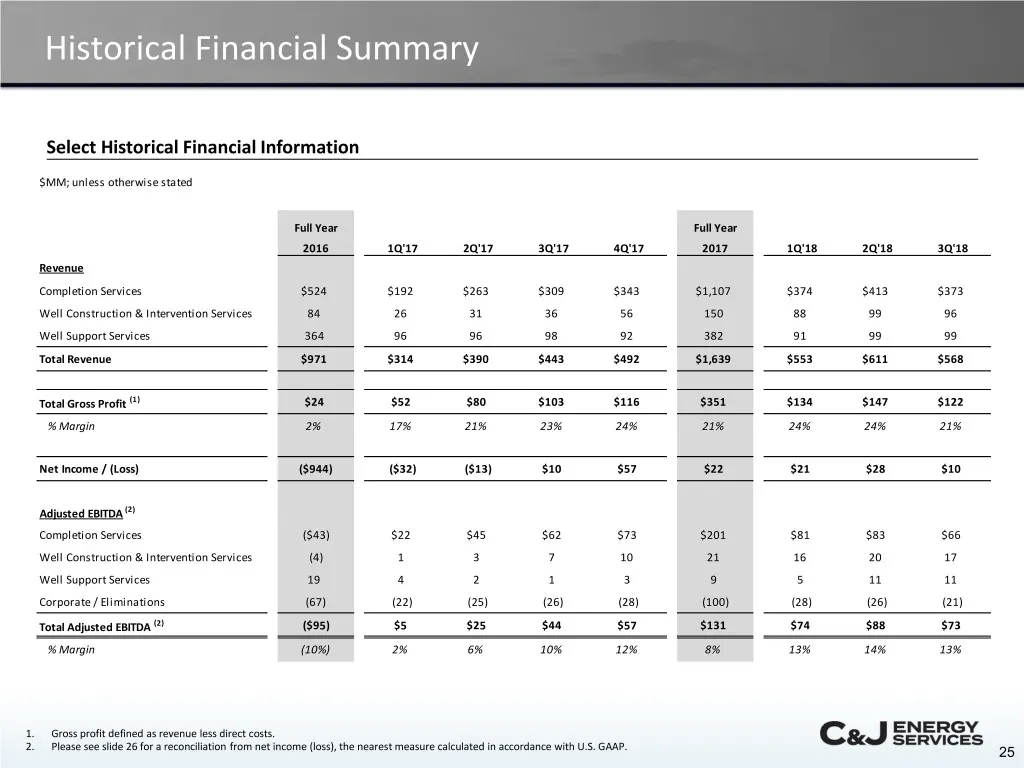
Slide 25: Historical Financial Summary
Historical Financial Summary Select Historical Financial Information $MM; unless otherwise stated Full Year Full Year 2016 1Q'17 2Q'17 3Q'17 4Q'17 2017 1Q'18 2Q'18 3Q'18 Revenue Completion Services $524 $192 $263 $309 $343 $1,107 $374 $413 $373 Well Construction & Intervention Services 84 26 31 36 5
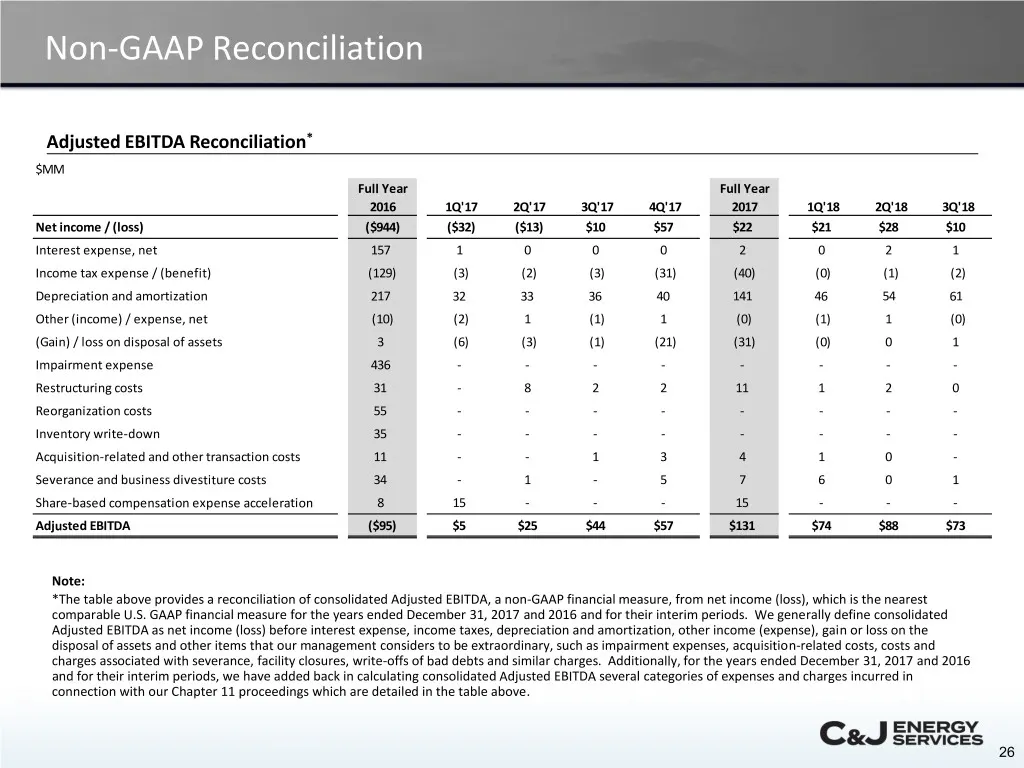
Slide 26: Non-GAAP Reconciliation
Non-GAAP Reconciliation Adjusted EBITDA Reconciliation* $MM Full Year Full Year 2016 1Q'17 2Q'17 3Q'17 4Q'17 2017 1Q'18 2Q'18 3Q'18 Net income / (loss) ($944) ($32) ($13) $10 $57 $22 $21 $28 $10 Interest expense, net 157 1 0 0 0 2 0 2 1 Income tax expense / (benefit) (129) (3) (2) (3) (31) (40) (0)
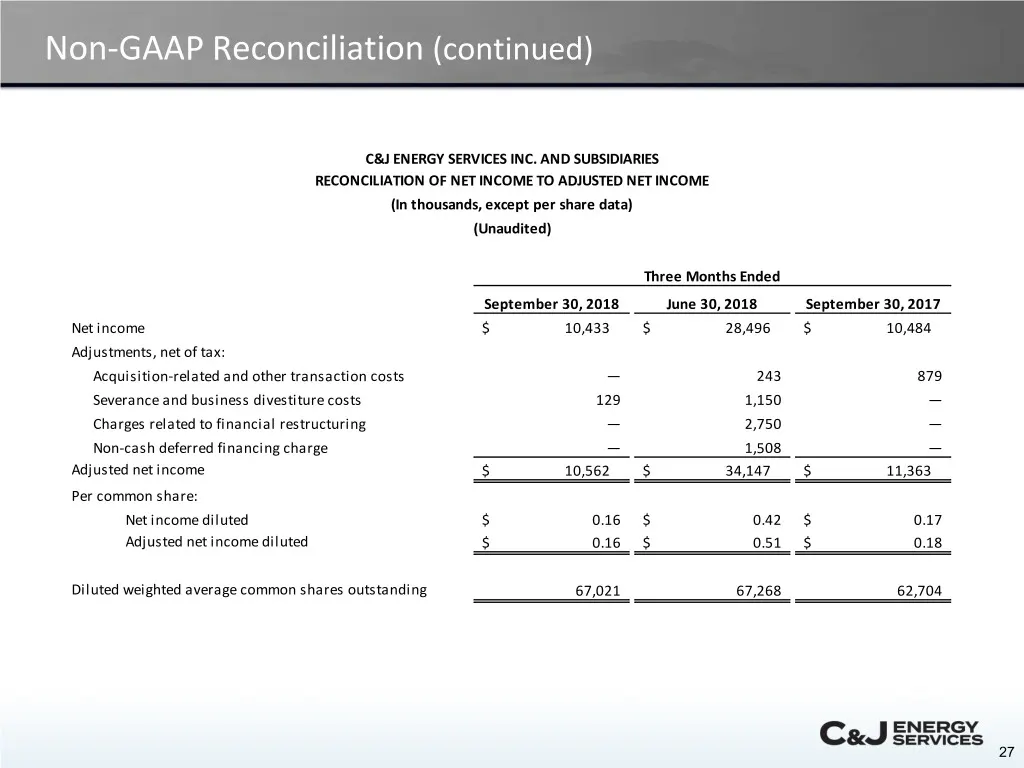
Slide 27: Non-GAAP Reconciliation (continued)
Non-GAAP Reconciliation (continued) C&J ENERGY SERVICES INC. AND SUBSIDIARIES RECONCILIATION OF NET INCOME TO ADJUSTED NET INCOME (In thousands, except per share data) (Unaudited) Three Months Ended September 30, 2018 June 30, 2018 September 30, 2017 Net income $ 10,433 $ 28,496 $ 10,484 Adjustments
Source: SEC EDGAR · 8-K filed Nov 7, 2018
More decks from C&J Energy Services Inc
 Barclays CEO Energy-Power Conference 201933 slides · Sep 3, 2019
 Q2 2019 Earnings Presentation42 slides · Aug 6, 2019
 Q2 2019 Earnings Presentation22 slides · Aug 6, 2019
 Merger or Acquisition (June 2019)20 slides · Jun 17, 2019
 Investor Presentation (May 2019)42 slides · May 14, 2019
 Q1 2019 Earnings Presentation21 slides · May 7, 2019