Dun & Bradstreet Holdings Inc.
Dun & Bradstreet — Q2 2023 Earnings Presentation
13 slides from Dun & Bradstreet's earnings presentation, Aug 3, 2023
Slide 1: Second Quarter 2023 Financial Results
Public August 3, 2023 Second Quarter 2023 Financial Results
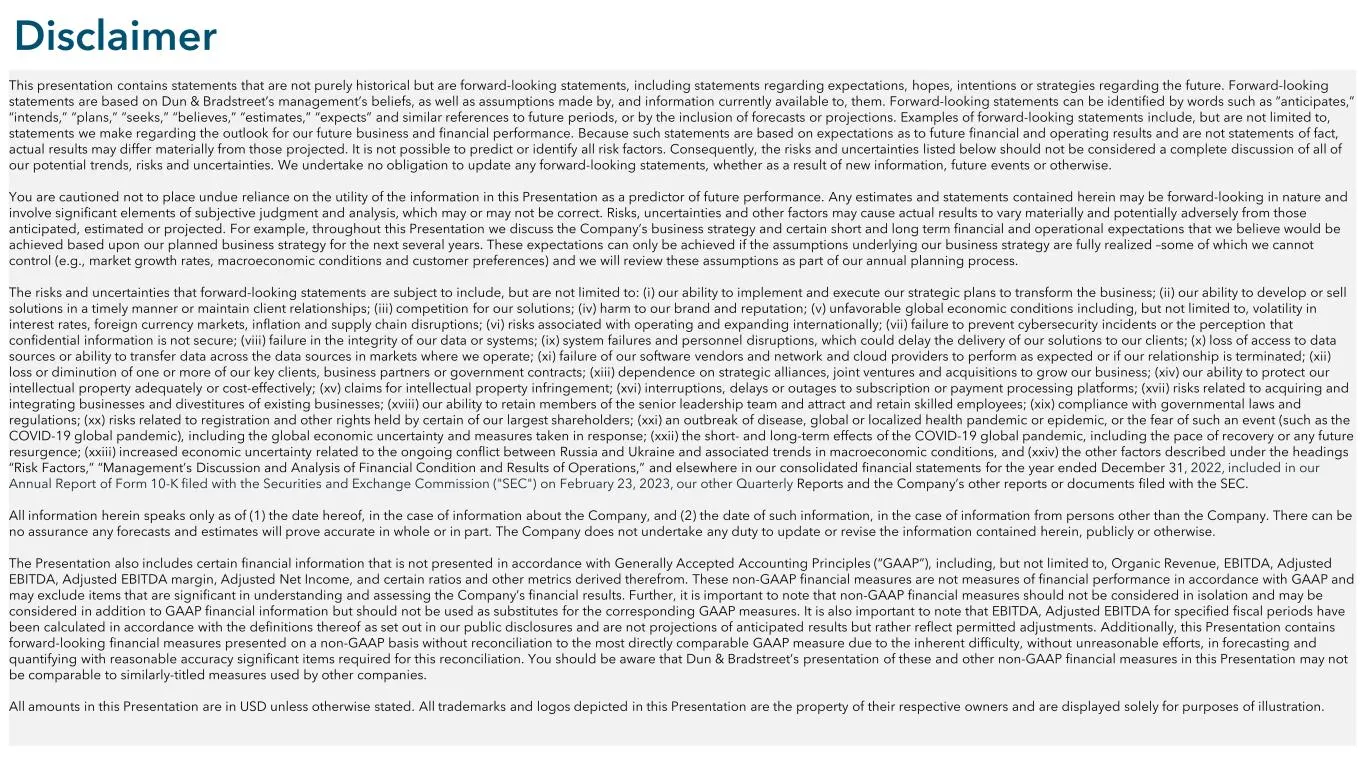
Slide 2: Disclaimer
Public Disclaimer This presentation contains statements that are not purely historical but are forward-looking statements, including statements regarding expectations, hopes, intentions or strategies regarding the future. Forward-looking statements are based on Dun & Bradstreet’s management’s belief
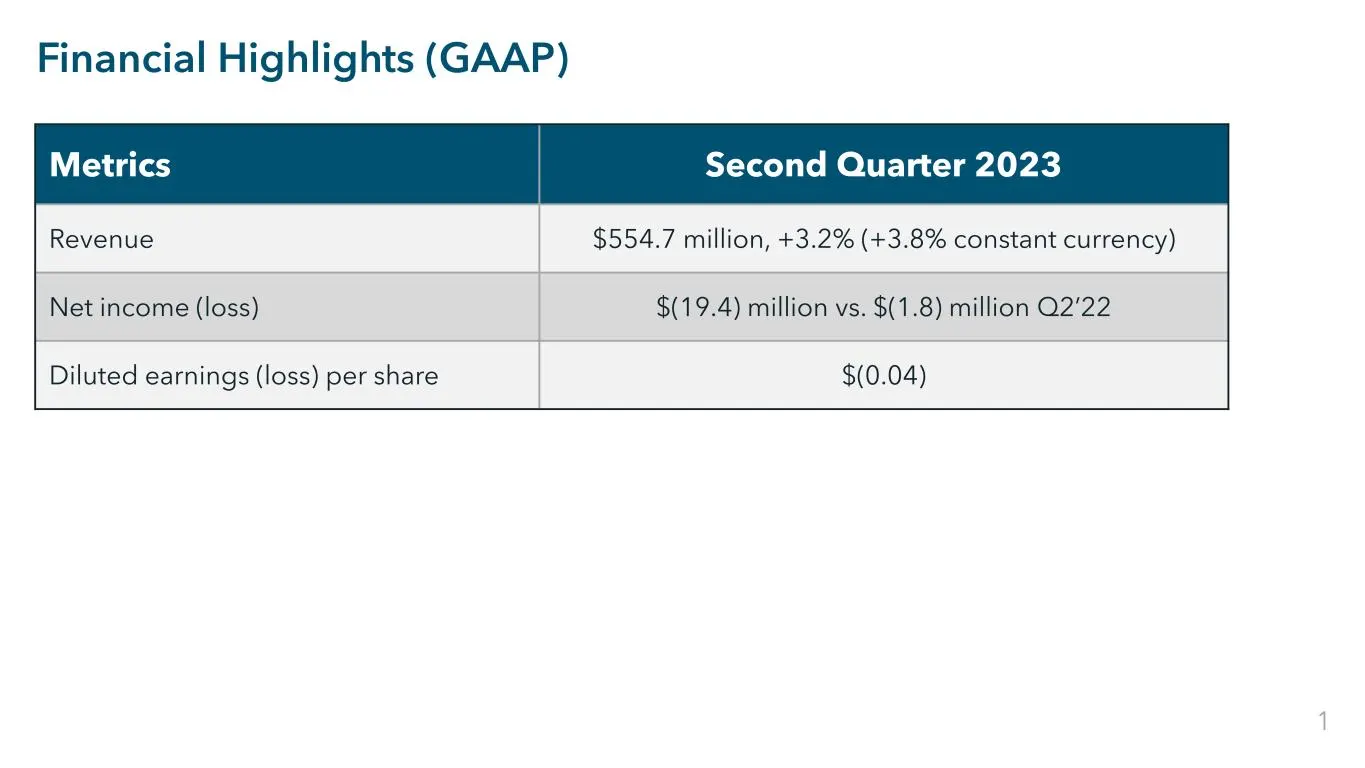
Slide 3: Financial Highlights (GAAP)
Public Financial Highlights (GAAP) Metrics Second Quarter 2023 Revenue $554.7 million, +3.2% (+3.8% constant currency) Net income (loss) $(19.4) million vs. $(1.8) million Q2’22 Diluted earnings (loss) per share $(0.04) 1
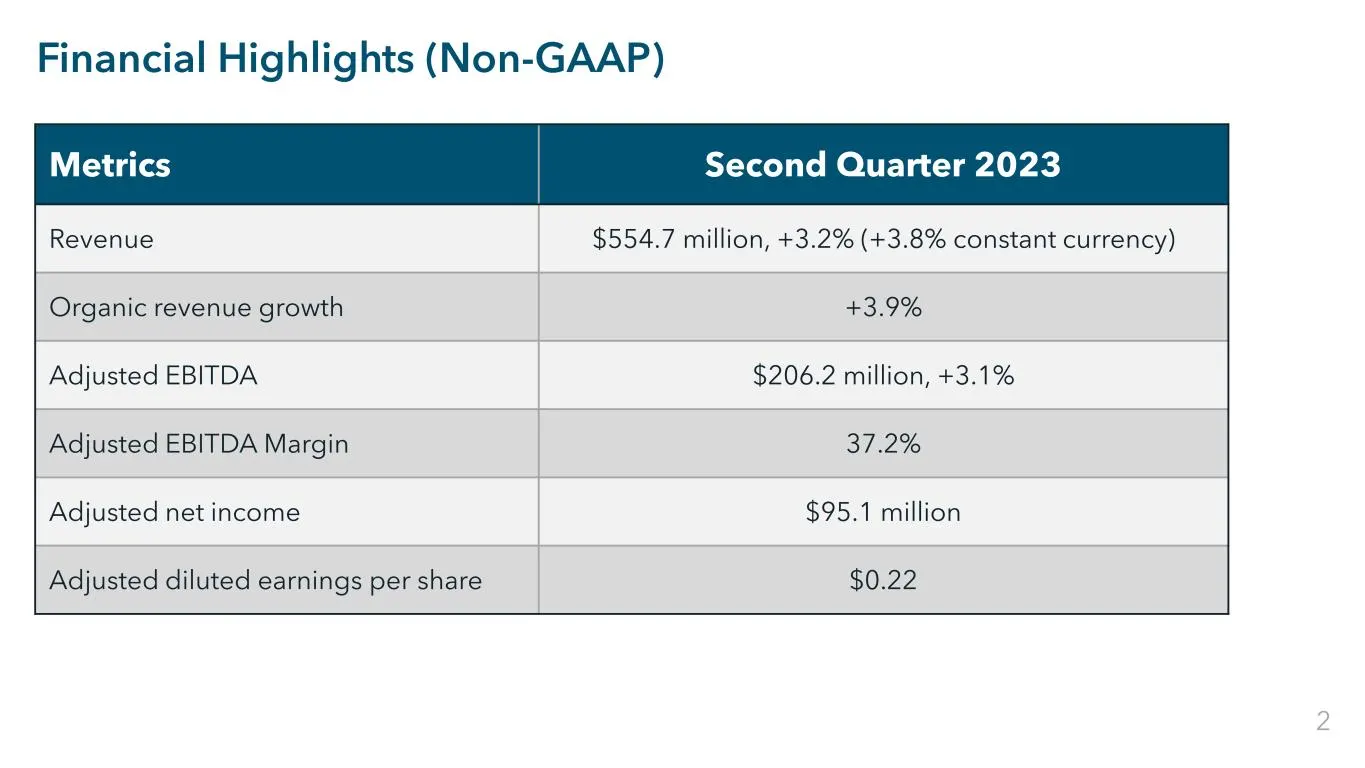
Slide 4: Financial Highlights (Non-GAAP)
Public Financial Highlights (Non-GAAP) Metrics Second Quarter 2023 Revenue $554.7 million, +3.2% (+3.8% constant currency) Organic revenue growth +3.9% Adjusted EBITDA $206.2 million, +3.1% Adjusted EBITDA Margin 37.2% Adjusted net income $95.1 million Adjusted diluted earnings per share $0.22 2
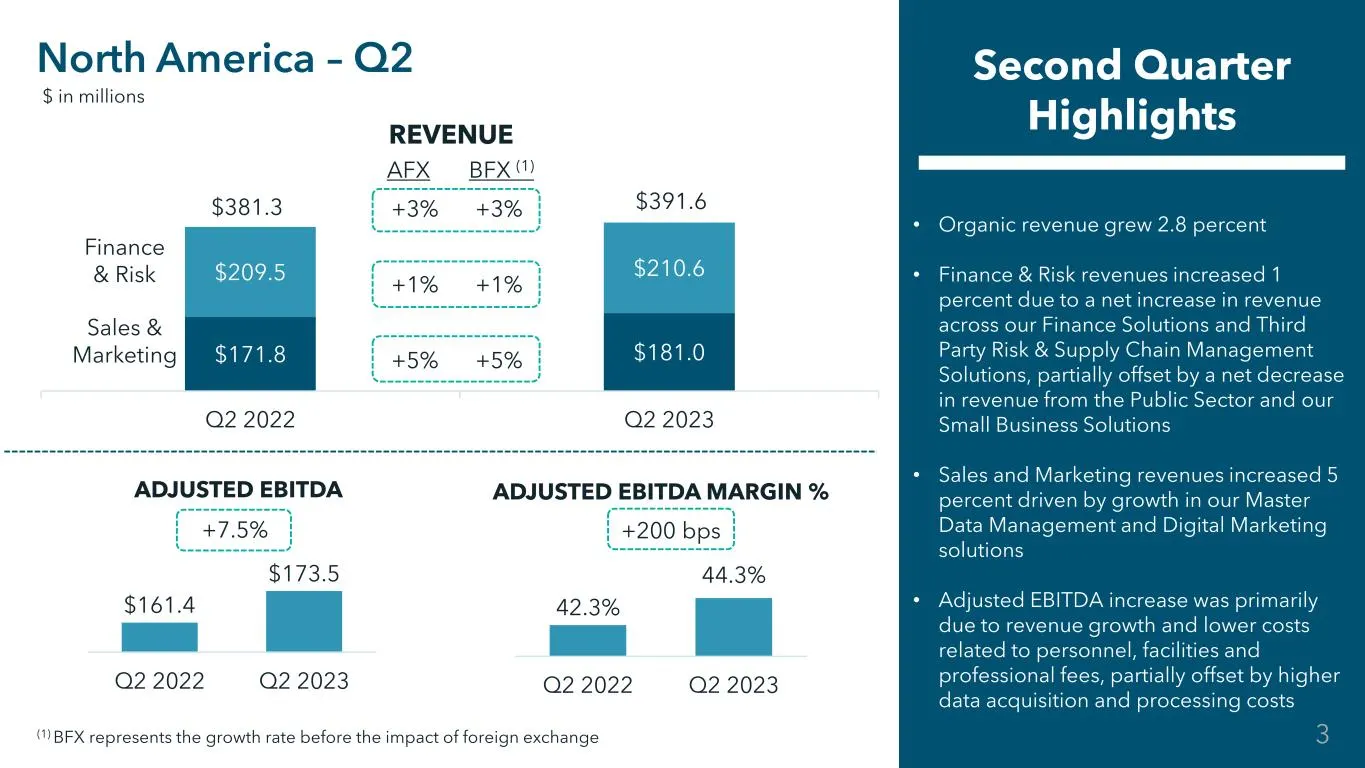
Slide 5: North America – Q2 Second Quarter Highlights
Public $171.8 $181.0 $209.5 $210.6 Q2 2022 Q2 2023 +3% +3% +1% +1% +5% +5% • Organic revenue grew 2.8 percent • Finance & Risk revenues increased 1 percent due to a net increase in revenue across our Finance Solutions and Third Party Risk & Supply Chain Management Solutions, partially offset by a ne
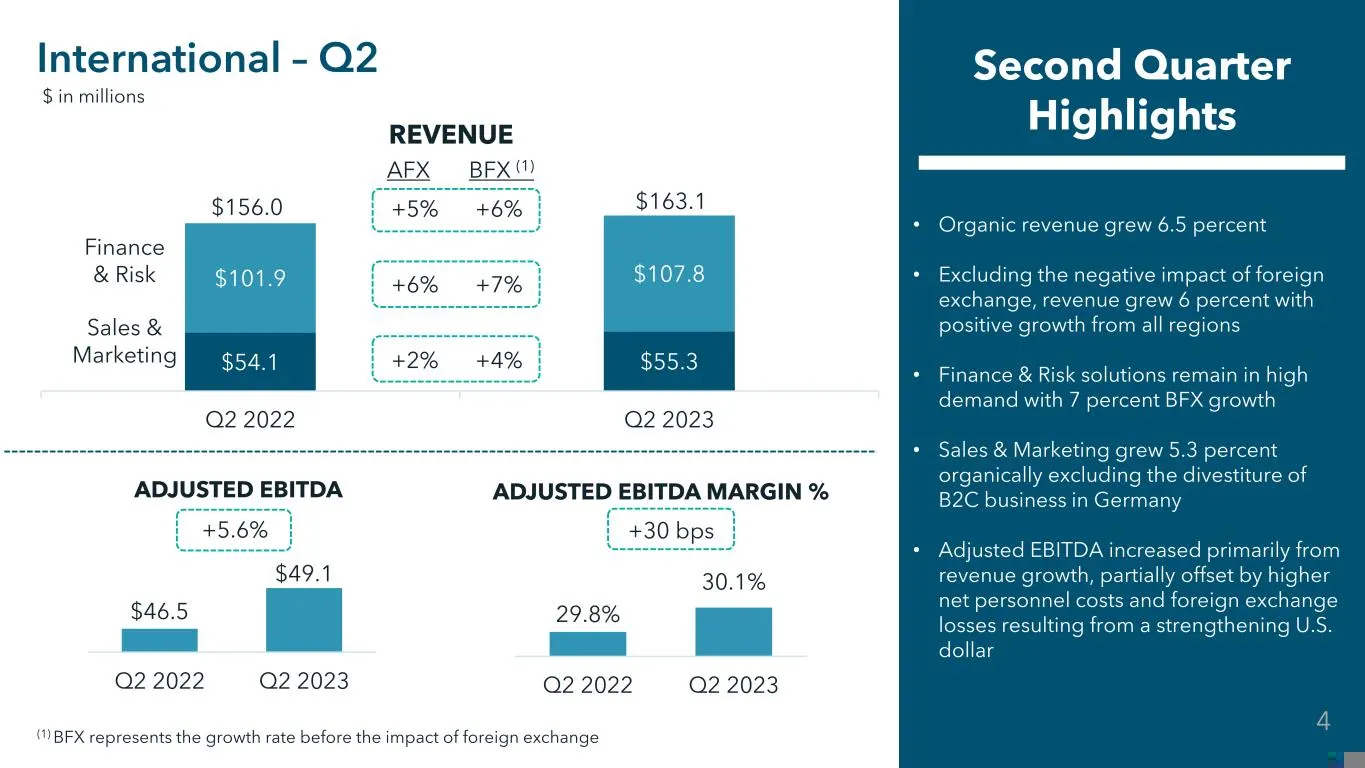
Slide 6: International – Q2 Second Quarter Highlights
Public $54.1 $55.3 $101.9 $107.8 Q2 2022 Q2 2023 +5% +6% +6% +7% +2% +4% • Organic revenue grew 6.5 percent • Excluding the negative impact of foreign exchange, revenue grew 6 percent with positive growth from all regions • Finance & Risk solutions remain in high demand with 7 percent BFX growth • S
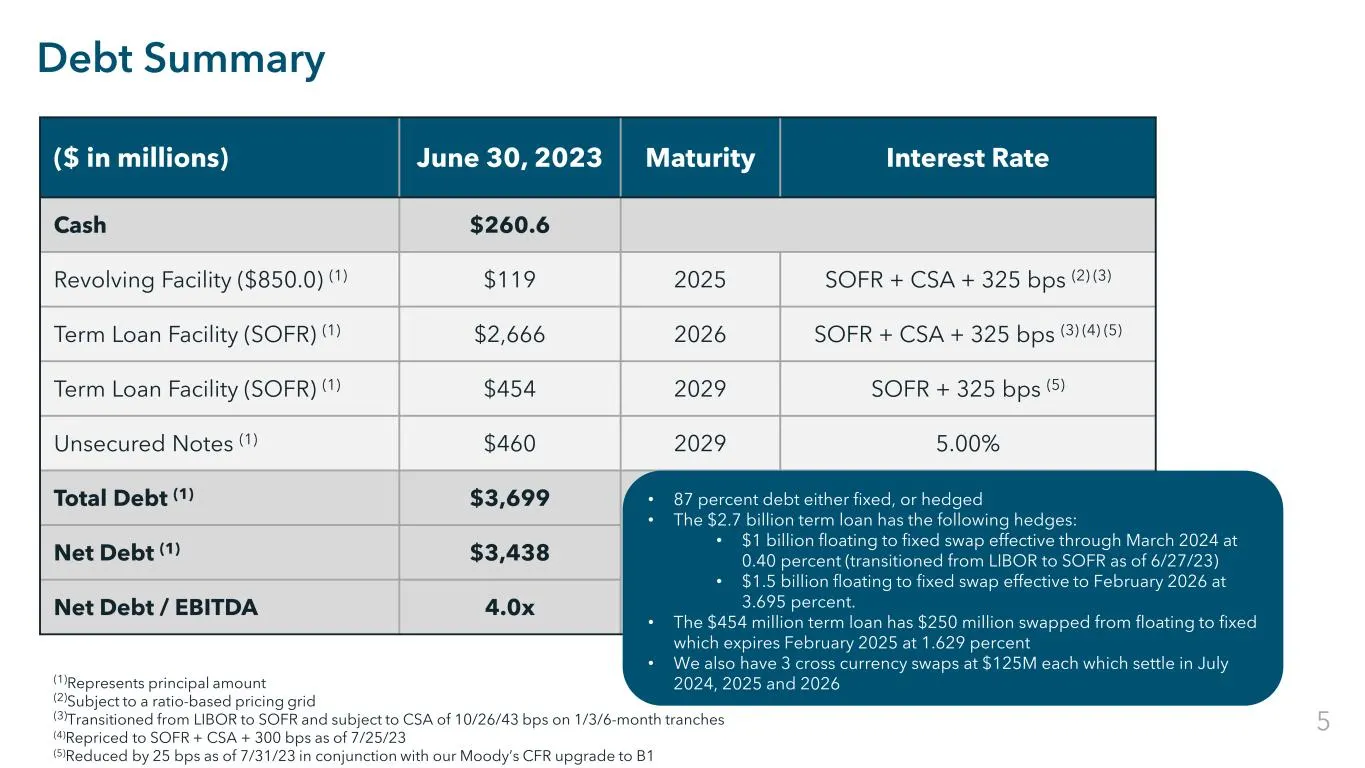
Slide 7: Debt Summary
Public Debt Summary ($ in millions) June 30, 2023 Maturity Interest Rate Cash $260.6 Revolving Facility ($850.0) (1) $119 2025 SOFR + CSA + 325 bps (2) (3) Term Loan Facility (SOFR) (1) $2,666 2026 SOFR + CSA + 325 bps (3) (4) (5) Term Loan Facility (SOFR) (1) $454 2029 SOFR + 325 bps (5) Unsecured
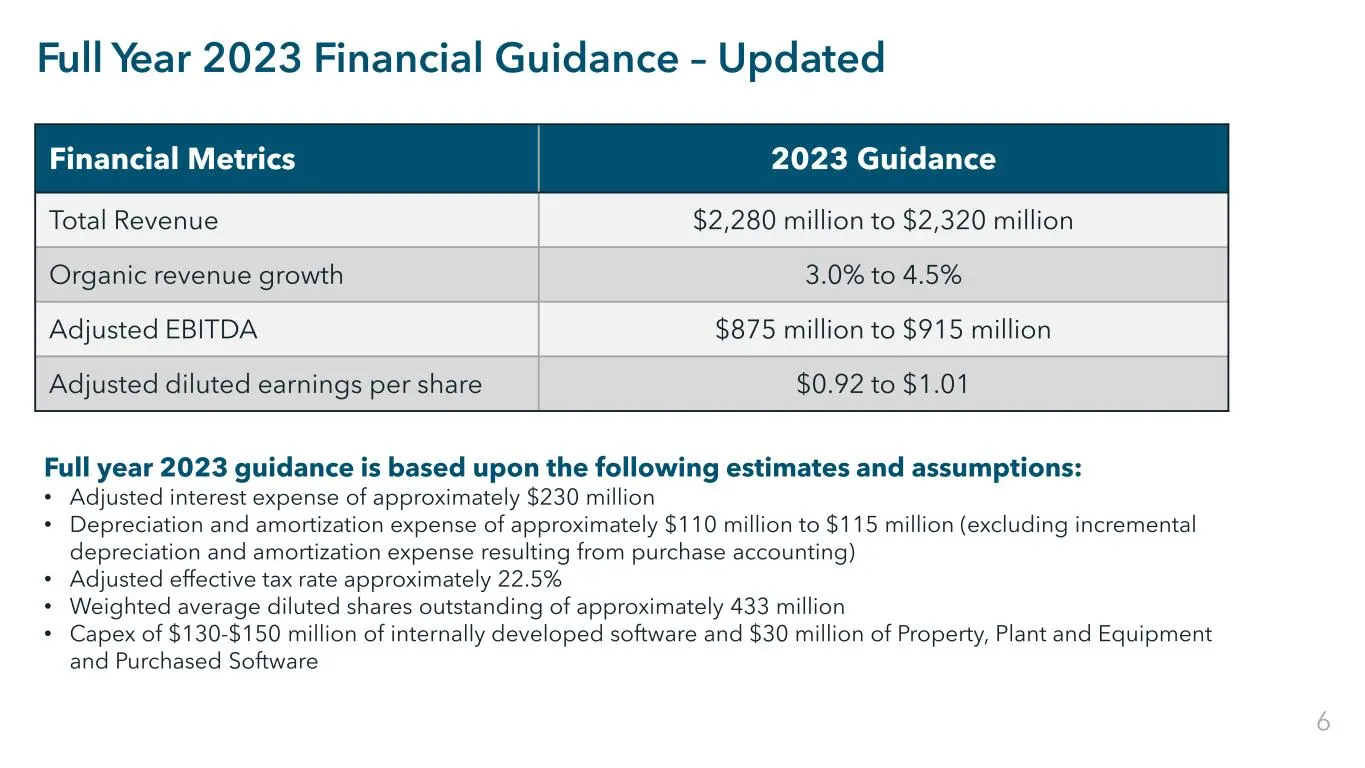
Slide 8: Full Year 2023 Financial Guidance – Updated
Public Full Year 2023 Financial Guidance – Updated Financial Metrics 2023 Guidance Total Revenue $2,280 million to $2,320 million Organic revenue growth 3.0% to 4.5% Adjusted EBITDA $875 million to $915 million Adjusted diluted earnings per share $0.92 to $1.01 Full year 2023 guidance is based upon

Slide 9: Appendix
Appendix dun&bradstreet
Slide 10: Non-GAAP Financial Measures
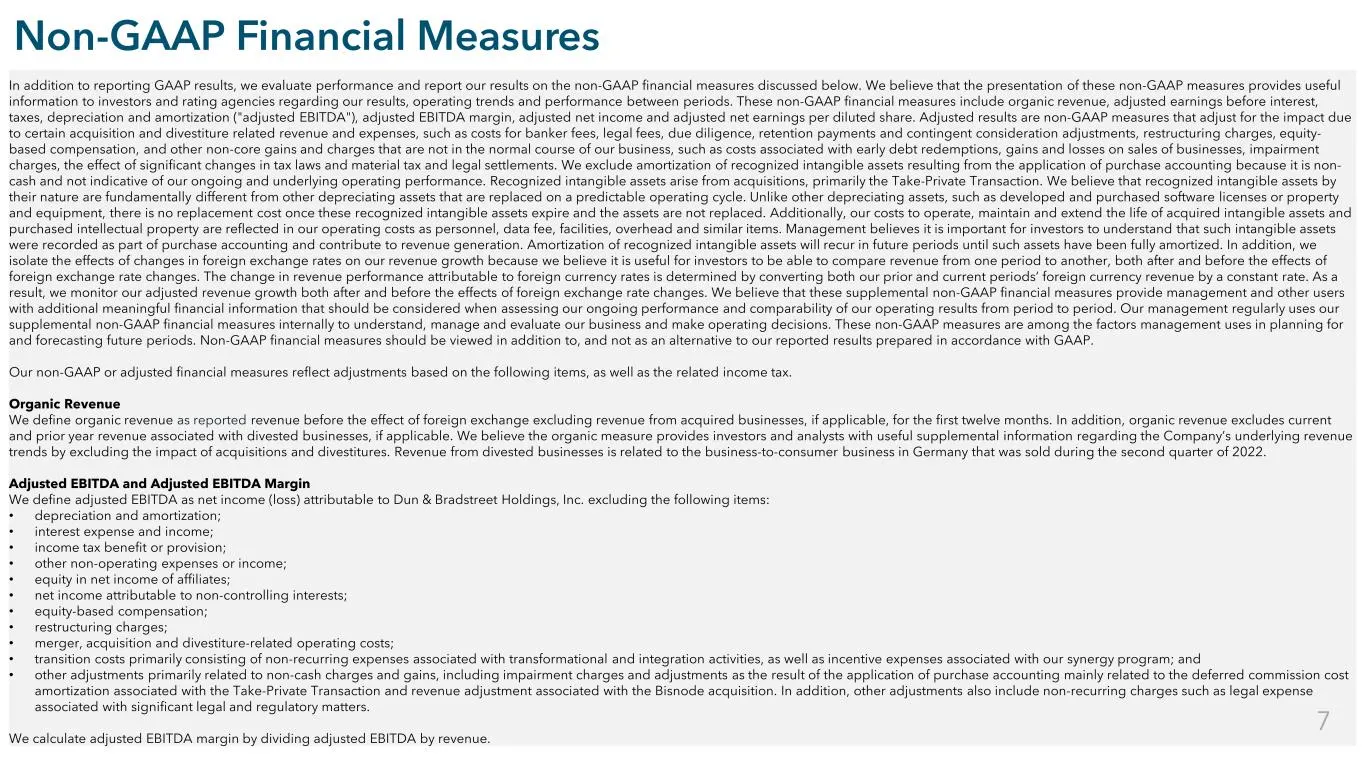
Public Non-GAAP Financial Measures In addition to reporting GAAP results, we evaluate performance and report our results on the non-GAAP financial measures discussed below. We believe that the presentation of these non-GAAP measures provides useful information to investors and rating agencies regard
Slide 11: Non-GAAP Financial Measures (Continued)
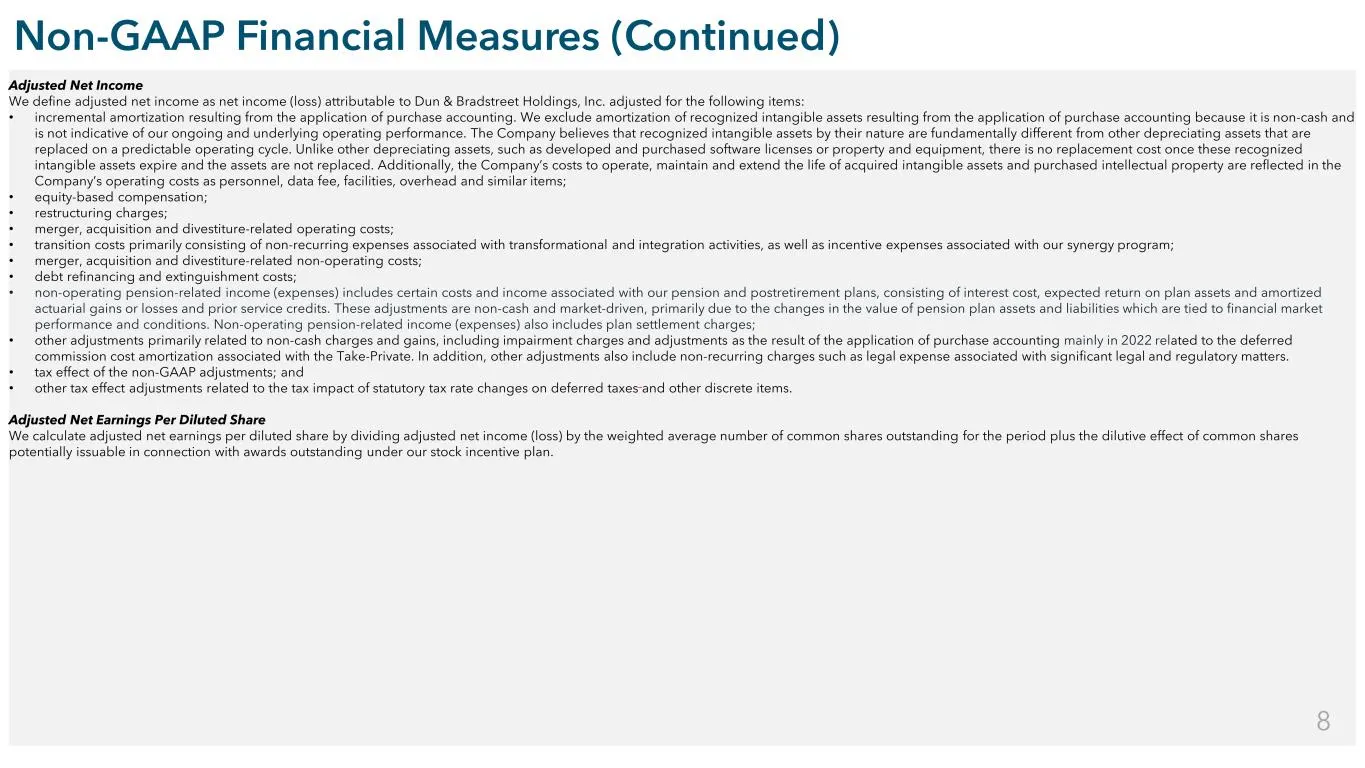
Public Non-GAAP Financial Measures (Continued) Adjusted Net Income We define adjusted net income as net income (loss) attributable to Dun & Bradstreet Holdings, Inc. adjusted for the following items: • incremental amortization resulting from the application of purchase accounting. We exclude amortiz
Slide 12: Non-GAAP Reconciliation: Adjusted EBITDA
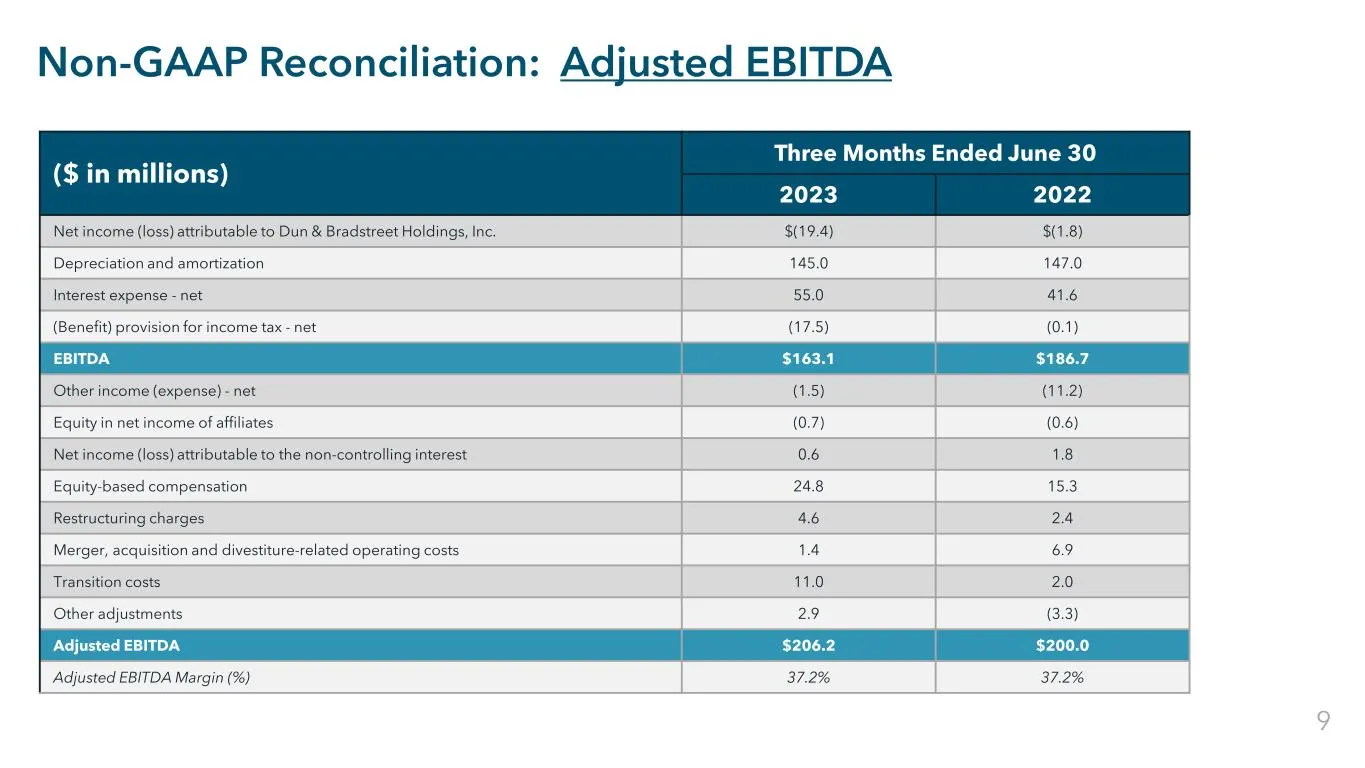
Public Non-GAAP Reconciliation: Adjusted EBITDA ($ in millions) Three Months Ended June 30 2023 2022 Net income (loss) attributable to Dun & Bradstreet Holdings, Inc. $(19.4) $(1.8) Depreciation and amortization 145.0 147.0 Interest expense - net 55.0 41.6 (Benefit) provision for income tax - net (1
Slide 13: Non-GAAP Reconciliation: Adjusted Net Income
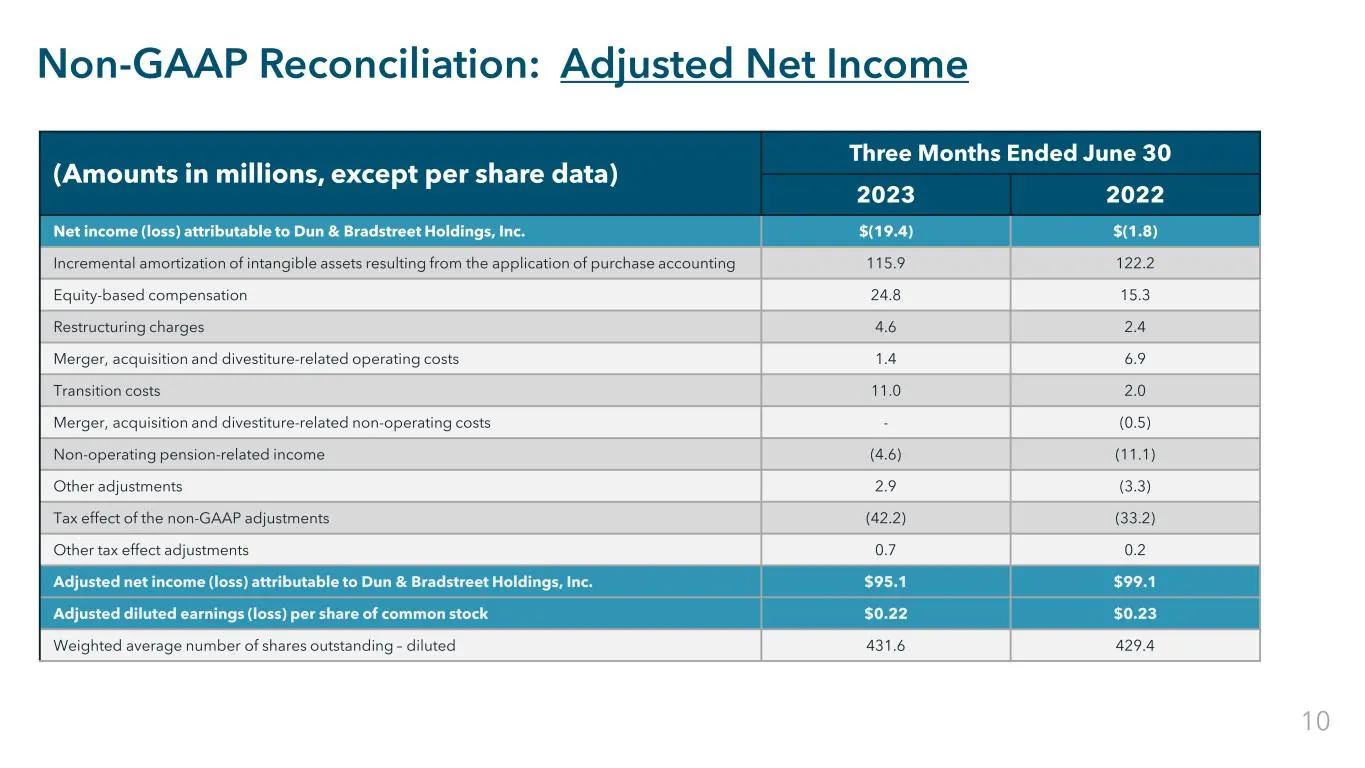
Public Non-GAAP Reconciliation: Adjusted Net Income (Amounts in millions, except per share data) Three Months Ended June 30 2023 2022 Net income (loss) attributable to Dun & Bradstreet Holdings, Inc. $(19.4) $(1.8) Incremental amortization of intangible assets resulting from the application of purch
Source: SEC EDGAR · 8-K filed Aug 3, 2023
More decks from Dun & Bradstreet Holdings Inc.
 Q1 2025 Earnings Presentation12 slides · May 1, 2025
 Q4 2024 Earnings Presentation15 slides · Feb 20, 2025
 Q3 2024 Earnings Presentation13 slides · Oct 31, 2024
 Q2 2024 Earnings Presentation13 slides · Aug 1, 2024
 Q1 2024 Earnings Presentation13 slides · May 2, 2024
 FY2023 Earnings Presentation16 slides · Feb 15, 2024