Triton International Ltd. · NYSE:TRTN/PA
Triton International — Investor Presentation (February 2018)
29 slides from Triton International's investor presentation, February 2018
Slide 1: Investor Presentation February 2018
INVESTOR PRESENTATION February 2018 1
Slide 2: Disclaimer
DISCLAIMER Forward-Looking Statements Certain statements in this presentation, other than purely historical information, are "forward-looking statements" within the meaning of the Private Securities Litigation Reform Act of 1995, Section 27A of the Securities Act of 1933, as amended, and Section 21E
Slide 3: Company Overview
Company Overview w TRITON INTERNATIONAL
Slide 4: Overview
OVERVIEW Triton International Limited (“Triton”) is the largest container leasing company in the world » Created in July 2016 through the merger of two long-term industry leaders, Triton Container International Limited (“TCIL”) and TAL International Group Inc. (“TAL”) » Own over 5.6 million twenty
Slide 5: Triton Container Fleet and Lease Portfolio
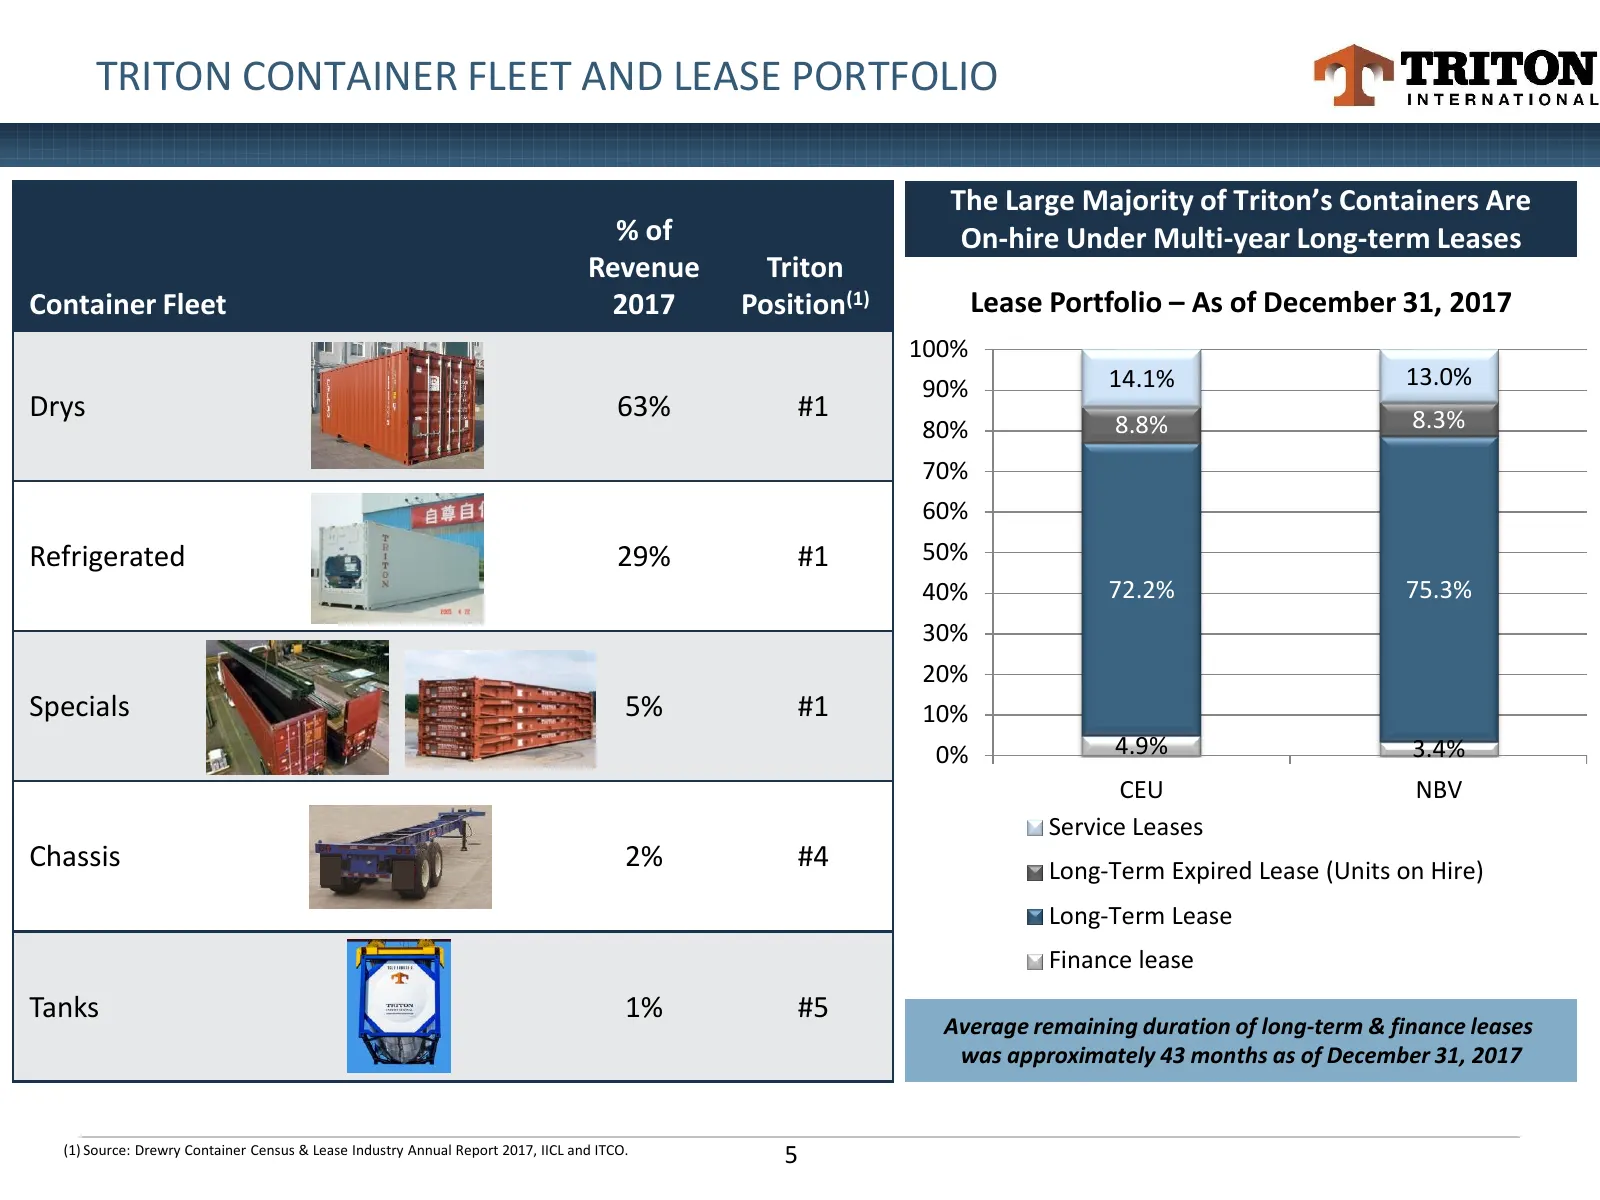
TRITON CONTAINER FLEET AND LEASE PORTFOLIO The Large Majority of Triton’s Containers Are % of On-hire Under Multi-year Long-term Leases Revenue Triton Container Fleet 2017 Position(1) Lease Portfolio – As of December 31, 2017 100% 90% 14.1% 13.0% Drys 63% #1 8.3% 80% 8.8% 70% 60% Refrigerated 29% #1
Slide 6: Triton's Evolution into the Premier Container Lessor
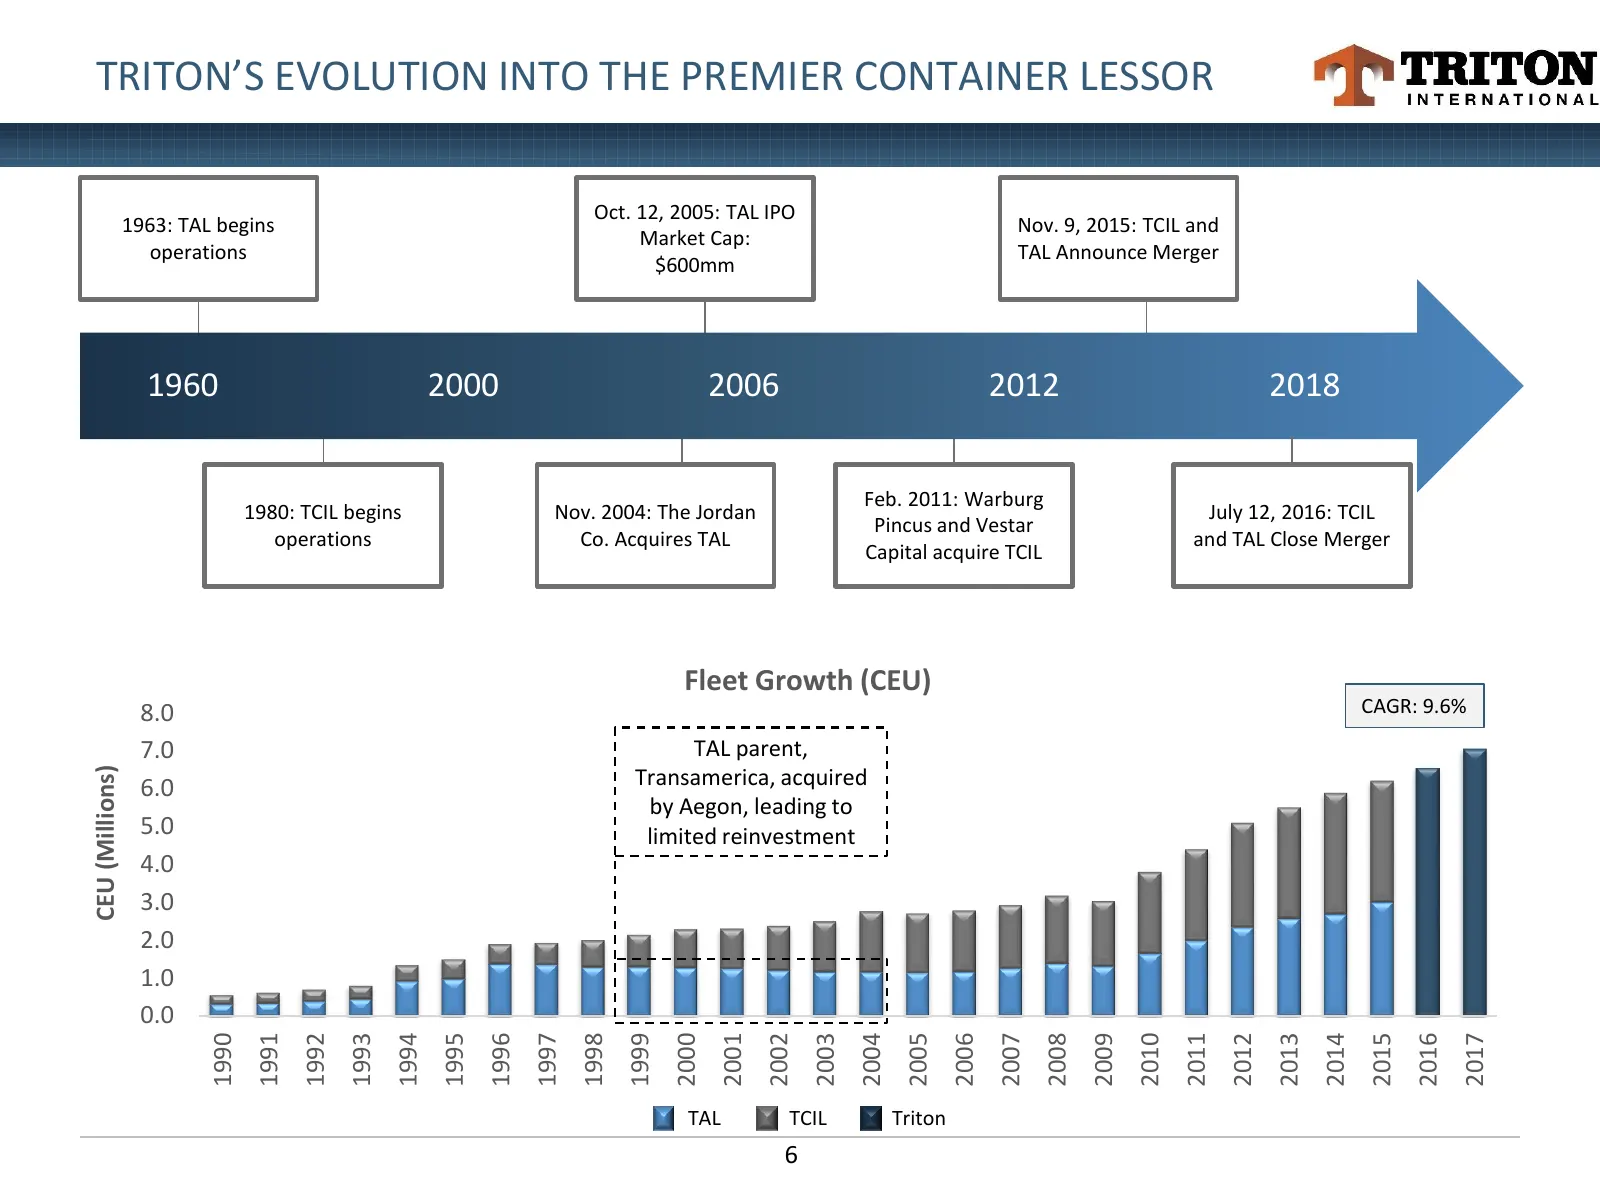
TRITON’S EVOLUTION INTO THE PREMIER CONTAINER LESSOR Oct. 12, 2005: TAL IPO 1963: TAL begins Nov. 9, 2015: TCIL and Market Cap: operations TAL Announce Merger $600mm 1960 2000 2006 2012 2018 Feb. 2011: Warburg 1980: TCIL begins Nov. 2004: The Jordan July 12, 2016: TCIL Pincus and Vestar operations C
Slide 7: Merger Set a New Standard Across Consolidating Landscape
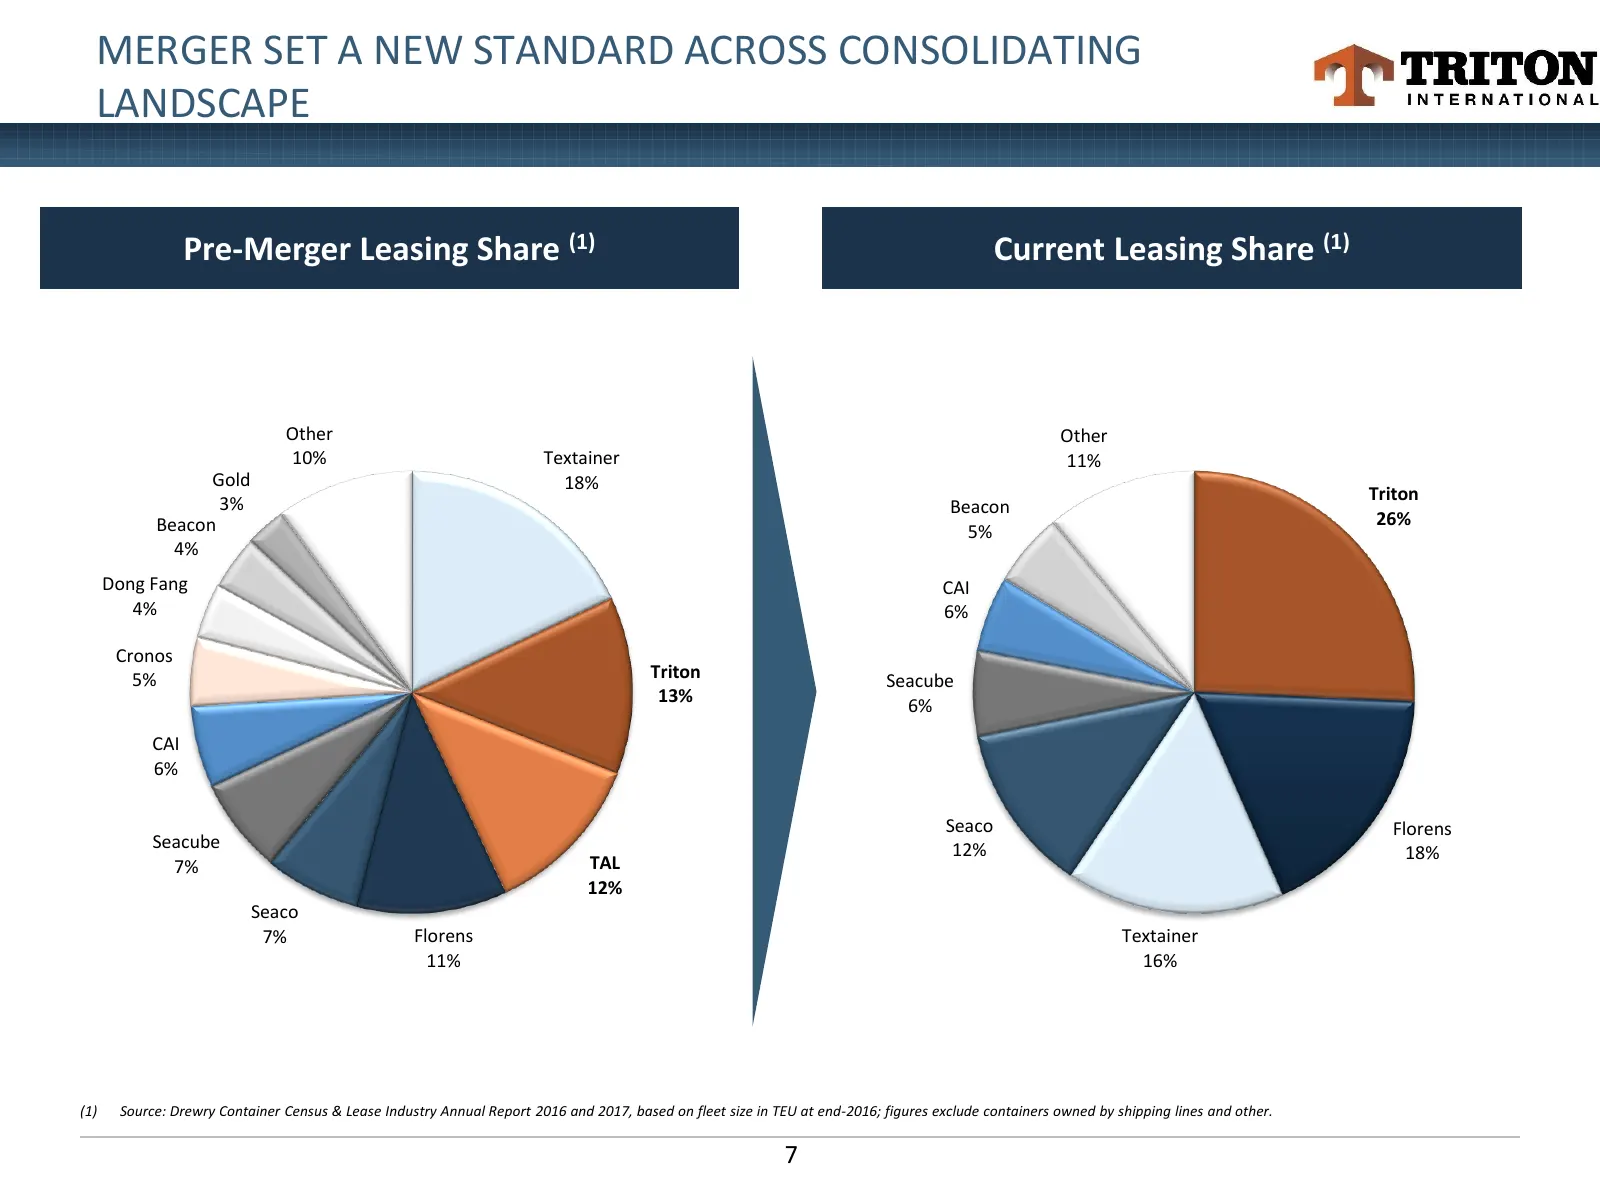
MERGER SET A NEW STANDARD ACROSS CONSOLIDATING LANDSCAPE Pre-Merger Leasing Share (1) Current Leasing Share (1) Other Other 10% Textainer 11% Gold 18% Triton 3% Beacon Beacon 26% 5% 4% Dong Fang CAI 4% 6% Cronos 5% Triton Seacube 13% 6% CAI 6% Seaco Florens Seacube 12% 18% 7% TAL 12% Seaco 7% Floren
Slide 8: Scale Advantages
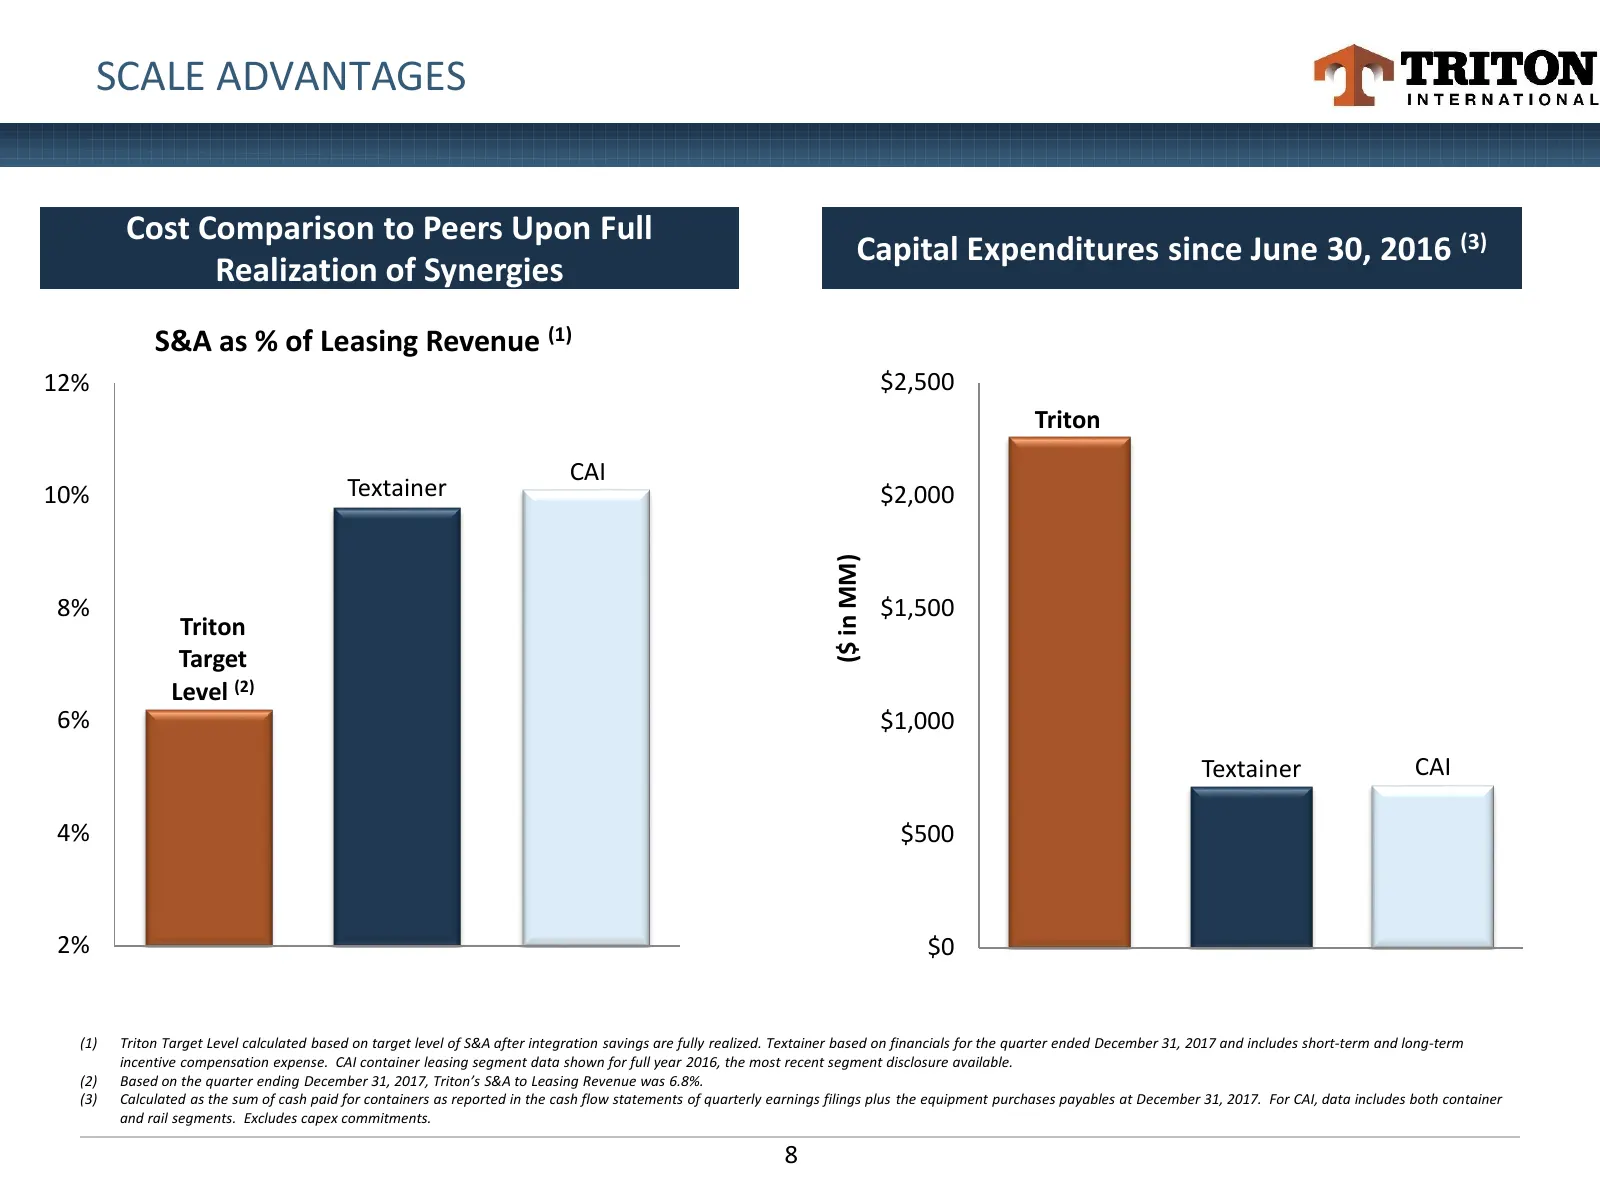
SCALE ADVANTAGES Cost Comparison to Peers Upon Full Capital Expenditures since June 30, 2016 (3) Realization of Synergies S&A as % of Leasing Revenue (1) 12% $2,500 Triton CAI 10% Textainer $2,000 ($ in MM) 8% $1,500 Triton Target Level (2) 6% $1,000 Textainer CAI 4% $500 2% Triton Target Leve l Tex
Slide 9: Extensive Global Operating Infrastructure
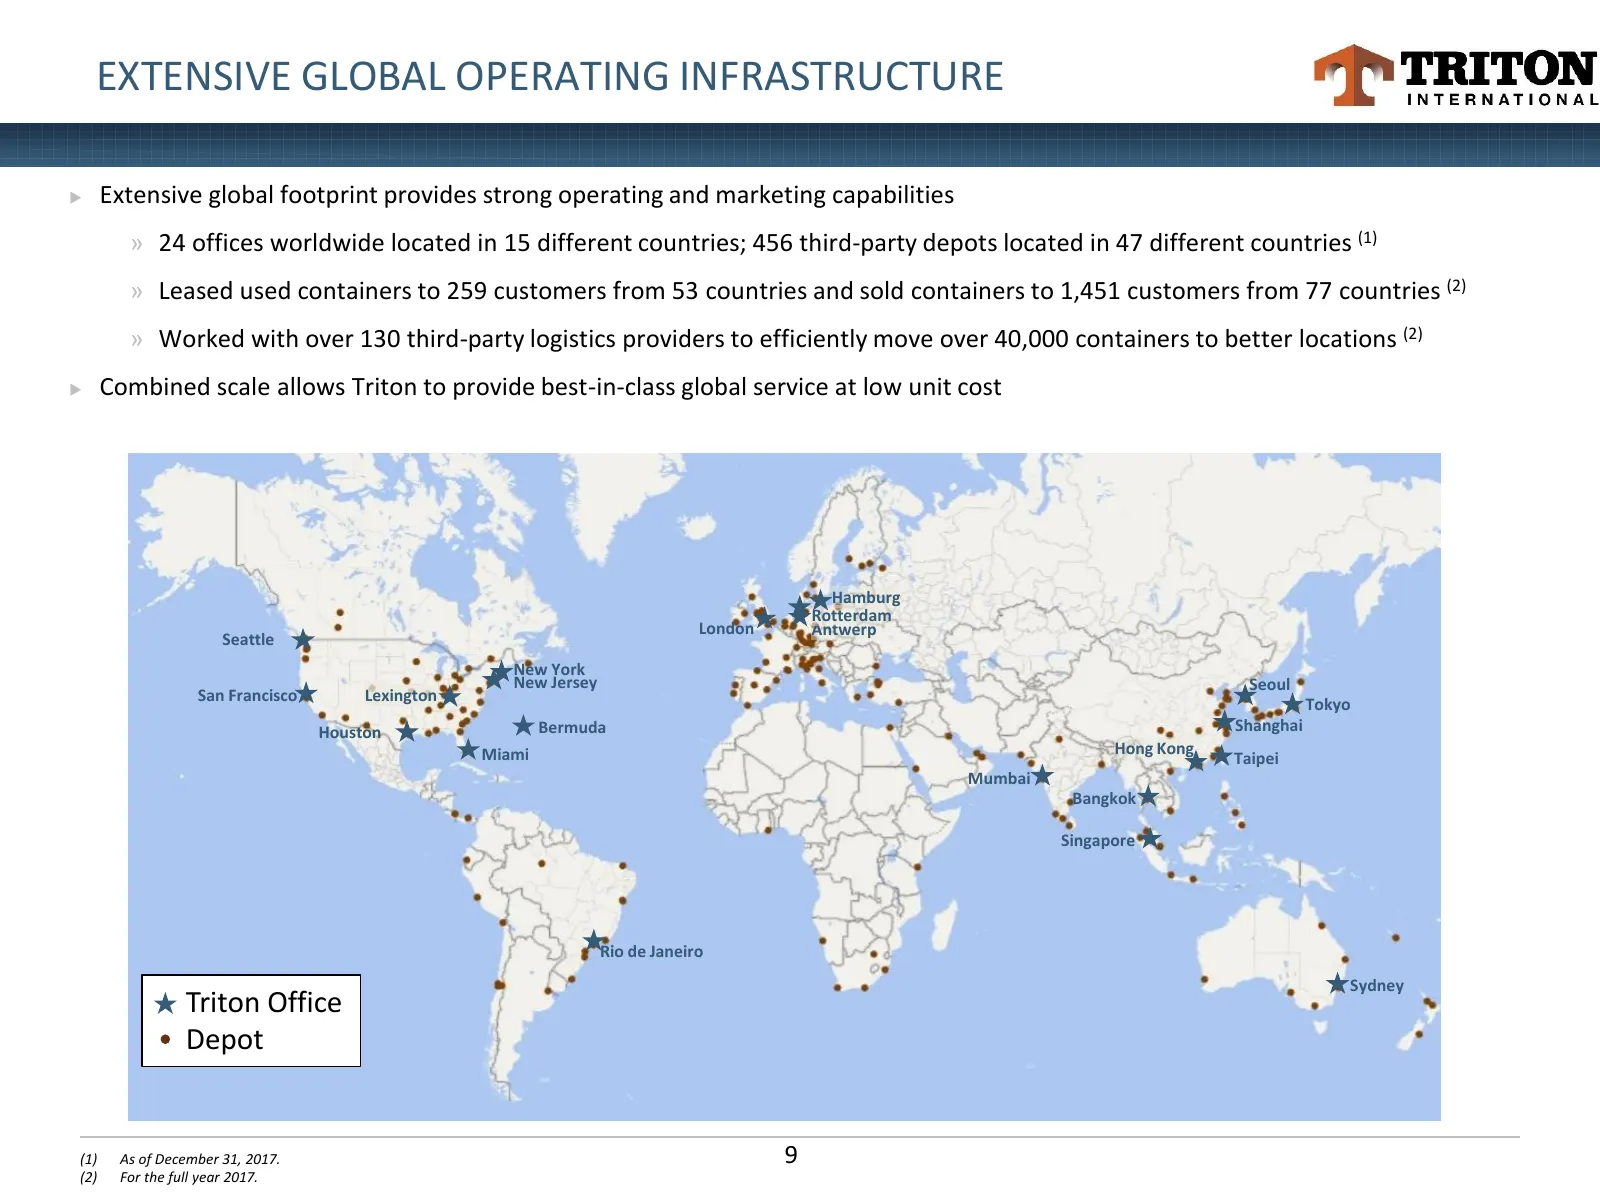
EXTENSIVE GLOBAL OPERATING INFRASTRUCTURE Extensive global footprint provides strong operating and marketing capabilities » 24 offices worldwide located in 15 different countries; 456 third-party depots located in 47 different countries (1) » Leased used containers to 259 customers from 53 countri
Slide 10: Supplier of Choice to World's Largest Shipping Lines
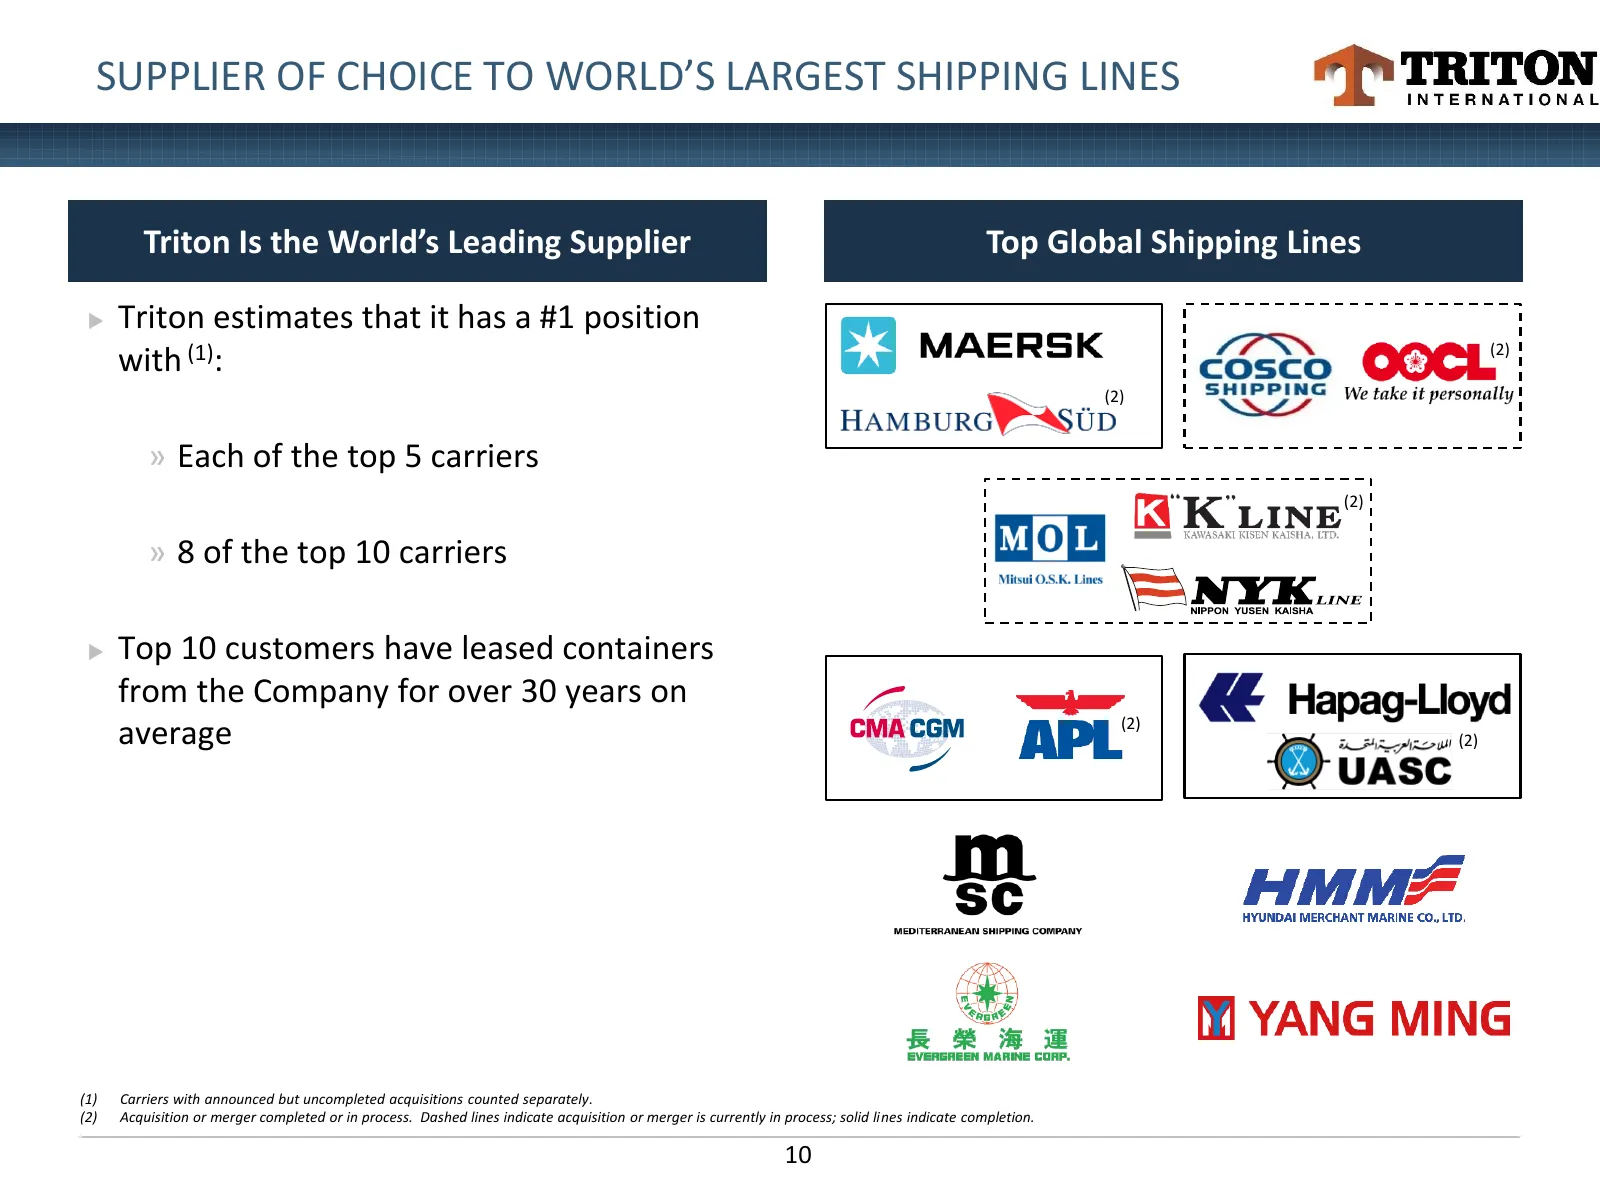
SUPPLIER OF CHOICE TO WORLD’S LARGEST SHIPPING LINES Triton Is the World’s Leading Supplier Top Global Shipping Lines Triton estimates that it has a #1 position (2) with (1): (2) » Each of the top 5 carriers (2) » 8 of the top 10 carriers Top 10 customers have leased containers from the Company
Slide 11: Long-Term Performance Supported by Strong Cash Flow and Resiliency
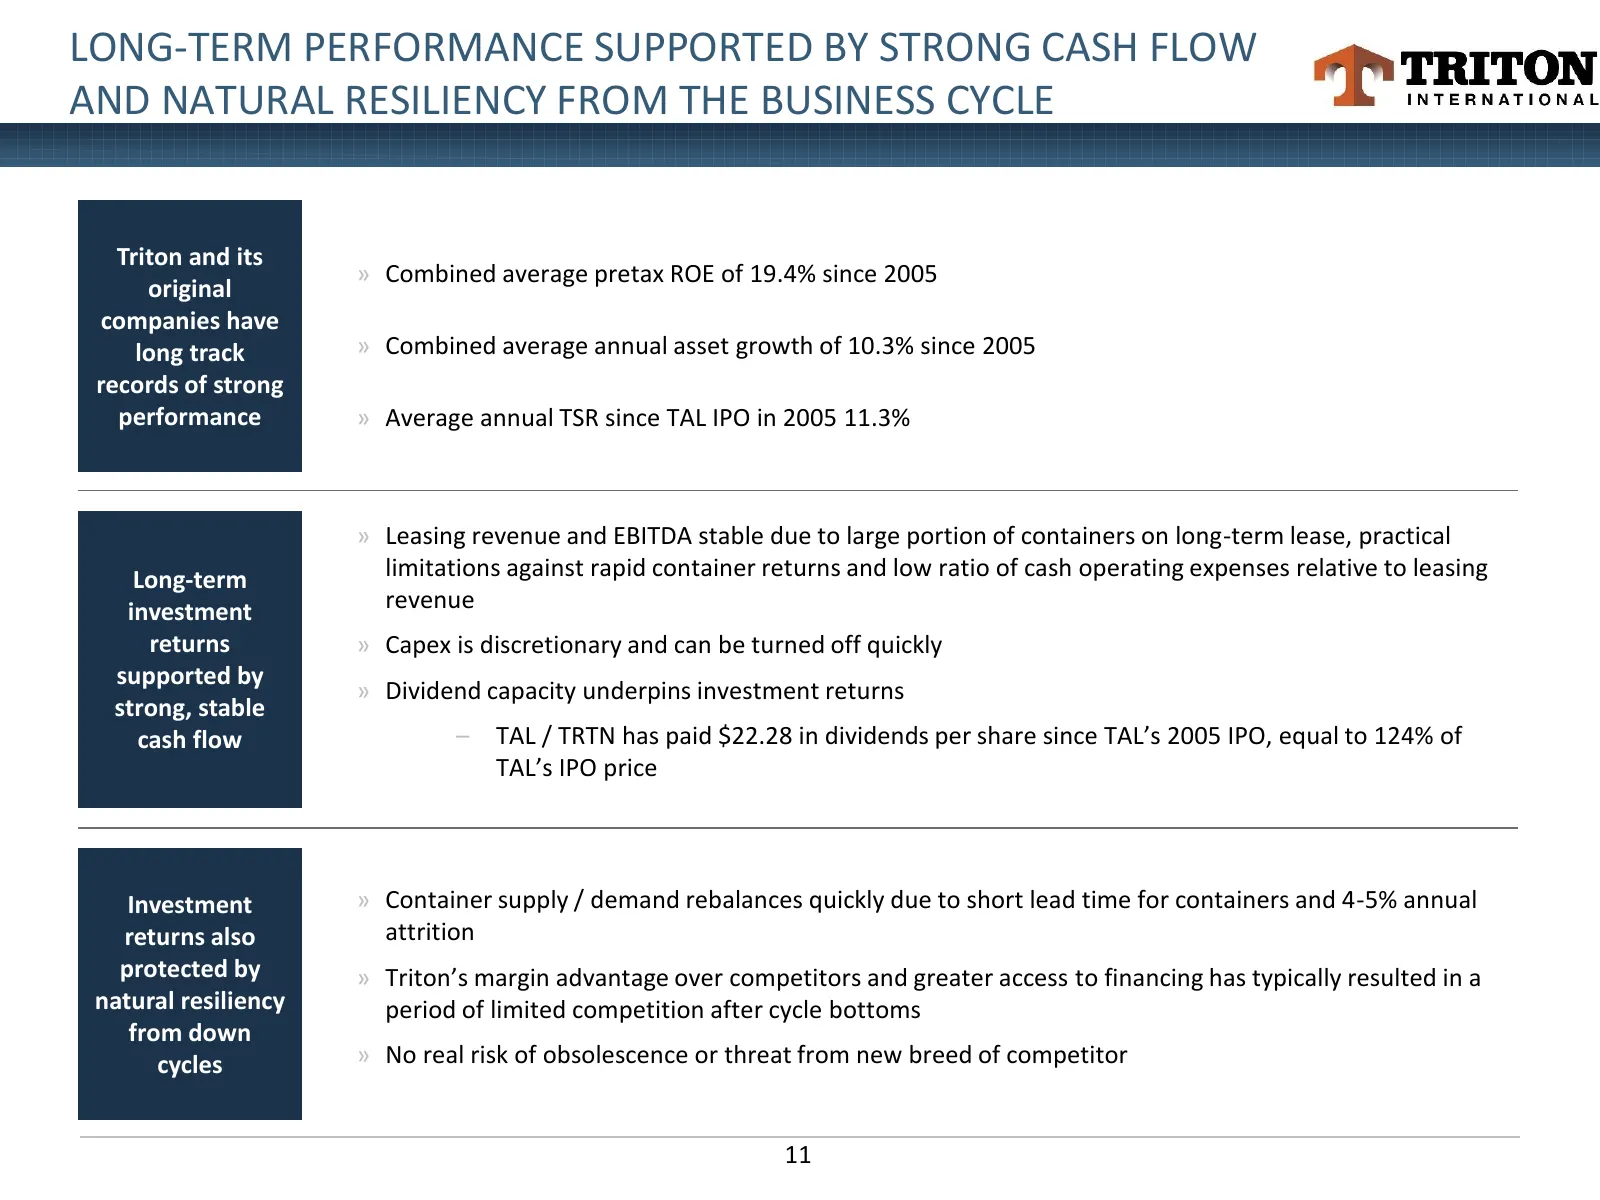
LONG-TERM PERFORMANCE SUPPORTED BY STRONG CASH FLOW AND NATURAL RESILIENCY FROM THE BUSINESS CYCLE Triton and its » Combined average pretax ROE of 19.4% since 2005 original companies have long track » Combined average annual asset growth of 10.3% since 2005 records of strong performance » Average an
Slide 12: Container Boxes vs. Other Leased Asset Classes
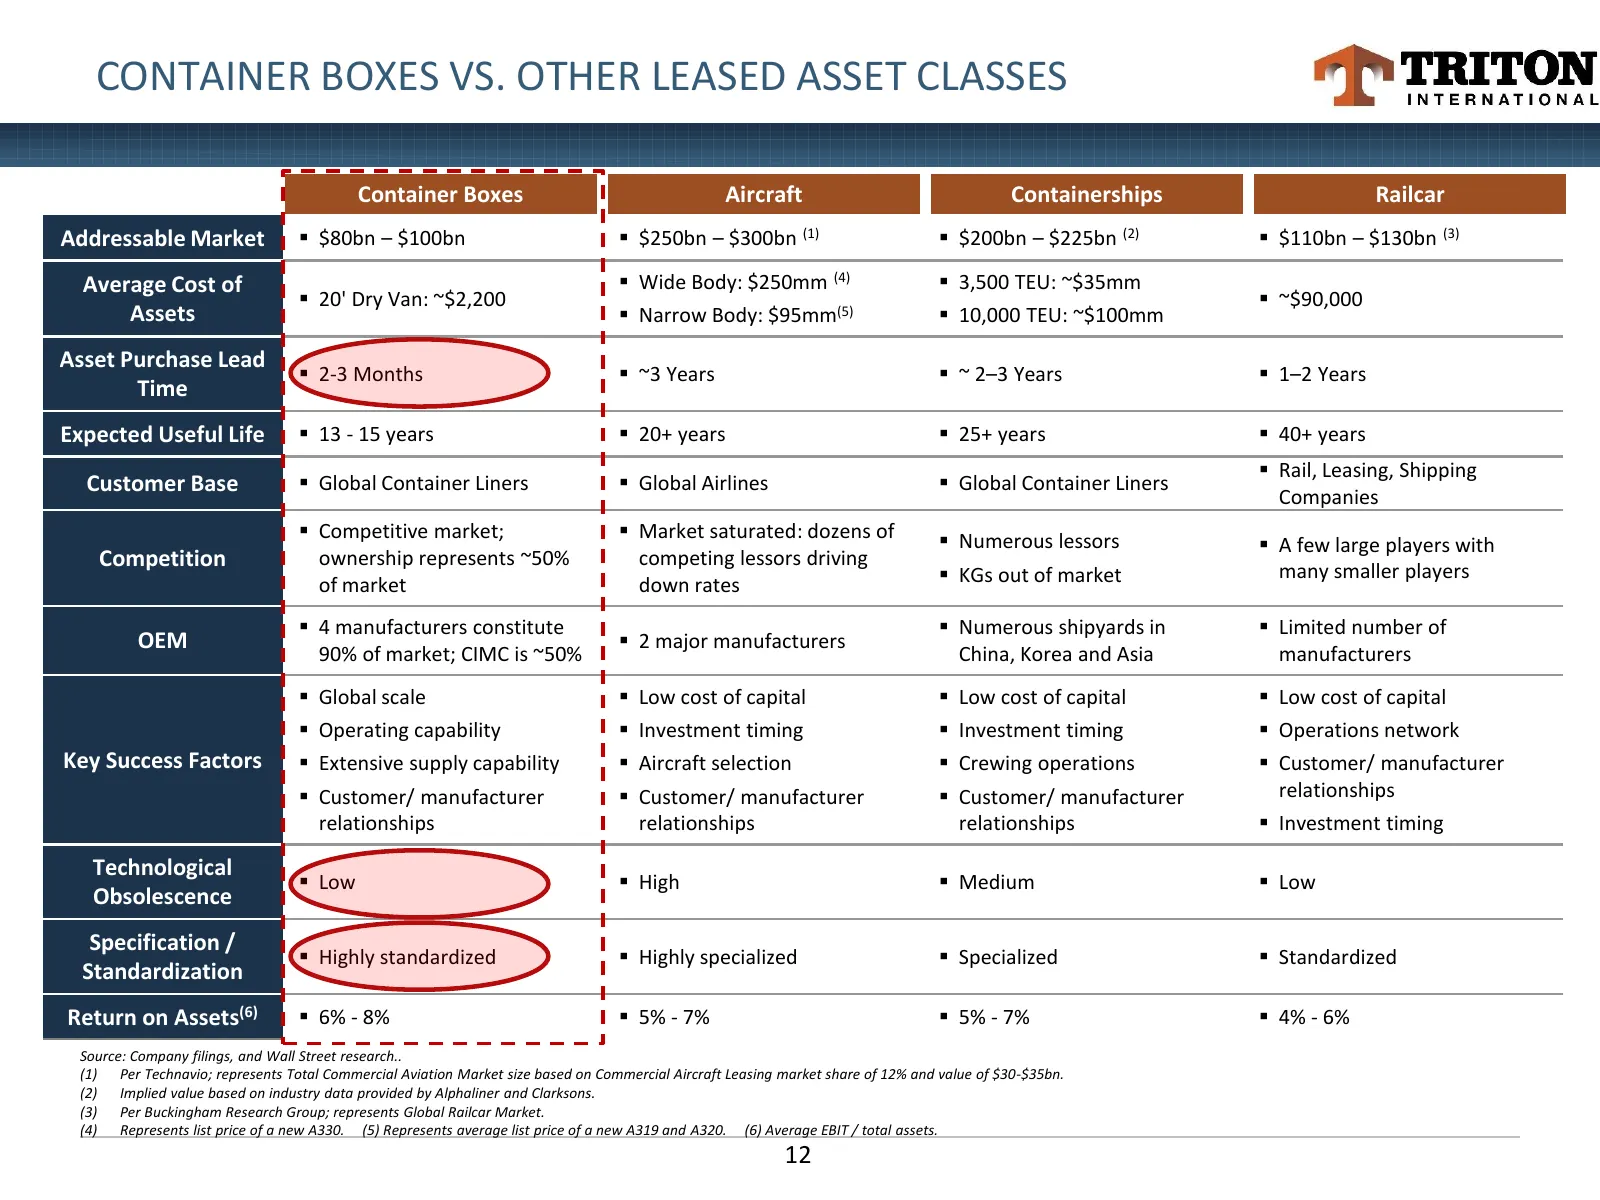
CONTAINER BOXES VS. OTHER LEASED ASSET CLASSES Container Boxes Aircraft Containerships Railcar Addressable Market $80bn – $100bn $250bn – $300bn (1) $200bn – $225bn (2) $110bn – $130bn (3) Average Cost of Wide Body: $250mm (4) 3,500 TEU: ~$35mm 20' Dry Van: ~$2,200 ~$90,000 Assets
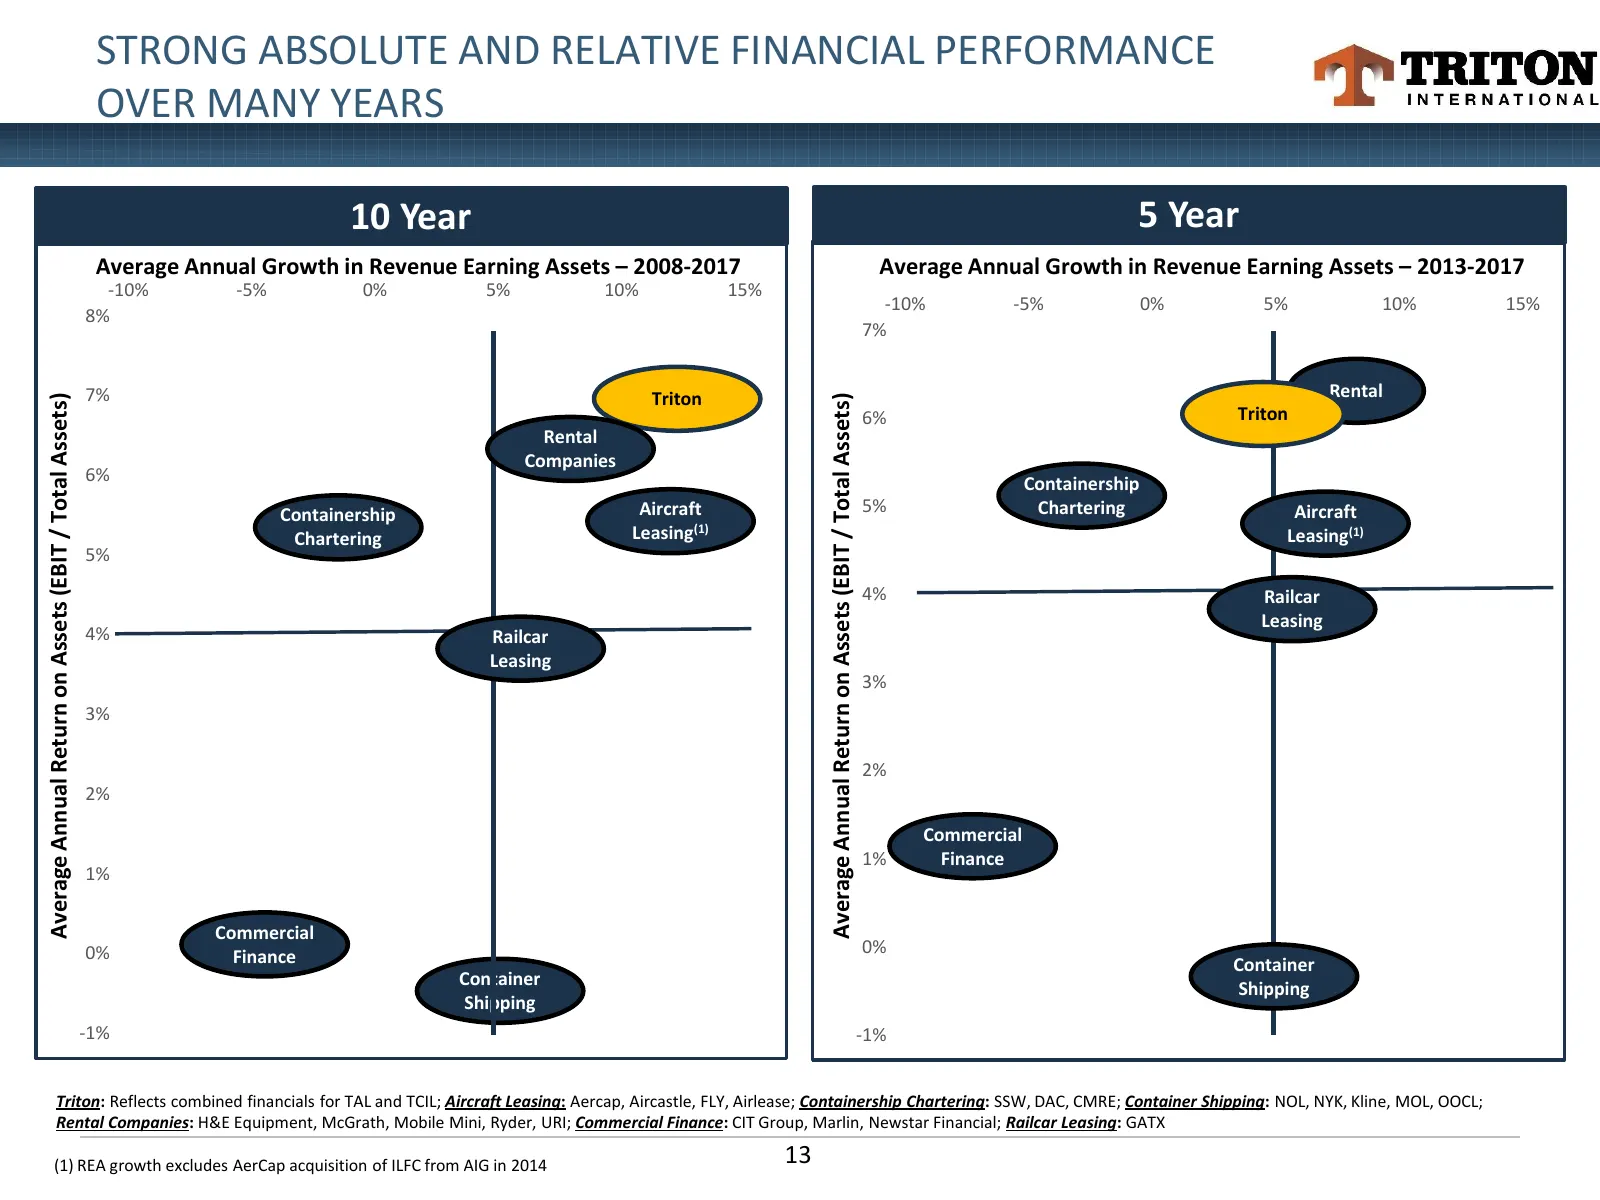
Slide 13: Strong Absolute and Relative Financial Performance Over Many Years
STRONG ABSOLUTE AND RELATIVE FINANCIAL PERFORMANCE OVER MANY YEARS 10 Year 5 Year Average Annual Growth in Revenue Earning Assets – 2008-2017 Average Annual Growth in Revenue Earning Assets – 2013-2017 -10% -5% 0% 5% 10% 15% -10% -5% 0% 5% 10% 15% 8% 7% 7% Triton Rental Average Annual Return on Asse
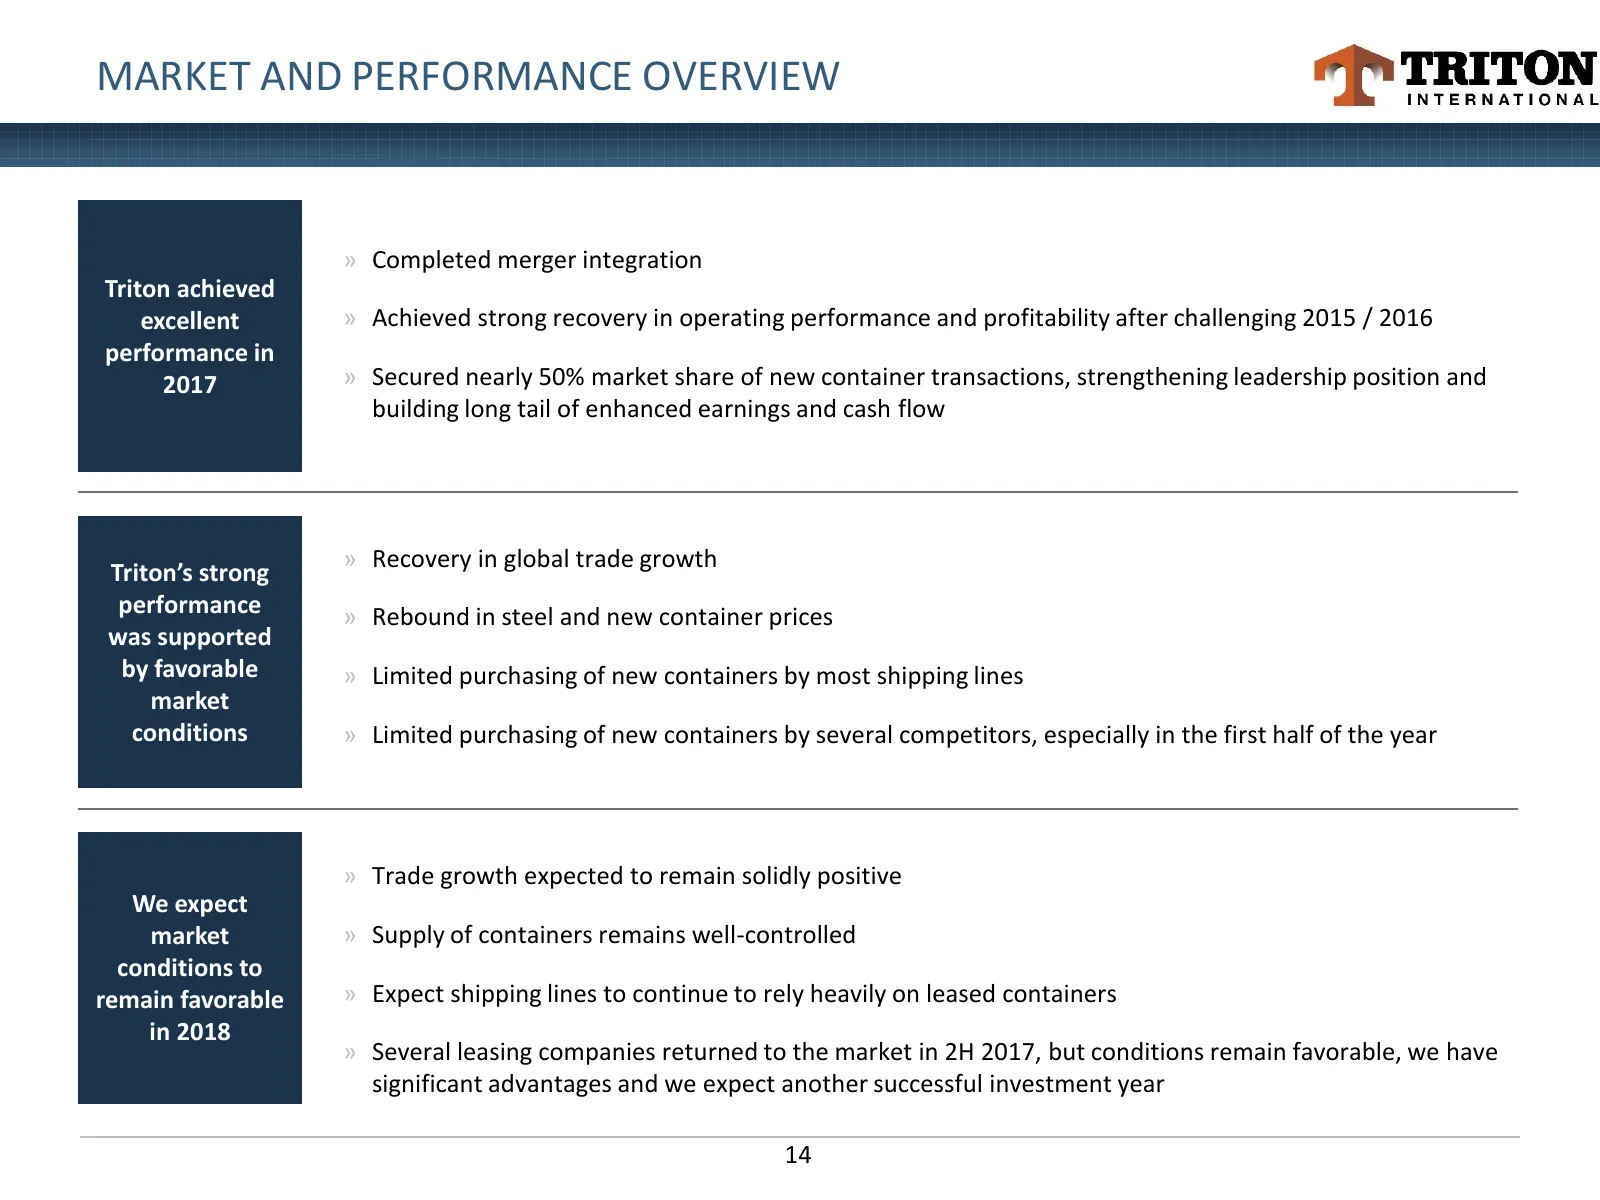
Slide 14: Market and Performance Overview
MARKET AND PERFORMANCE OVERVIEW » Completed merger integration Triton achieved excellent » Achieved strong recovery in operating performance and profitability after challenging 2015 / 2016 performance in 2017 » Secured nearly 50% market share of new container transactions, strengthening leadership p
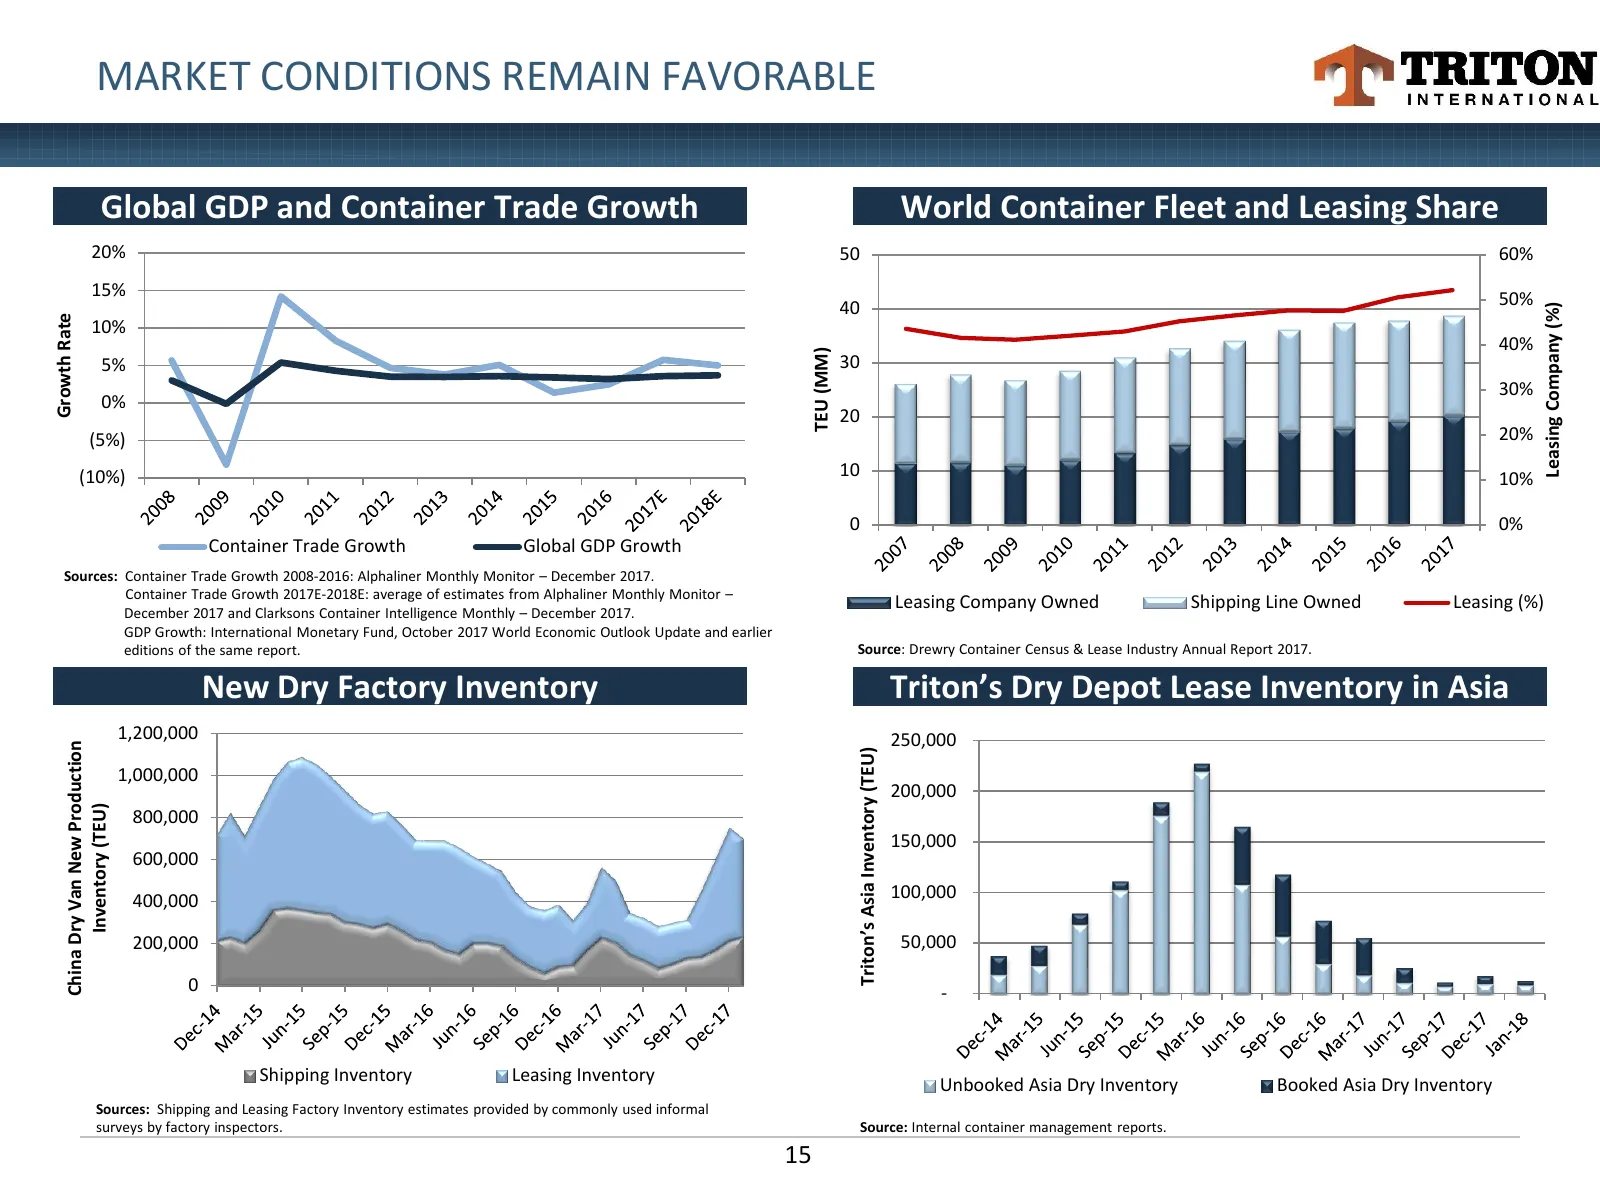
Slide 15: Market Conditions Remain Favorable
MARKET CONDITIONS REMAIN FAVORABLE Global GDP and Container Trade Growth World Container Fleet and Leasing Share 20% 50 60% 15% 50% 40 Leasing Company (%) Growth Rate 10% 40% TEU (MM) 5% 30 30% 0% 20 (5%) 20% (10%) 10 10% 0 0% Container Trade Growth Global GDP Growth Sources: Container Trade Growth
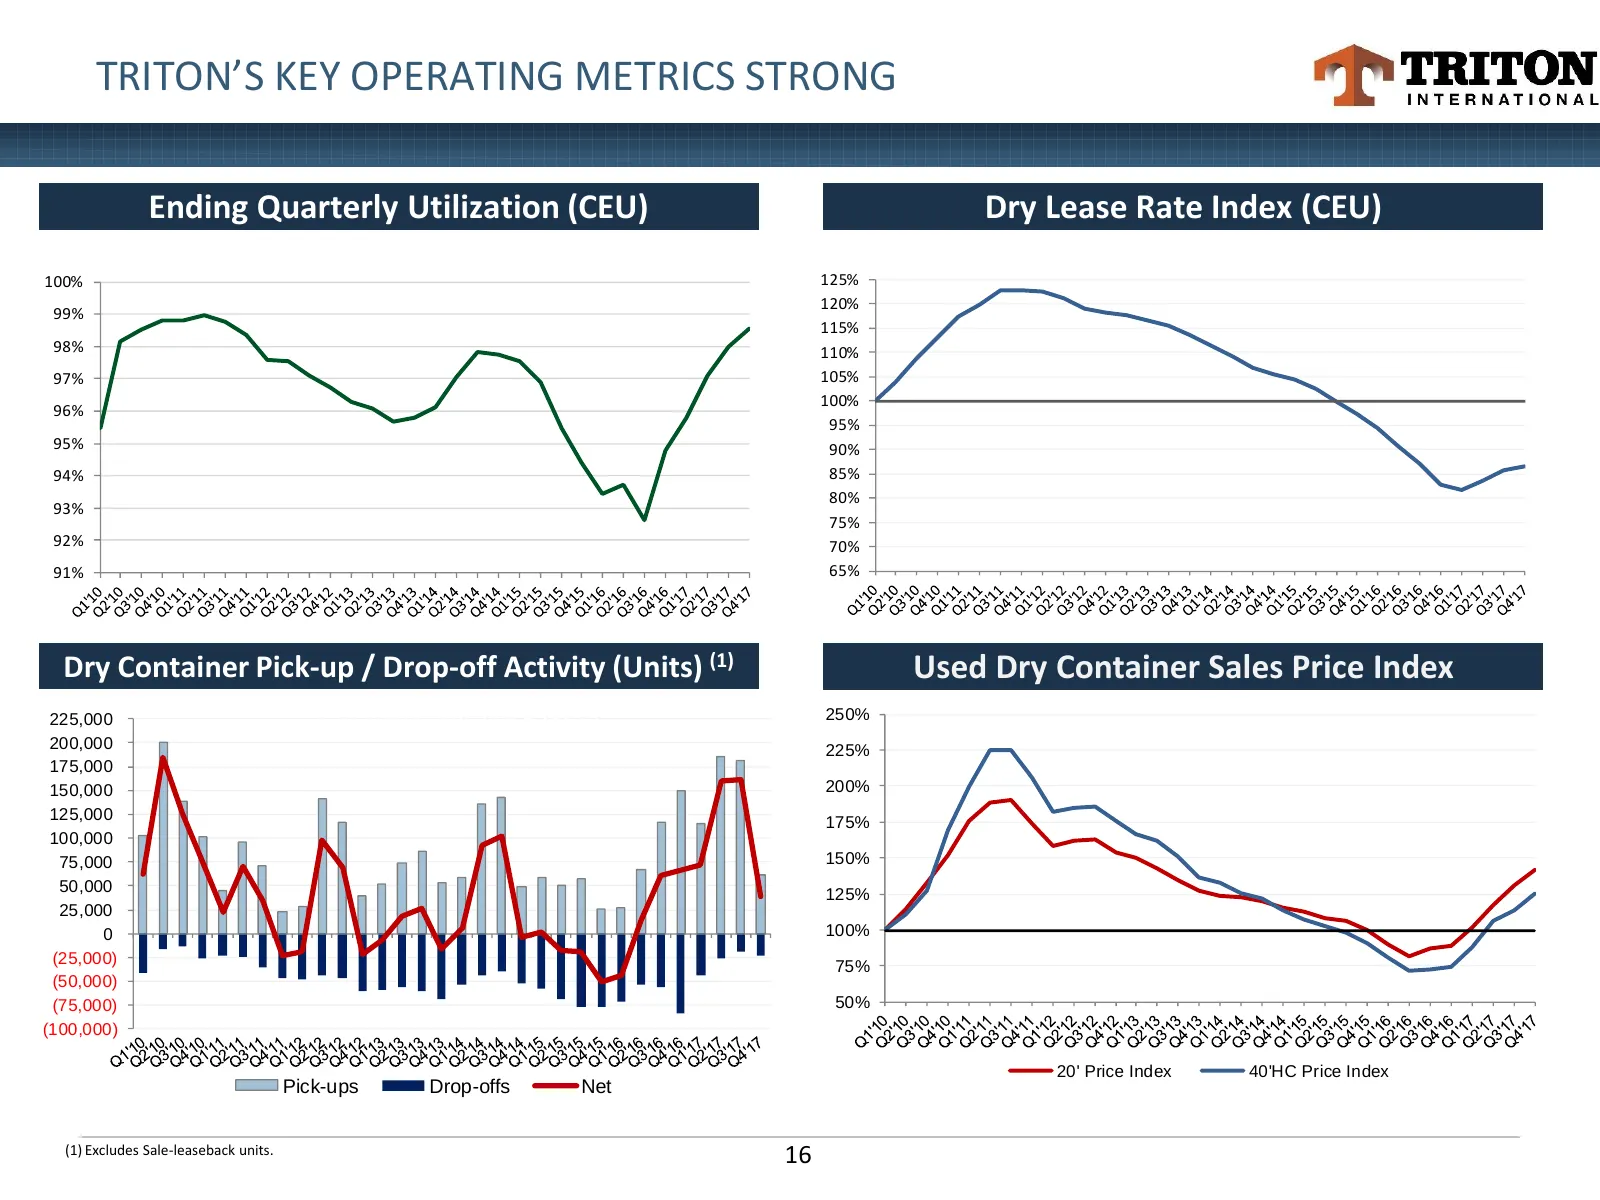
Slide 16: Triton's Key Operating Metrics Strong
TRITON’S KEY OPERATING METRICS STRONG Ending Quarterly Utilization (CEU) Dry Lease Rate Index (CEU) Ending Quarterly Utilization (CEU) Overall Lease Rate Index (CEU) 100% 125% 120% 99% 115% 98% 110% 97% 105% 100% 96% 95% 95% 90% 94% 85% 80% 93% 75% 92% 70% 91% 65% Dry Container Pick-up / Drop-off Ac
Slide 17: Triton's Earnings Base Enhanced by Recent High Value Leases
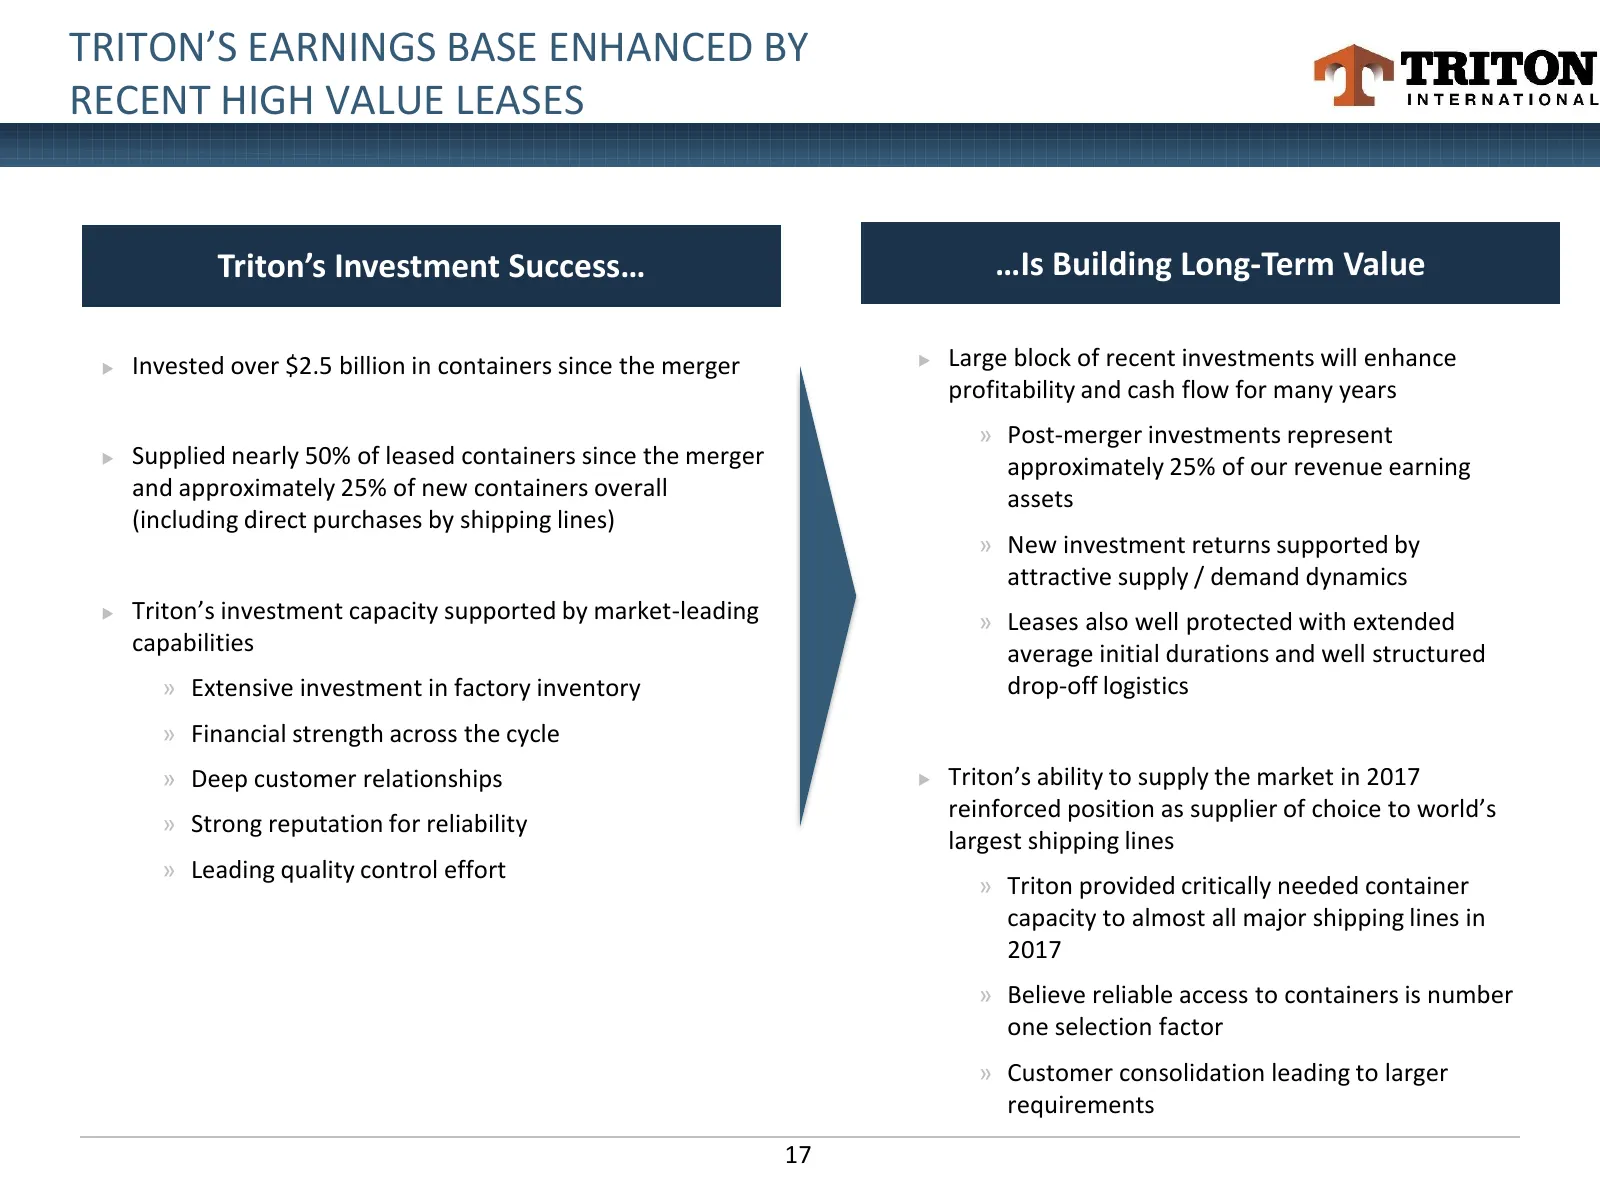
TRITON’S EARNINGS BASE ENHANCED BY RECENT HIGH VALUE LEASES Triton’s Investment Success… …Is Building Long-Term Value Invested over $2.5 billion in containers since the merger Large block of recent investments will enhance profitability and cash flow for many years » Post-merger investments repr
Slide 18: Triton's Financial Performance Back on Track
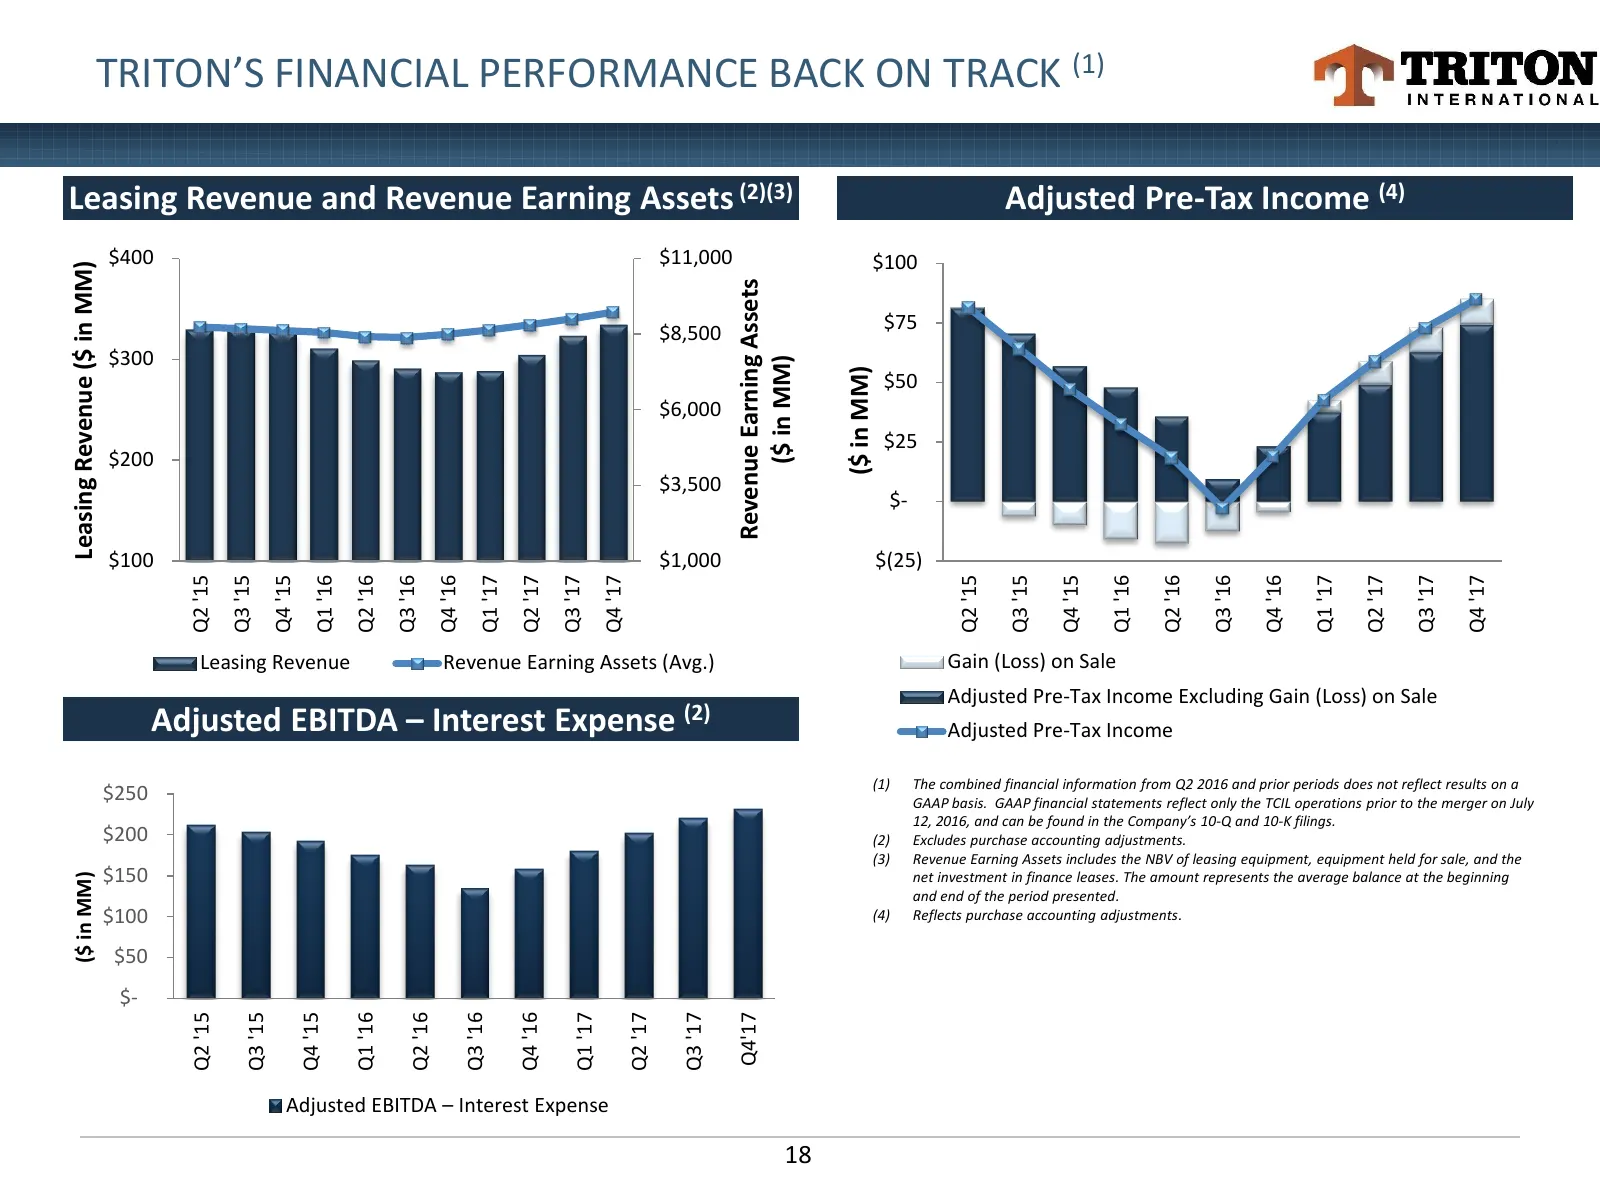
TRITON’S FINANCIAL PERFORMANCE BACK ON TRACK (1) Leasing Revenue and Revenue Earning Assets (2)(3) Adjusted Pre-Tax Income (4) $400 $11,000 $100 Leasing Revenue ($ in MM) Revenue Earning Assets $75 $8,500 $300 ($ in MM) ($ in MM) $50 $6,000 $25 $200 $3,500 $- $100 $1,000 $(25) Q2 '15 Q3 '15 Q4 '15 Q
Slide 19: Equity Cash Flow Analysis
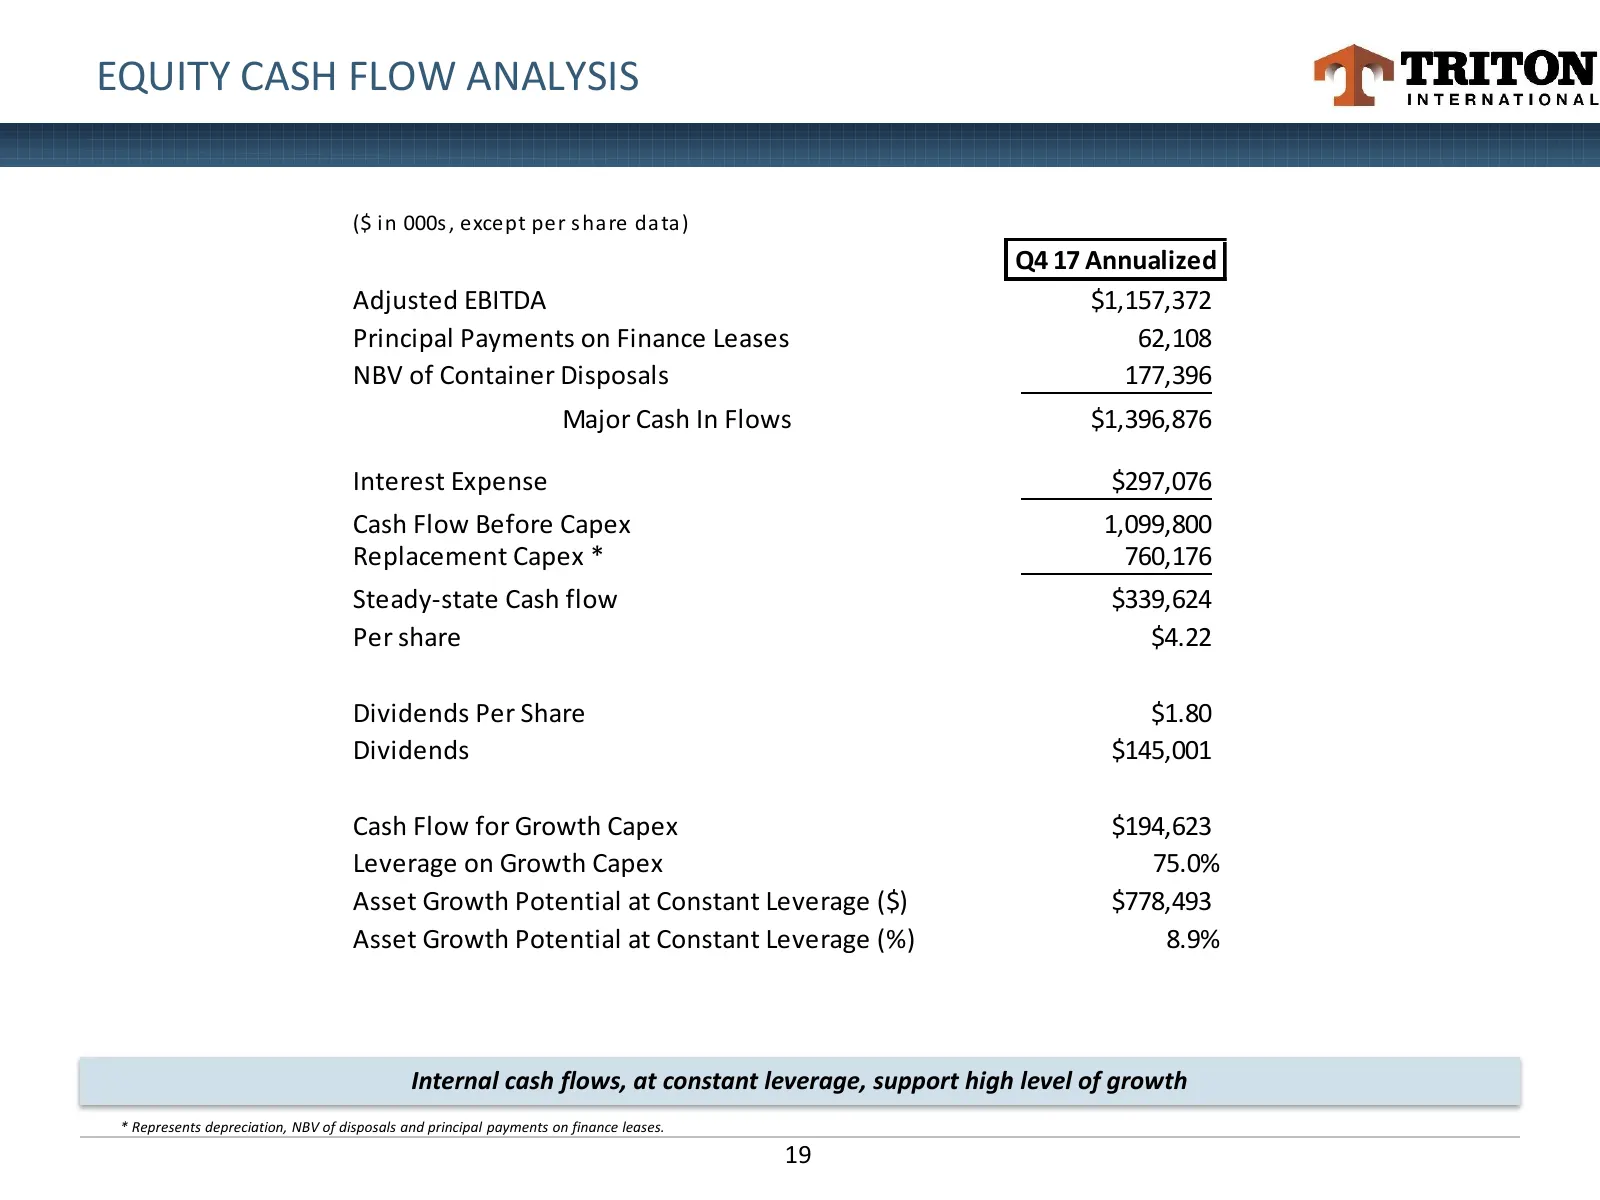
EQUITY CASH FLOW ANALYSIS ($ i n 000s , except per s ha re da ta) Q4 17 Annualized Adjusted EBITDA $1,157,372 Principal Payments on Finance Leases 62,108 NBV of Container Disposals 177,396 Major Cash In Flows $1,396,876 Interest Expense $297,076 Cash Flow Before Capex 1,099,800 Replacement Capex * 7
Slide 20: Stable Cash Flow Generation Underpins Long-Term Value
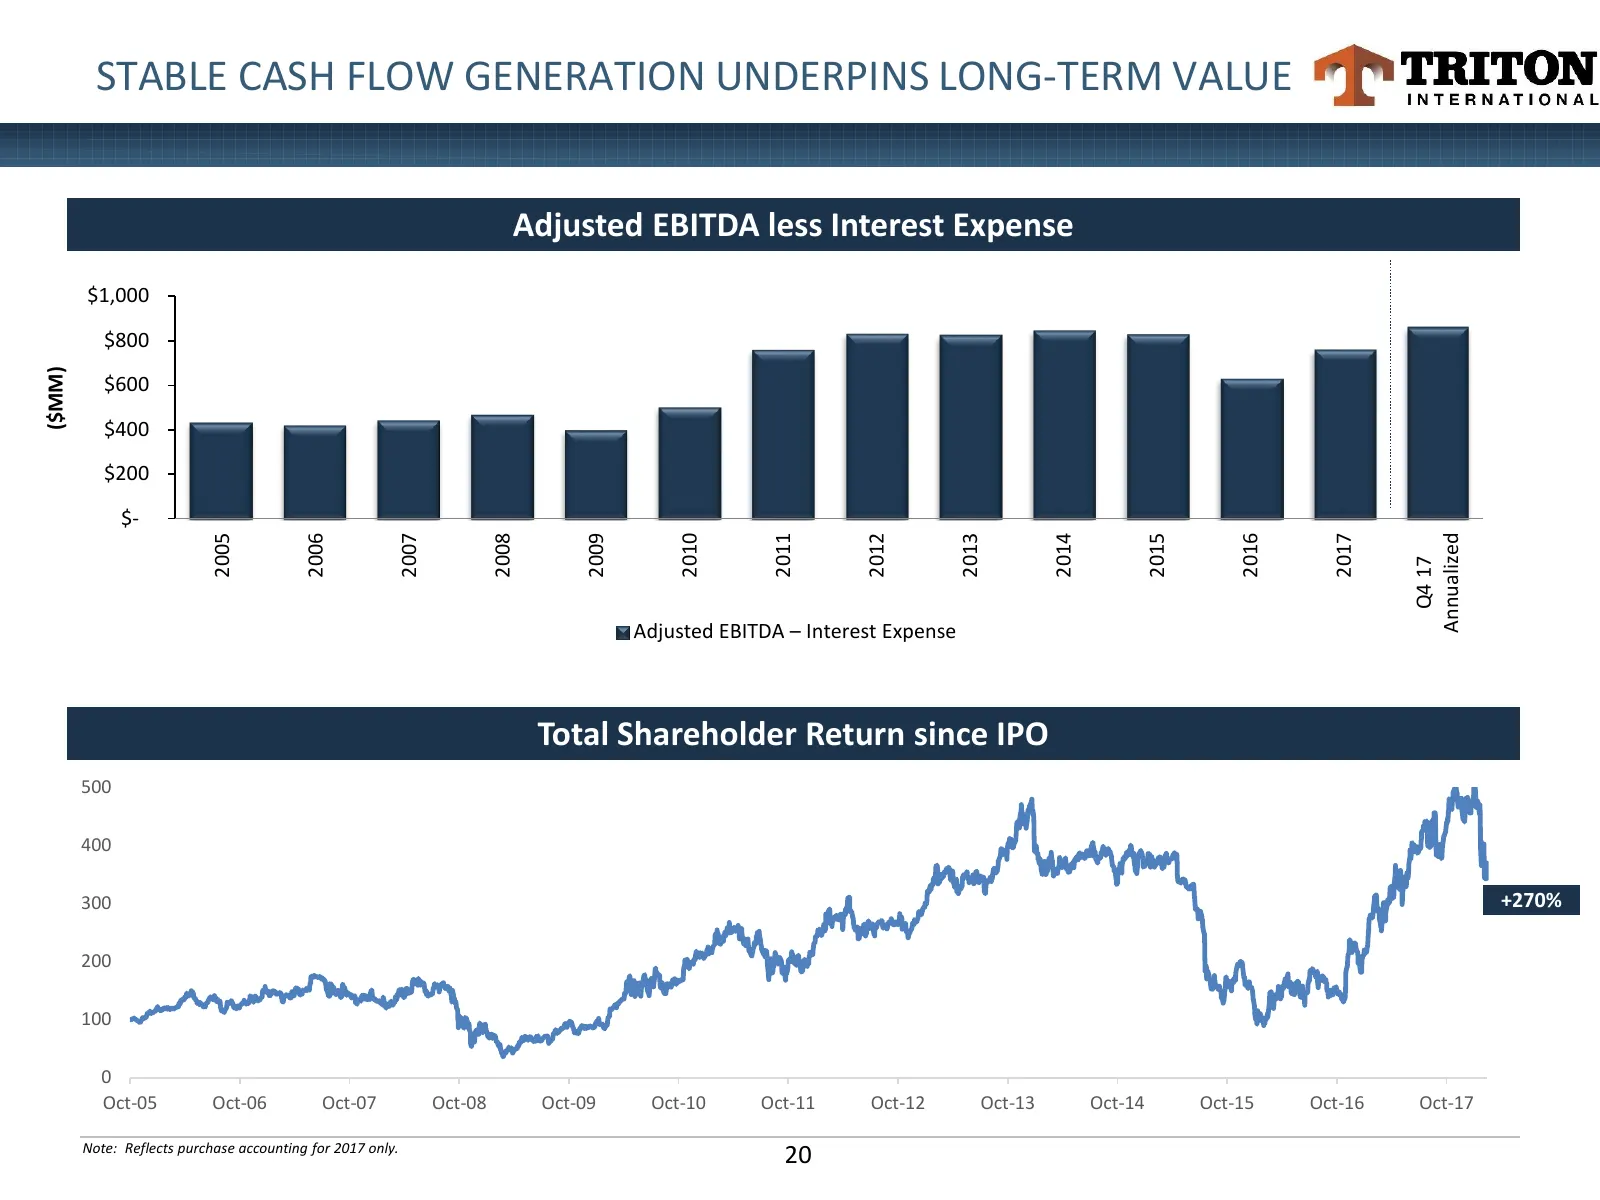
STABLE CASH FLOW GENERATION UNDERPINS LONG-TERM VALUE Adjusted EBITDA less Interest Expense $1,000 $800 ($MM) $600 $400 $200 $- 2010 2005 2006 2007 2008 2009 2011 2012 2013 2014 2015 2016 2017 Annualized Q4 17 Adjusted EBITDA – Interest Expense Total Shareholder Return since IPO 500 400 300 +270% 20
Slide 21: Strong, Stable Cash Flow and Short Order Cycle Provide Flexibility
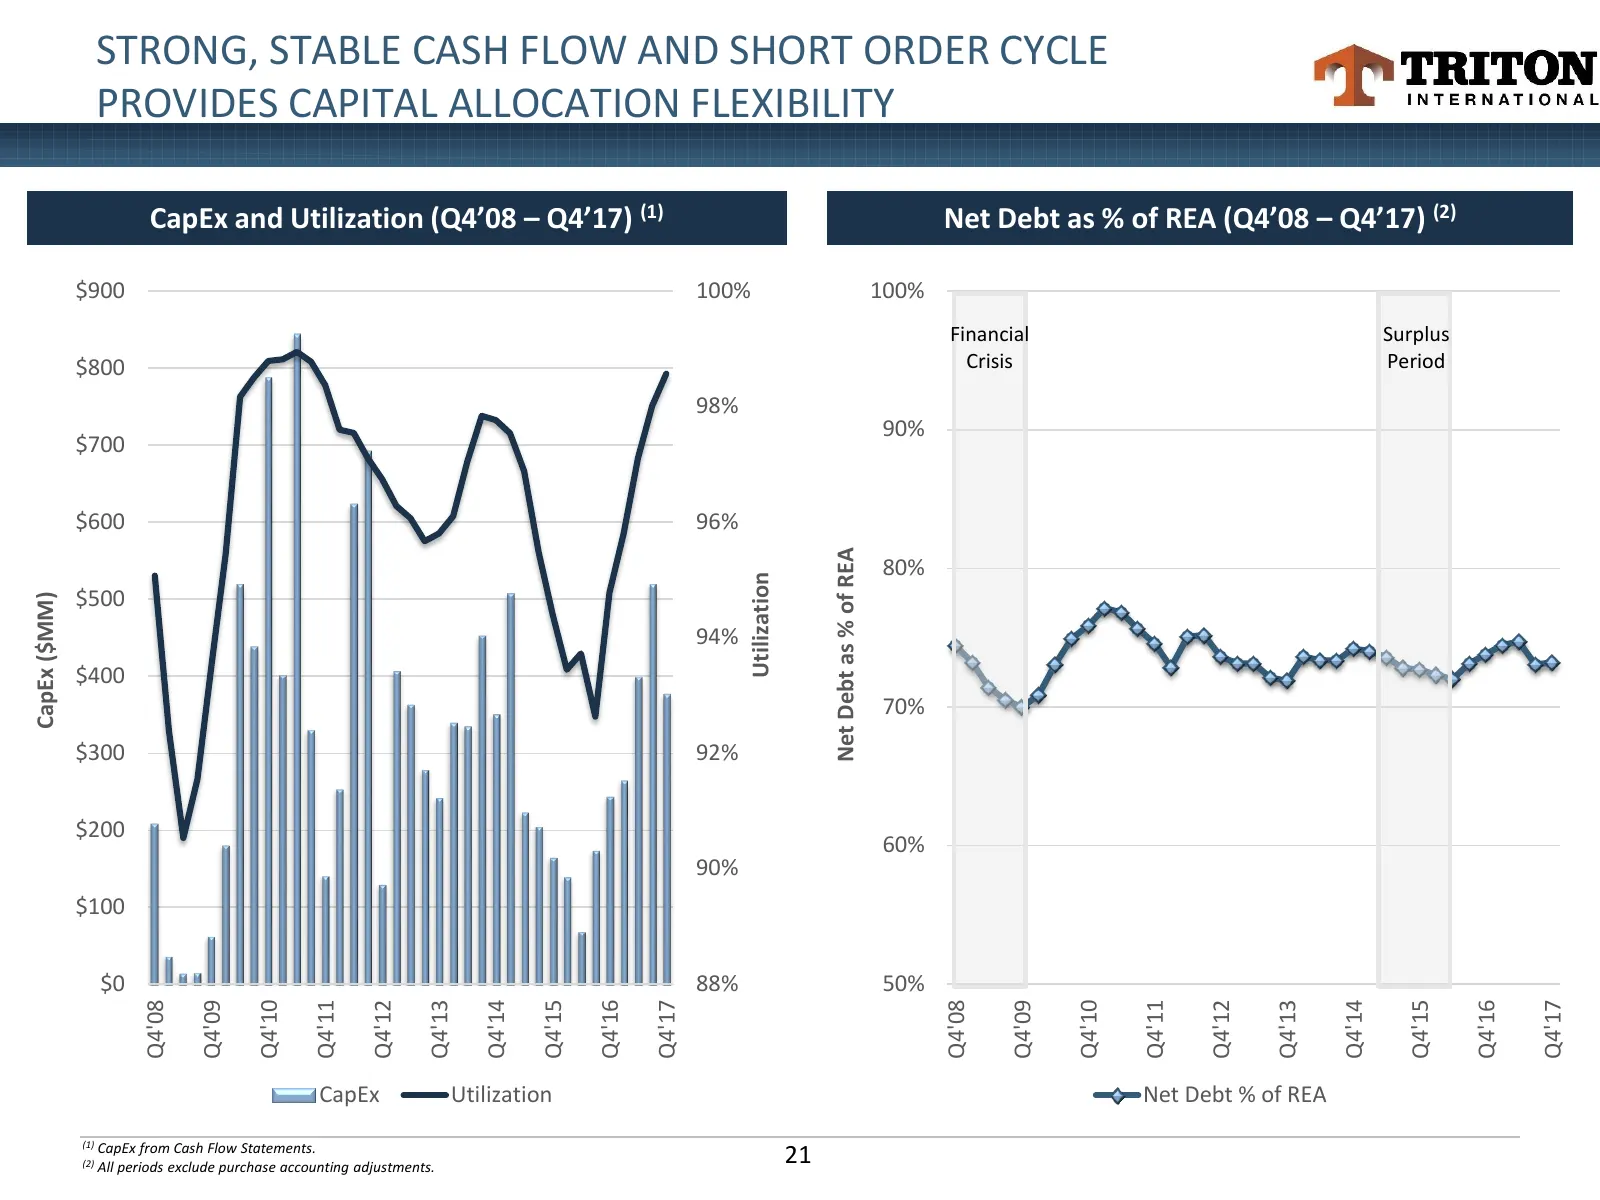
STRONG, STABLE CASH FLOW AND SHORT ORDER CYCLE PROVIDES CAPITAL ALLOCATION FLEXIBILITY CapEx and Utilization (Q4’08 – Q4’17) (1) Net Debt as % of REA (Q4’08 – Q4’17) (2) $900 100% 100% Financial Surplus $800 Crisis Period 98% 90% $700 $600 96% Net Debt as % of REA 80% Utilization $500 CapEx ($MM) 94
Slide 22: Well Structured Balance Sheet
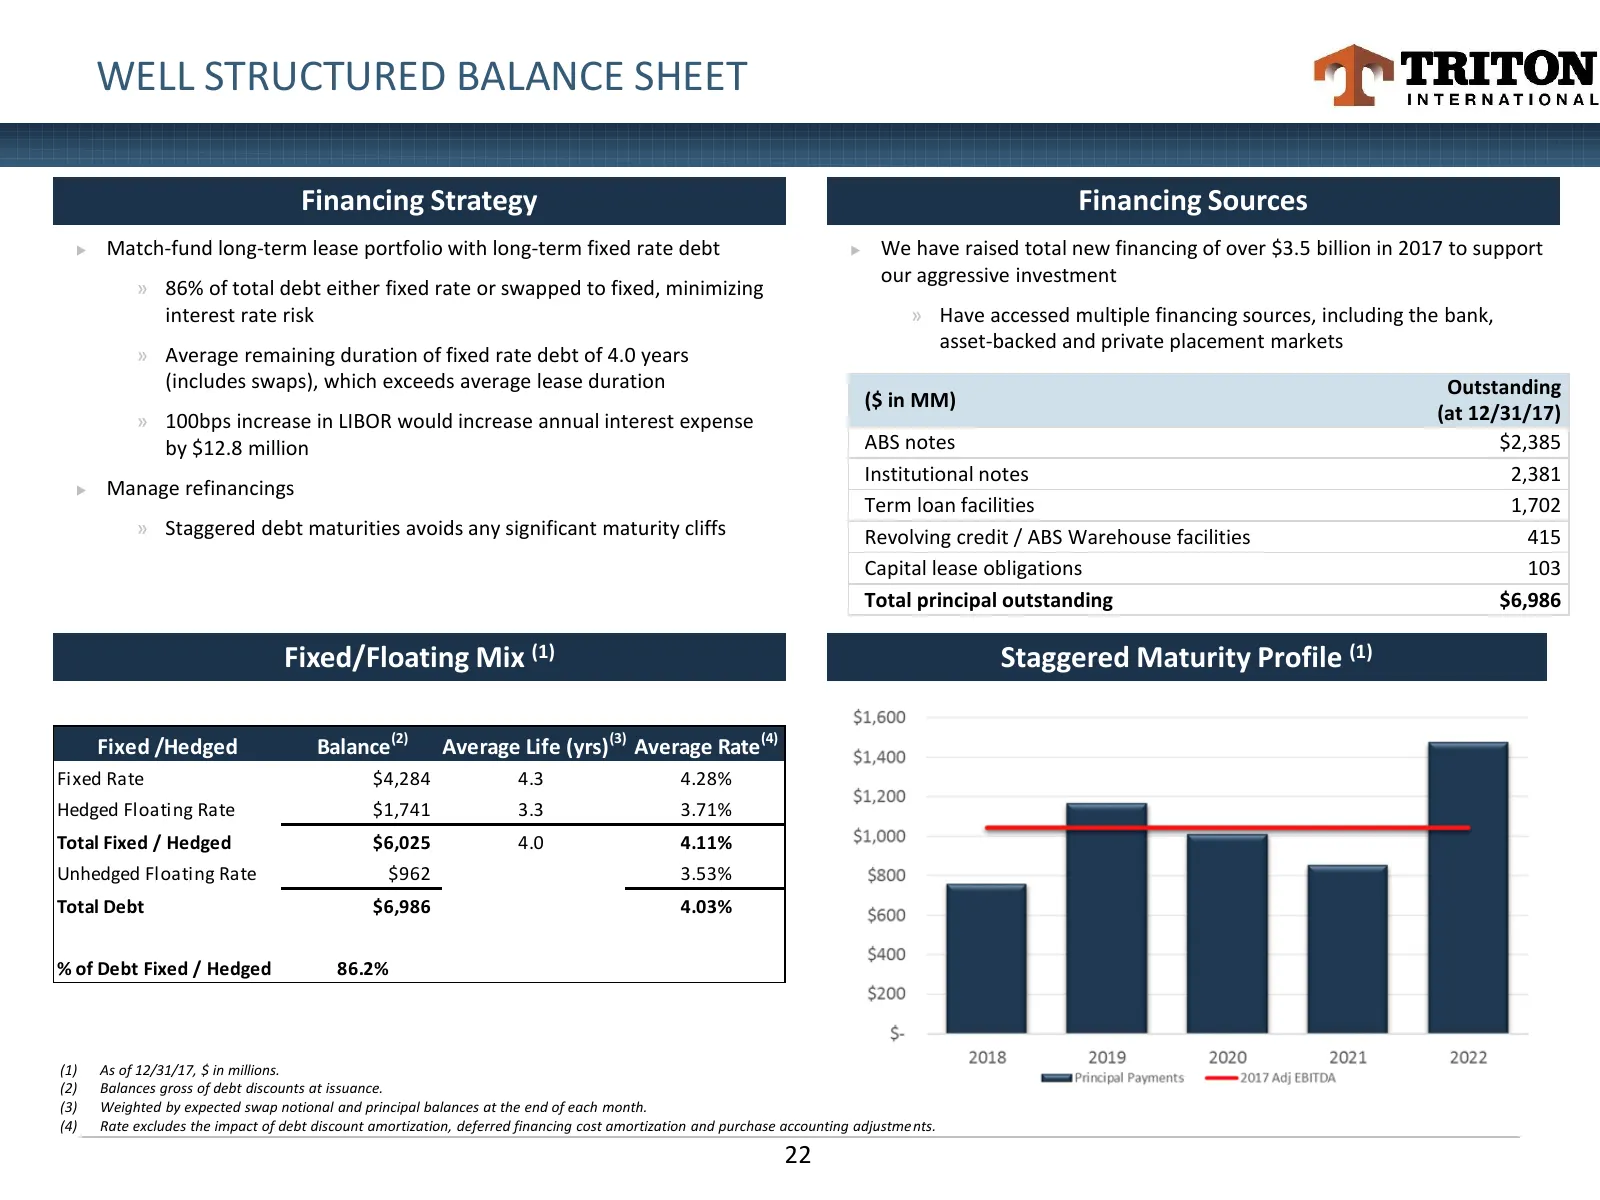
WELL STRUCTURED BALANCE SHEET Financing Strategy Financing Sources Match-fund long-term lease portfolio with long-term fixed rate debt We have raised total new financing of over $3.5 billion in 2017 to support our aggressive investment » 86% of total debt either fixed rate or swapped to fixed, m
Slide 23: Conclusions
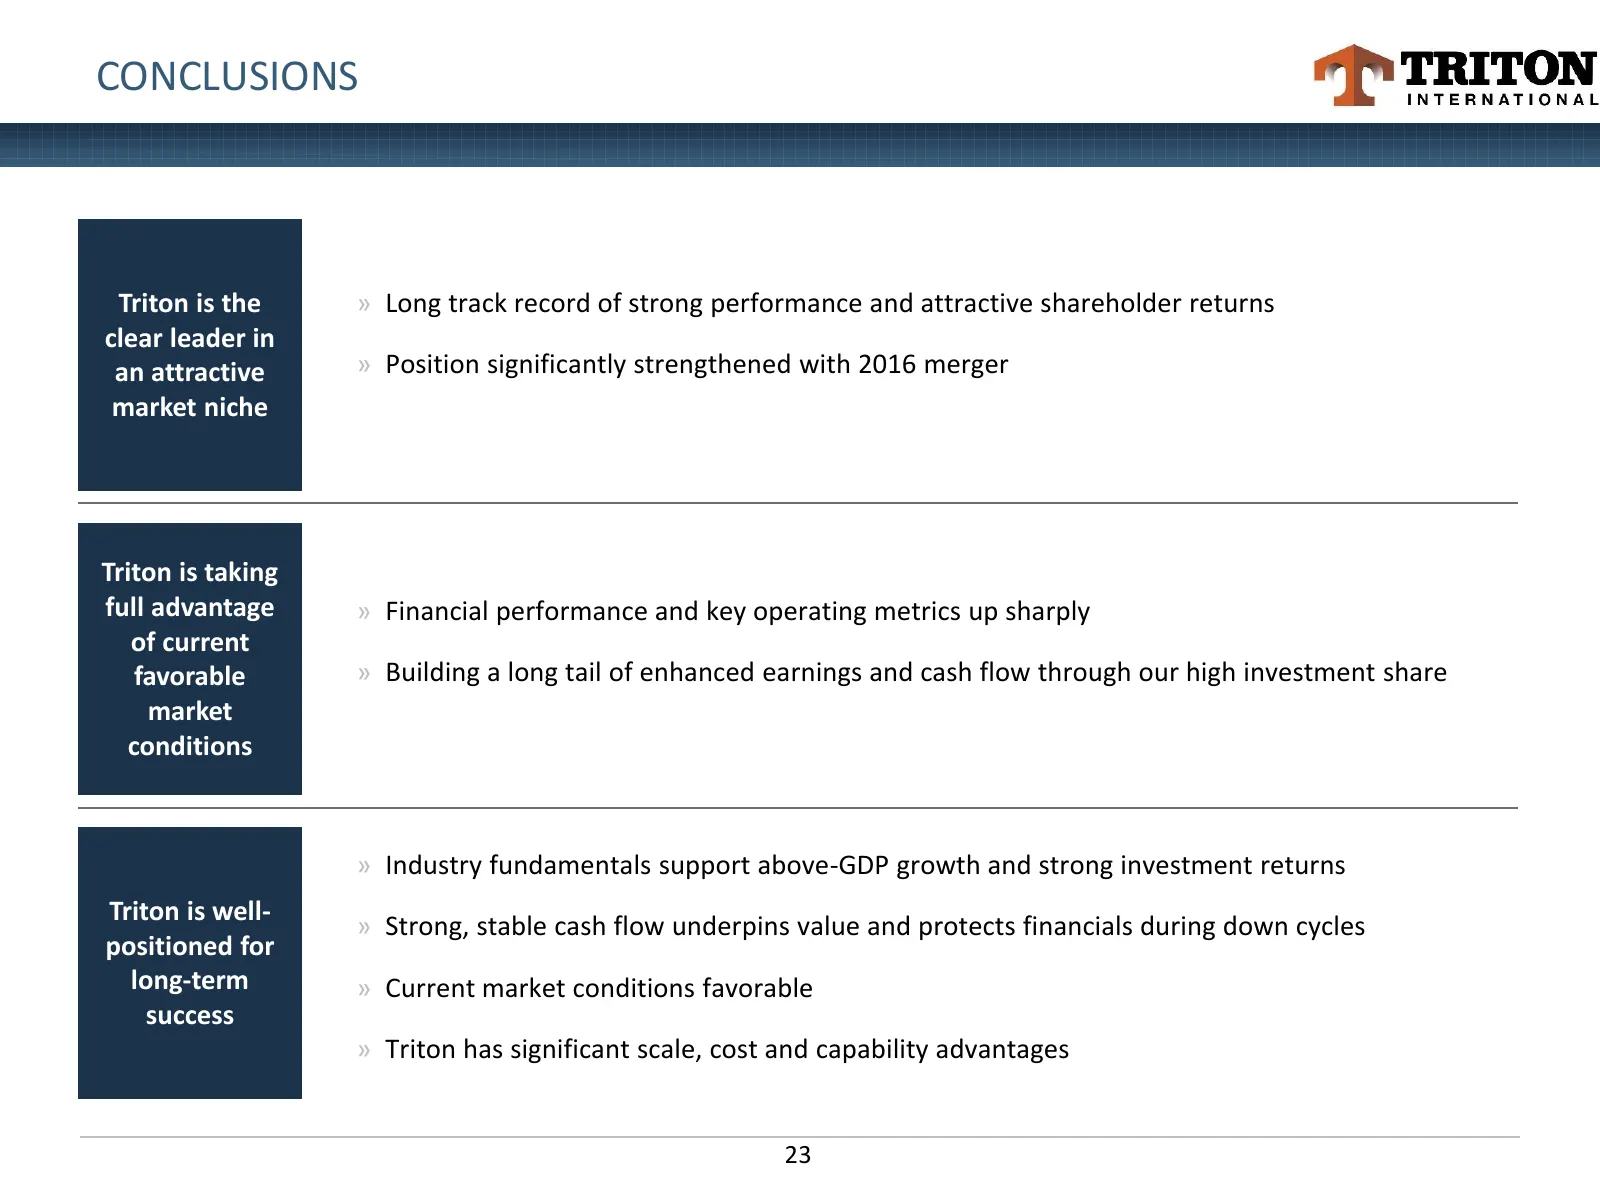
CONCLUSIONS Triton is the » Long track record of strong performance and attractive shareholder returns clear leader in an attractive » Position significantly strengthened with 2016 merger market niche Triton is taking full advantage » Financial performance and key operating metrics up sharply of cur
Slide 24: Appendix
Appendix w TRITON INTERNATIONAL
Slide 25: Container Leasing Overview
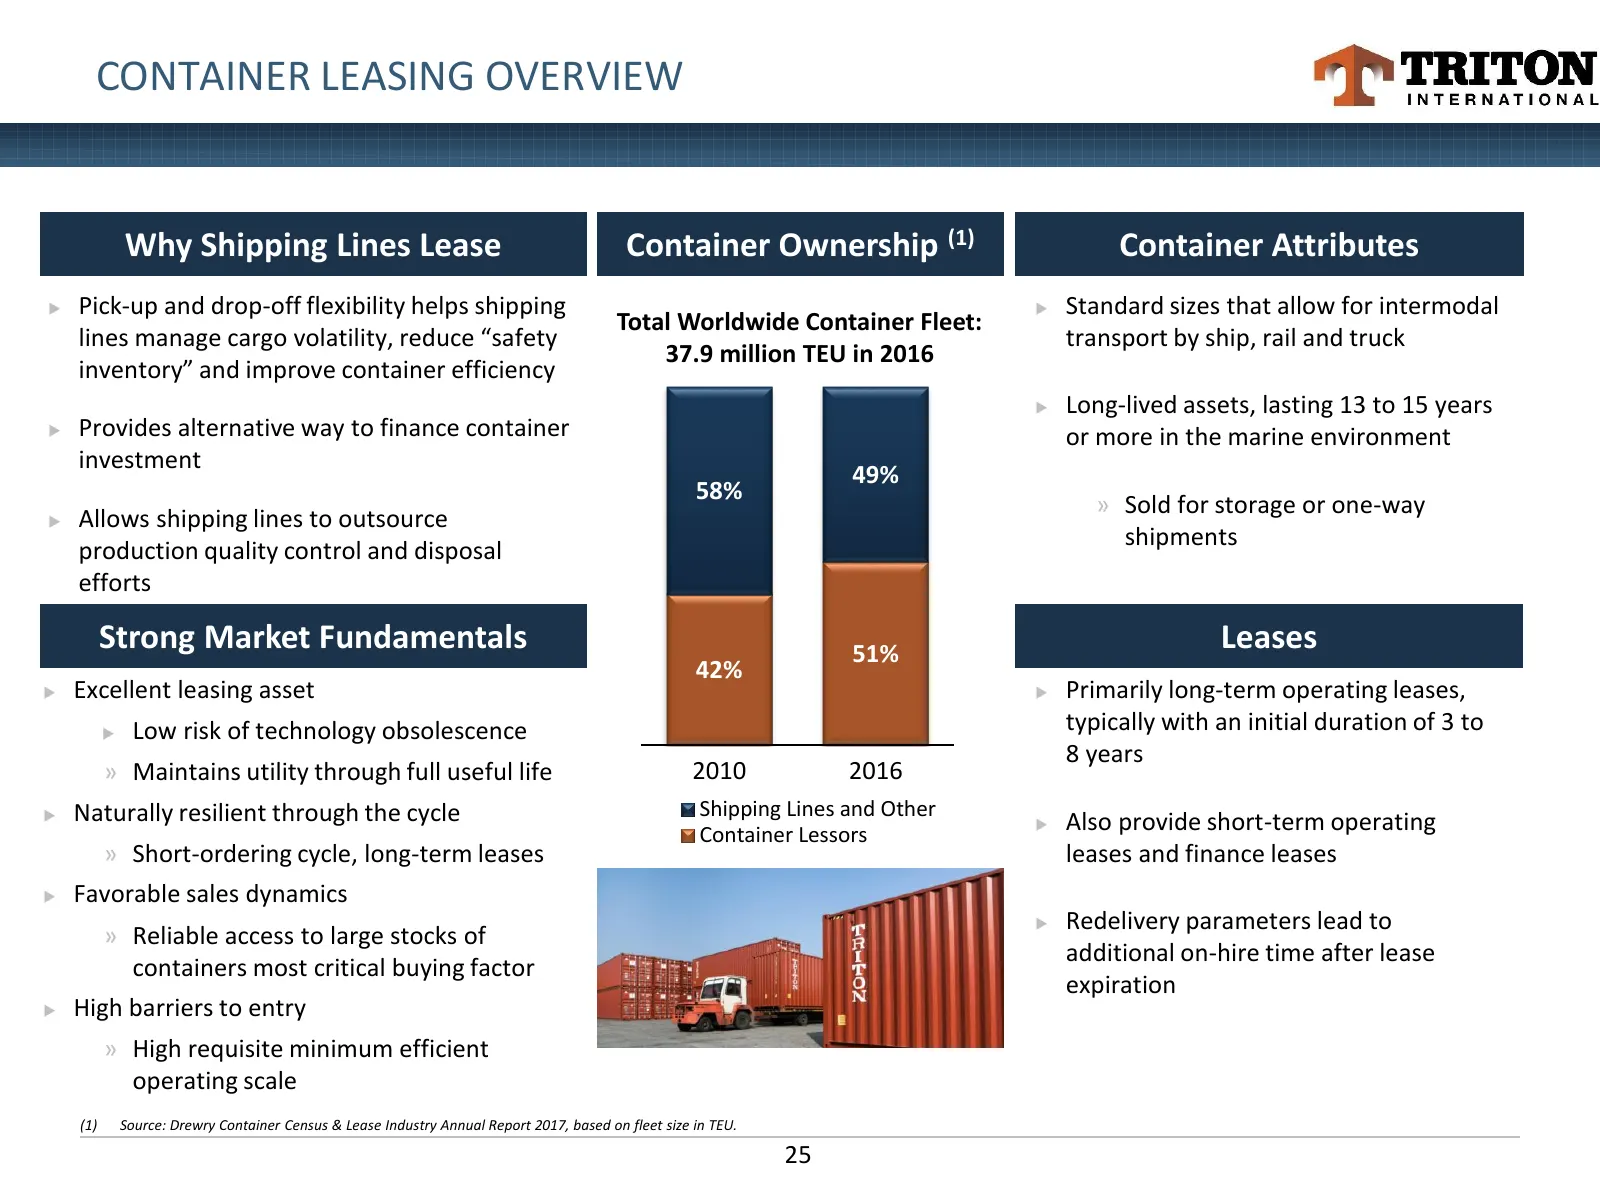
CONTAINER LEASING OVERVIEW Why Shipping Lines Lease Container Ownership (1) Container Attributes Pick-up and drop-off flexibility helps shipping Standard sizes that allow for intermodal Total Worldwide Container Fleet: lines manage cargo volatility, reduce “safety transport by ship, rail and tru
Slide 26: Consolidated Statements of Adjusted Net Income
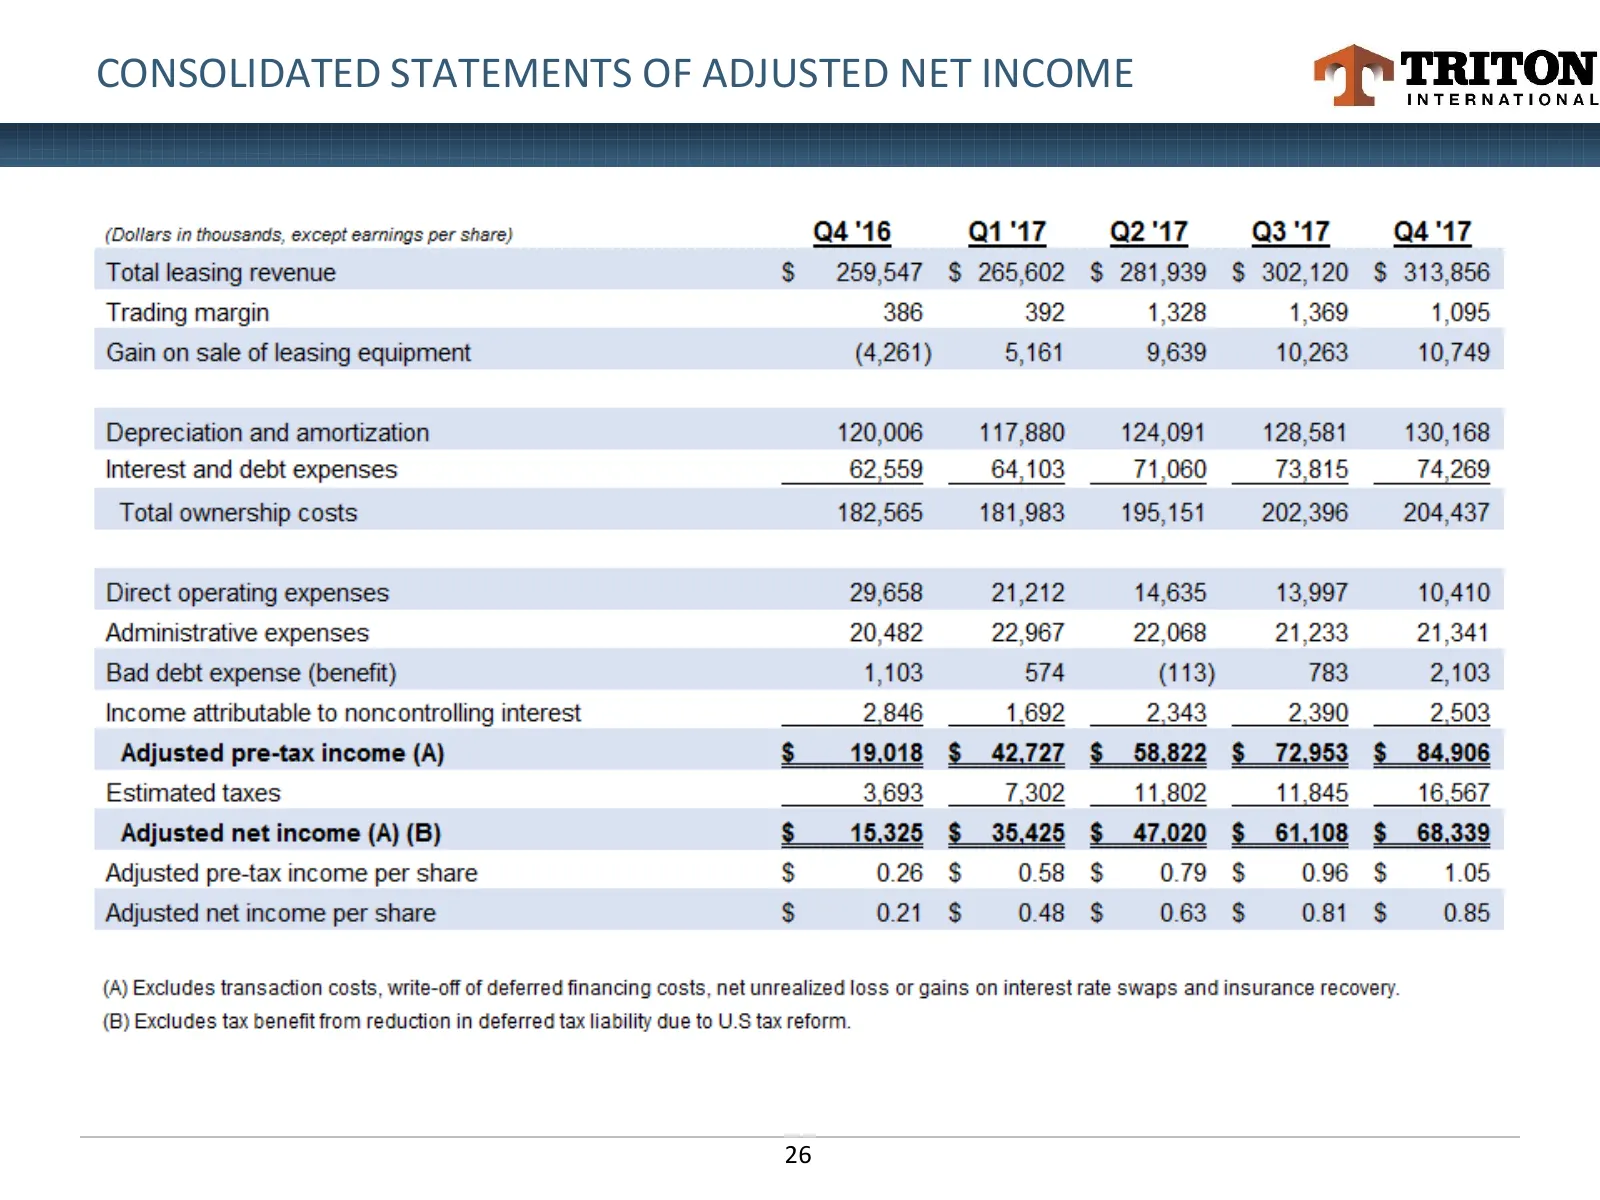
CONSOLIDATED STATEMENTS OF ADJUSTED NET INCOME 26
Slide 27: Consolidated Balance Sheet Still Impacted by Purchase Accounting
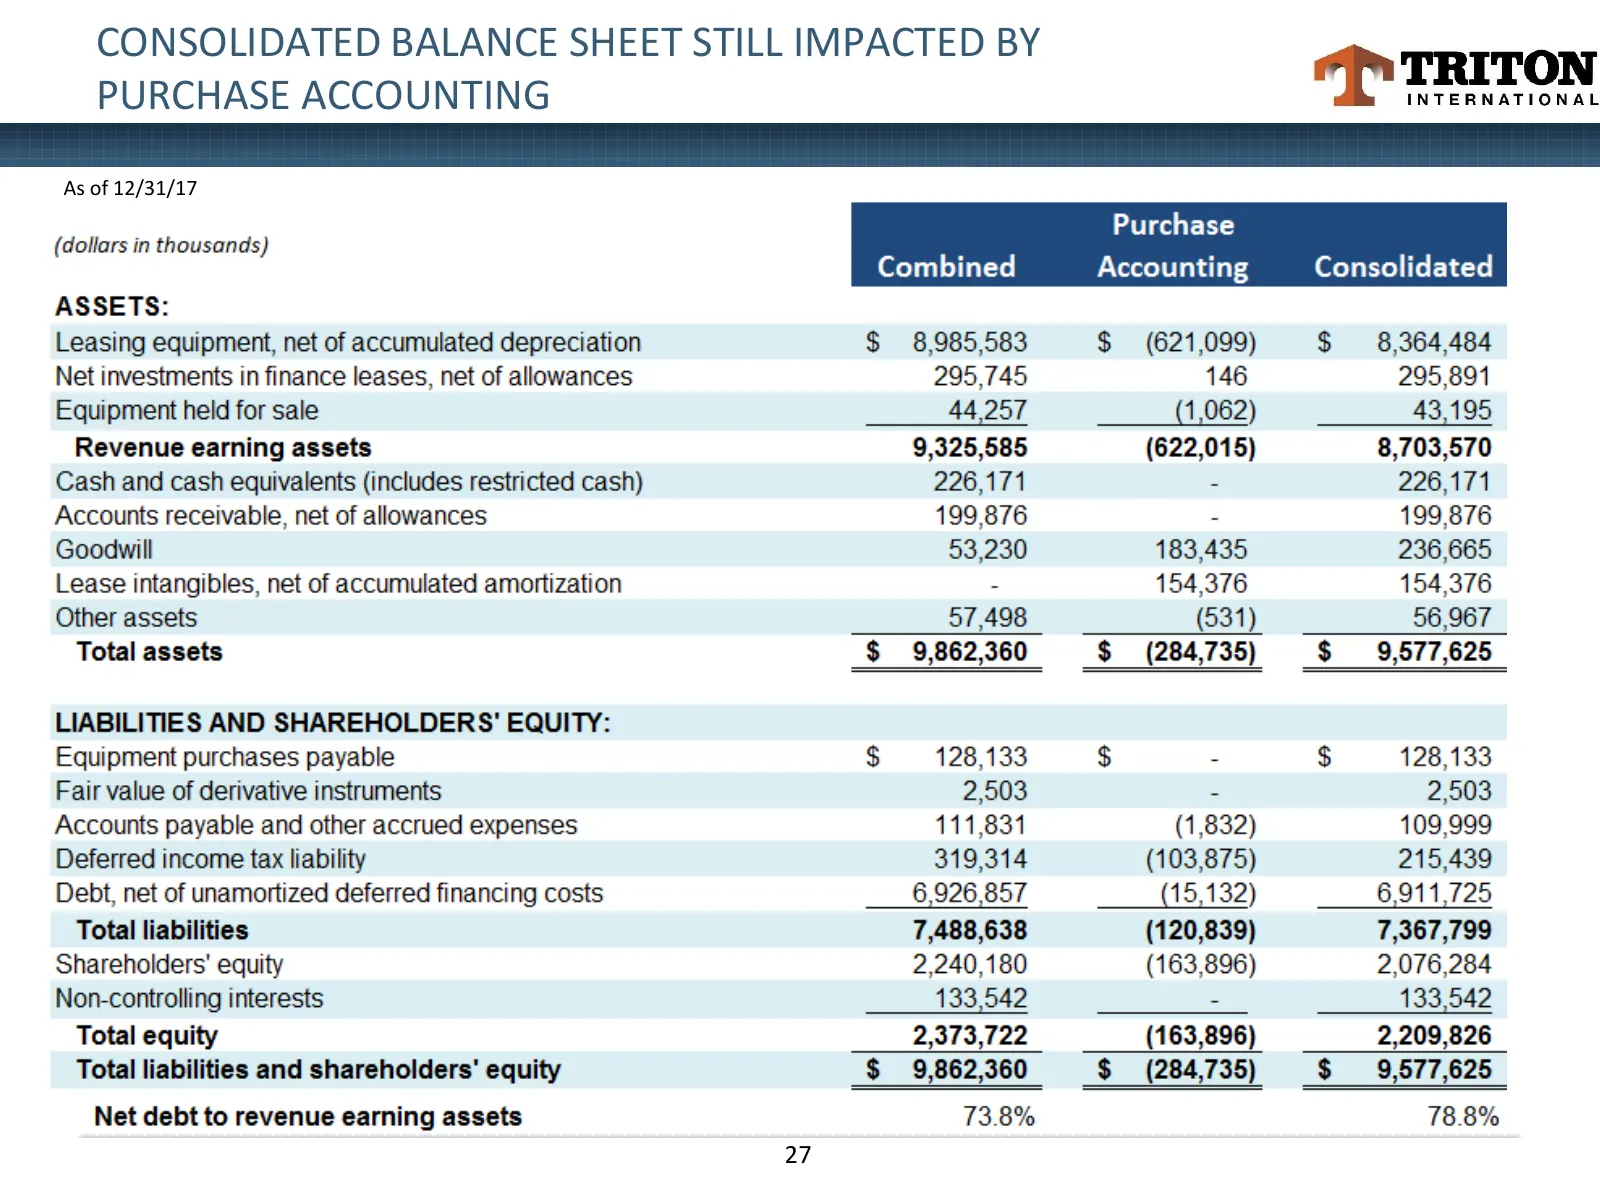
CONSOLIDATED BALANCE SHEET STILL IMPACTED BY PURCHASE ACCOUNTING As of 12/31/17 27
Slide 28: Reconciliation of Non-GAAP Financial Information
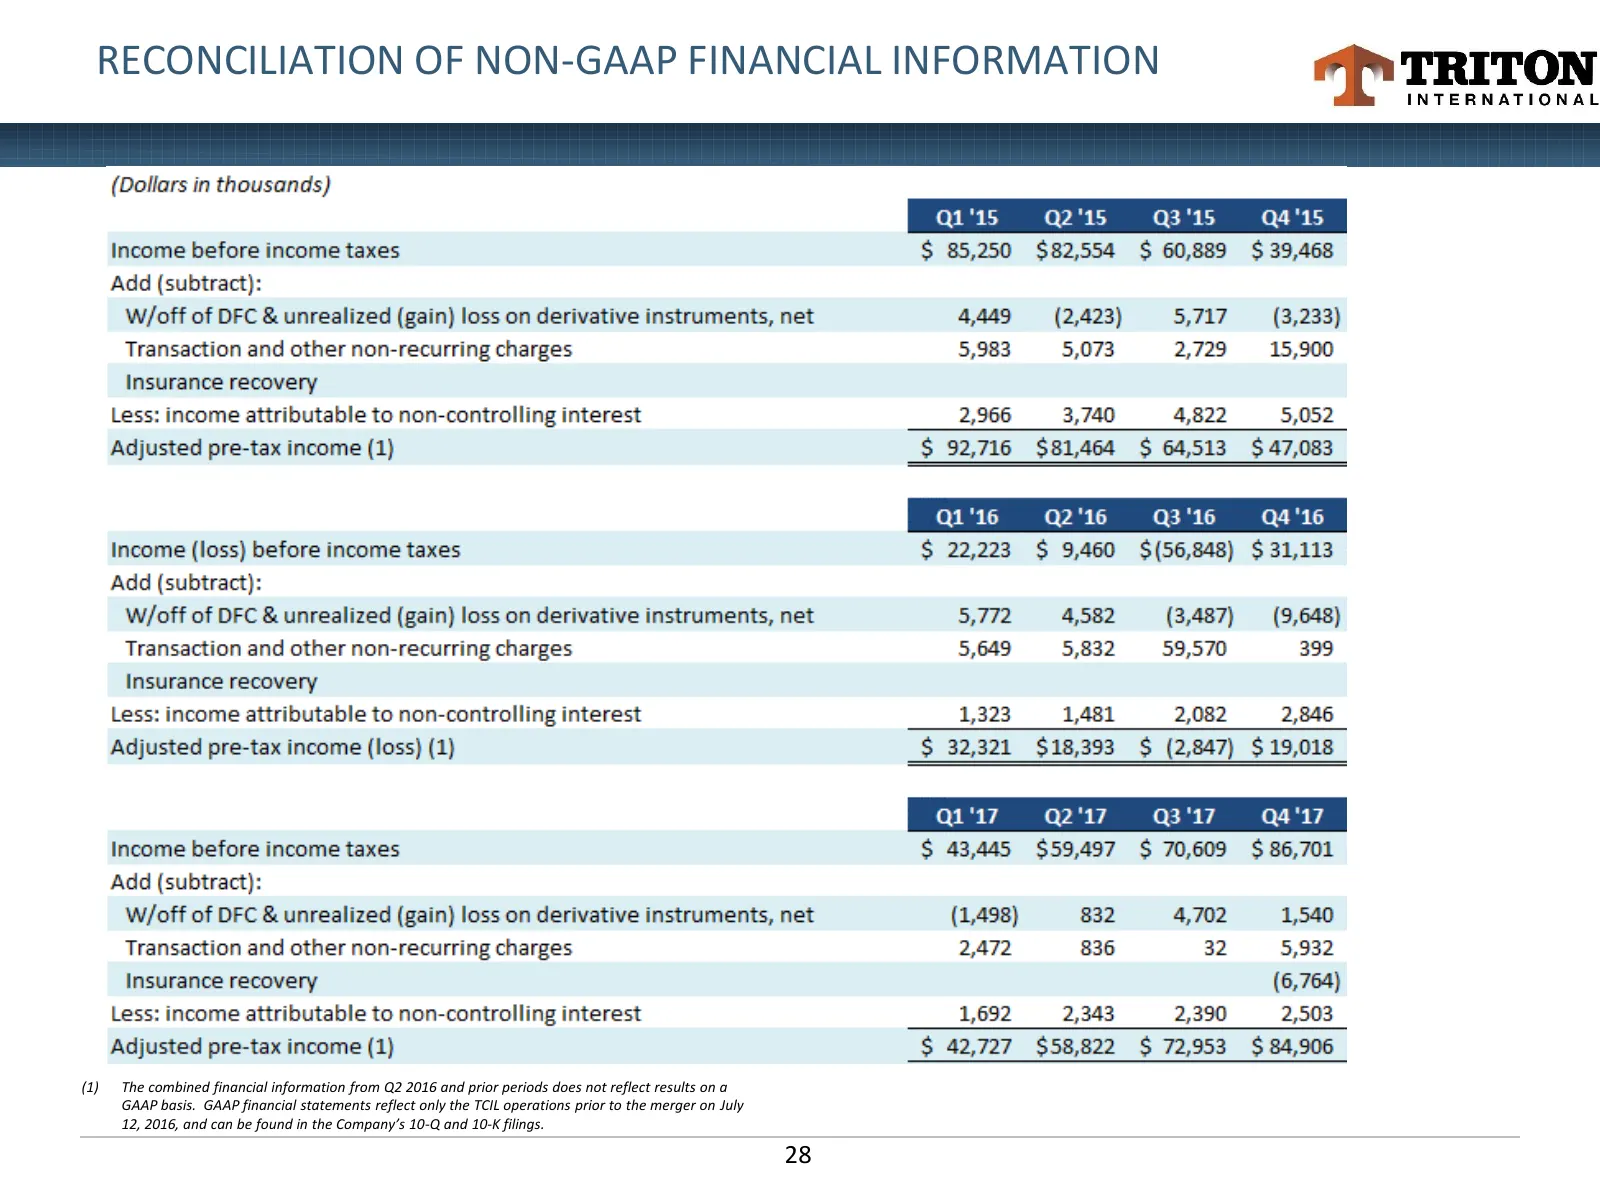
RECONCILIATION OF NON-GAAP FINANCIAL INFORMATION (1) The combined financial information from Q2 2016 and prior periods does not reflect results on a GAAP basis. GAAP financial statements reflect only the TCIL operations prior to the merger on July 12, 2016, and can be found in the Company’s 10-Q and
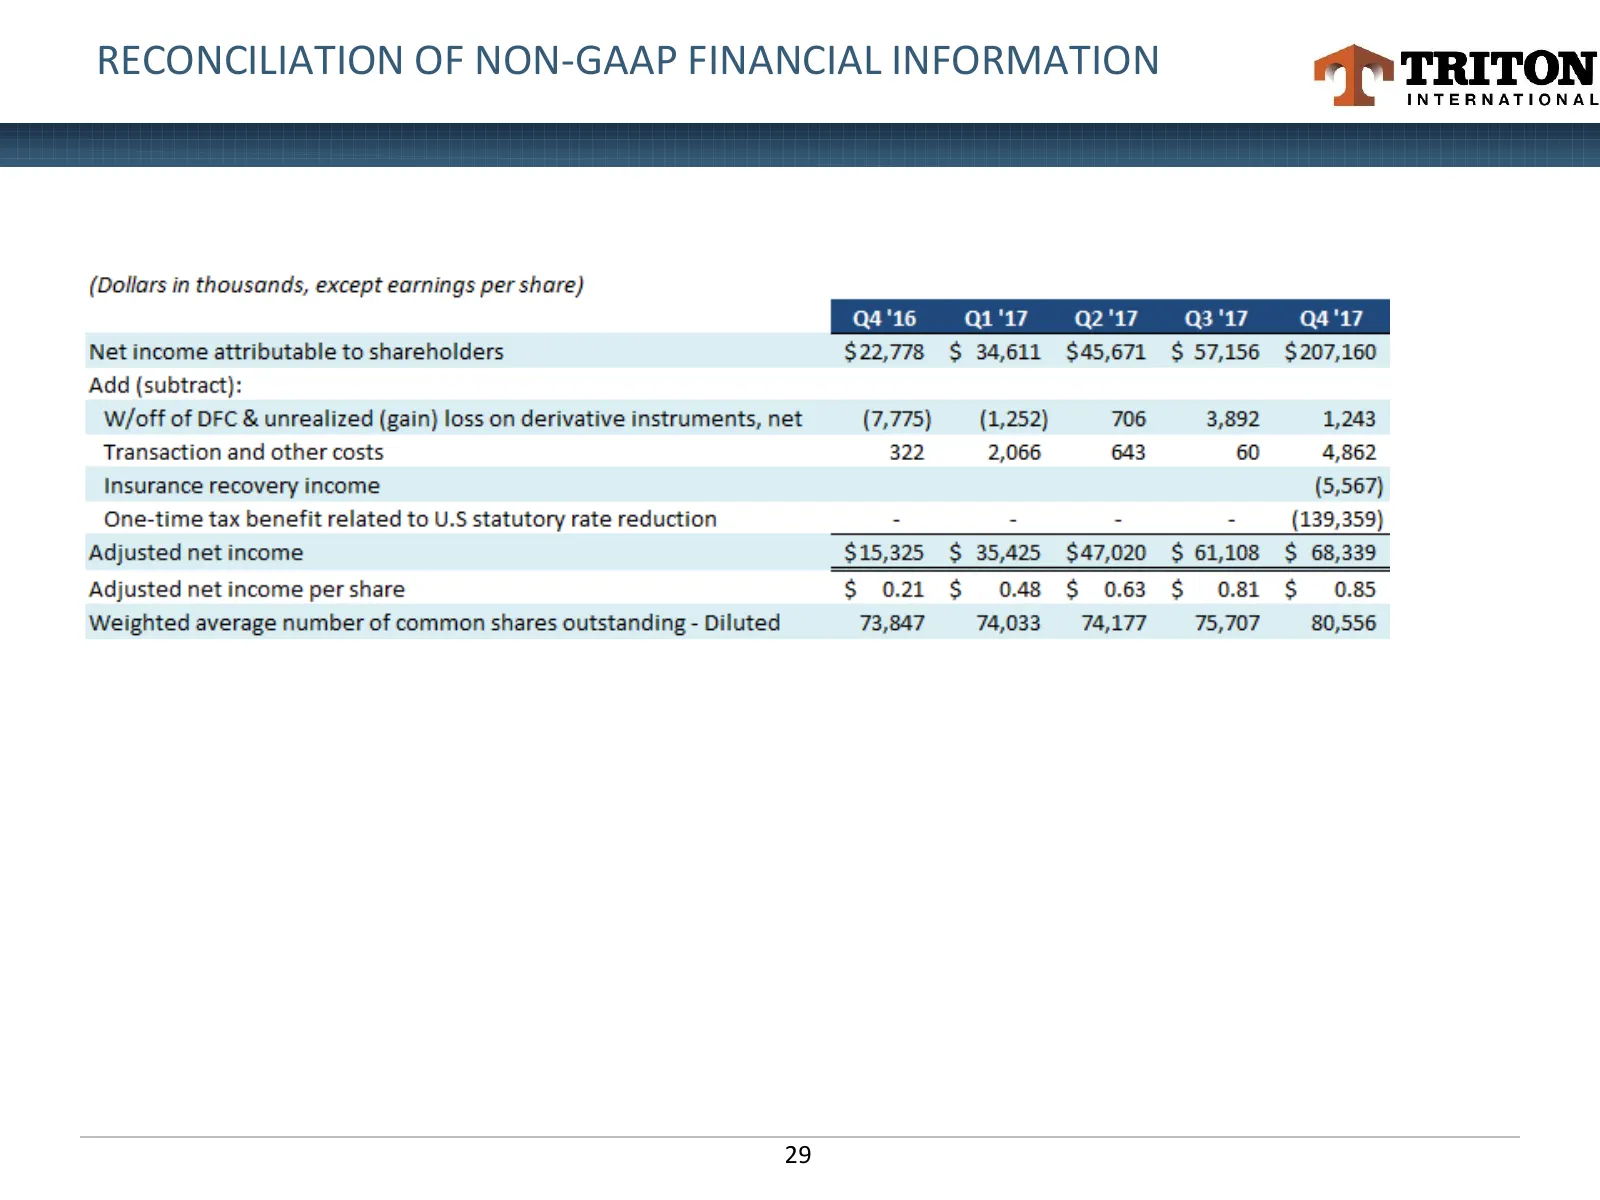
Slide 29: Reconciliation of Non-GAAP Financial Information
RECONCILIATION OF NON-GAAP FINANCIAL INFORMATION 29
Source: Internet Archive copy of tritoninternational.com
More decks from Triton International Ltd.
 Q3 2026 Earnings Presentation14 slides · November 2026
 Q2 2026 Earnings Presentation14 slides · August 2026
 Q1 2026 Earnings Presentation14 slides · May 2026
 Q4 2025 Earnings Presentation12 slides · February 2026
 Investor Presentation (January 2026)12 slides · January 2026
 Q2 2025 Earnings Presentation13 slides · September 2025