Sembcorp Industries Ltd. · SGX:U96
Sembcorp Industries — FY2013 Earnings Presentation
23 slides from Sembcorp Industries's earnings presentation, Feb 26, 2014
Slide 1: FY2013 Results Announcement
FY2013 Results Announcement February 26, 2014 © Sembcorp Industries 2014 Scope of Presentation • CEO’s Report • Financial Review • Group Outlook © Sembcorp Industries 2014 2 1
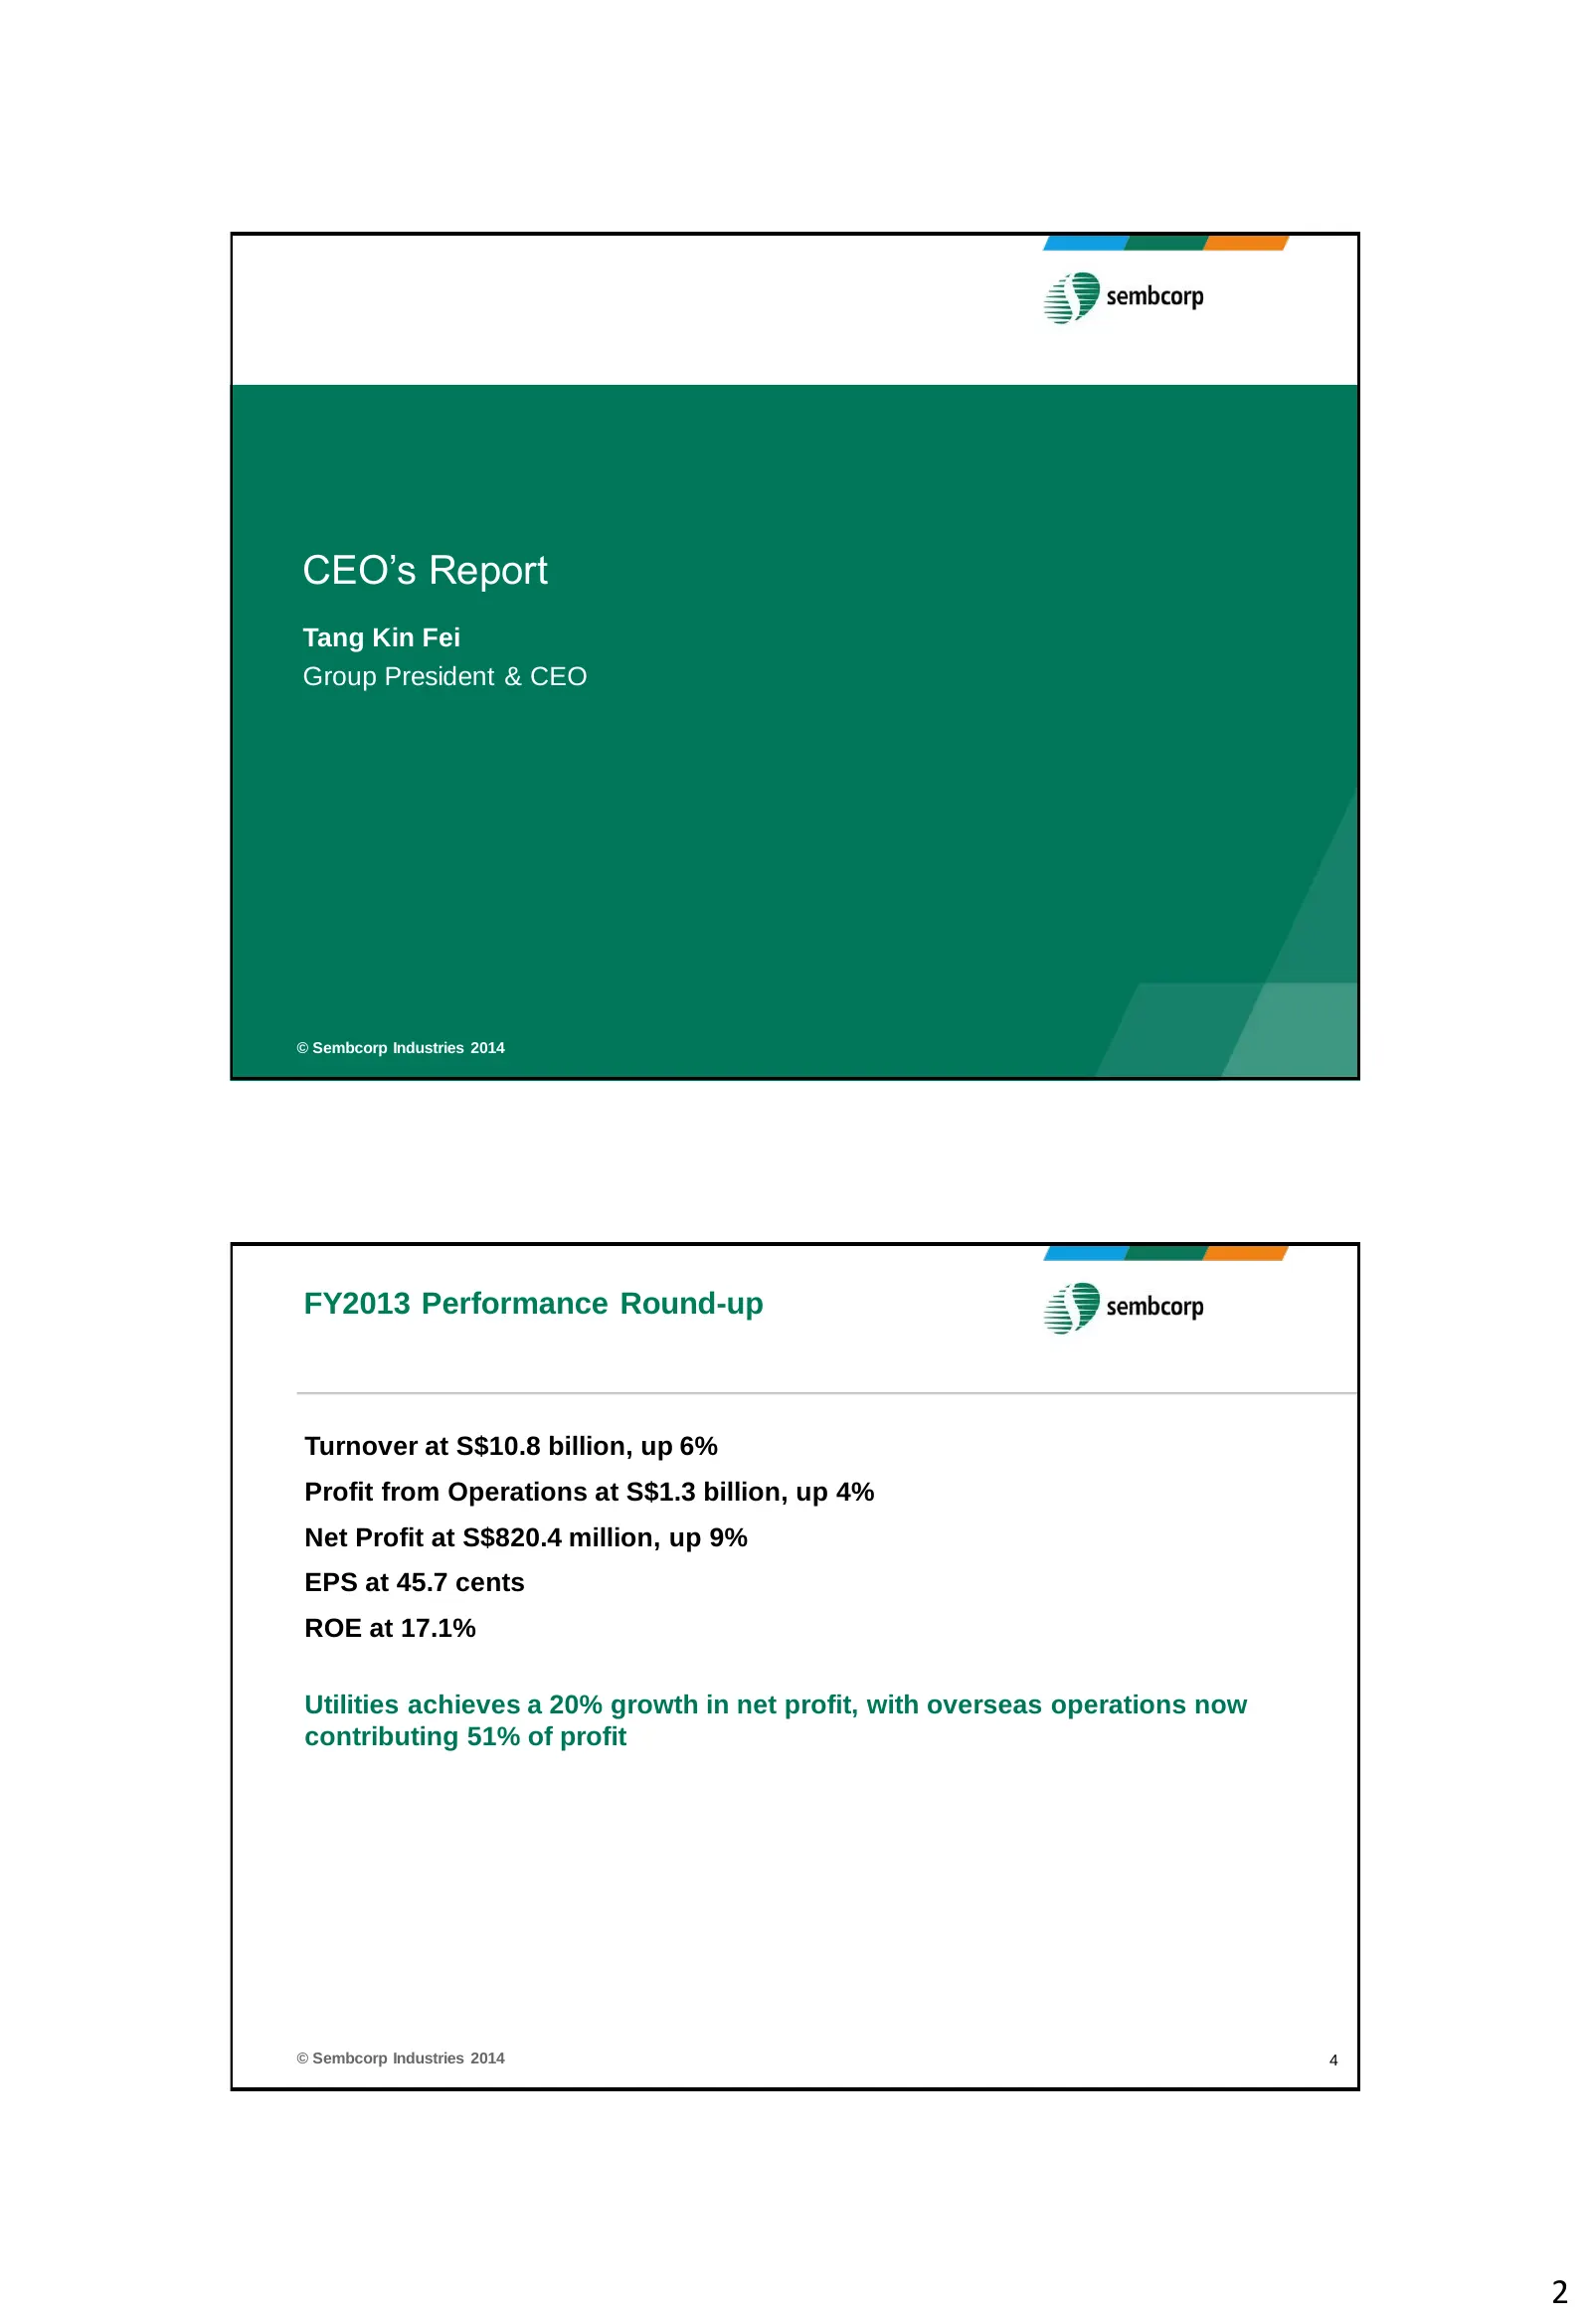
Slide 2: CEO's Report: FY2013 Performance Round-up
CEO’s Report Tang Kin Fei Group President & CEO © Sembcorp Industries 2014 FY2013 Performance Round-up Turnover at S$10.8 billion, up 6% Profit from Operations at S$1.3 billion, up 4% Net Profit at S$820.4 million, up 9% EPS at 45.7 cents ROE at 17.1% Utilities achieves a 20% growth in net profit, w
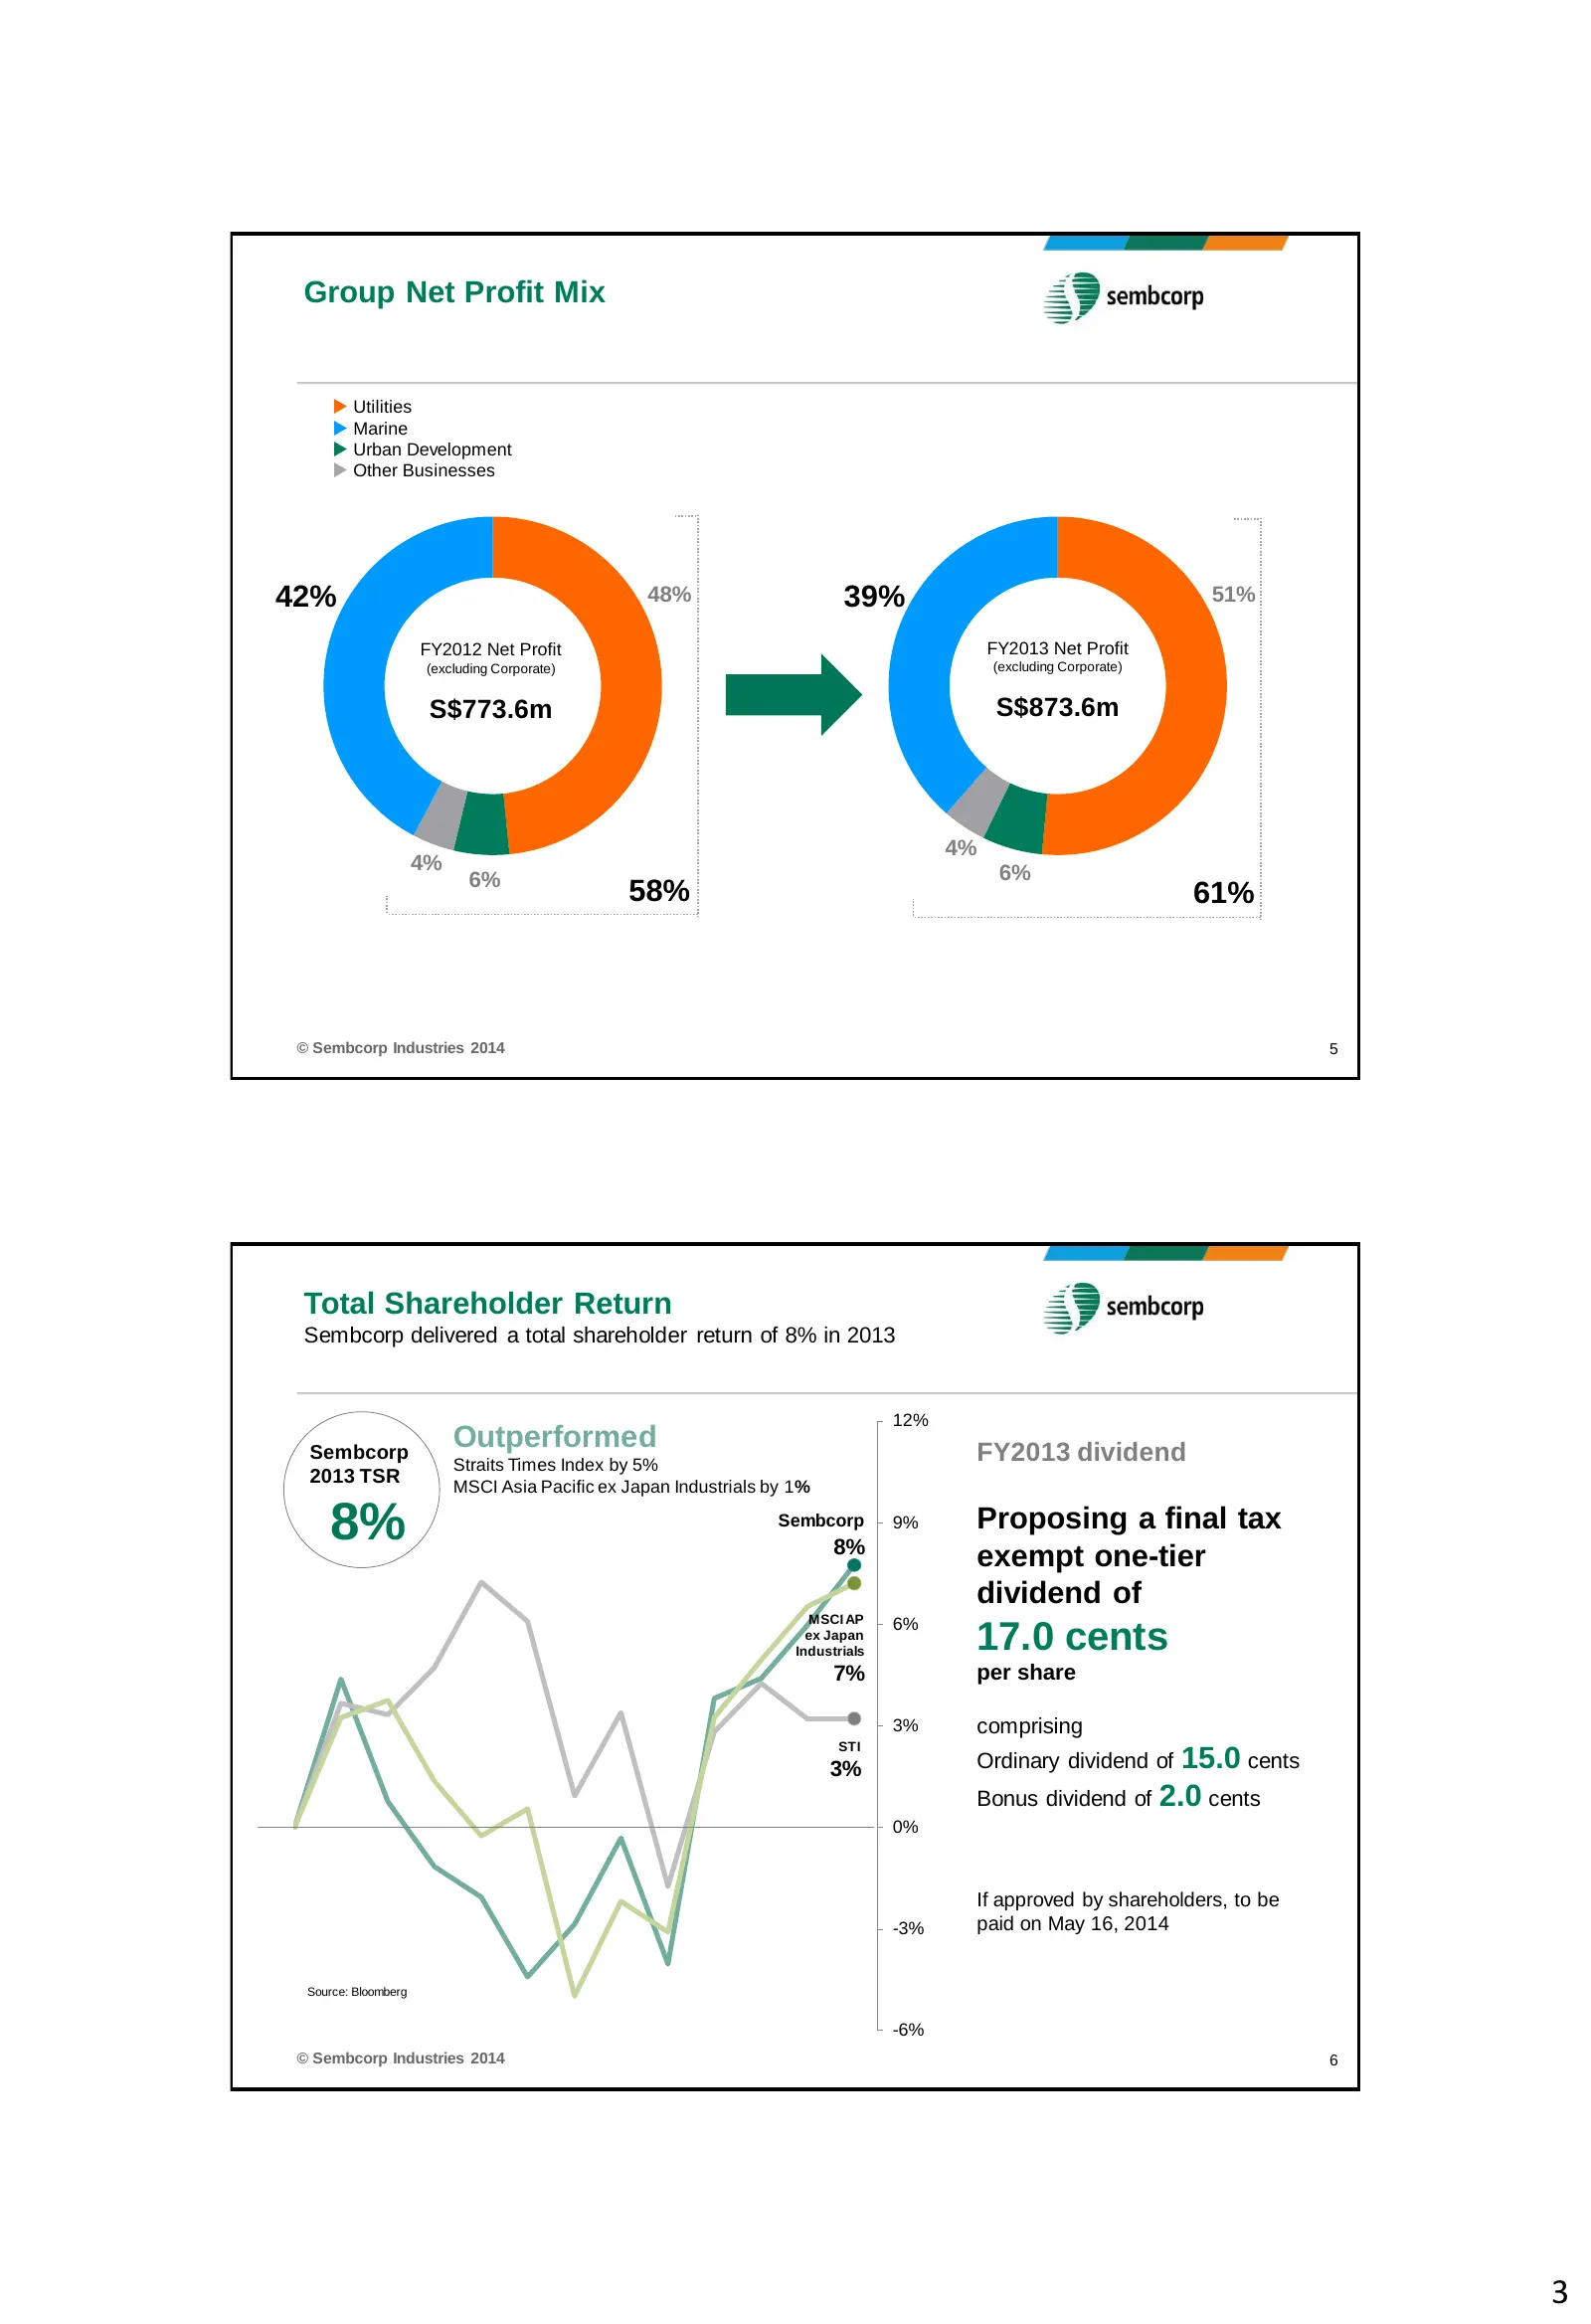
Slide 3: Group Net Profit Mix and Total Shareholder Return
Group Net Profit Mix Utilities Marine Urban Development Other Businesses 42% 48% 39% 51% FY2012 Net Profit FY2013 Net Profit (excluding Corporate) (excluding Corporate) S$773.6m S$873.6m 4% 4% 6% 6% 58% 61% © Sembcorp Industries 2014 5 Total Shareholder Return Sembcorp delivered a total shar
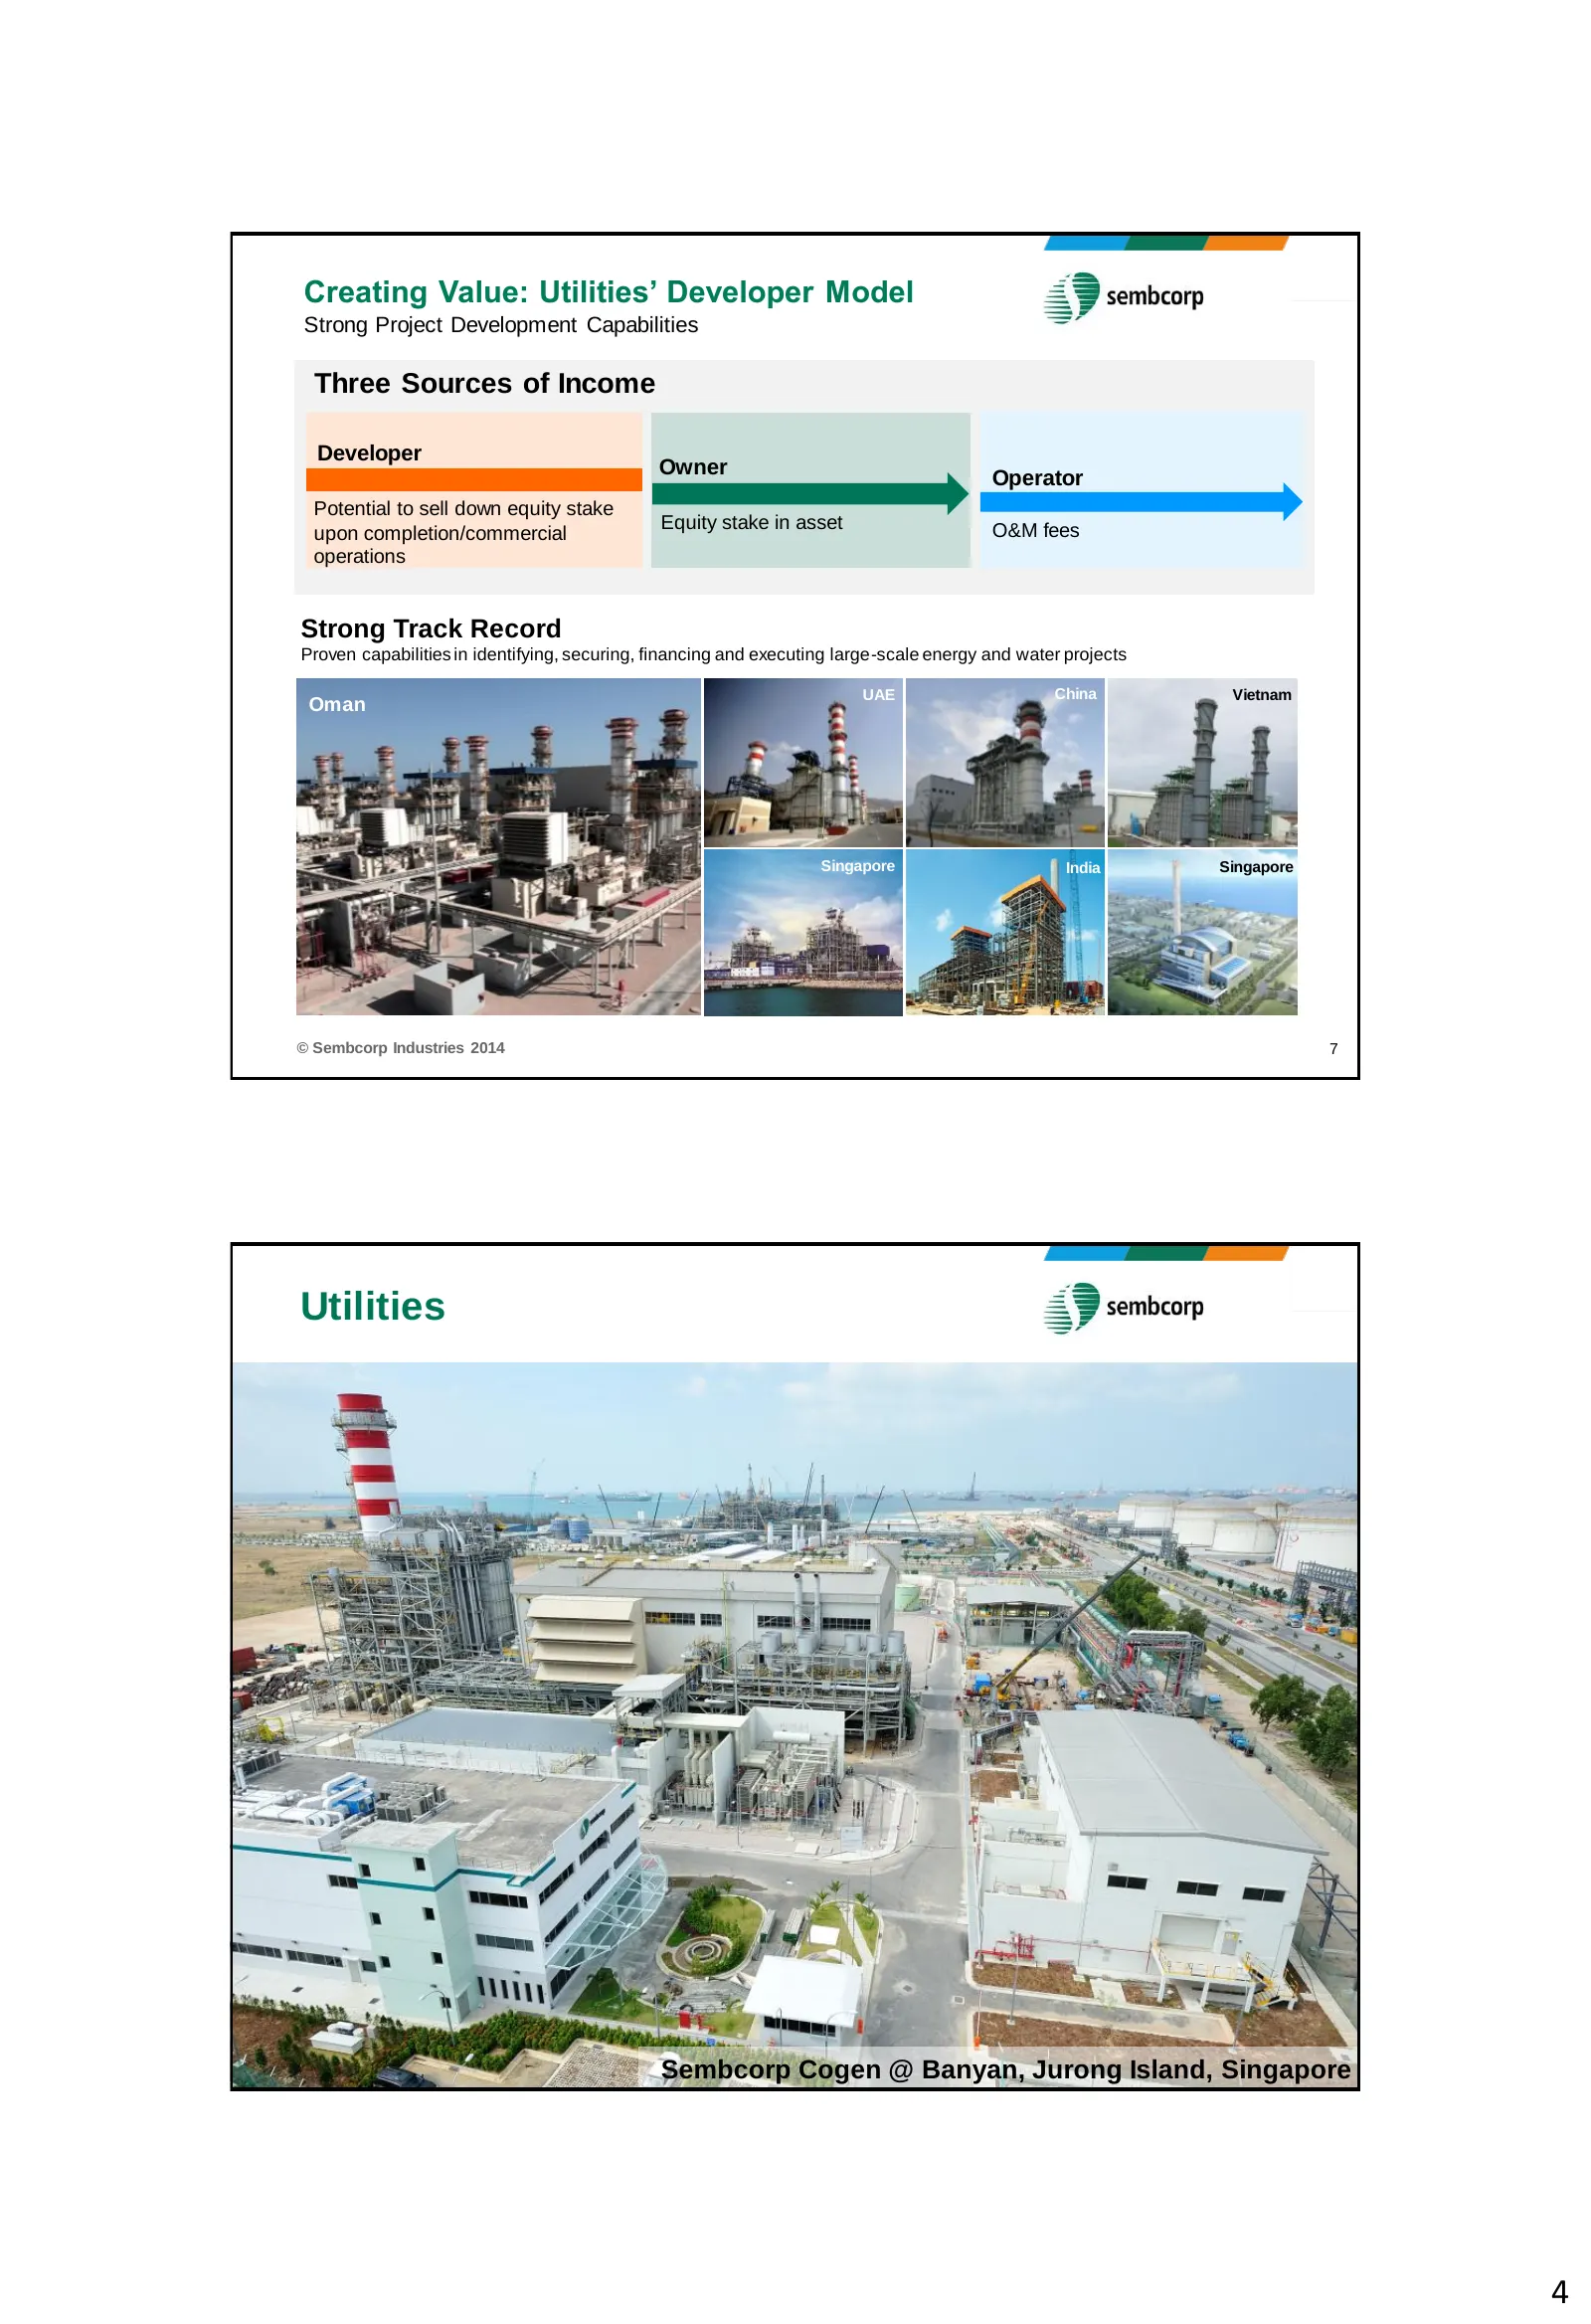
Slide 4: Creating Value: Utilities' Developer Model
Creating Value: Utilities’ Developer Model Strong Project Development Capabilities Three Sources of Income Developer Owner Operator Potential to sell down equity stake Equity stake in asset O&M fees upon completion/commercial operations Strong Track Record Proven capabilities in identifying, securin
Slide 5: Utilities Highlights
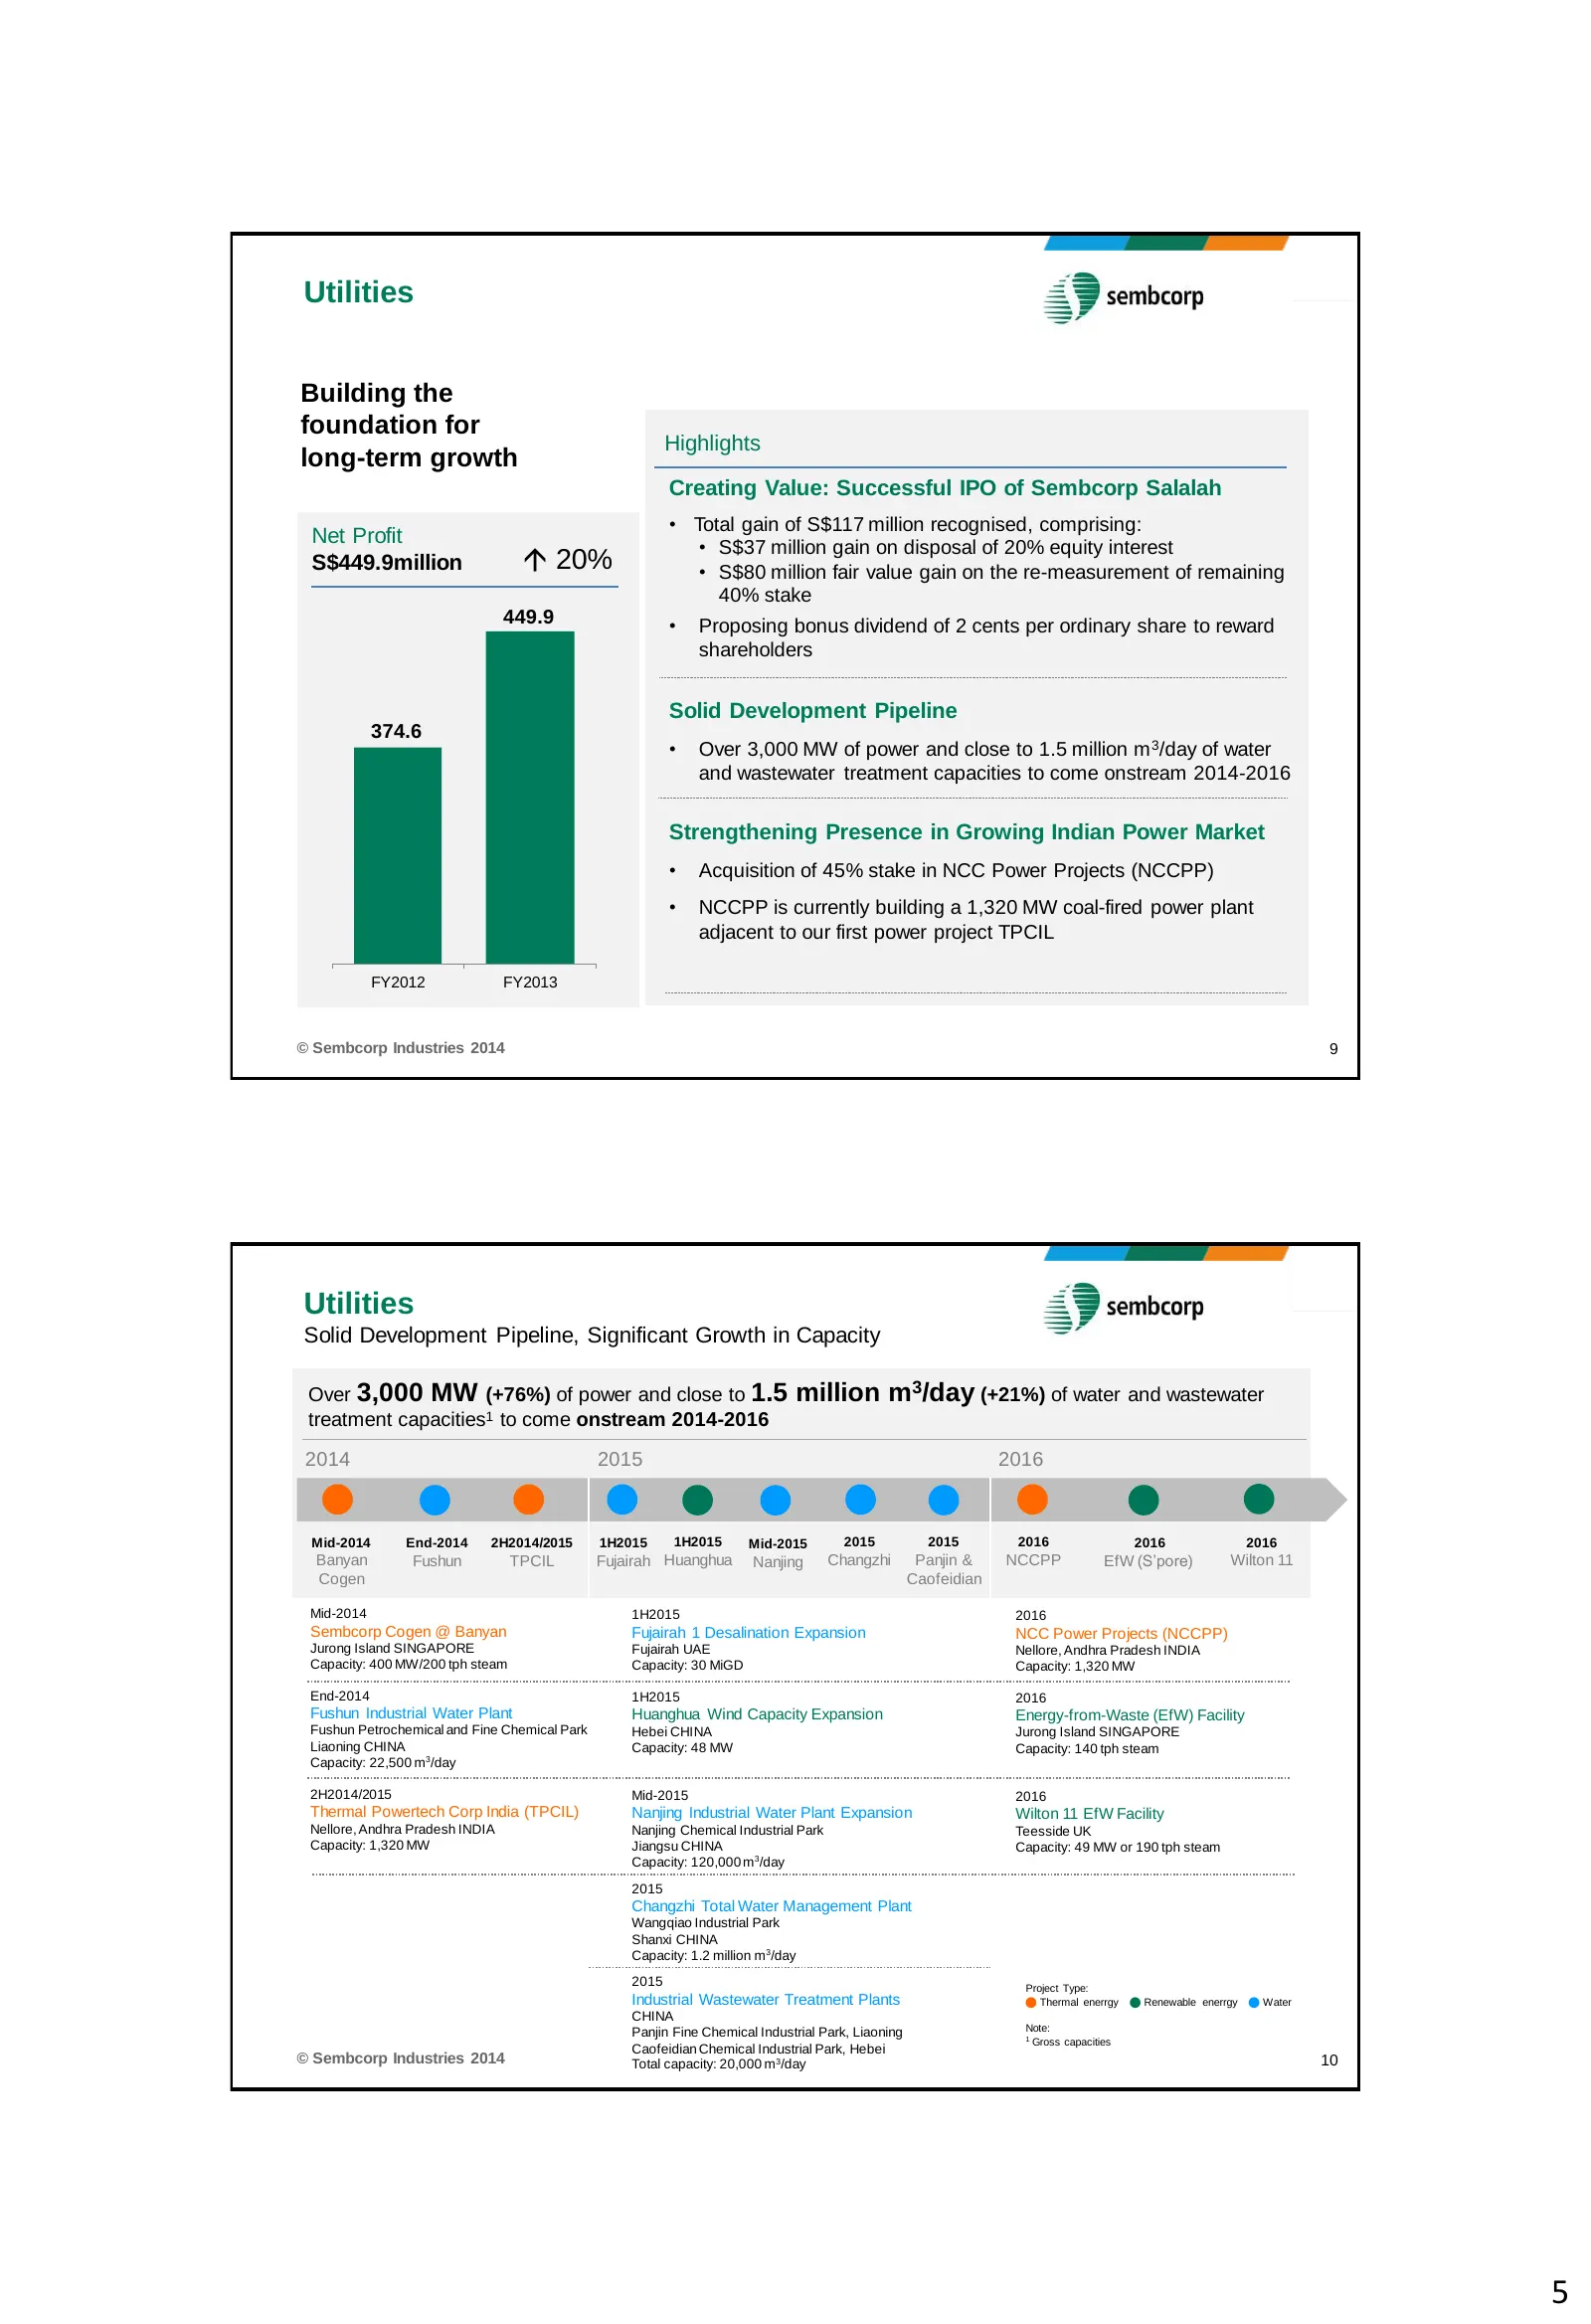
Utilities Building the foundation for Highlights long-term growth Creating Value: Successful IPO of Sembcorp Salalah • Total gain of S$117 million recognised, comprising: Net Profit • S$37 million gain on disposal of 20% equity interest S$449.9million 20% • S$80 million fair value gain on the re-m
Slide 6: Strengthening Presence in Growing Indian Market
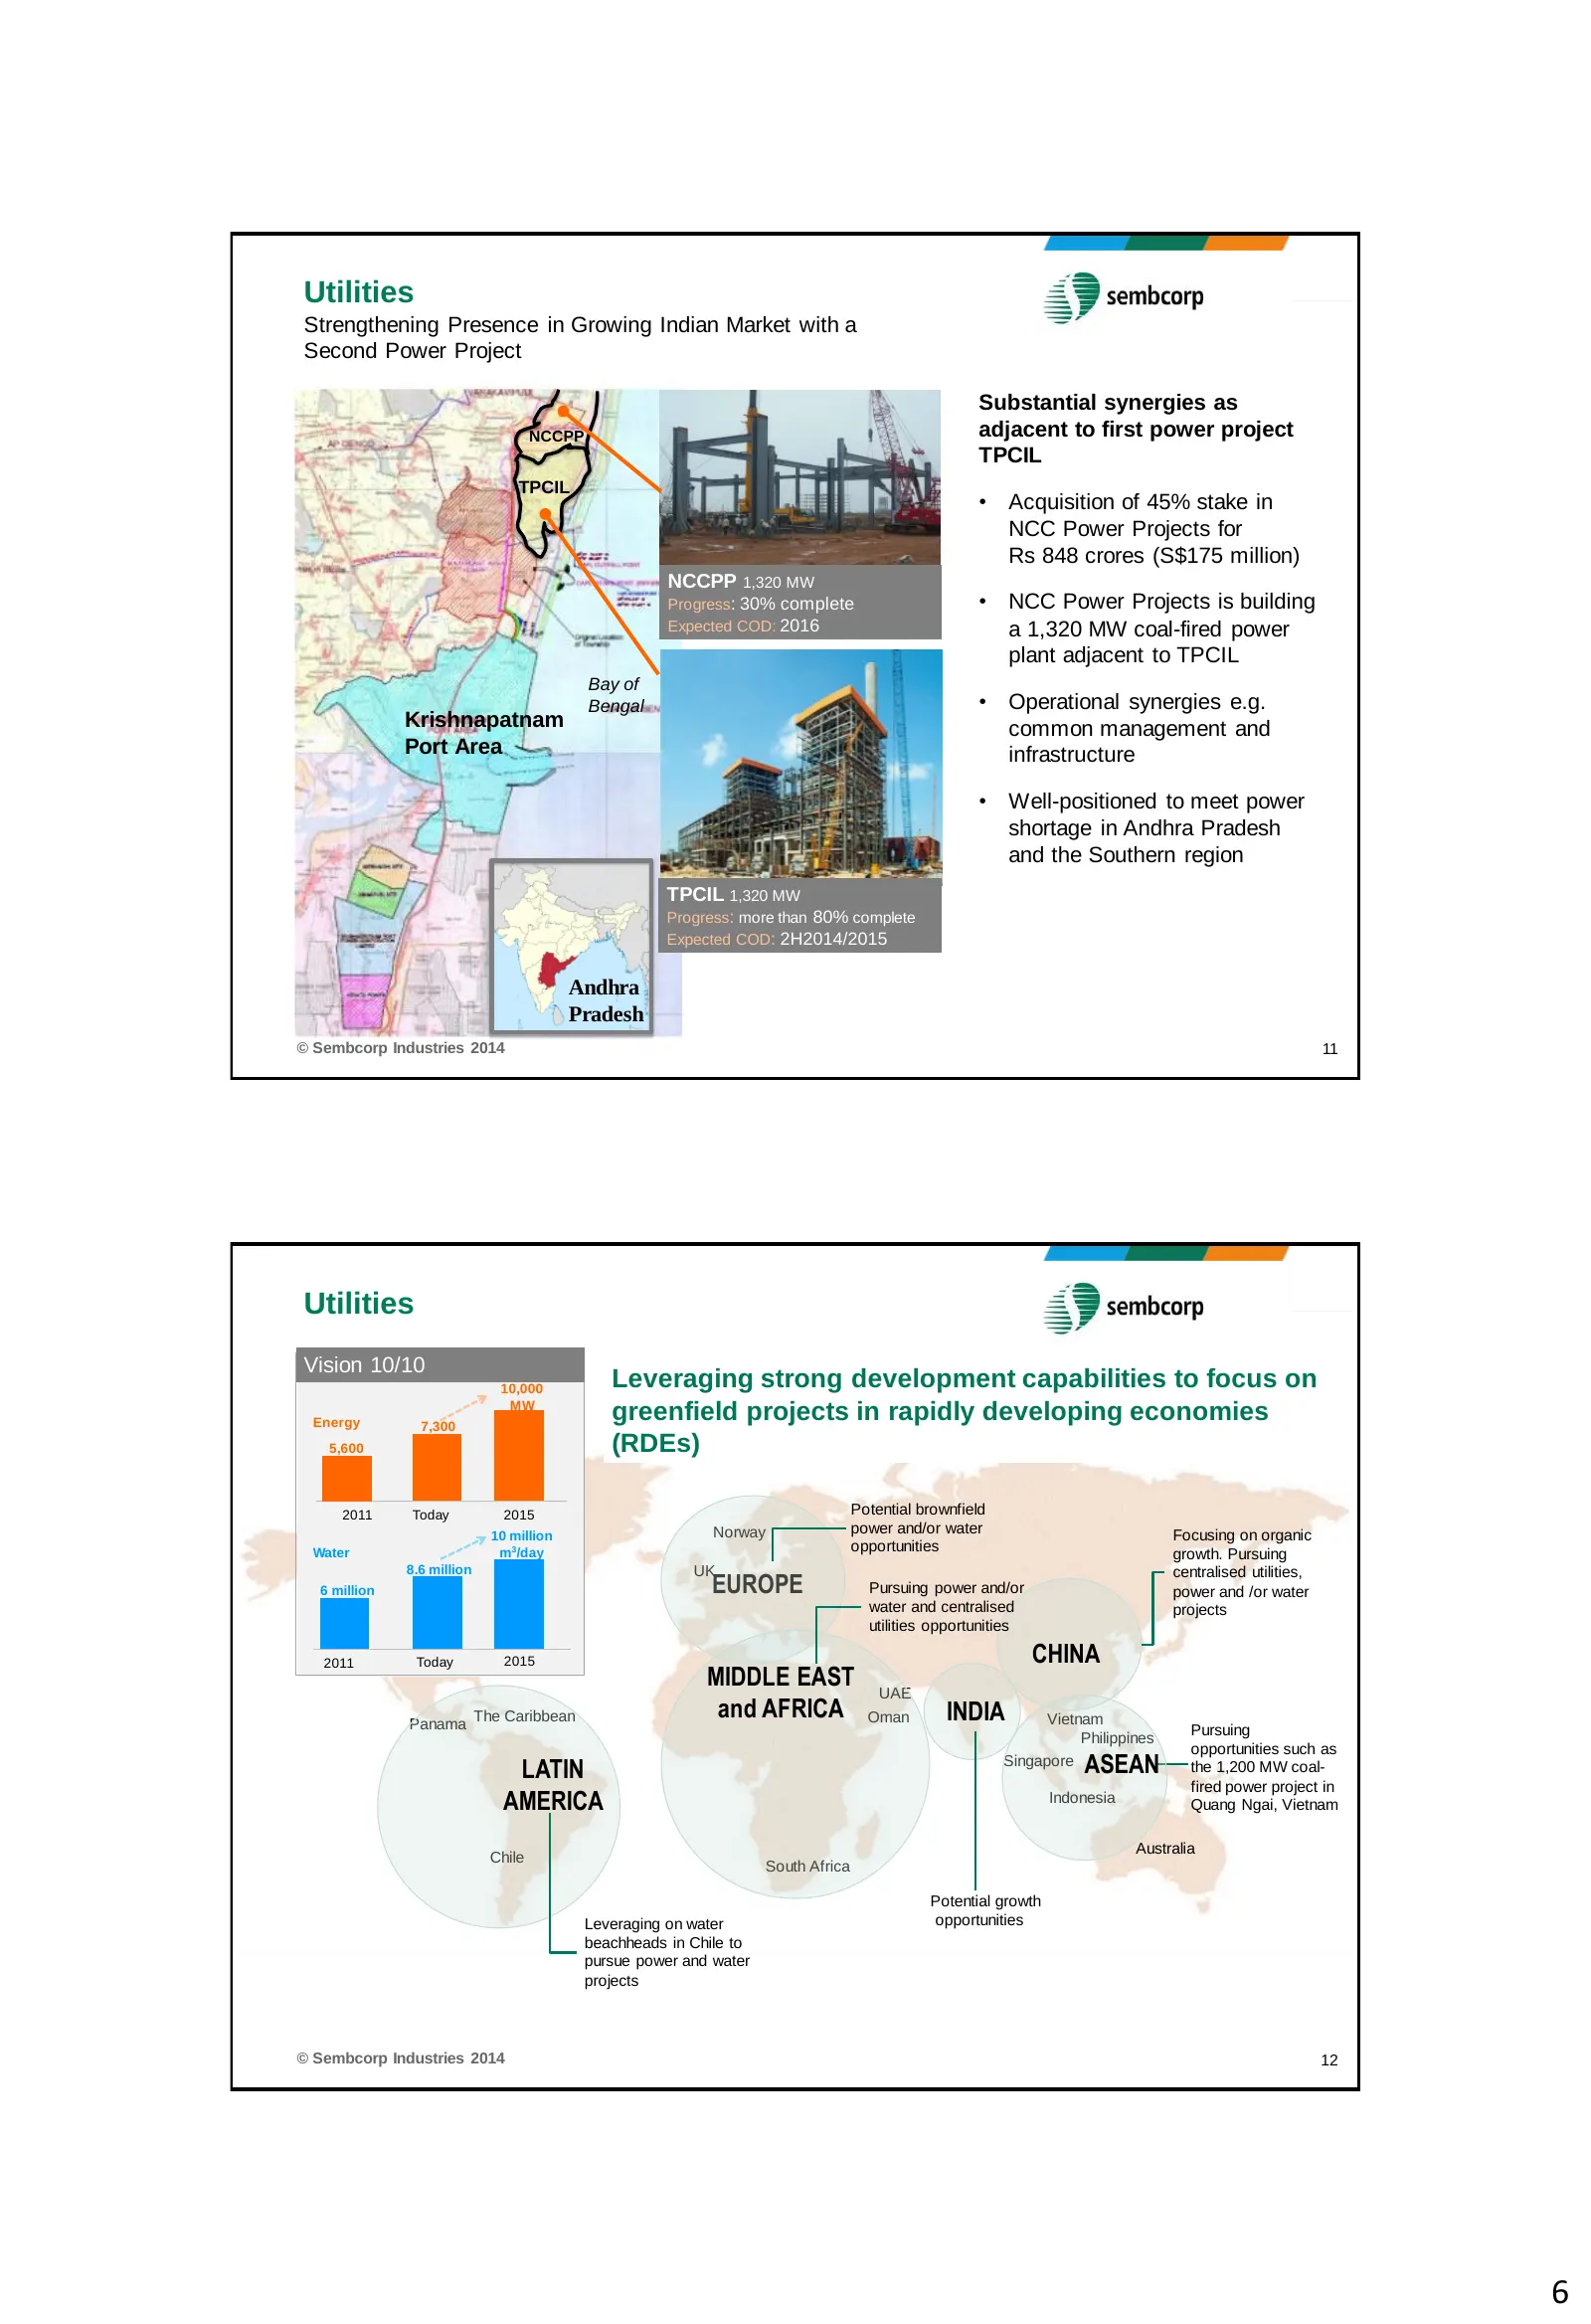
Utilities Strengthening Presence in Growing Indian Market with a Second Power Project Substantial synergies as NCCPP adjacent to first power project TPCIL TPCIL • Acquisition of 45% stake in NCC Power Projects for Rs 848 crores (S$175 million) NCCPP 1,320 MW Progress: 30% complete • NCC Power Projec
Slide 7: Marine: Strong Orderbook
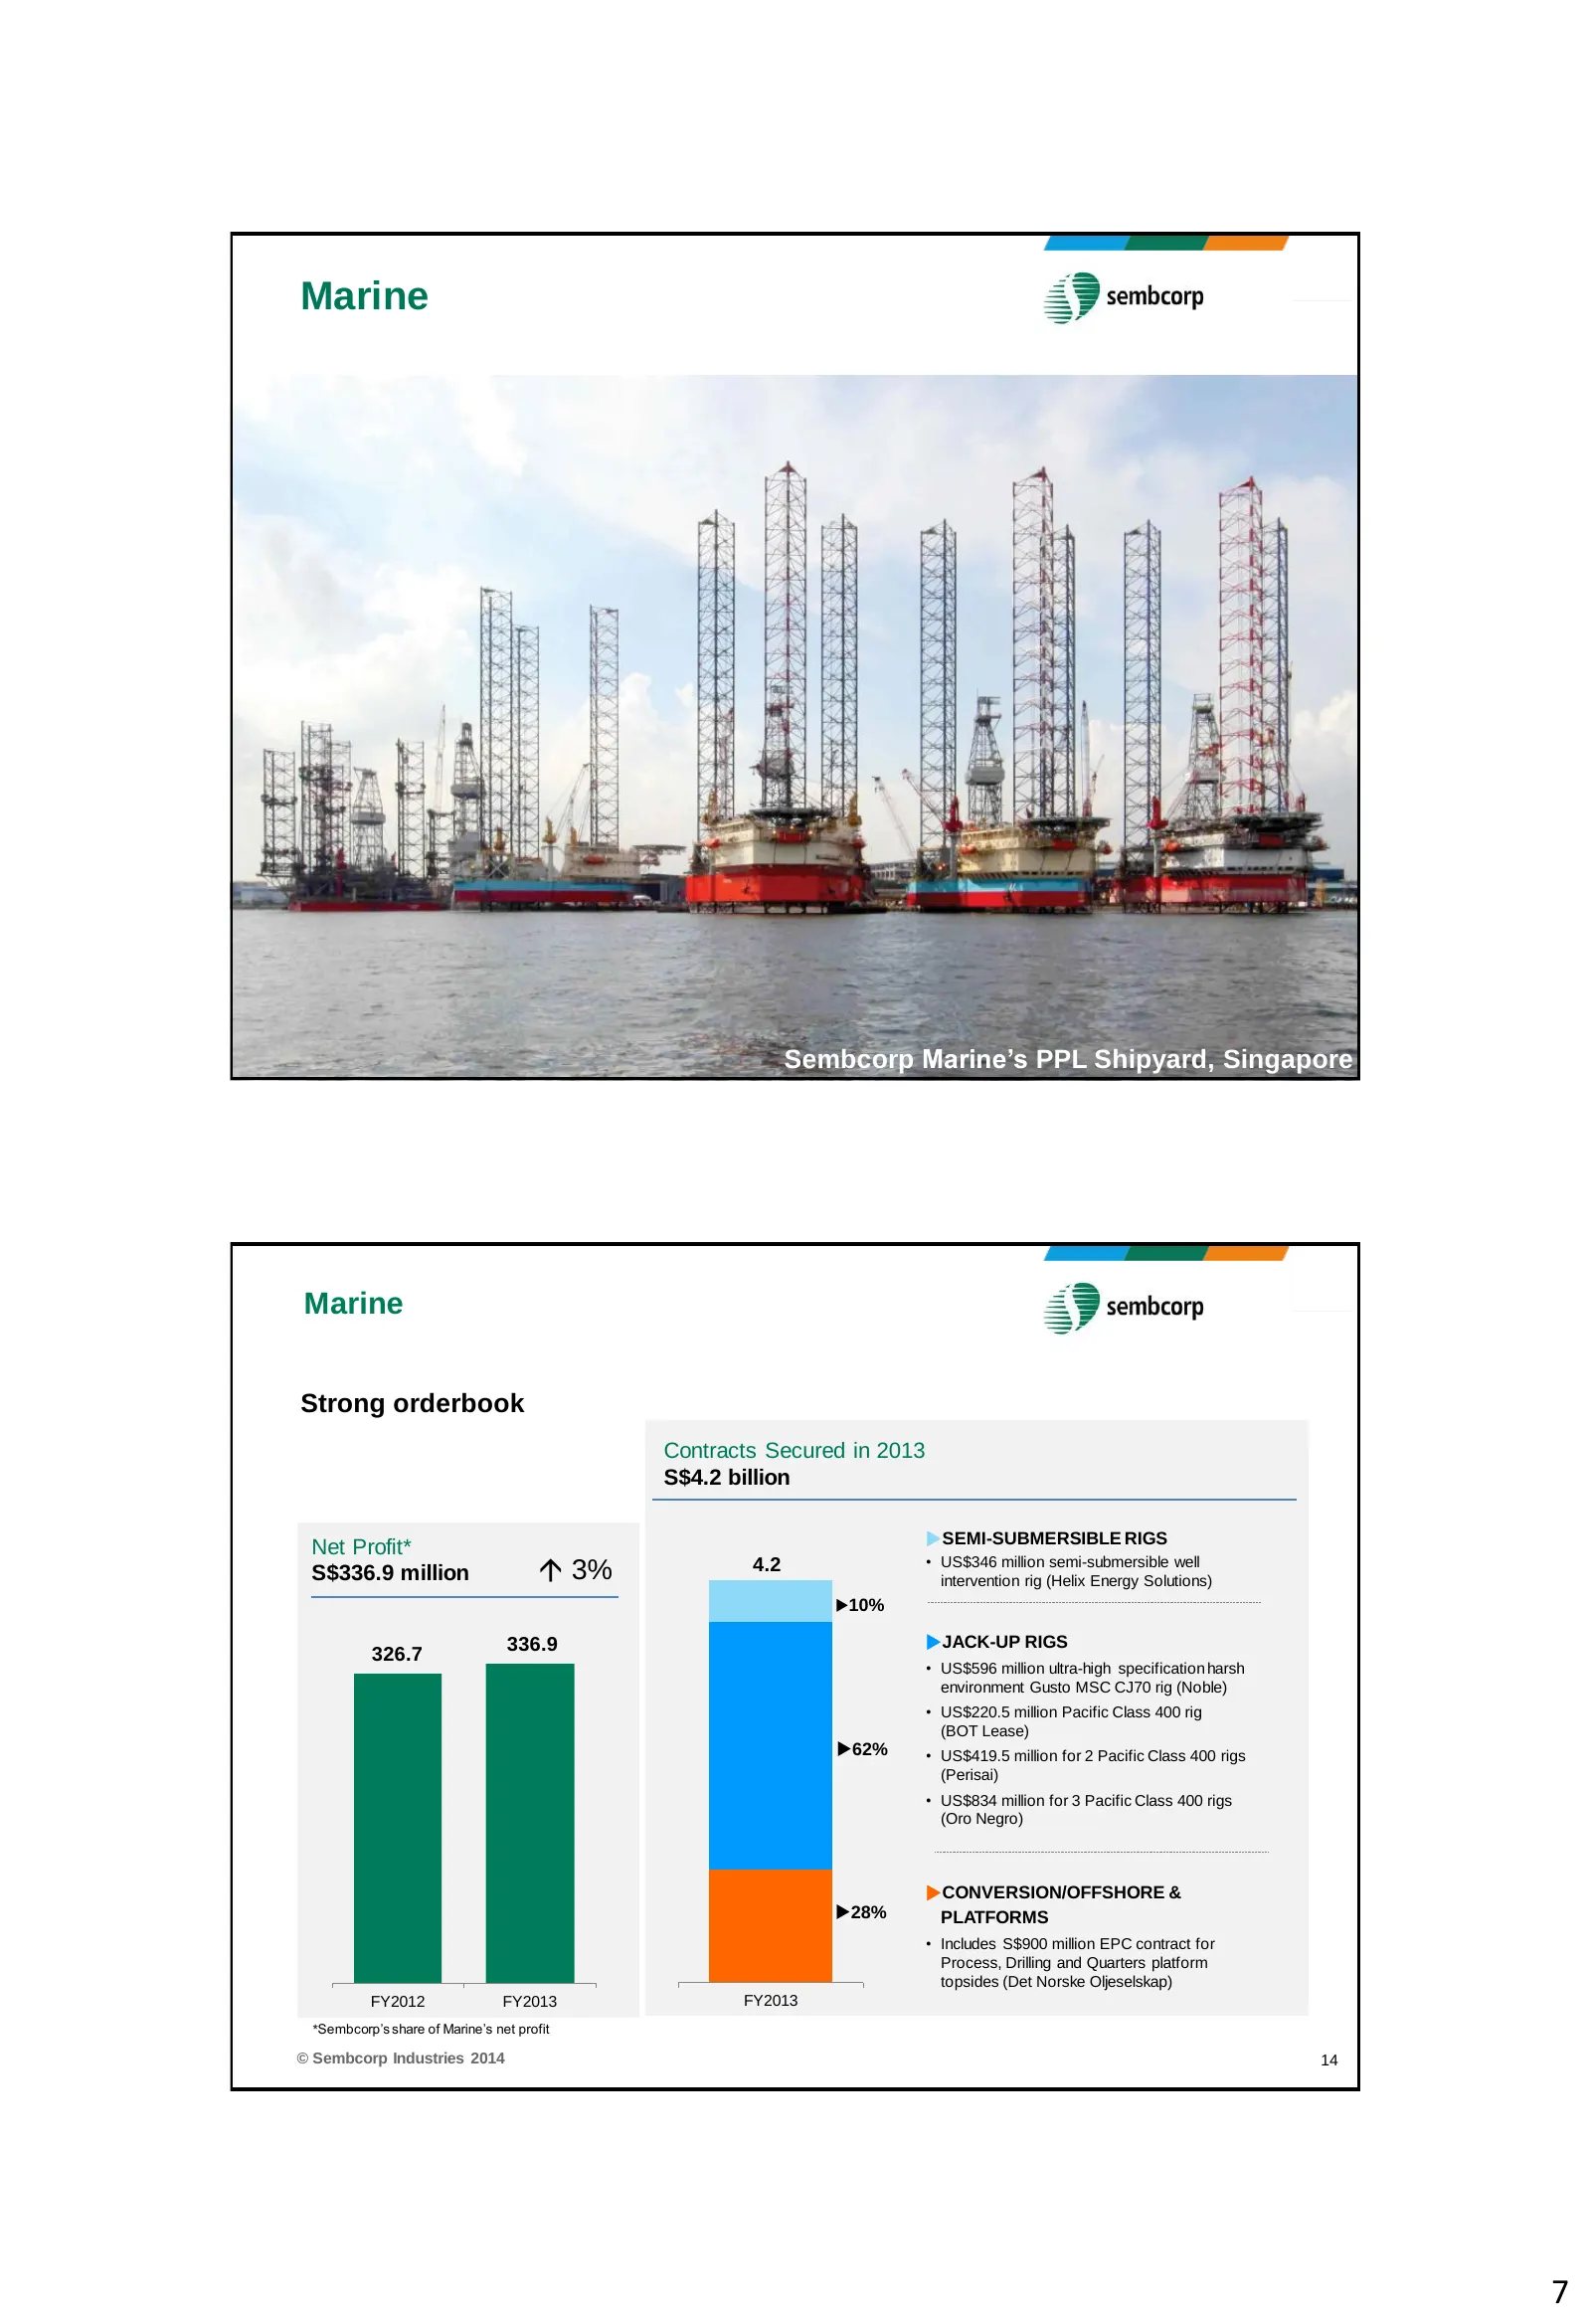
Marine © Sembcorp Industries 2014 13 Sembcorp Marine’s PPL Shipyard, Singapore Marine Strong orderbook Contracts Secured in 2013 S$4.2 billion SEMI-SUBMERSIBLE RIGS Net Profit* • US$346 million semi-submersible well S$336.9 million 3% 4.2 intervention rig (Helix Energy Solutions) 10% 336.9 JACK
Slide 8: Marine: Orderbook Visibility and New Integrated Yards
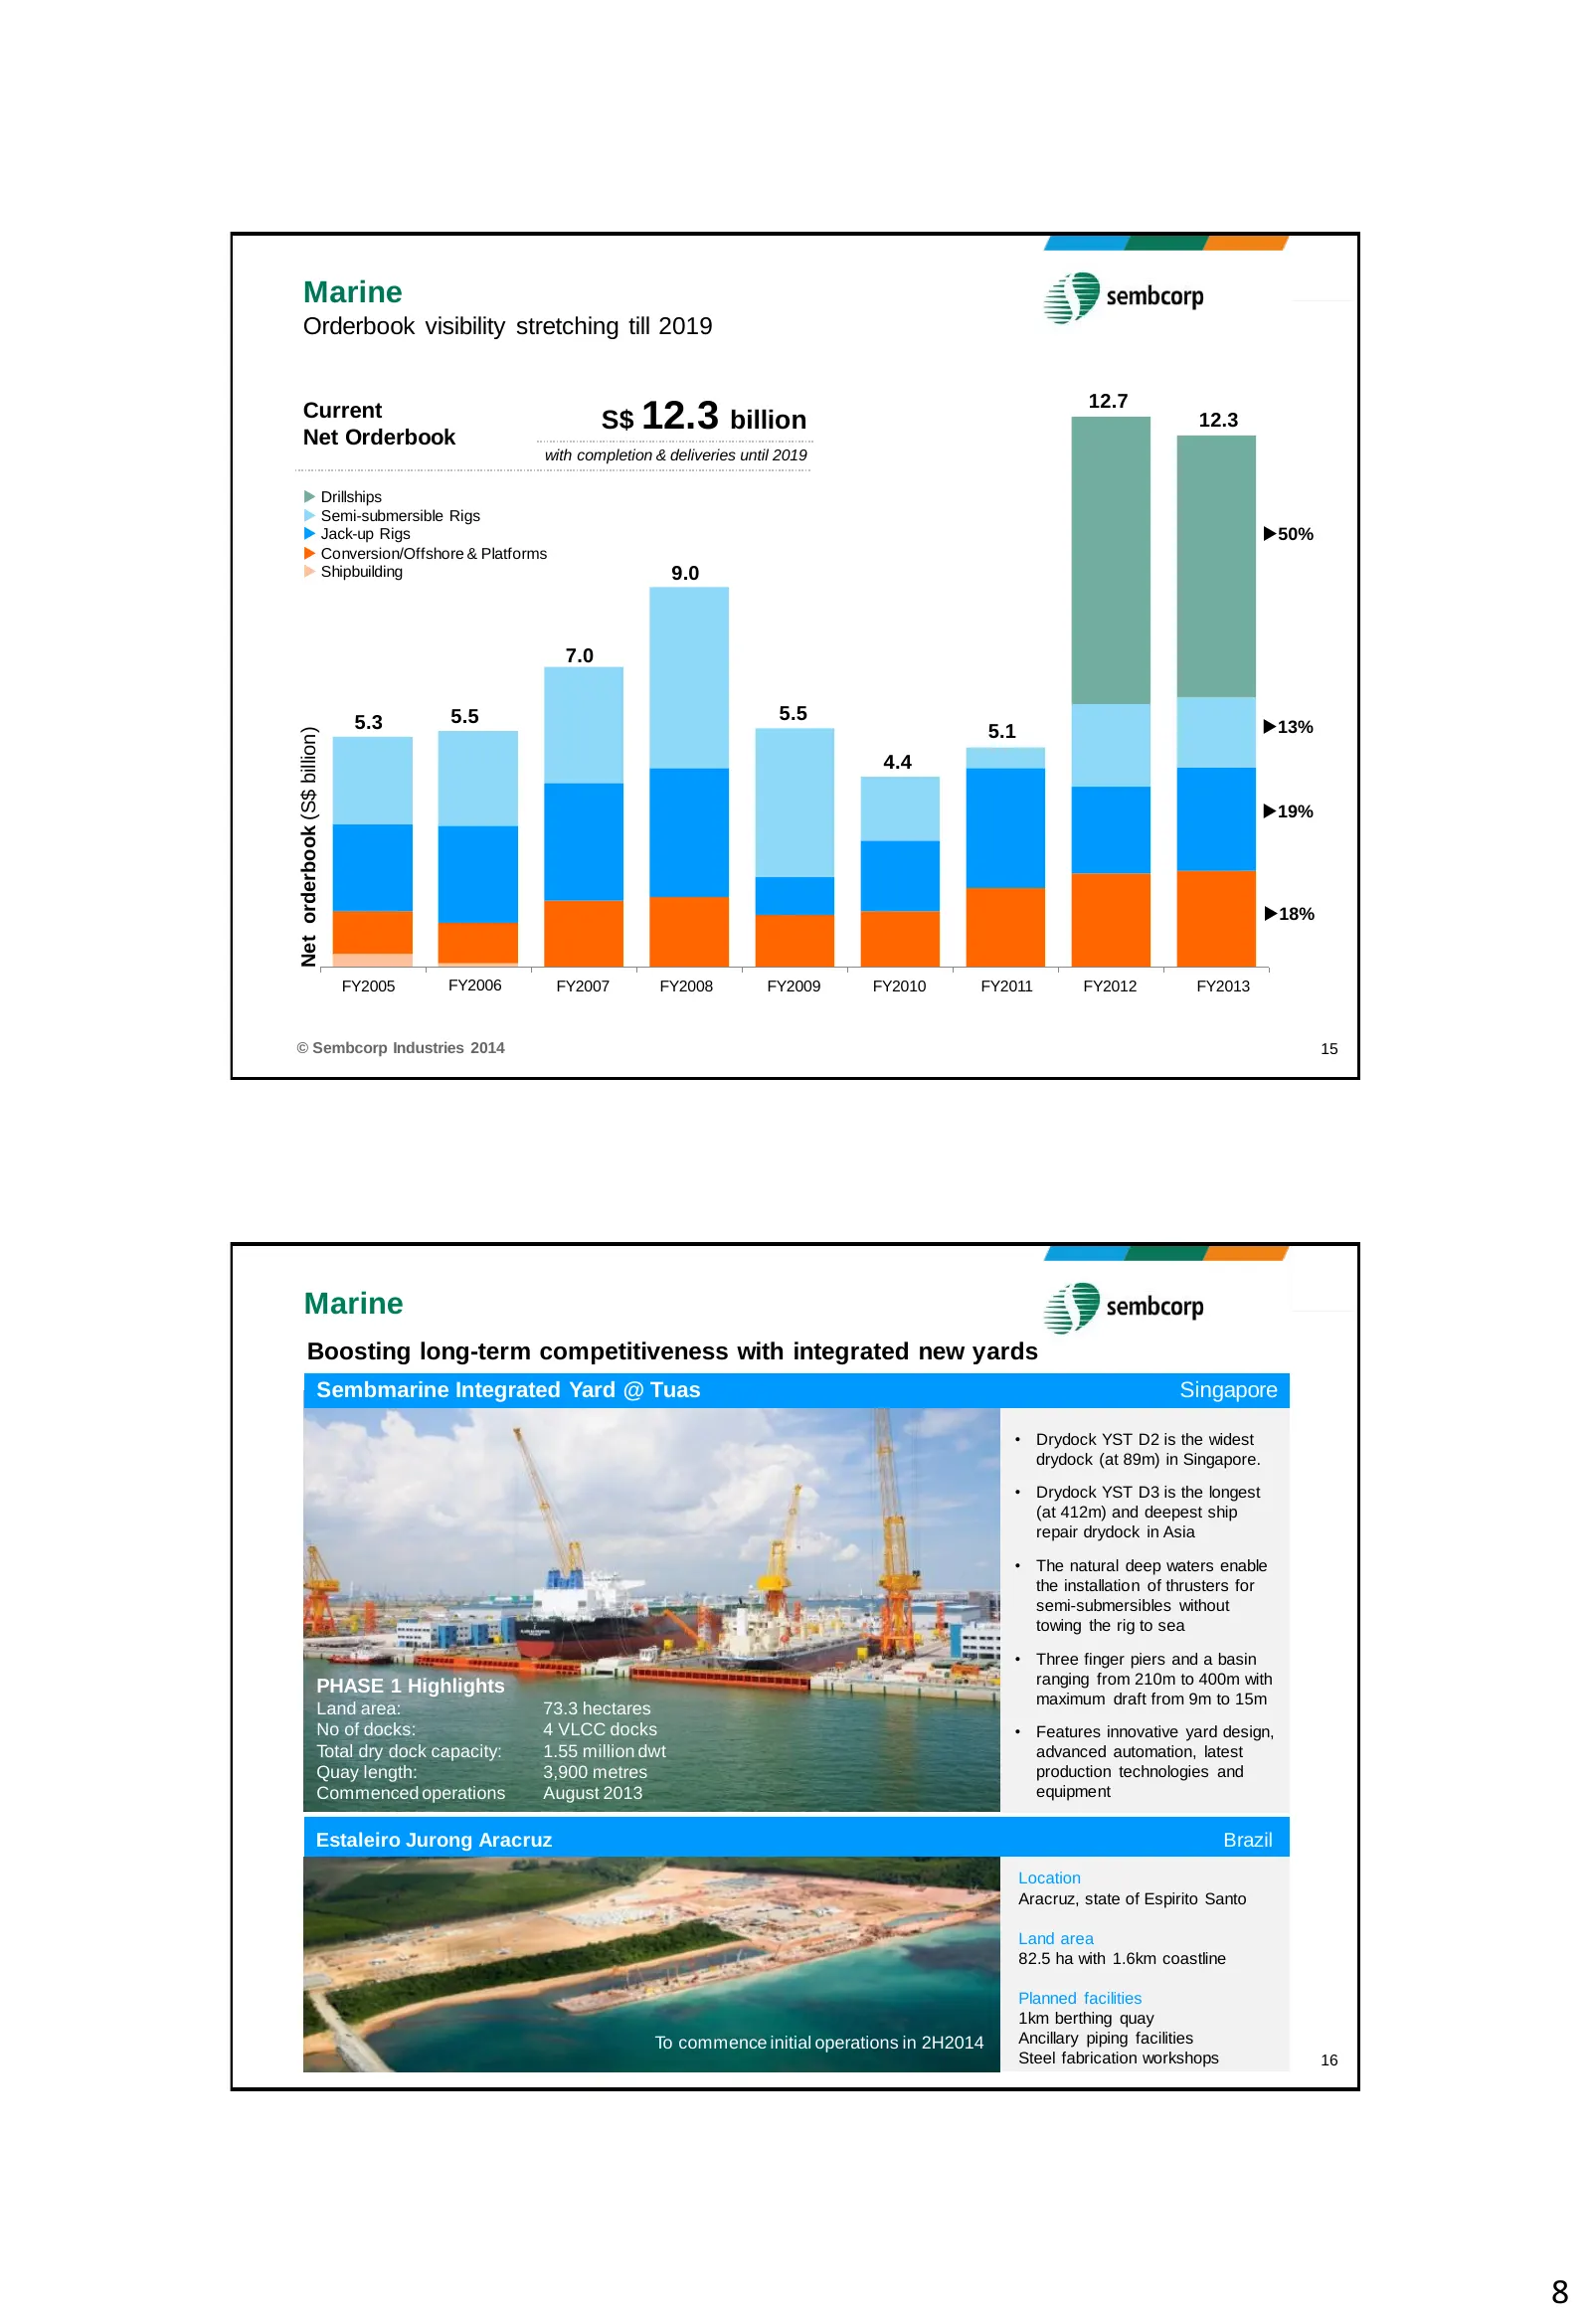
Marine Orderbook visibility stretching till 2019 12.7 Current S$ 12.3 billion 12.3 Net Orderbook with completion & deliveries until 2019 Drillships Semi-submersible Rigs Jack-up Rigs 50% Conversion/Offshore & Platforms Shipbuilding 9.0 7.0 5.3 5.5 5.5 5.1 13% Net orderbook (S$ billion) 4
Slide 9: Urban Development: Maiden Profits from New Projects
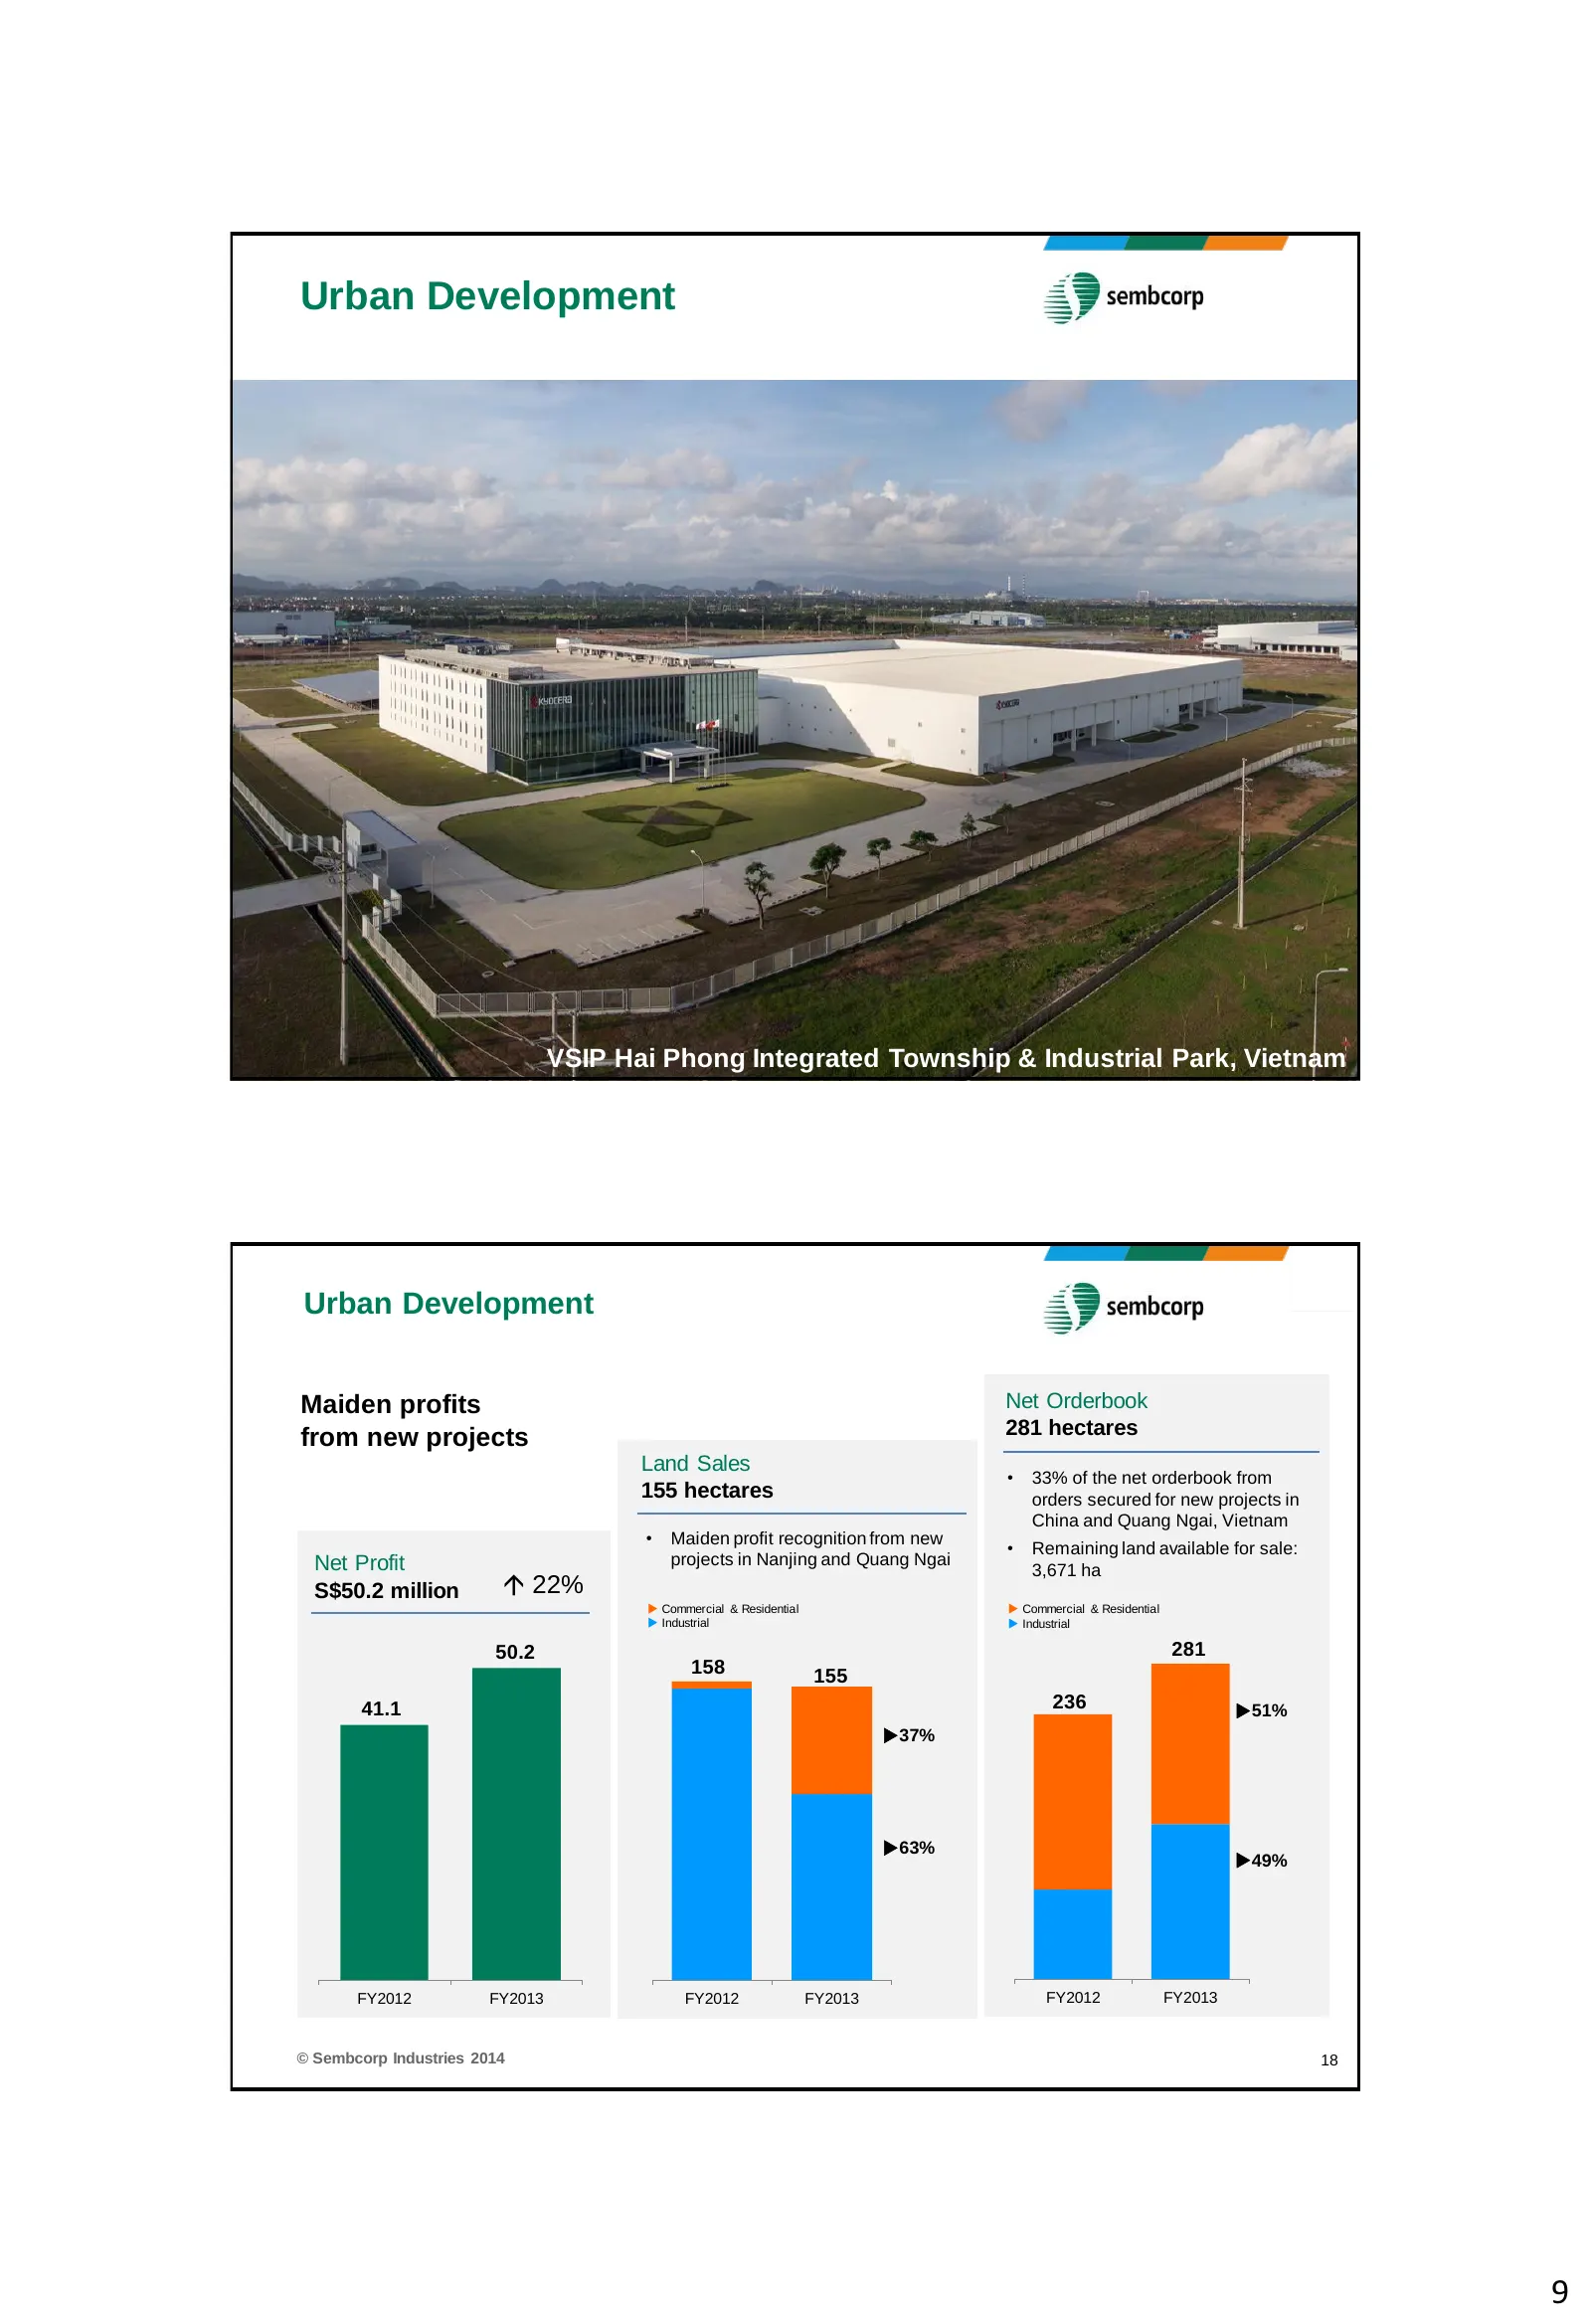
Urban Development © Sembcorp Industries 2014 17 VSIP Hai Phong Integrated Township & Industrial Park, Vietnam Urban Development Maiden profits Net Orderbook from new projects 281 hectares Land Sales • 33% of the net orderbook from 155 hectares orders secured for new projects in China and Quang Ngai,
Slide 10: Financial Review
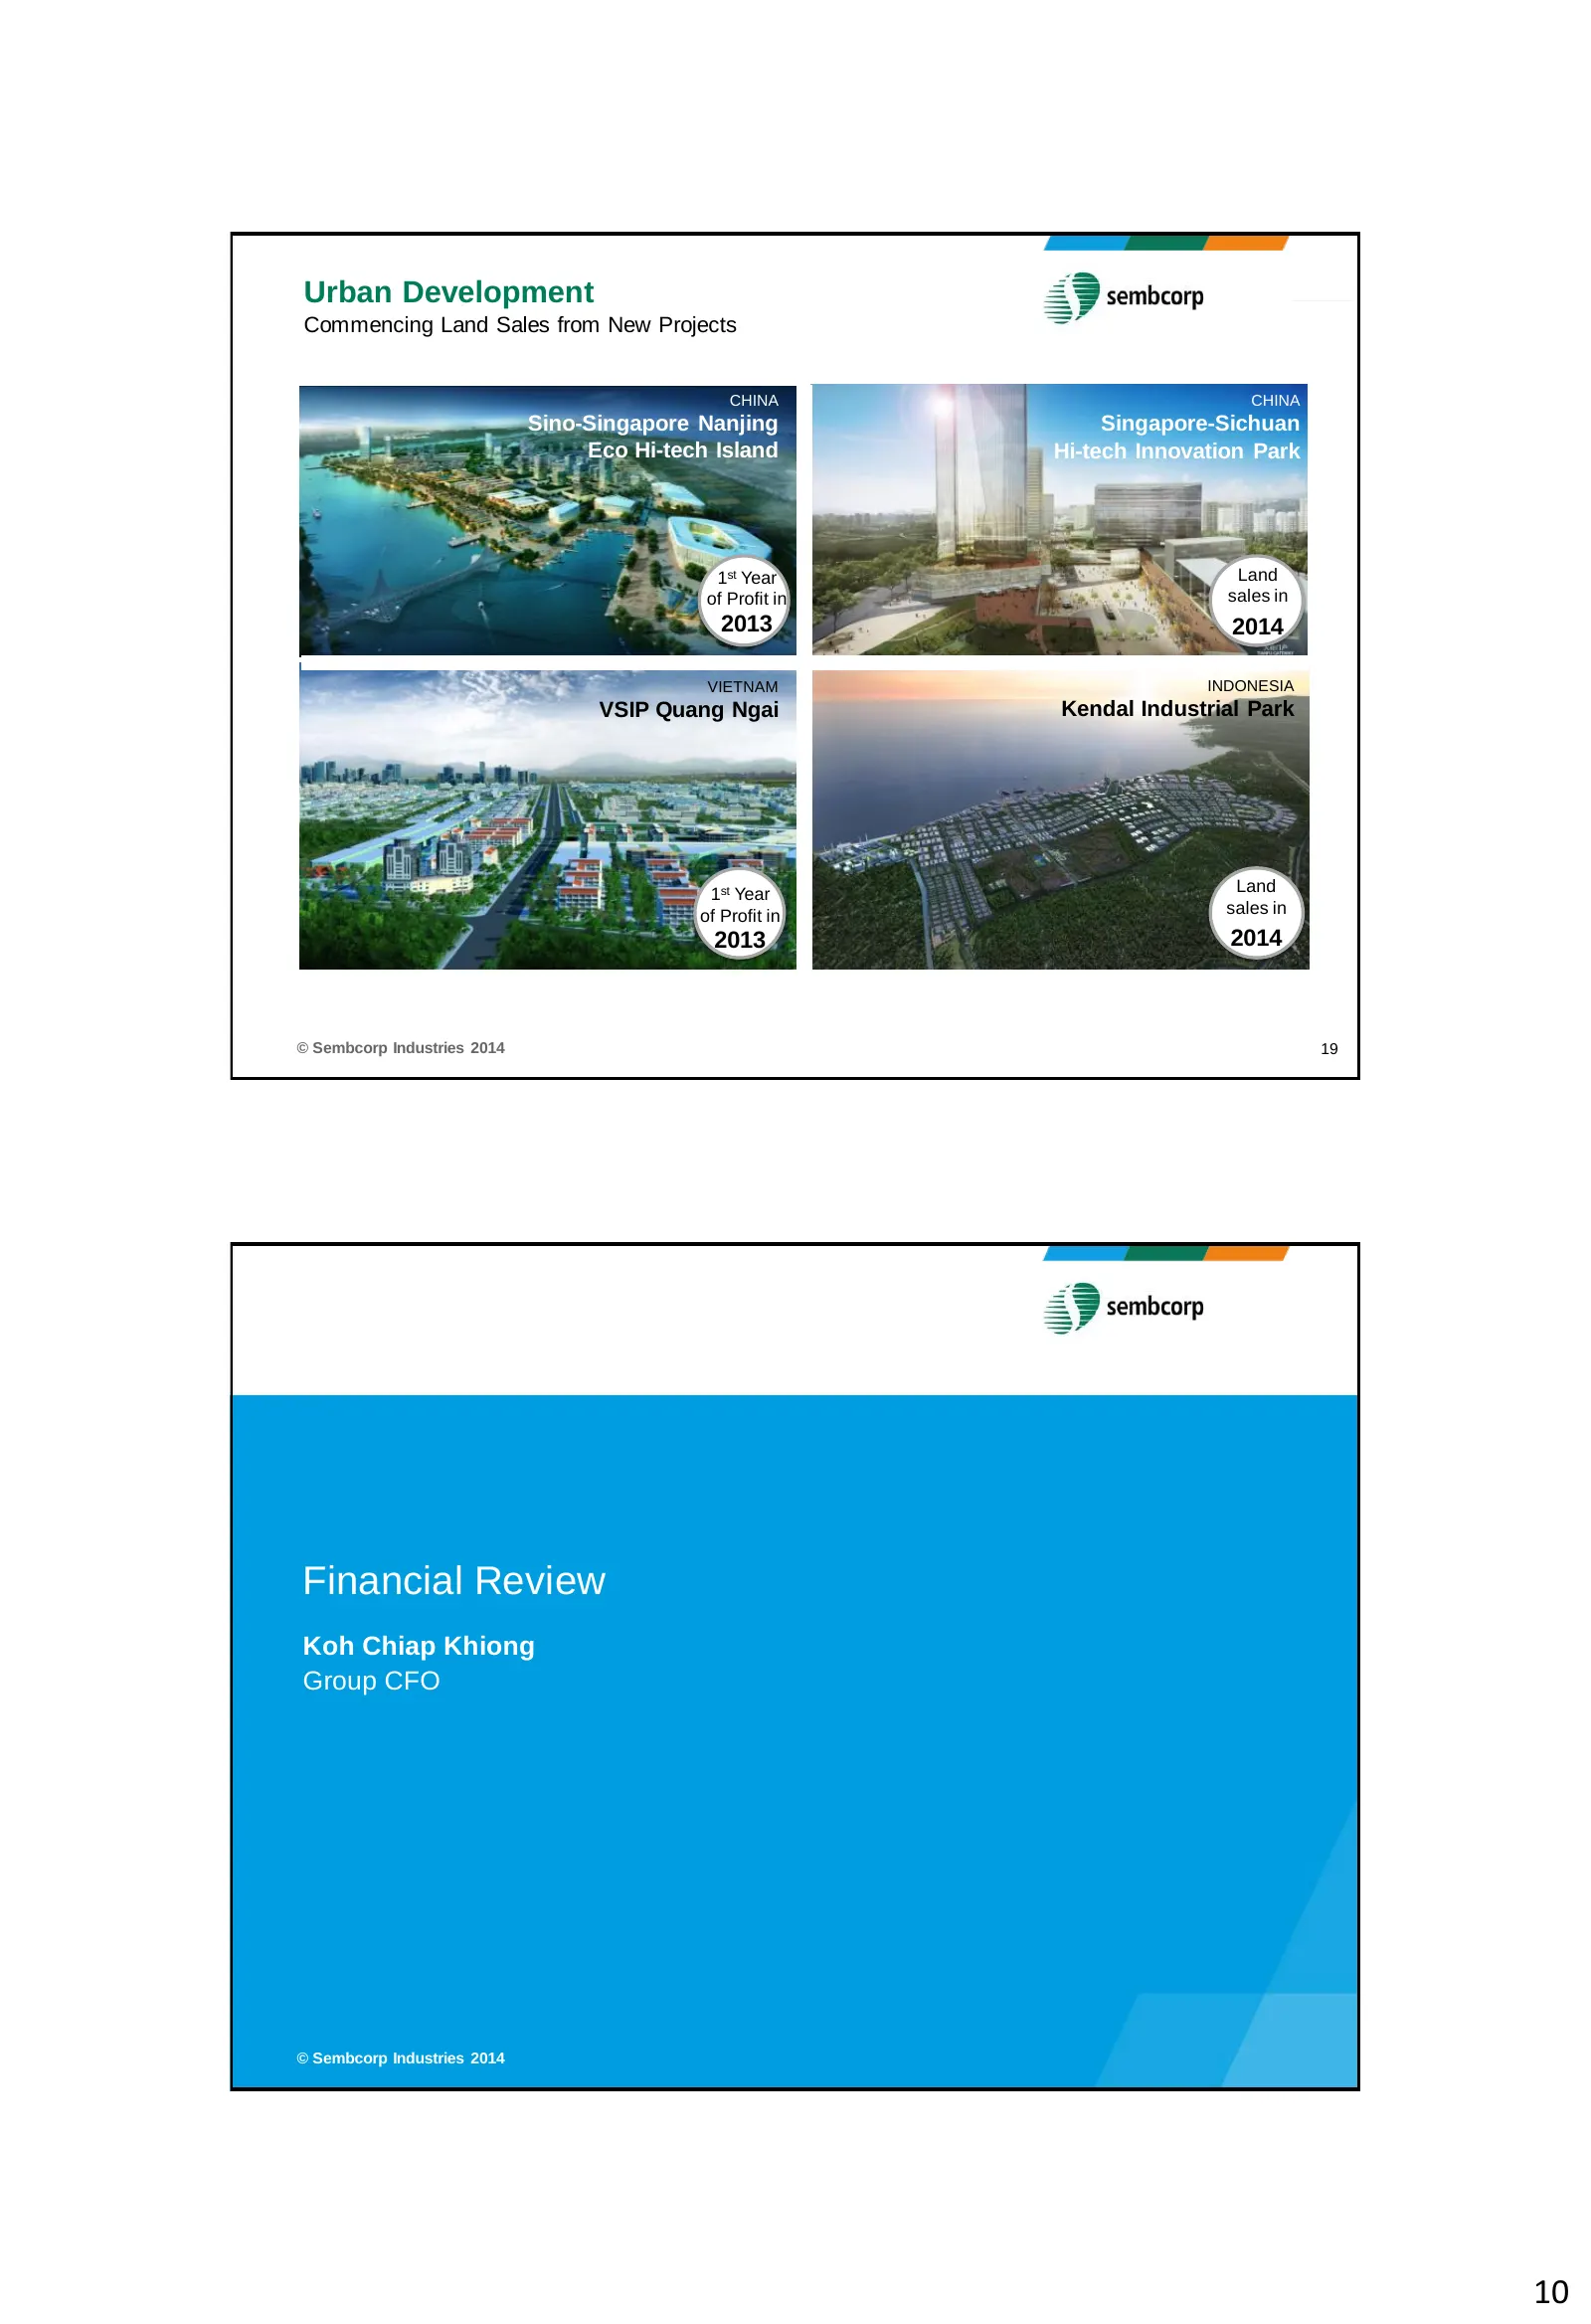
Urban Development Commencing Land Sales from New Projects CHINA CHINA Sino-Singapore Nanjing Singapore-Sichuan Eco Hi-tech Island Hi-tech Innovation Park 1st Year Land of Profit in sales in 2013 2014 VIETNAM INDONESIA VSIP Quang Ngai Kendal Industrial Park 1st Year Land of Profit in sales in 2013 20
Slide 11: Group Profit & Loss and Group Turnover
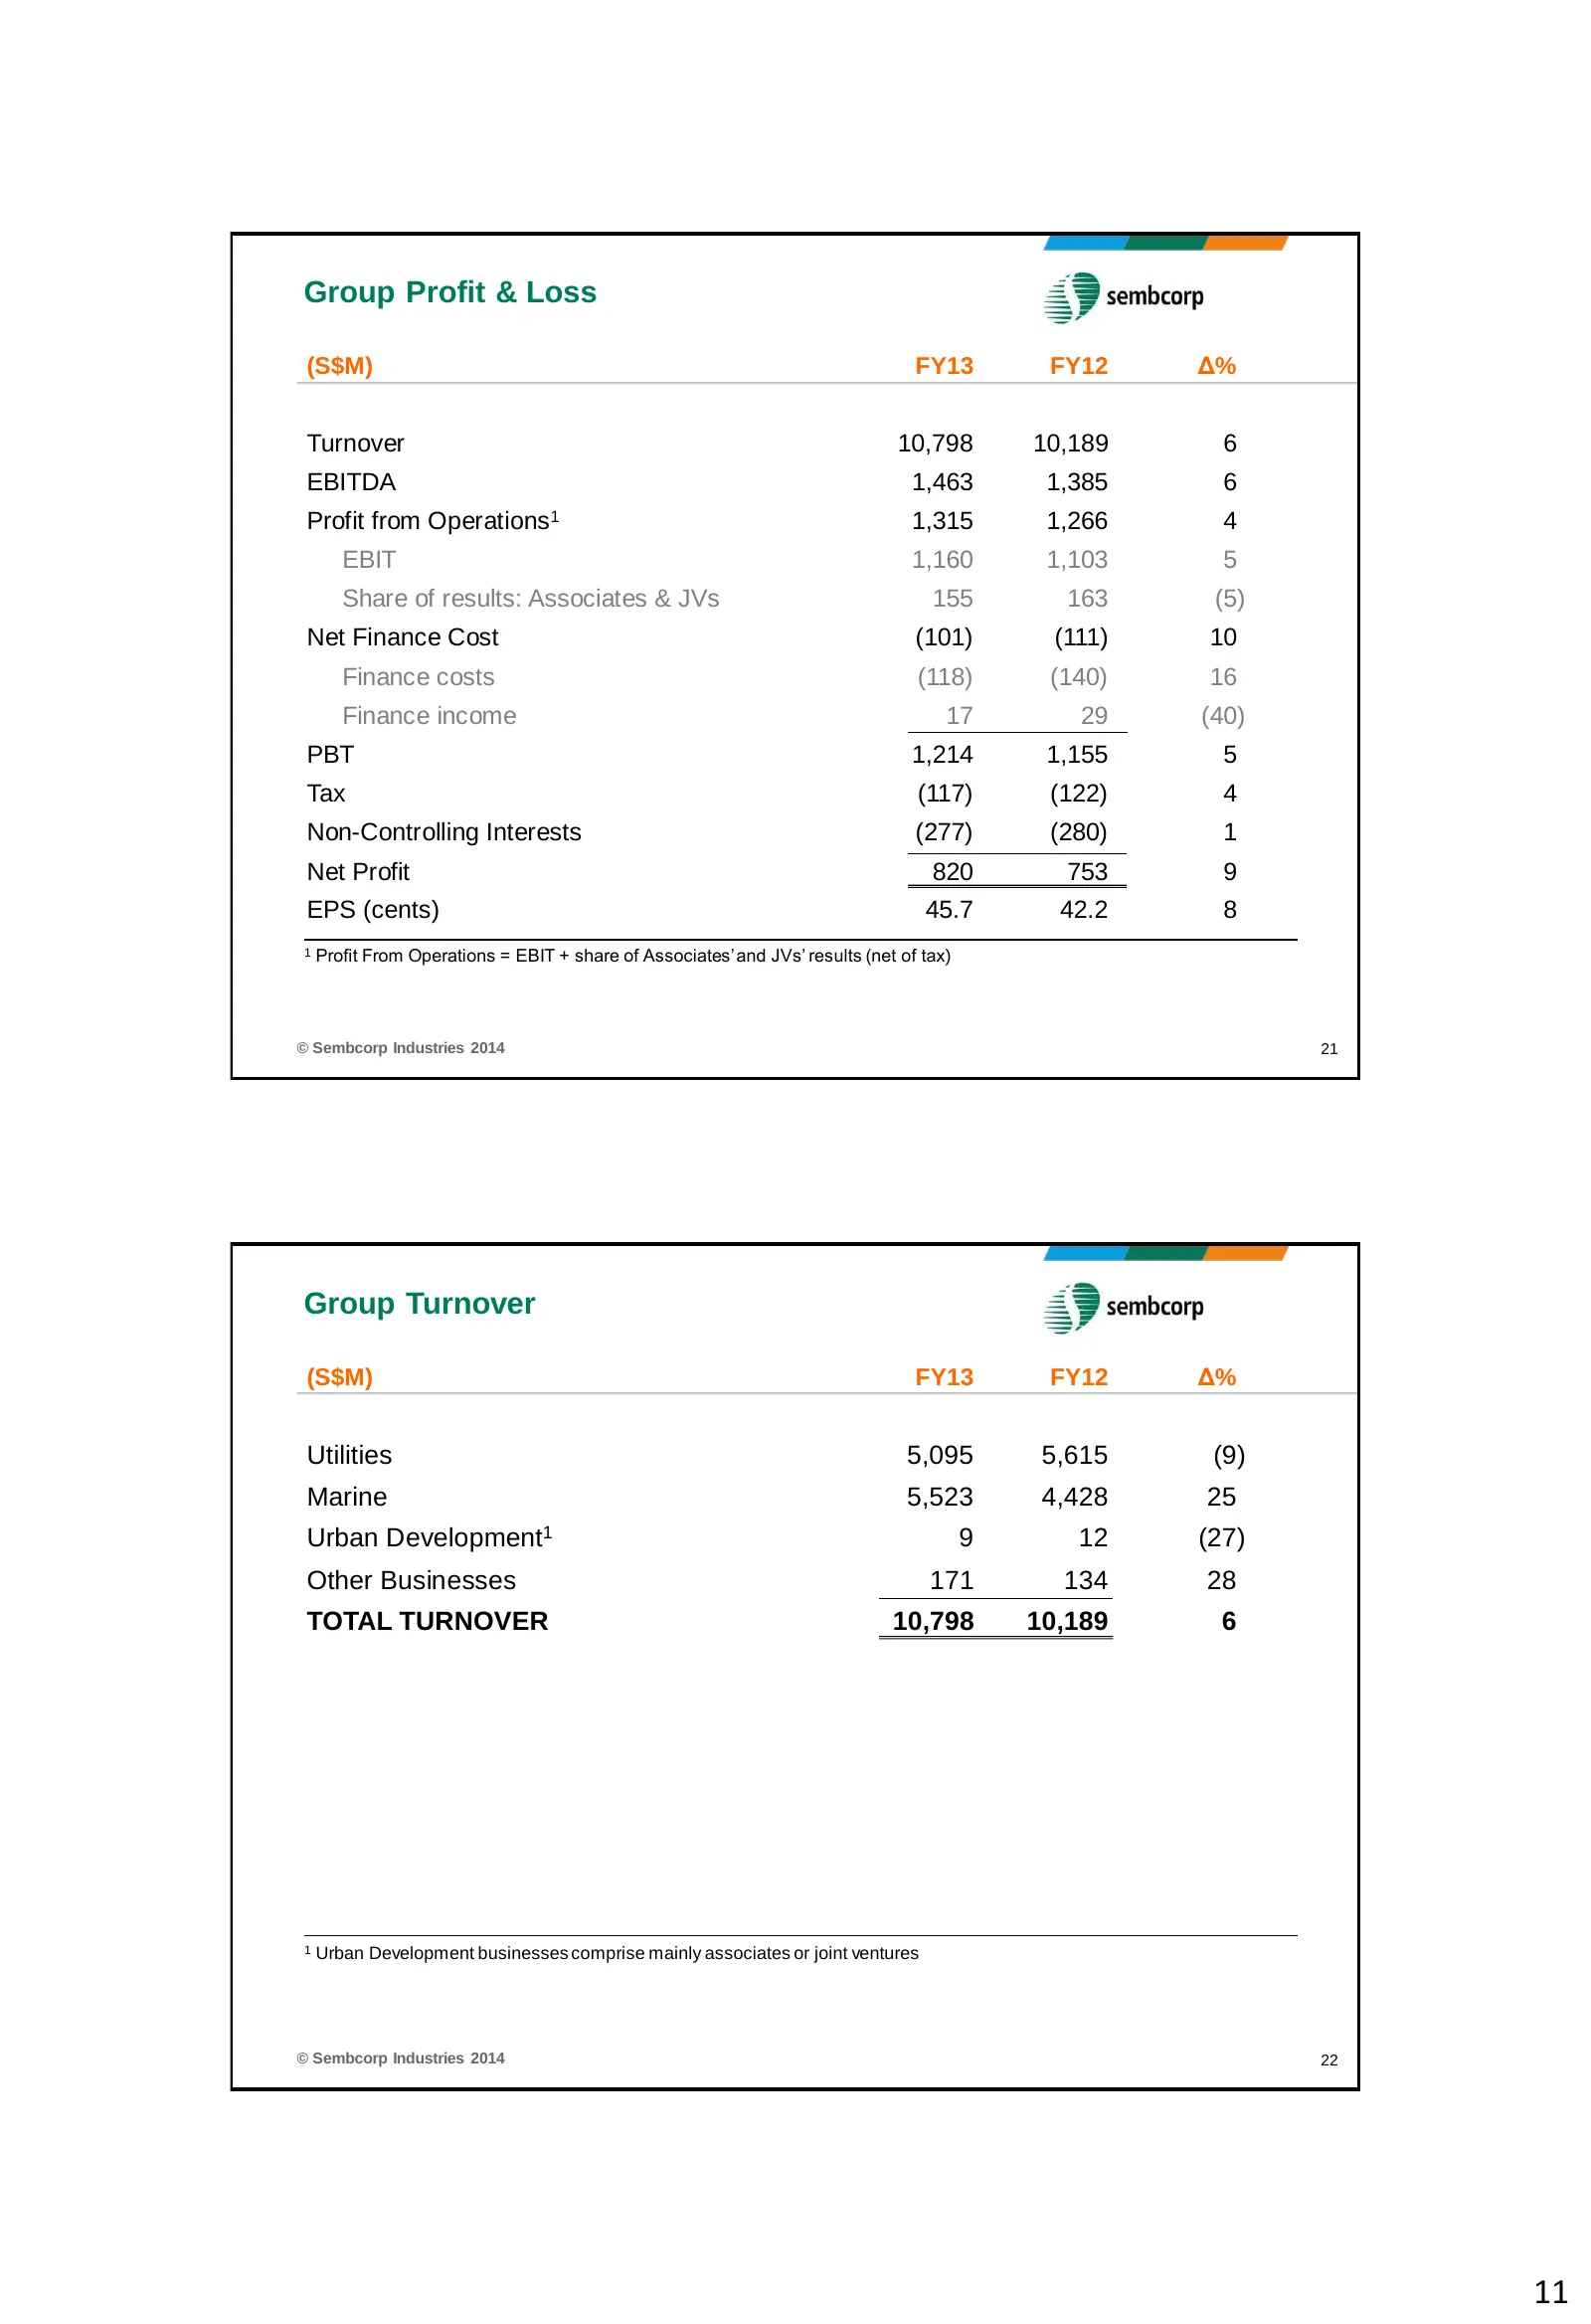
Group Profit & Loss (S$M) FY13 FY12 Δ% Turnover 10,798 10,189 6 EBITDA 1,463 1,385 6 Profit from Operations 1 1,315 1,266 4 EBIT 1,160 1,103 5 Share of results: Associates & JVs 155 163 (5) Net Finance Cost (101) (111) 10 Finance costs (118) (140) 16 Finance income 17 29 (40) PBT 1,214 1,155 5 Tax (
Slide 12: Group Profit from Operations and Net Profit
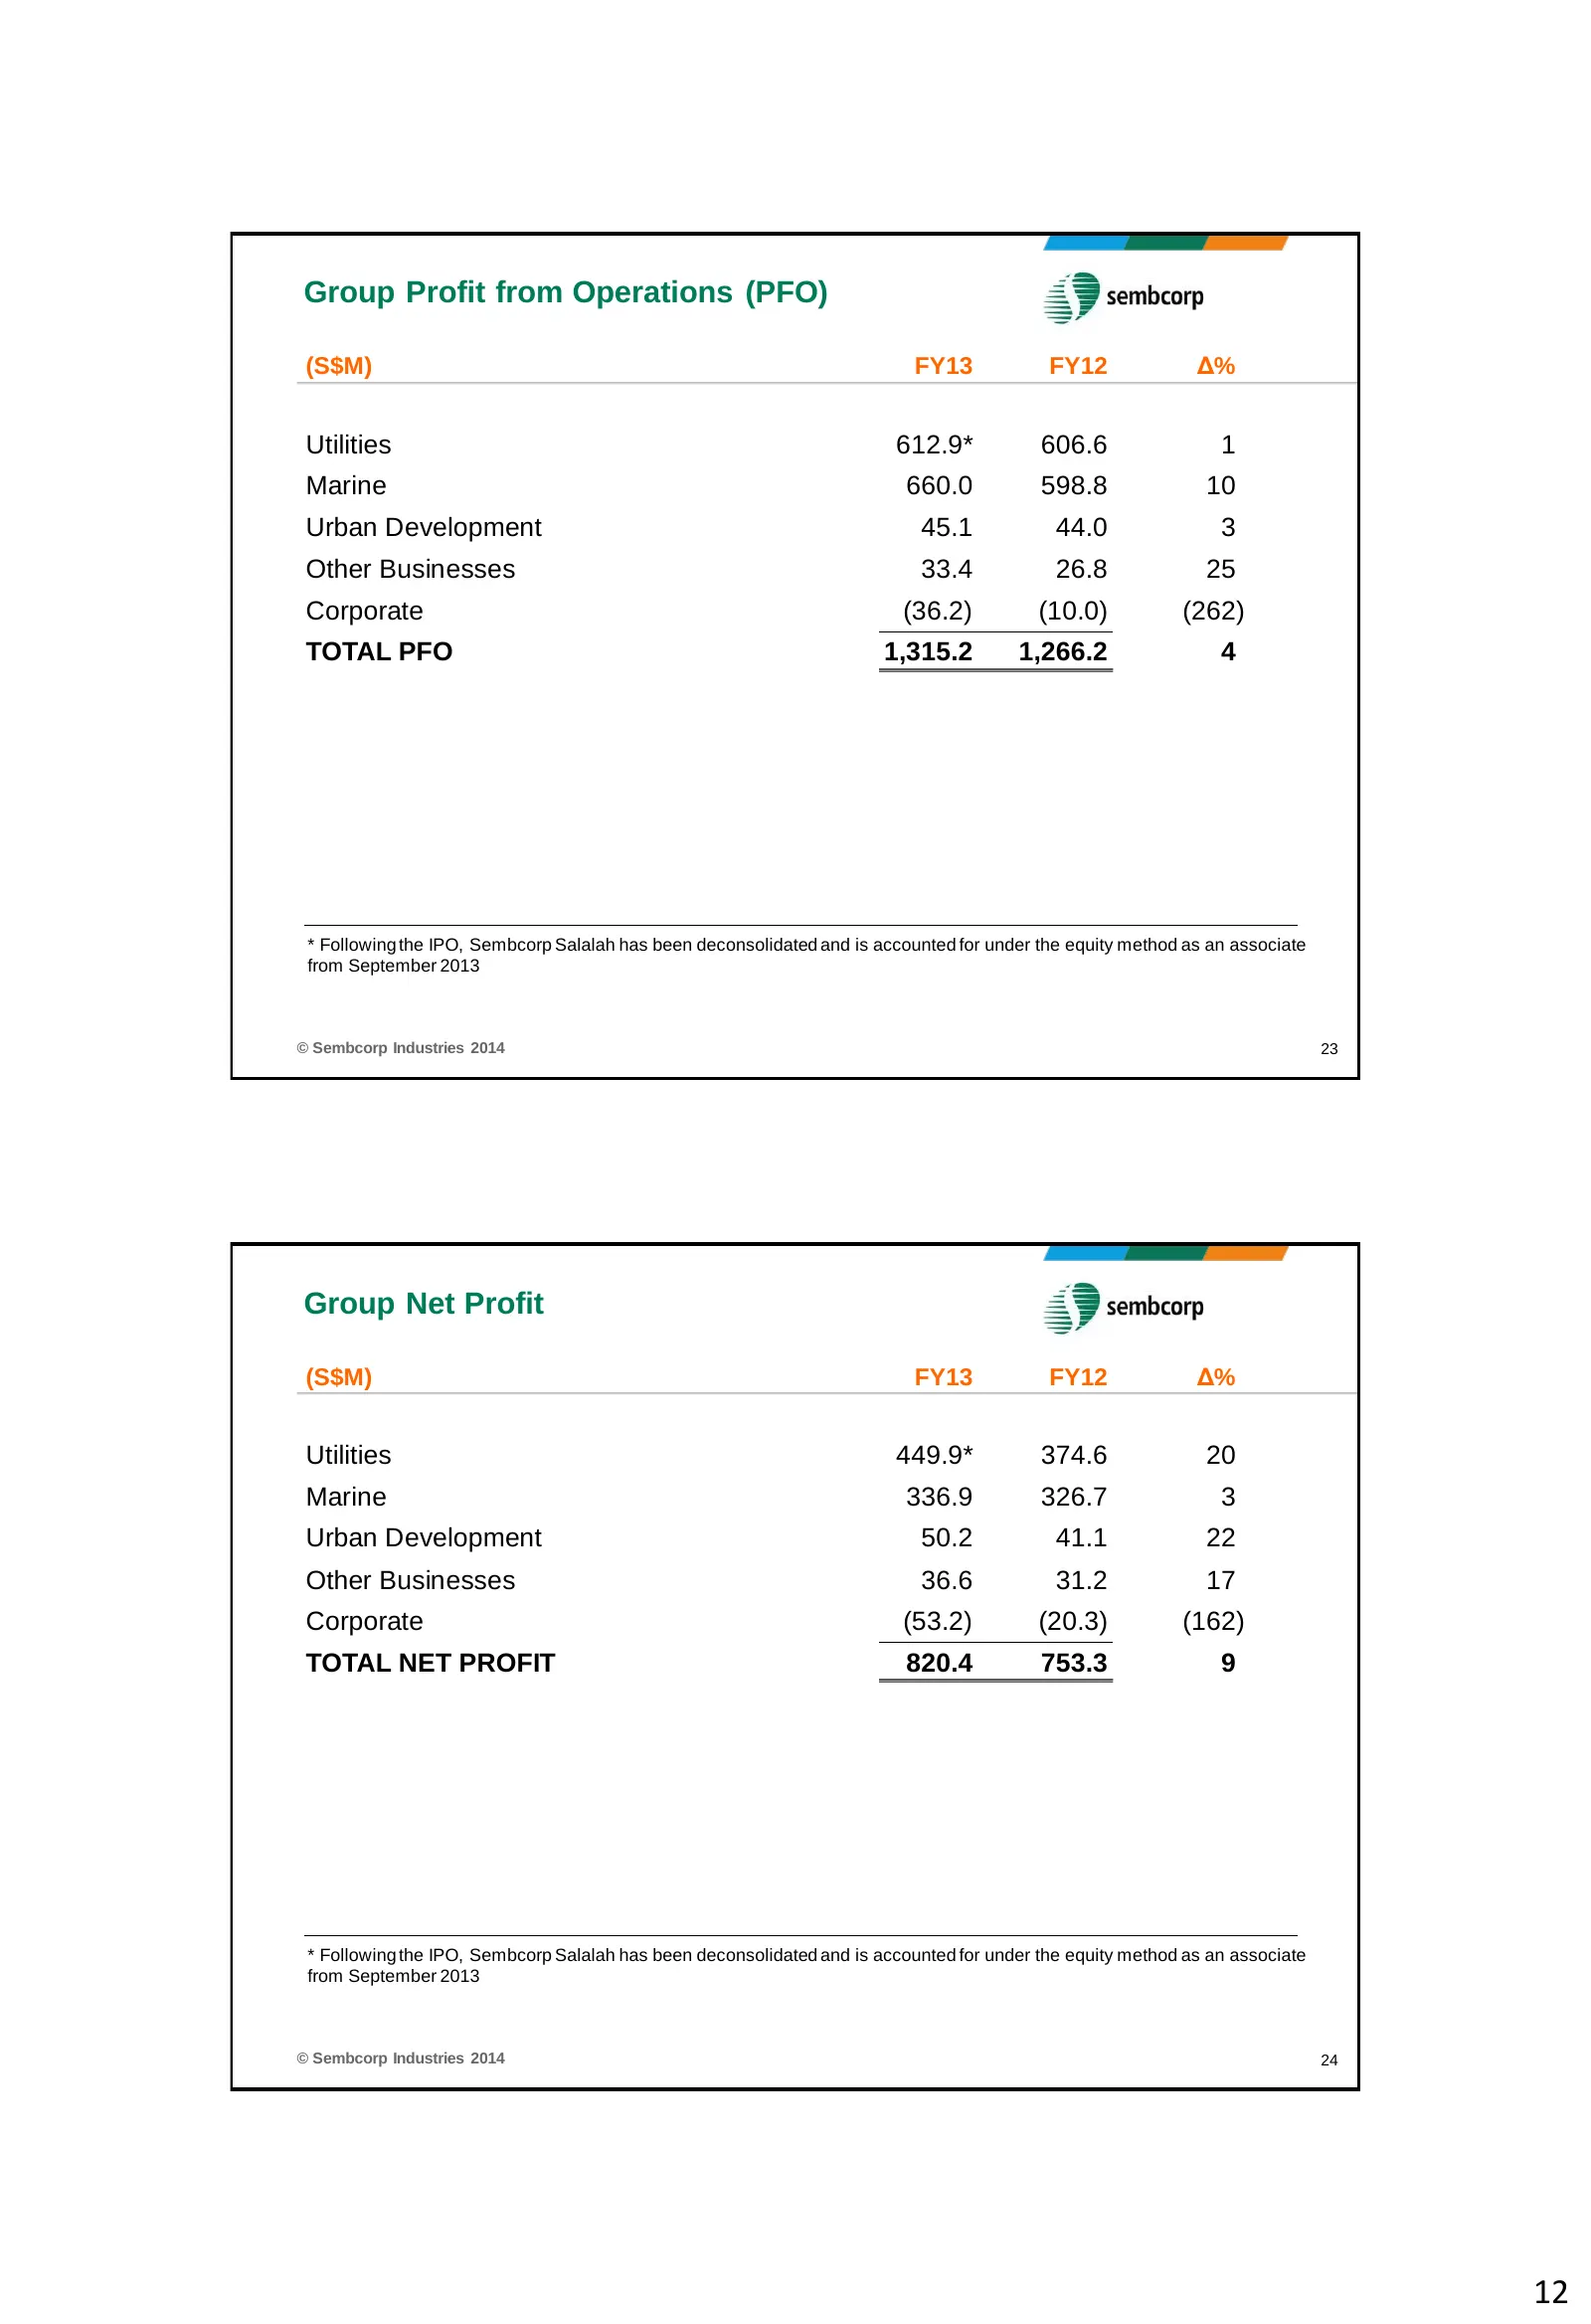
Group Profit from Operations (PFO) (S$M) FY13 FY12 Δ% Utilities 612.9* 606.6 1 Marine 660.0 598.8 10 Urban Development 45.1 44.0 3 Other Businesses 33.4 26.8 25 Corporate (36.2) (10.0) (262) TOTAL PFO 1,315.2 1,266.2 4 * Following the IPO, Sembcorp Salalah has been deconsolidated and is accounted fo
Slide 13: Utilities Net Profit
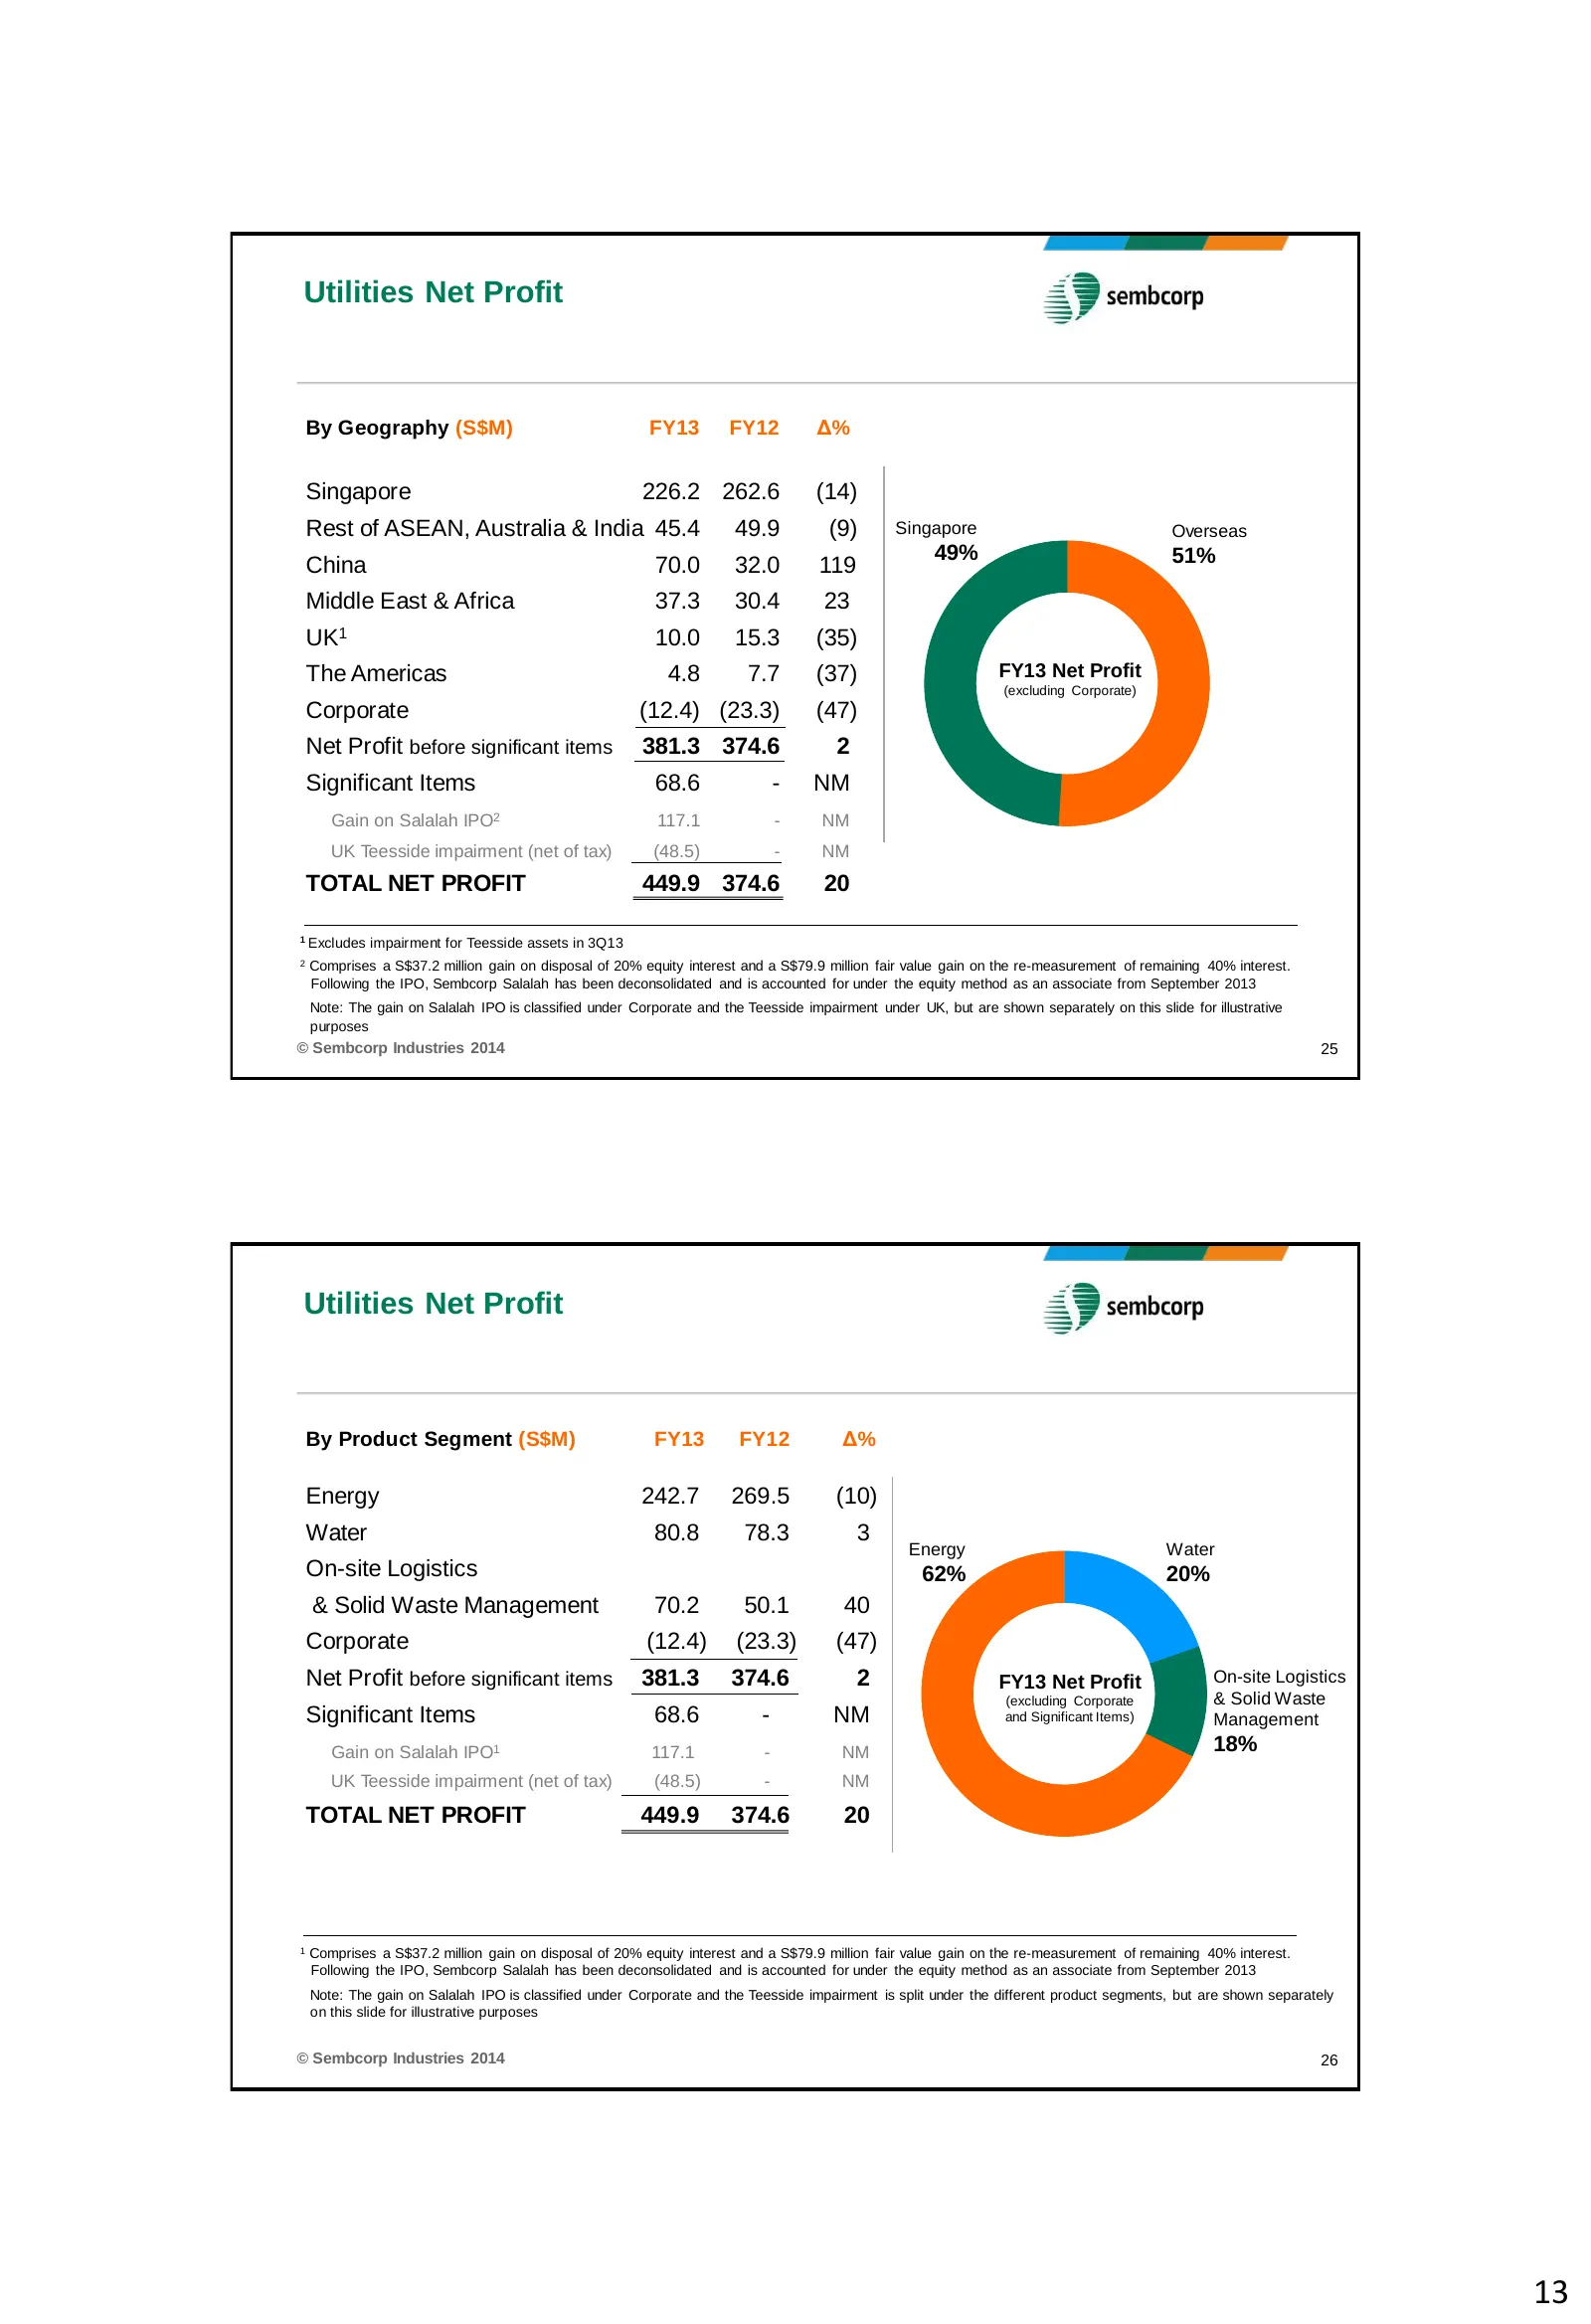
Utilities Net Profit By Geography (S$M) FY13 FY12 Δ% Singapore 226.2 262.6 (14) Rest of ASEAN, Australia & India 45.4 49.9 (9) Singapore Overseas 49% 51% China 70.0 32.0 119 Middle East & Africa 37.3 30.4 23 UK1 10.0 15.3 (35) The Americas 4.8 7.7 (37) FY13 Net Profit (excluding Corporate) Corporate
Slide 14: Group Capex, Equity Investment and Free Cash Flow
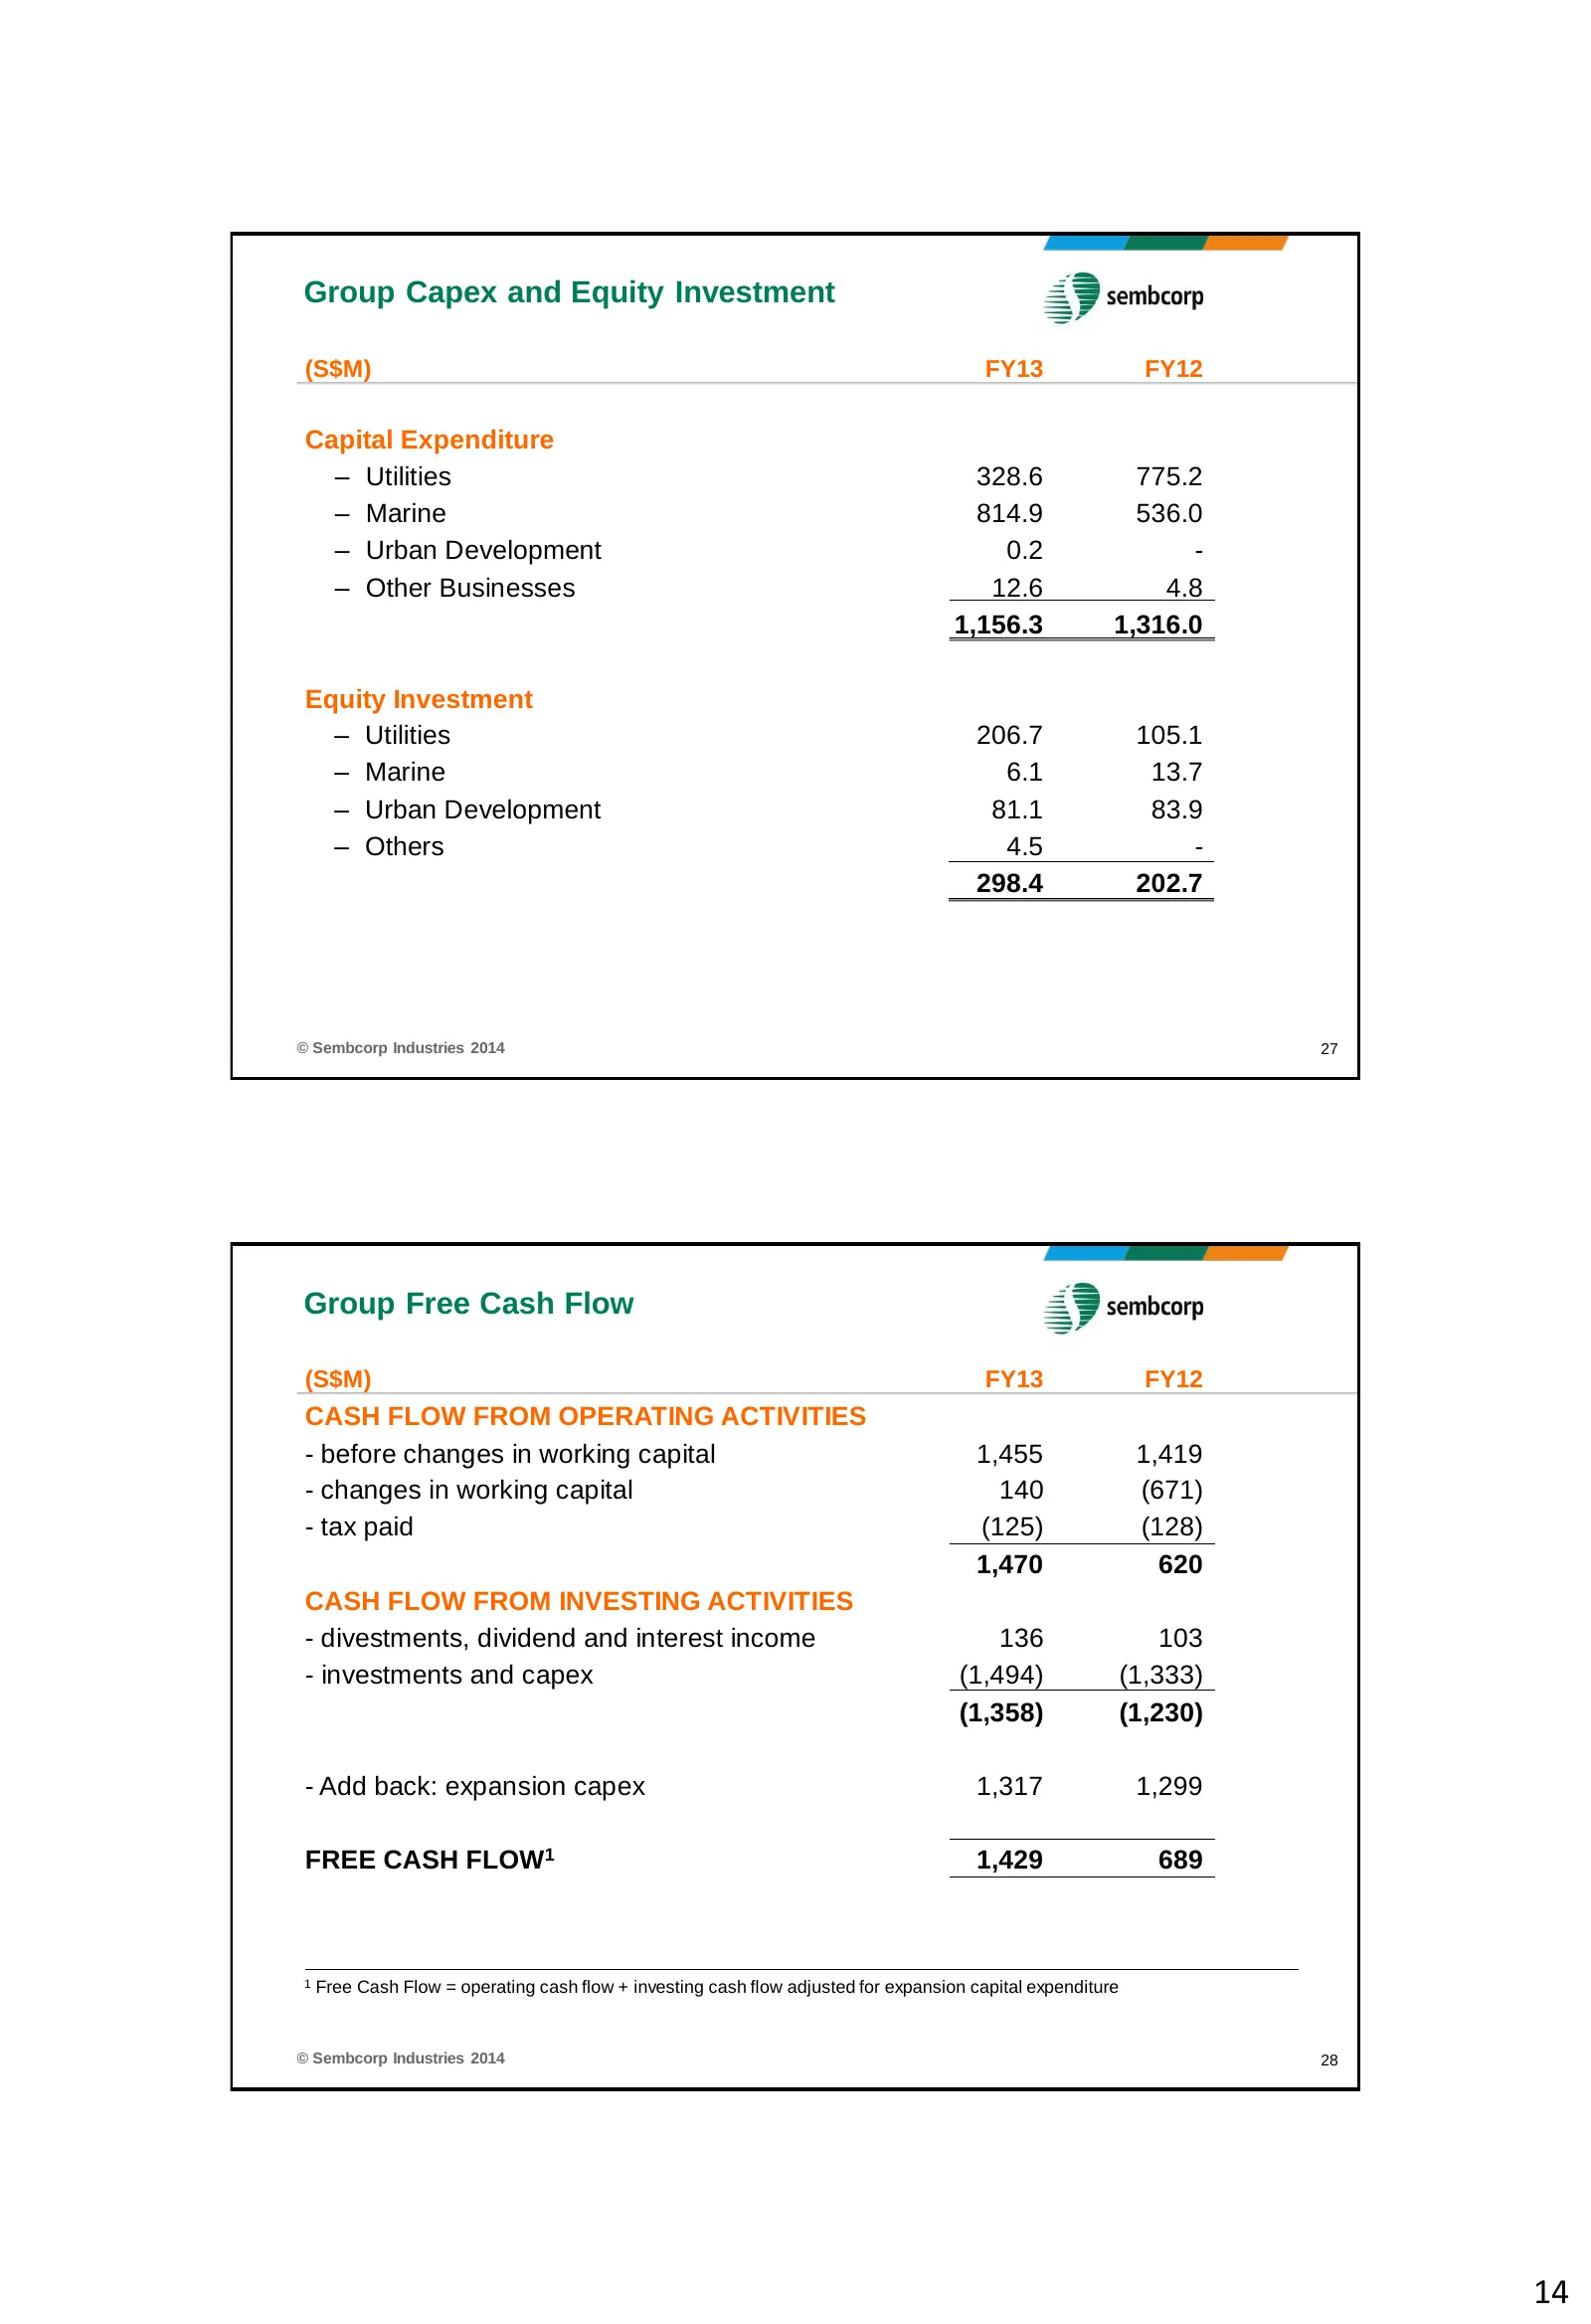
Group Capex and Equity Investment (S$M) FY13 FY12 Capital Expenditure – Utilities 328.6 775.2 – Marine 814.9 536.0 – Urban Development 0.2 - – Other Businesses 12.6 4.8 1,156.3 1,316.0 Equity Investment – Utilities 206.7 105.1 – Marine 6.1 13.7 – Urban Development 81.1 83.9 – Others 4.5 - 298.4 202.
Slide 15: Group Borrowings
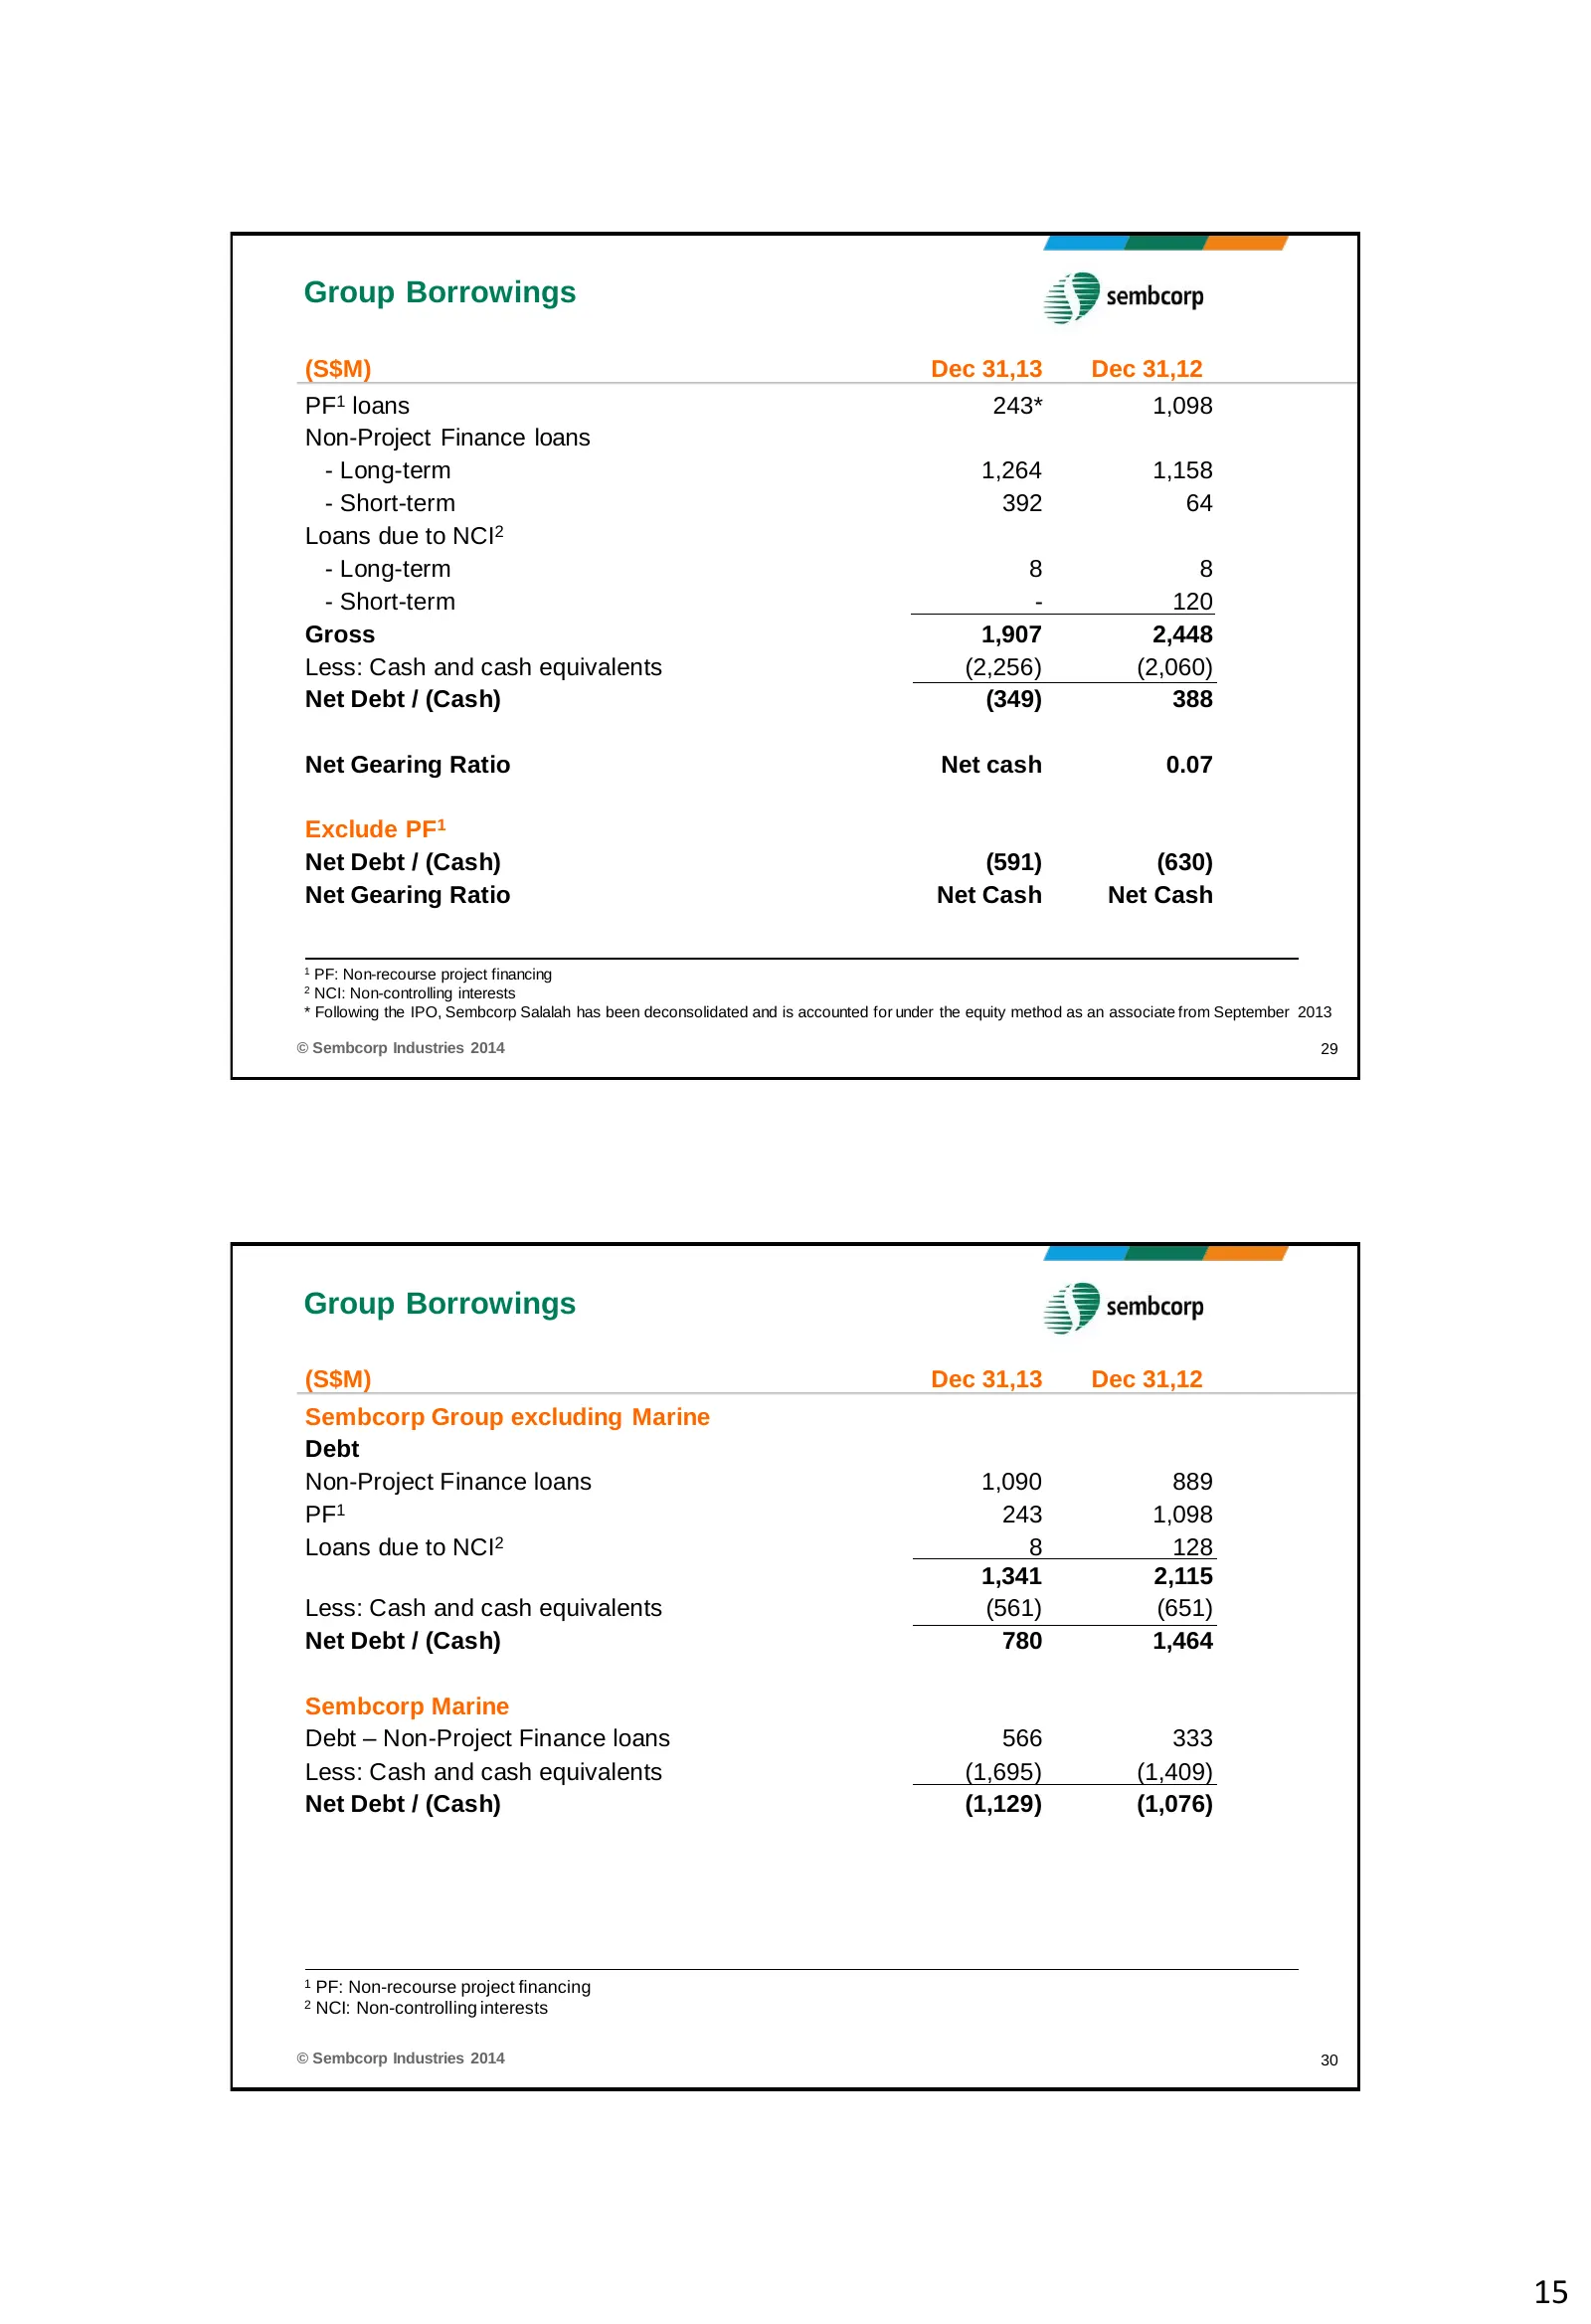
Group Borrowings (S$M) Dec 31,13 Dec 31,12 PF1 loans 243* 1,098 Non-Project Finance loans - Long-term 1,264 1,158 - Short-term 392 64 Loans due to NCI2 - Long-term 8 8 - Short-term - 120 Gross 1,907 2,448 Less: Cash and cash equivalents (2,256) (2,060) Net Debt / (Cash) (349) 388 Net Gearing Ratio N
Slide 16: Financial Indicators and Group Outlook
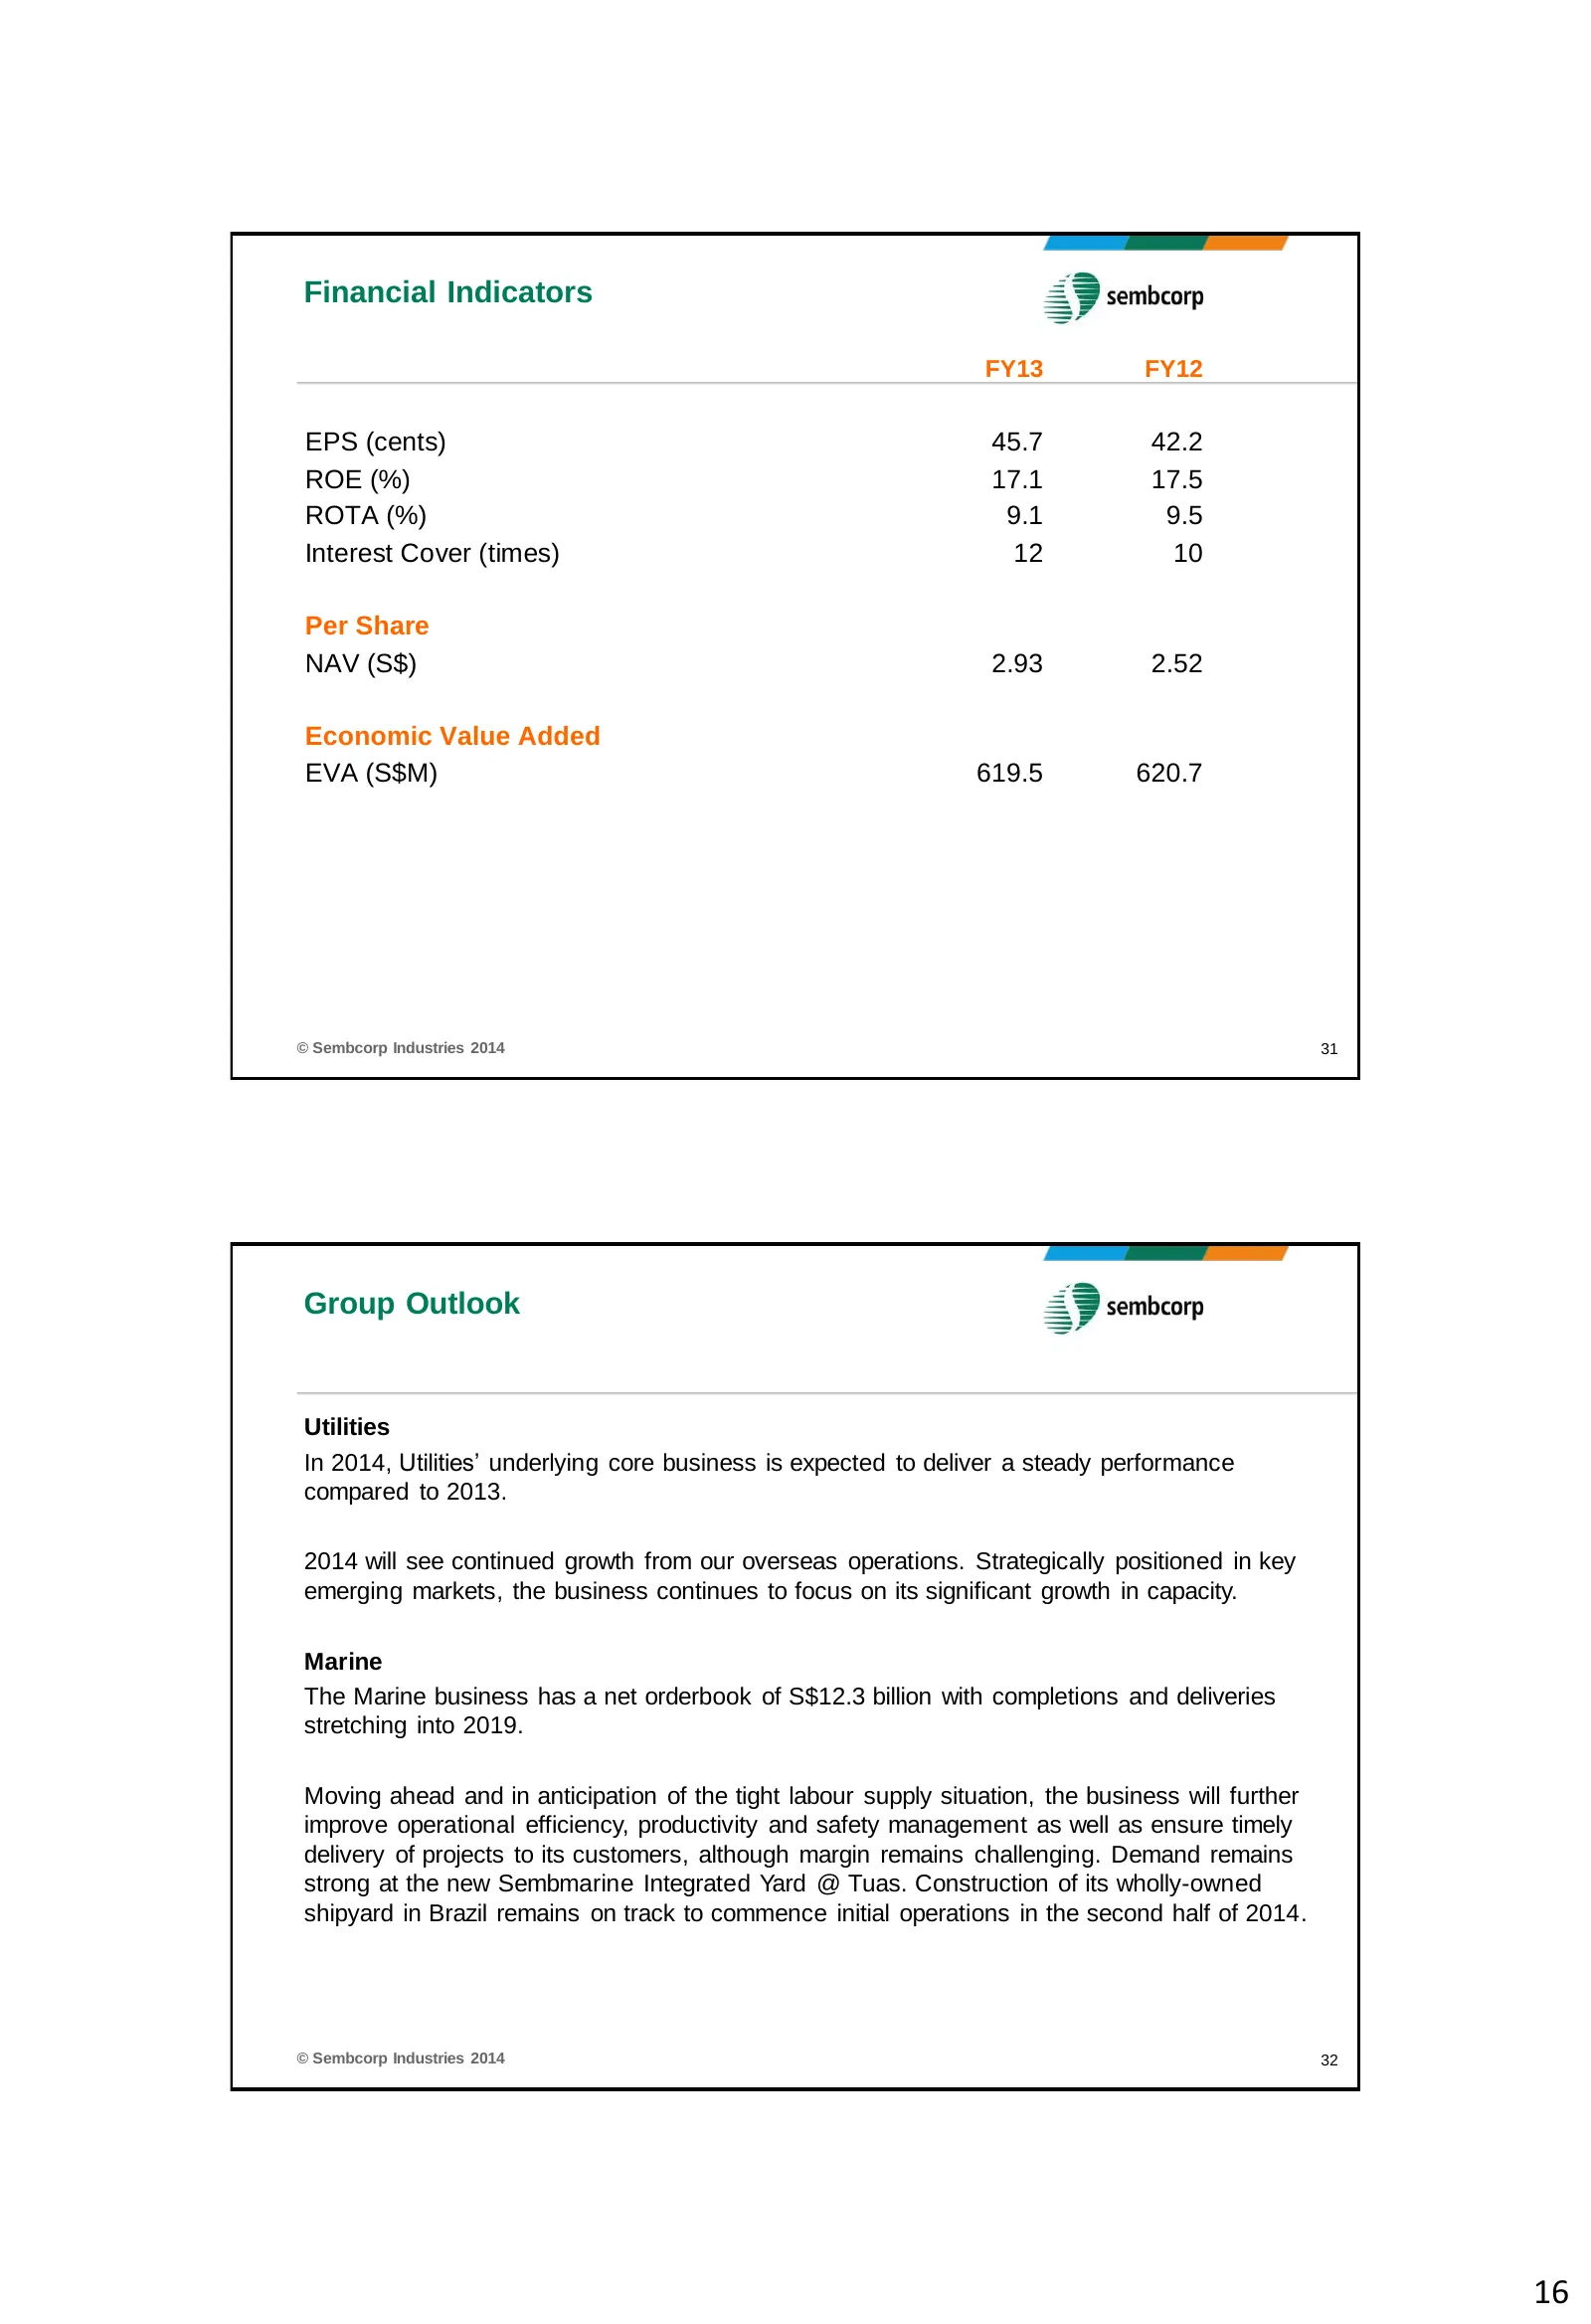
Financial Indicators FY13 FY12 EPS (cents) 45.7 42.2 ROE (%) 17.1 17.5 ROTA (%) 9.1 9.5 Interest Cover (times) 12 10 Per Share NAV (S$) 2.93 2.52 Economic Value Added EVA (S$M) 619.5 620.7 © Sembcorp Industries 2014 31 Group Outlook Utilities In 2014, Utilities’ underlying core business is expected
Slide 17: Group Outlook: Urban Development and Group
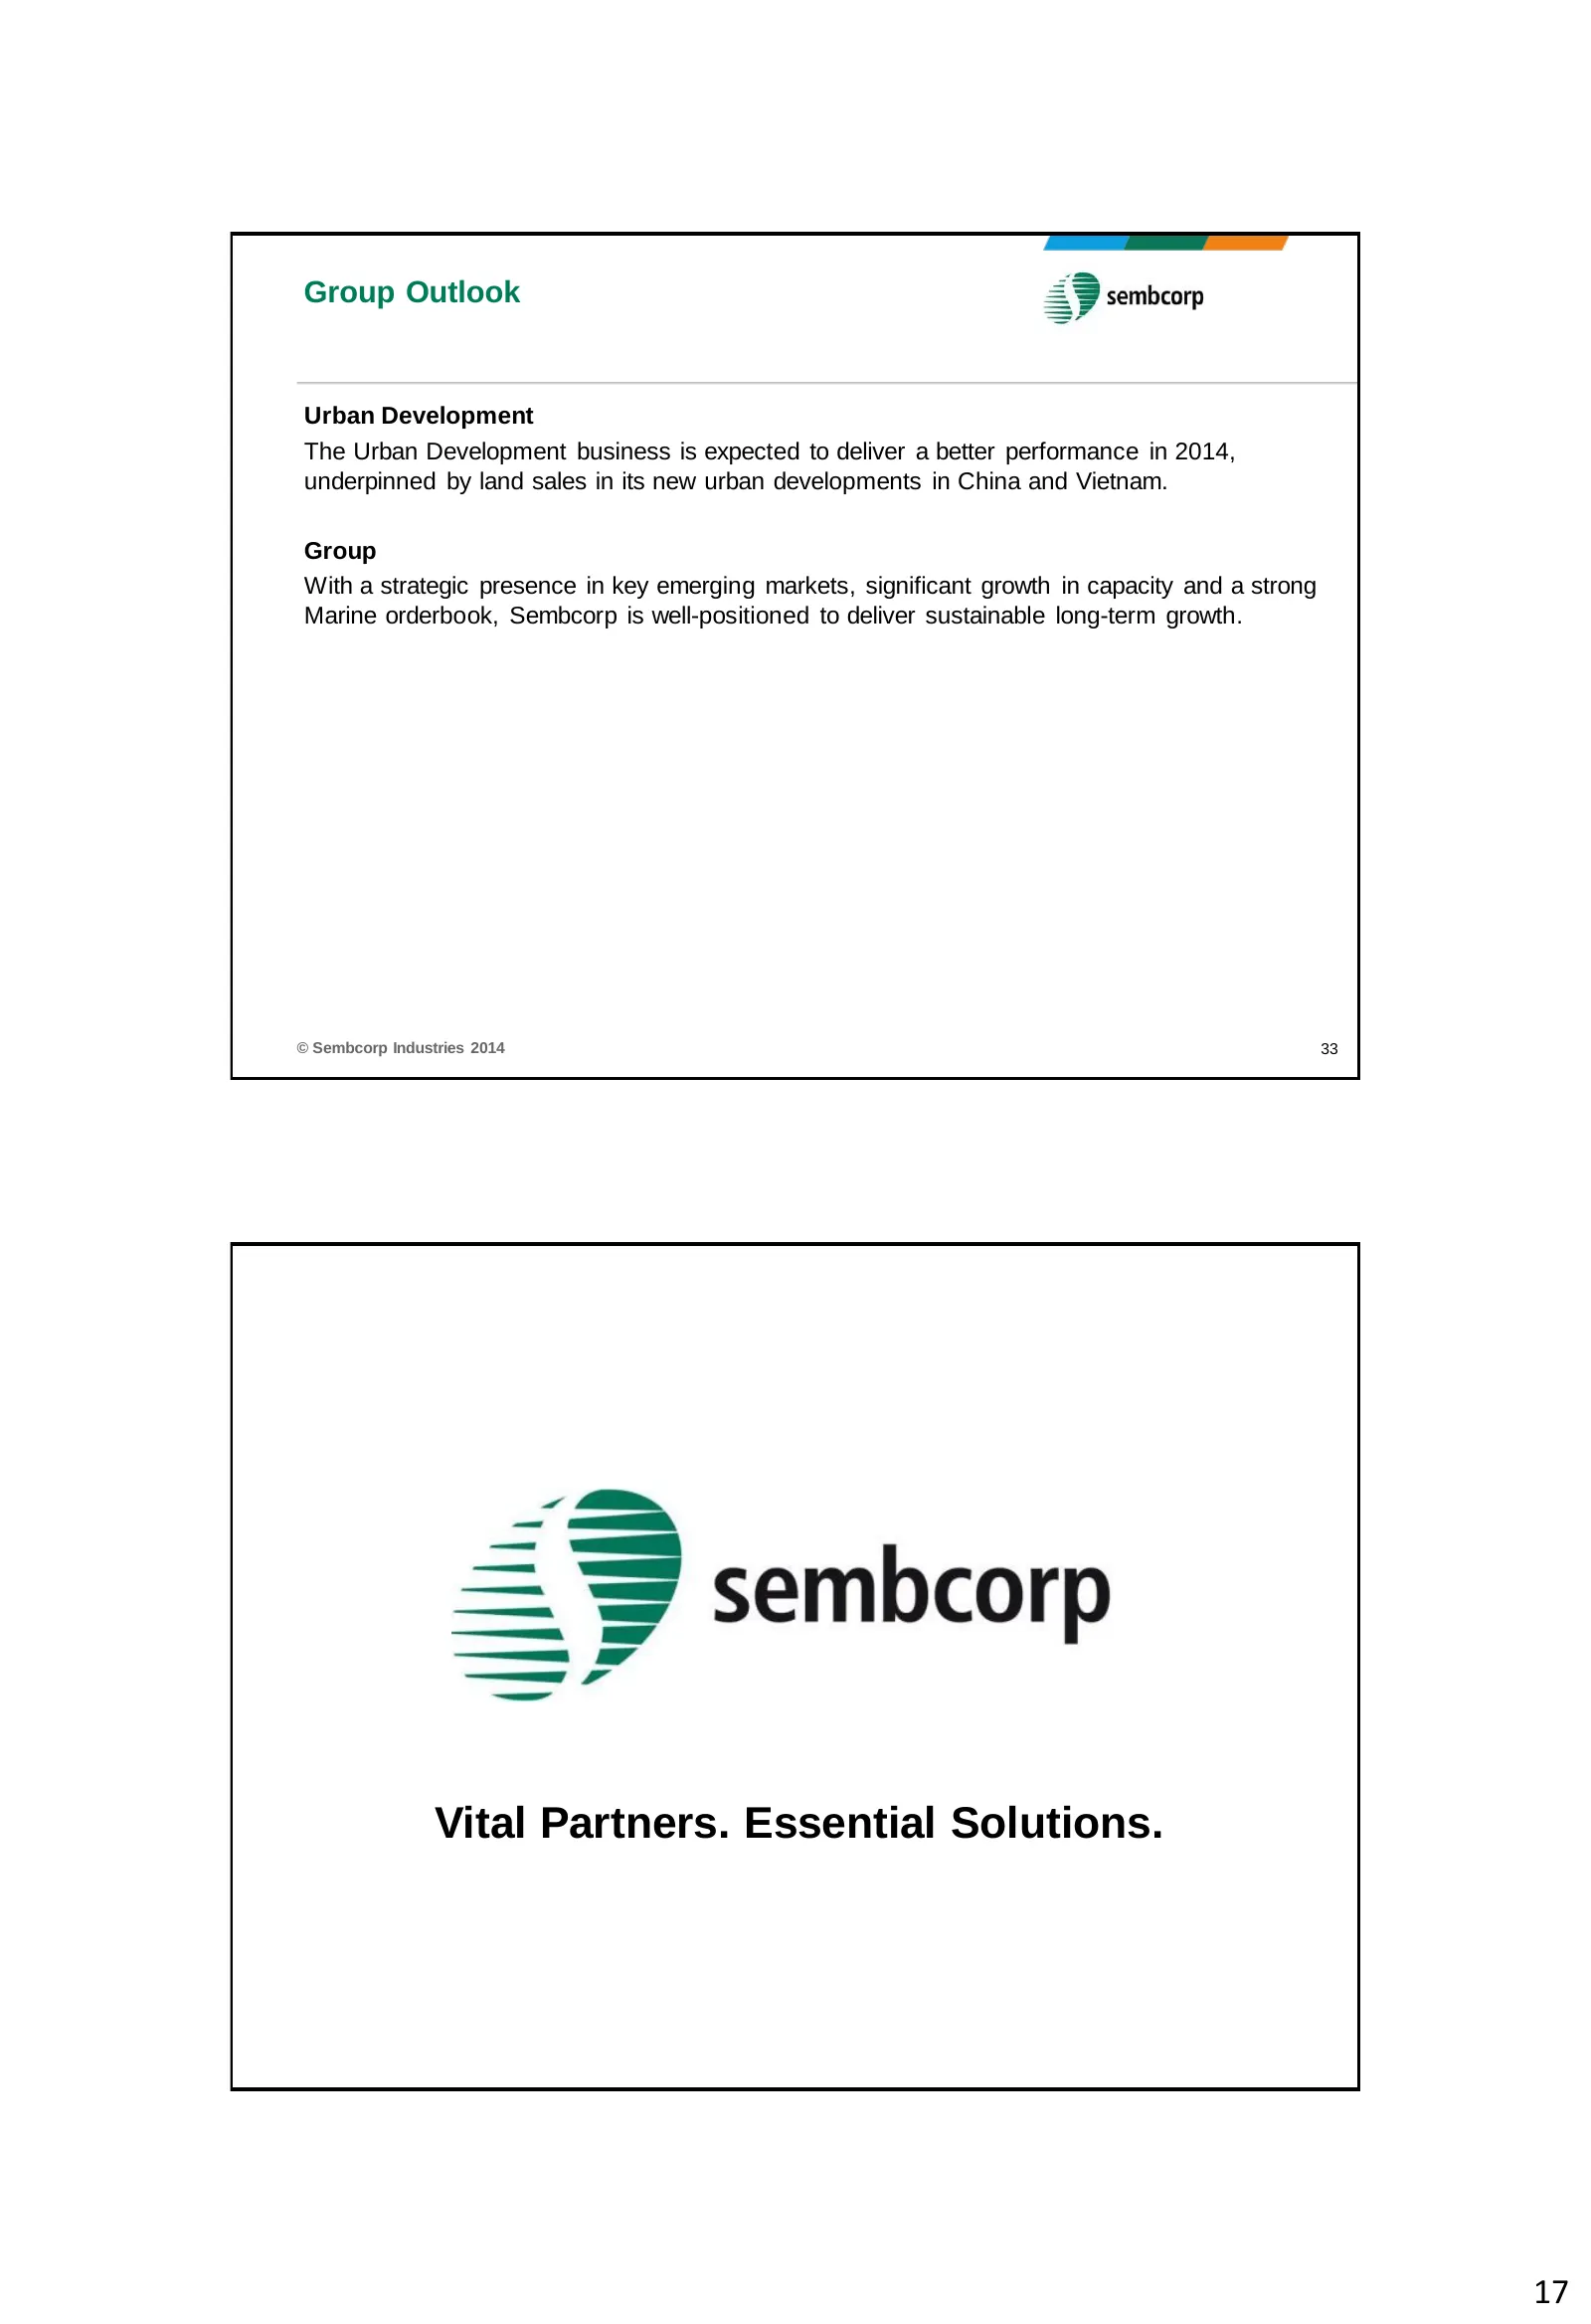
Group Outlook Urban Development The Urban Development business is expected to deliver a better performance in 2014, underpinned by land sales in its new urban developments in China and Vietnam. Group With a strategic presence in key emerging markets, significant growth in capacity and a strong Marin
Slide 18: Disclaimer
Disclaimer This presentation contains certain statements that are not statements of historical fact, i.e. forward- looking statements. These forward-looking statements are based on current expectations, projections and assumptions about future events. Although Sembcorp Industries believes that these
Slide 19: 4Q13 Group Profit & Loss and Turnover
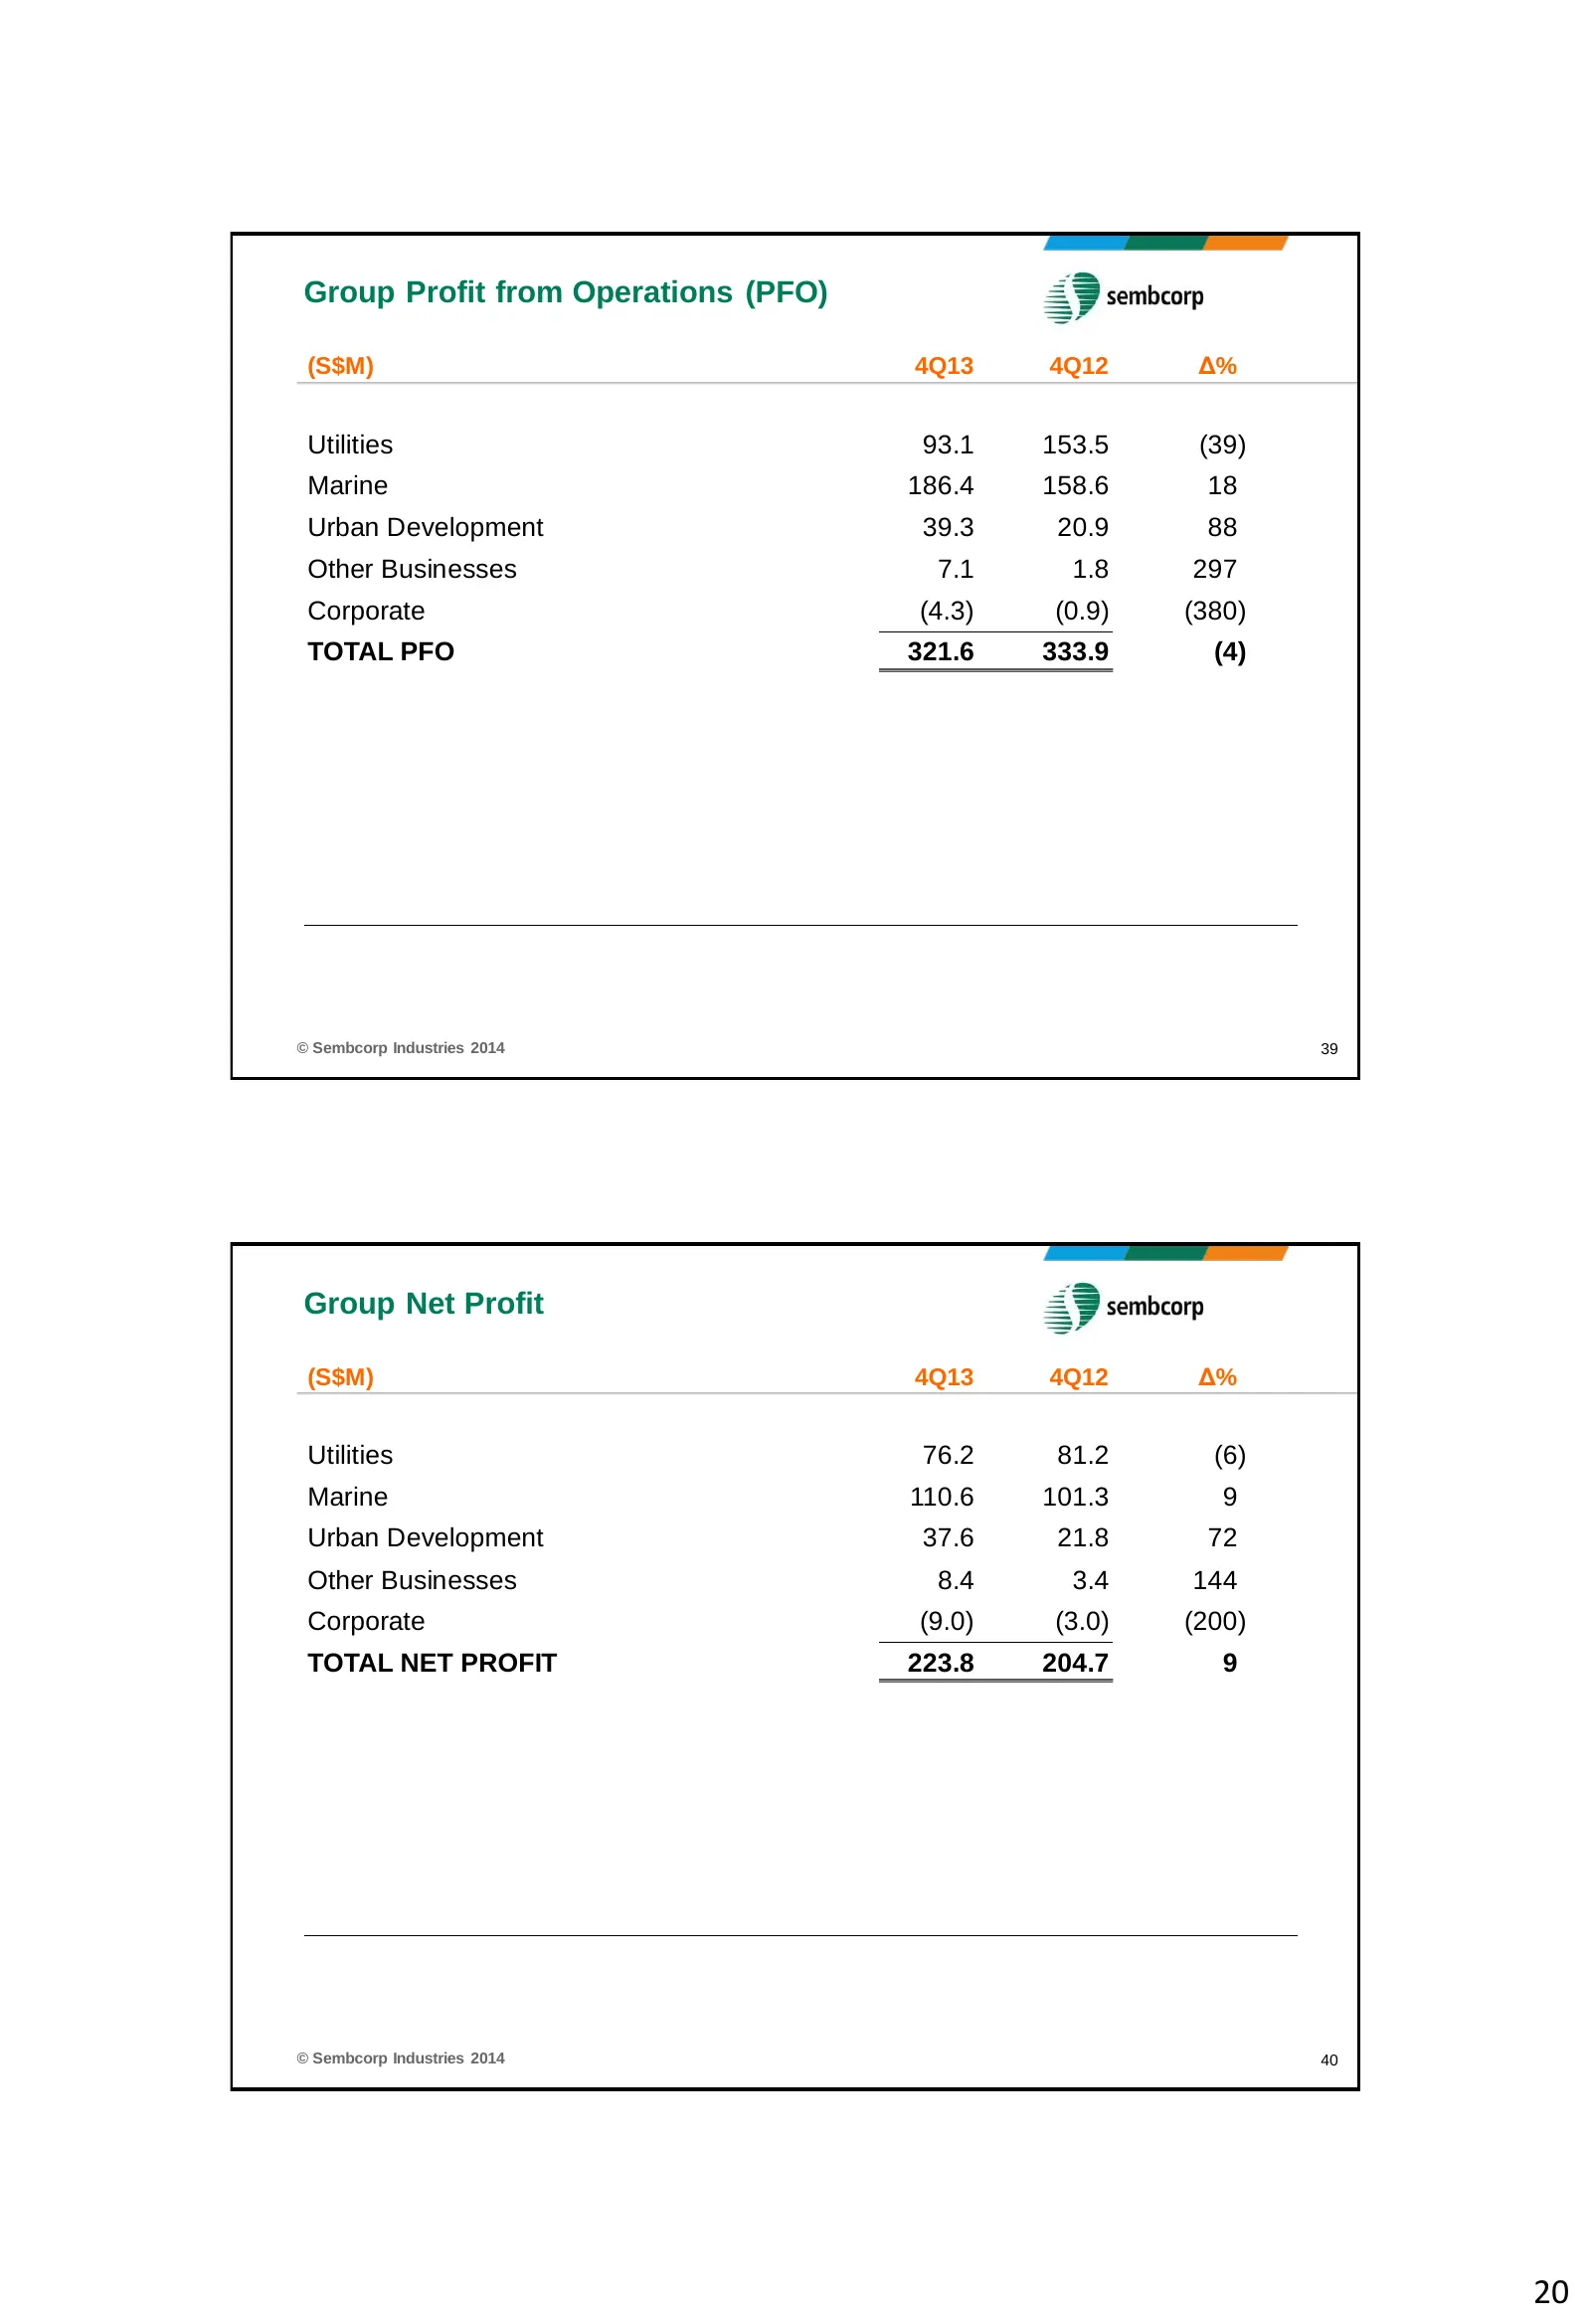
Group Profit & Loss (S$M) 4Q13 4Q12 Δ% Turnover 2,974 2,815 6 EBITDA 330 372 (11) Profit from Operations 1 322 334 (4) EBIT 259 292 (11) Share of results: Associates & JVs 63 42 51 Net Finance Cost (10) (46) 78 Finance costs (18) (48) 63 Finance income 8 2 221 PBT 312 288 8 Tax 3 6 42 Non-Controllin
Slide 20: 4Q13 Profit from Operations and Net Profit
Group Profit from Operations (PFO) (S$M) 4Q13 4Q12 Δ% Utilities 93.1 153.5 (39) Marine 186.4 158.6 18 Urban Development 39.3 20.9 88 Other Businesses 7.1 1.8 297 Corporate (4.3) (0.9) (380) TOTAL PFO 321.6 333.9 (4) © Sembcorp Industries 2014 39 Group Net Profit (S$M) 4Q13 4Q12 Δ% Utilities 76.2 81.
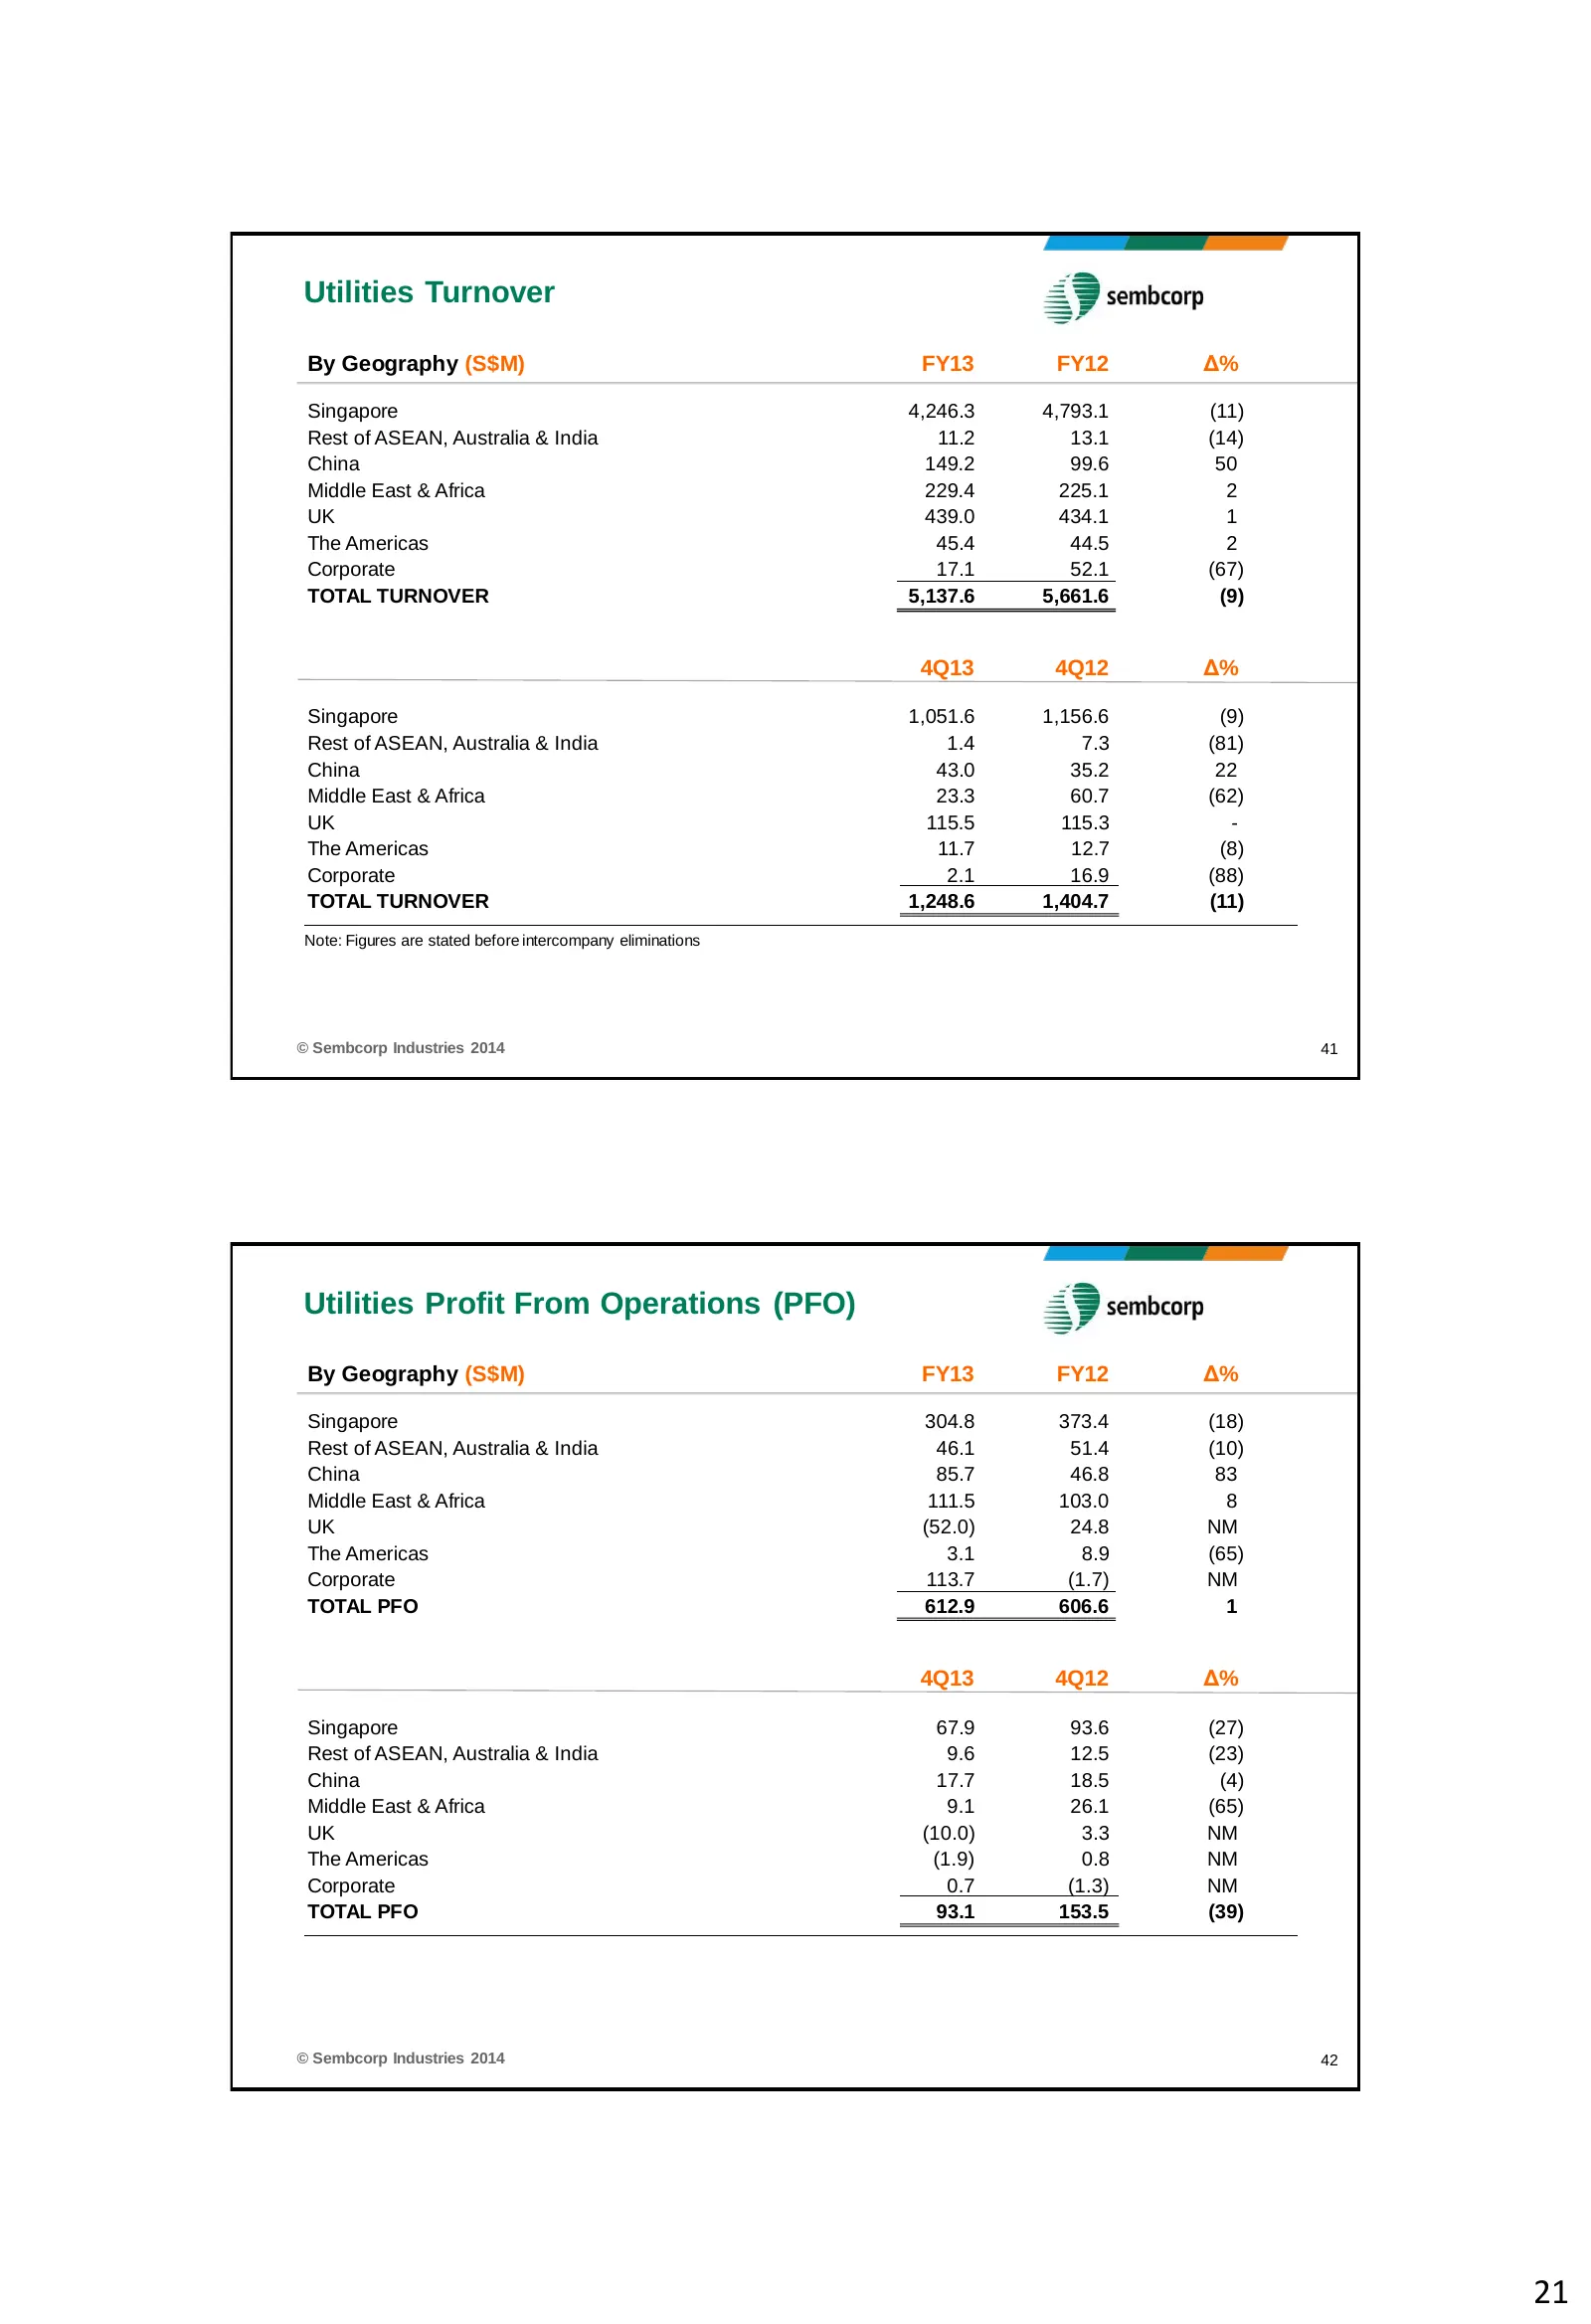
Slide 21: Utilities Turnover and PFO by Geography
Utilities Turnover By Geography (S$M) FY13 FY12 Δ% Singapore 4,246.3 4,793.1 (11) Rest of ASEAN, Australia & India 11.2 13.1 (14) China 149.2 99.6 50 Middle East & Africa 229.4 225.1 2 UK 439.0 434.1 1 The Americas 45.4 44.5 2 Corporate 17.1 52.1 (67) TOTAL TURNOVER 5,137.6 5,661.6 (9) 4Q13 4Q12 Δ%
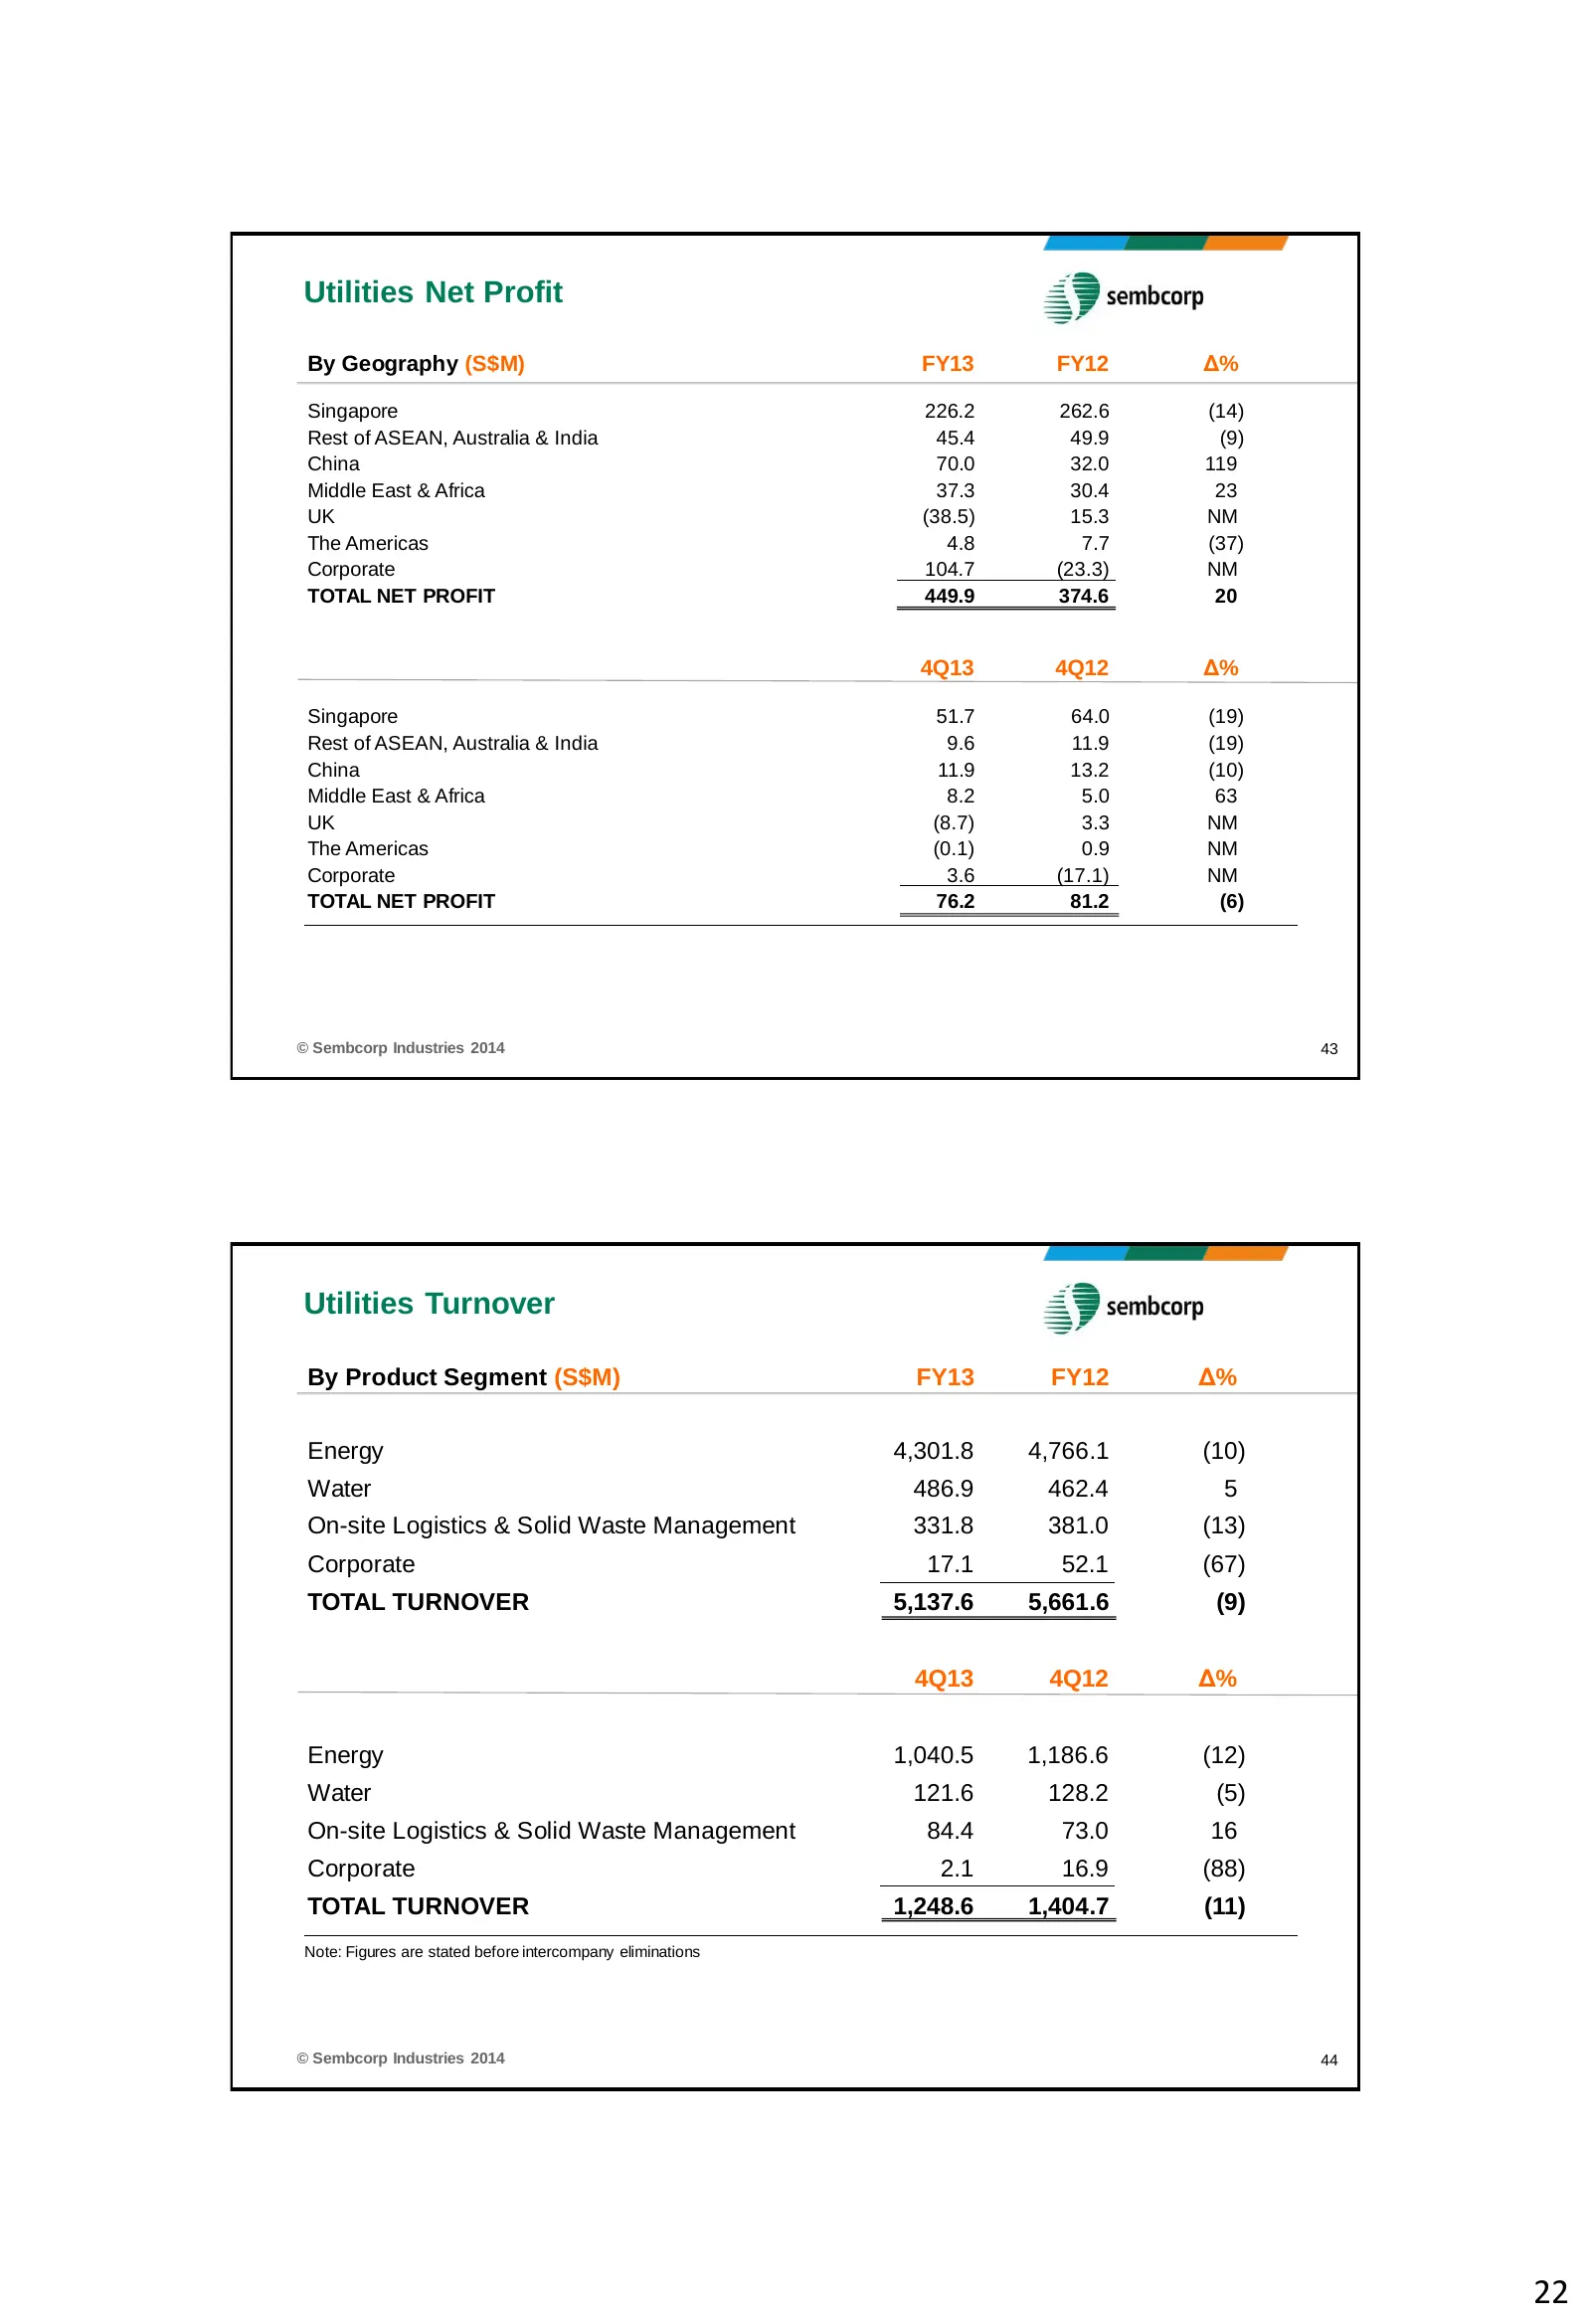
Slide 22: Utilities Net Profit and Turnover by Segment
Utilities Net Profit By Geography (S$M) FY13 FY12 Δ% Singapore 226.2 262.6 (14) Rest of ASEAN, Australia & India 45.4 49.9 (9) China 70.0 32.0 119 Middle East & Africa 37.3 30.4 23 UK (38.5) 15.3 NM The Americas 4.8 7.7 (37) Corporate 104.7 (23.3) NM TOTAL NET PROFIT 449.9 374.6 20 4Q13 4Q12 Δ% Sing
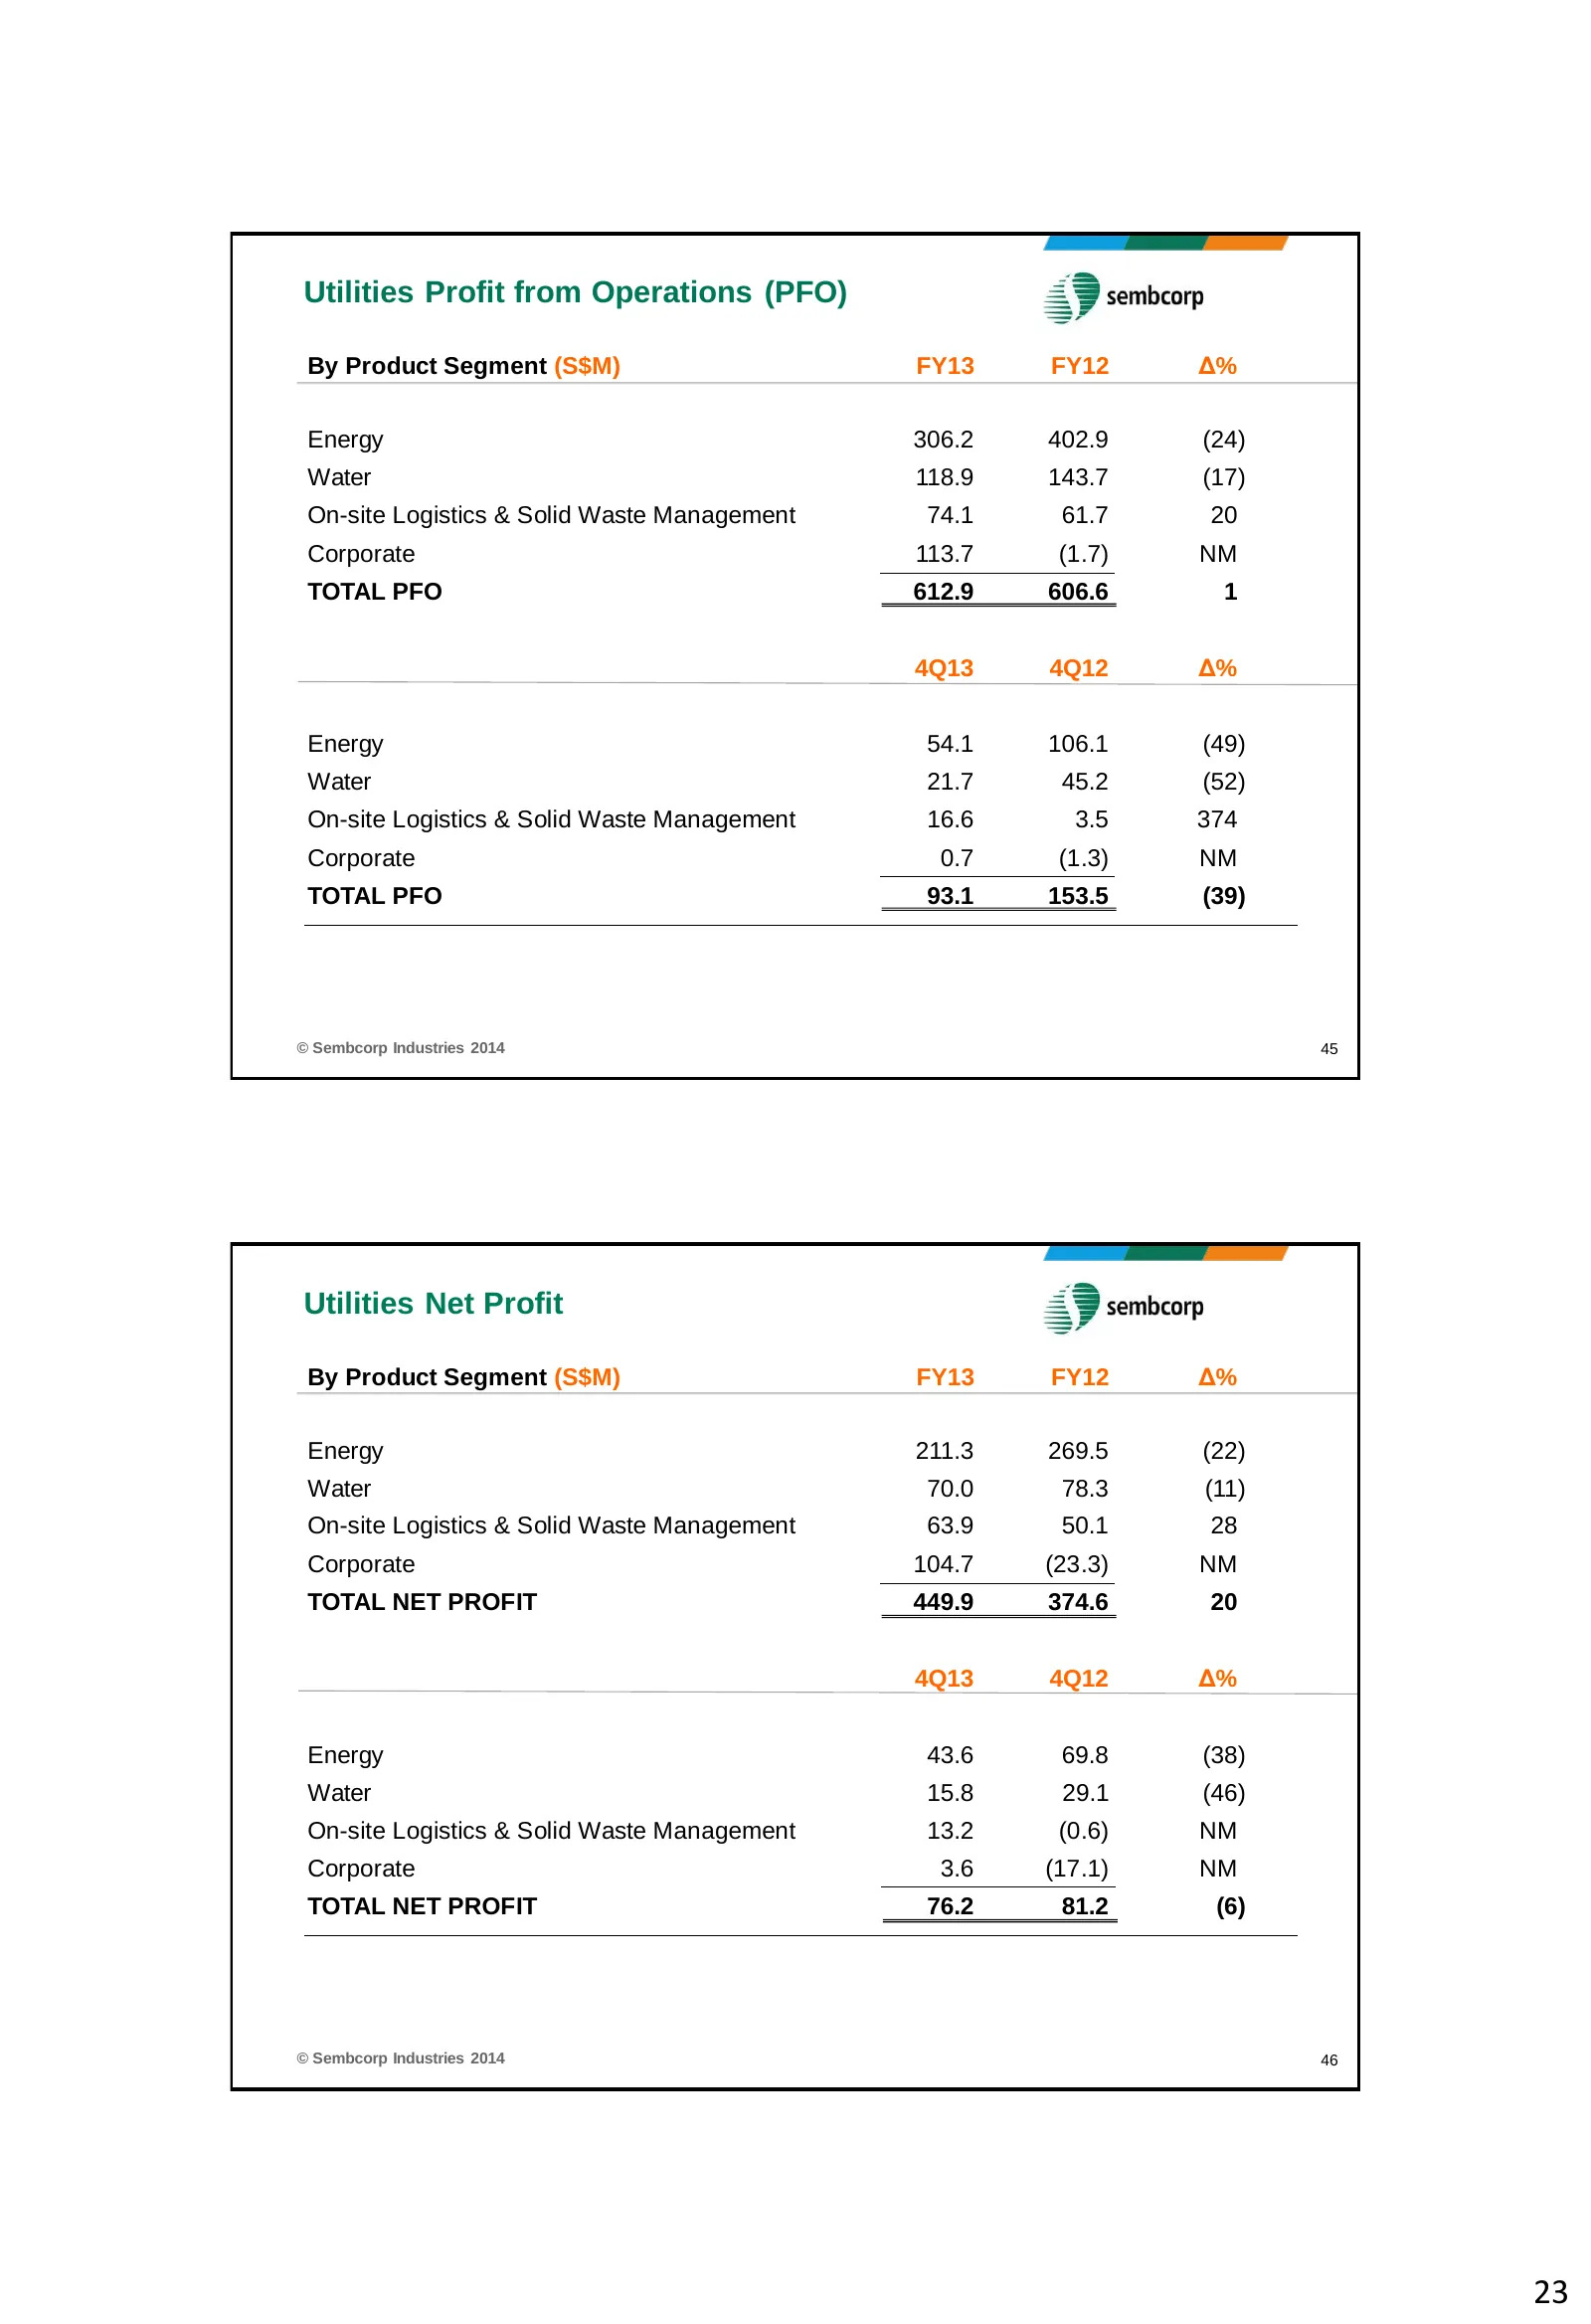
Slide 23: Utilities PFO and Net Profit by Product Segment
Utilities Profit from Operations (PFO) By Product Segment (S$M) FY13 FY12 Δ% Energy 306.2 402.9 (24) Water 118.9 143.7 (17) On-site Logistics & Solid Waste Management 74.1 61.7 20 Corporate 113.7 (1.7) NM TOTAL PFO 612.9 606.6 1 4Q13 4Q12 Δ% Energy 54.1 106.1 (49) Water 21.7 45.2 (52) On-site Logist
Source: Internet Archive copy of sembcorp.com
More decks from Sembcorp Industries Ltd.
 H1 2026 Earnings Presentation26 slides · Aug 13, 2026
 Investor Presentation (June 2026)52 slides · June 2026
 Shareholder Meeting (April 2026)11 slides · Apr 29, 2026
 FY2025 Earnings Presentation35 slides · Feb 25, 2026
 Merger or Acquisition (January 2026)13 slides · Jan 30, 2026
 Merger or Acquisition (December 2025)24 slides · Dec 11, 2025