AAC — Q2 2019 Earnings Presentation
9 slides from AAC's earnings presentation, Aug 30, 2019

Slide 1: Earnings Release Supplement August 2019
Earnings Release Supplement August 2019
Slide 2: Notice to Investors
Notice to Investors We use market data and industry forecasts and projections throughout this presentation, including data from publicly available information and industry publications. These sources generally state that the information they provide has been obtained from sources believed to be reli
Slide 3: Forward-Looking Statements
Forward-Looking Statements Some of the statements made in this presentation constitute forward-looking statements within the meaning of federal securities laws. Forward-looking statements reflect our current views with respect to future events and performance. In some cases you can identify forward-
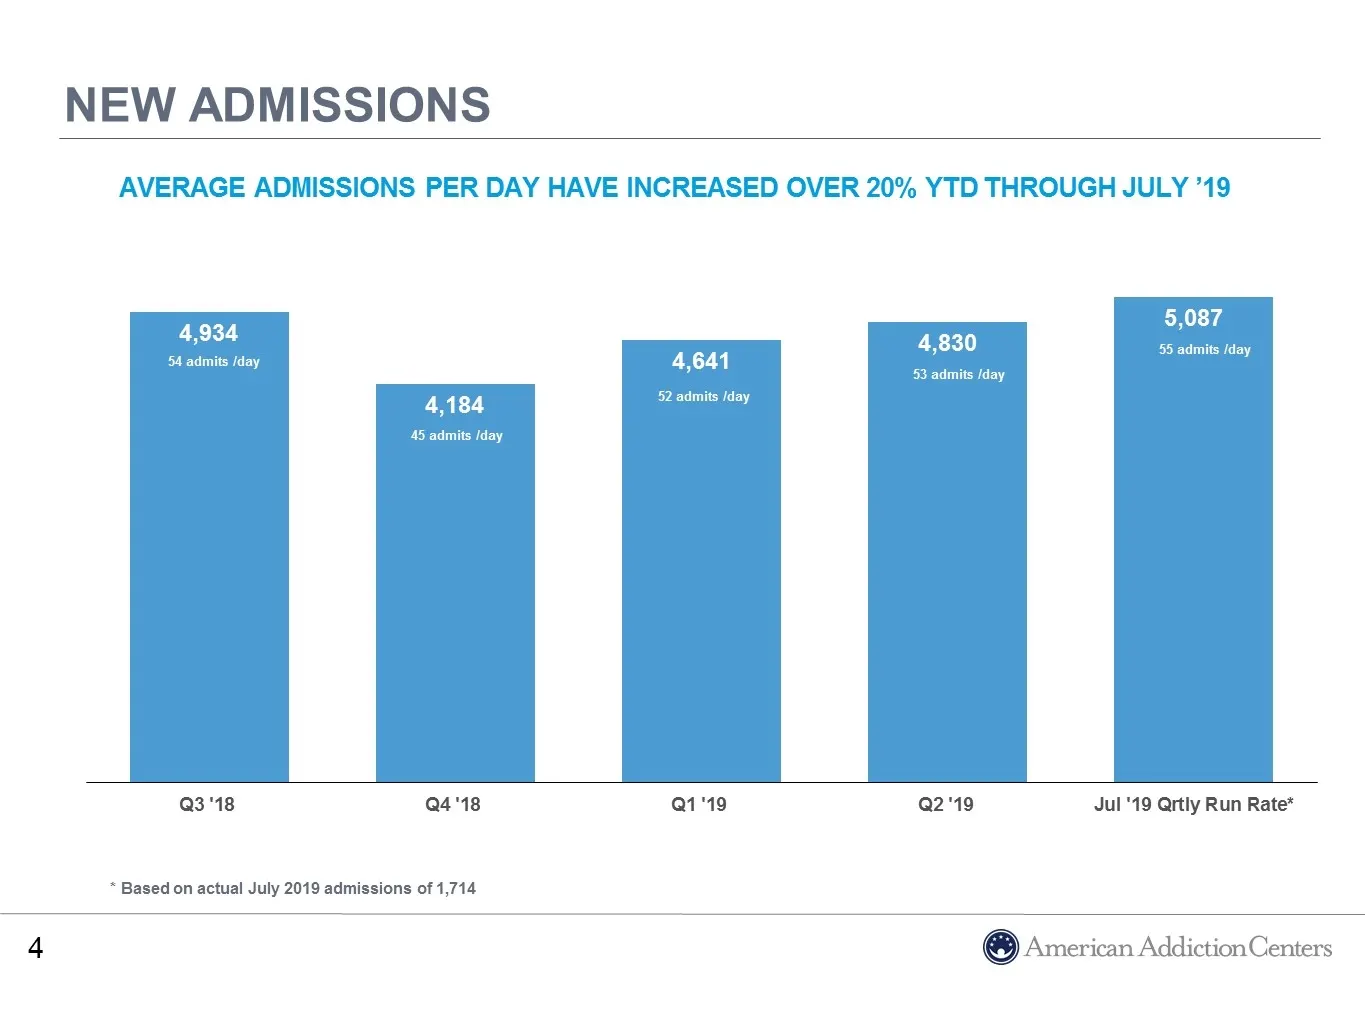
Slide 4: New Admissions Average Admissions per Day
54 admits /day 45 admits /day 53 admits /day 55 admits /day New Admissions Average Admissions per Day have increased over 20% YTD through July ’19 52 admits /day 55 admits /day * Based on actual July 2019 admissions of 1,714
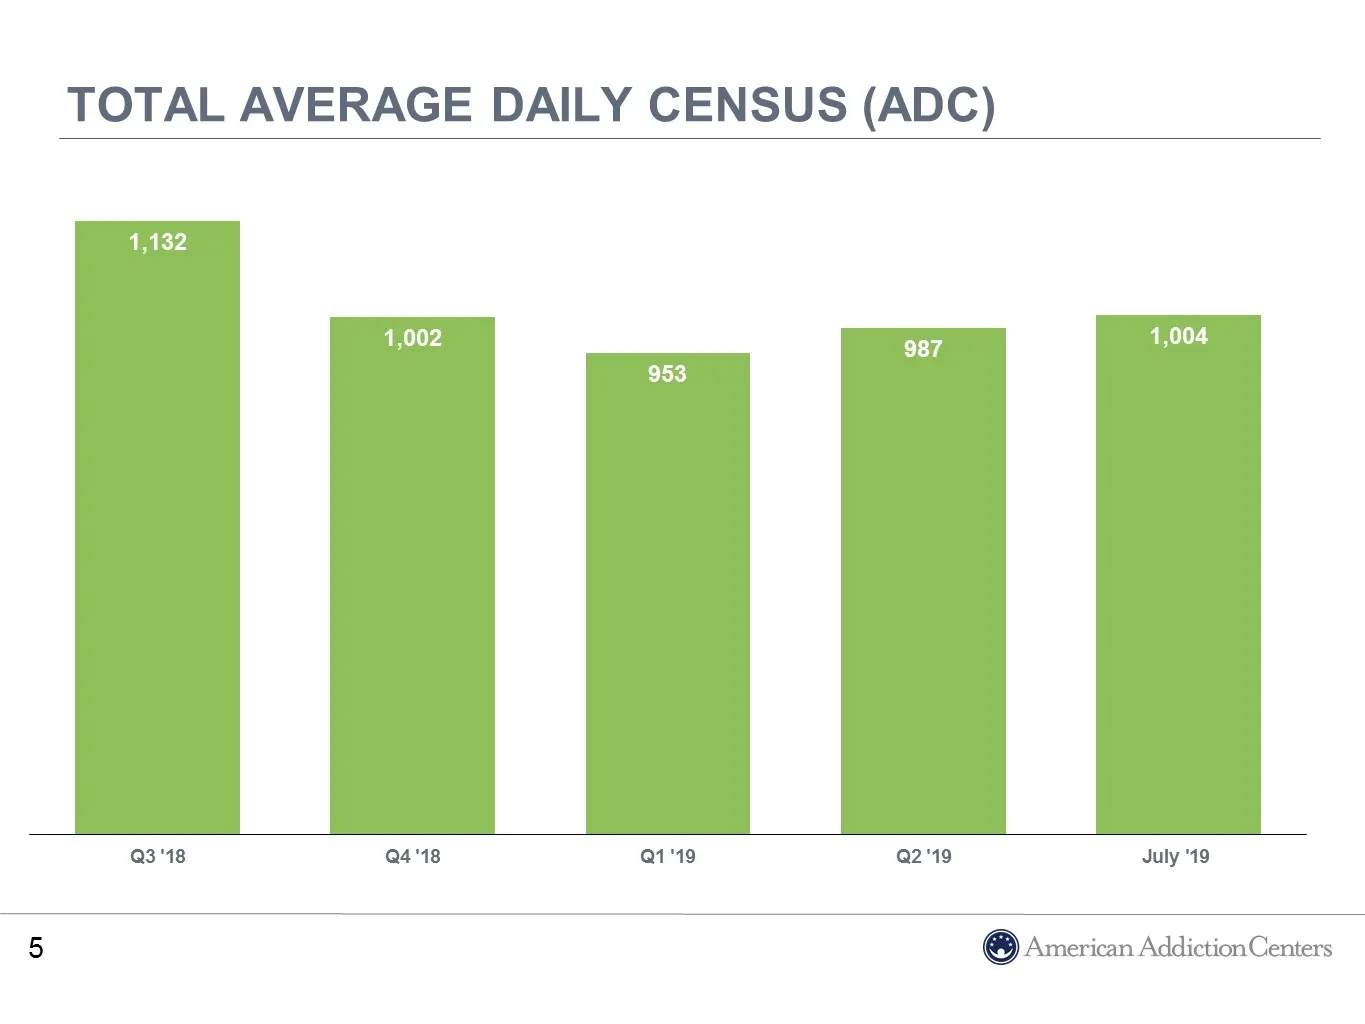
Slide 5: Total Average Daily Census (ADC)
Total Average Daily Census (ADC)
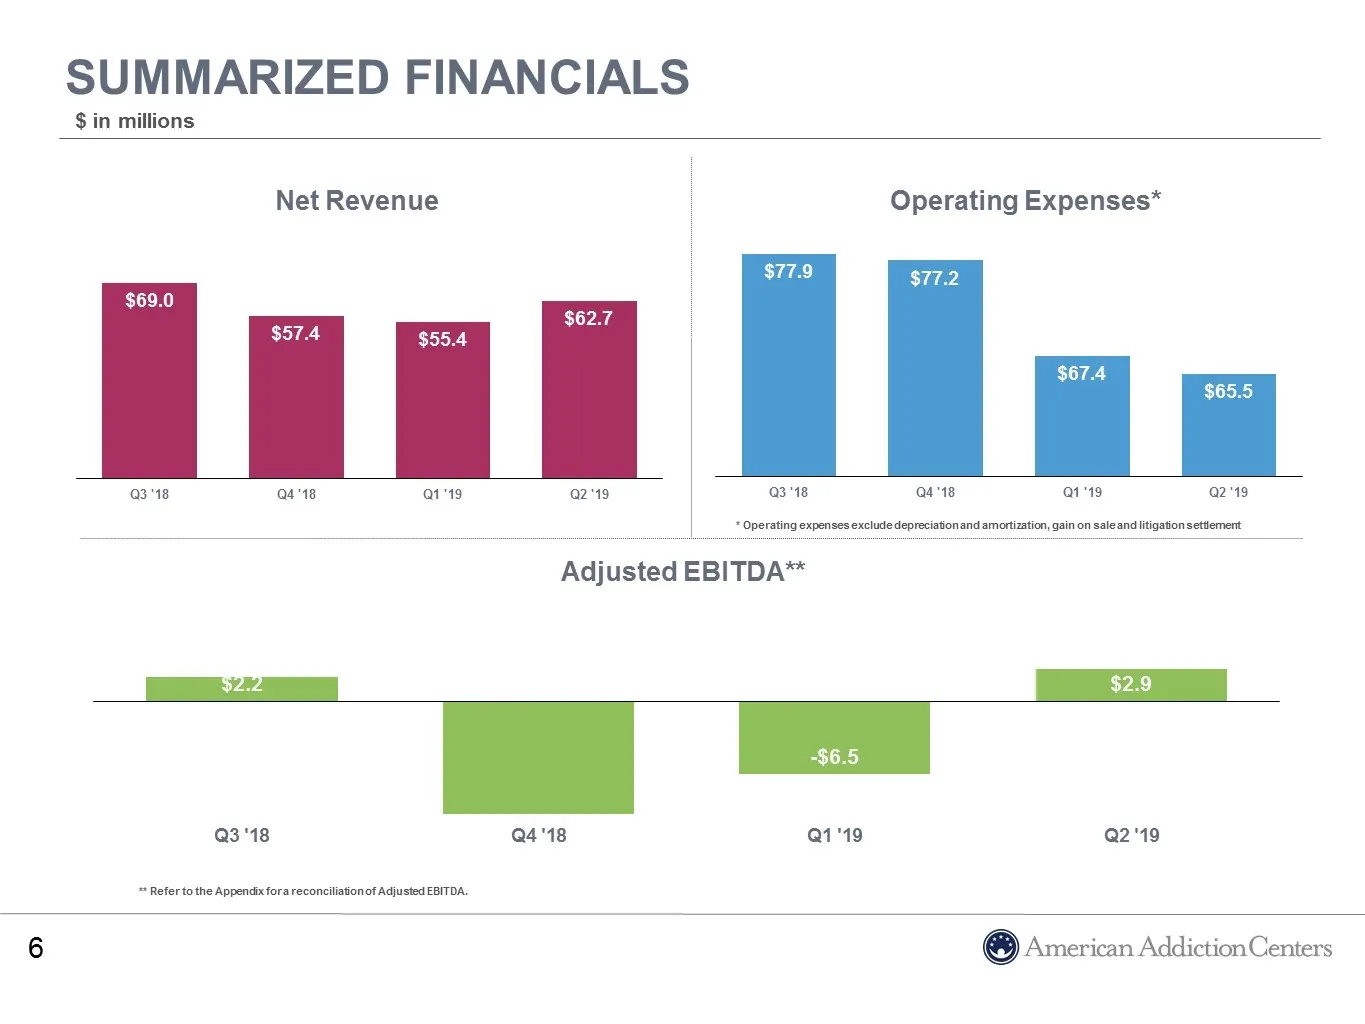
Slide 6: Summarized Financials
Net Revenue Operating Expenses* Adjusted EBITDA** Summarized Financials Summarized financials * Operating expenses exclude depreciation and amortization, gain on sale and litigation settlement $ in millions ** Refer to the Appendix for a reconciliation of Adjusted EBITDA.
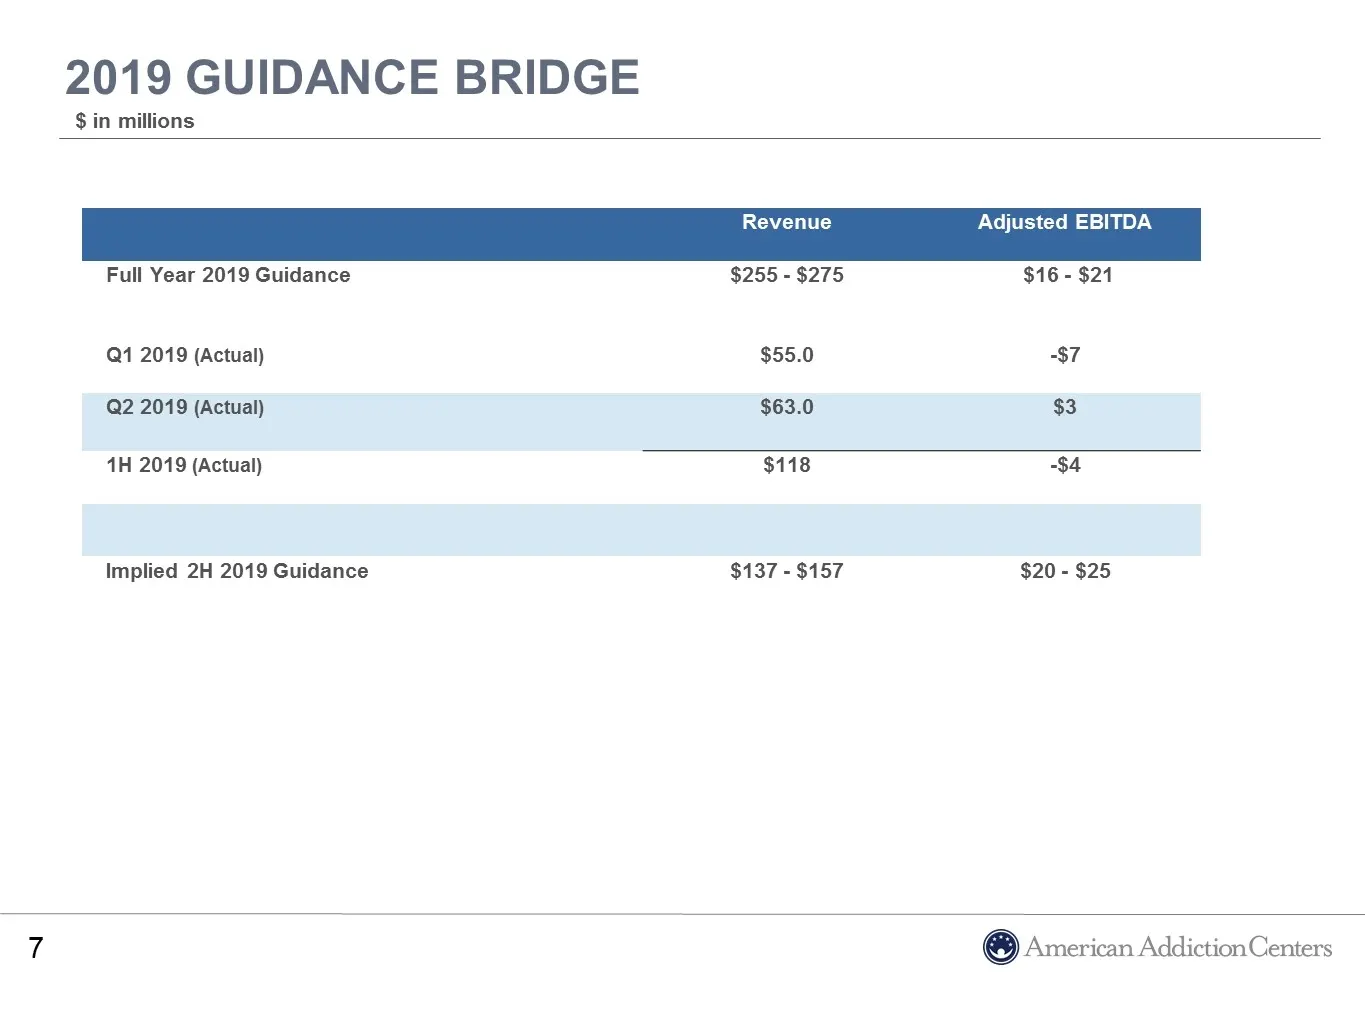
Slide 7: 2019 Guidance Bridge
2019 Guidance Bridge 2019 Guidance Bridge $ in millions Revenue Adjusted EBITDA Full Year 2019 Guidance $255 - $275 $16 - $21 Q1 2019 (Actual) $55.0 -$7 Q2 2019 (Actual) $63.0 $3 1H 2019 (Actual) $118 -$4 Implied 2H 2019 Guidance $137 - $157 $20 - $25
Slide 8: Adjusted EBITDA Bridge to 2H 2019 Implied Guidance
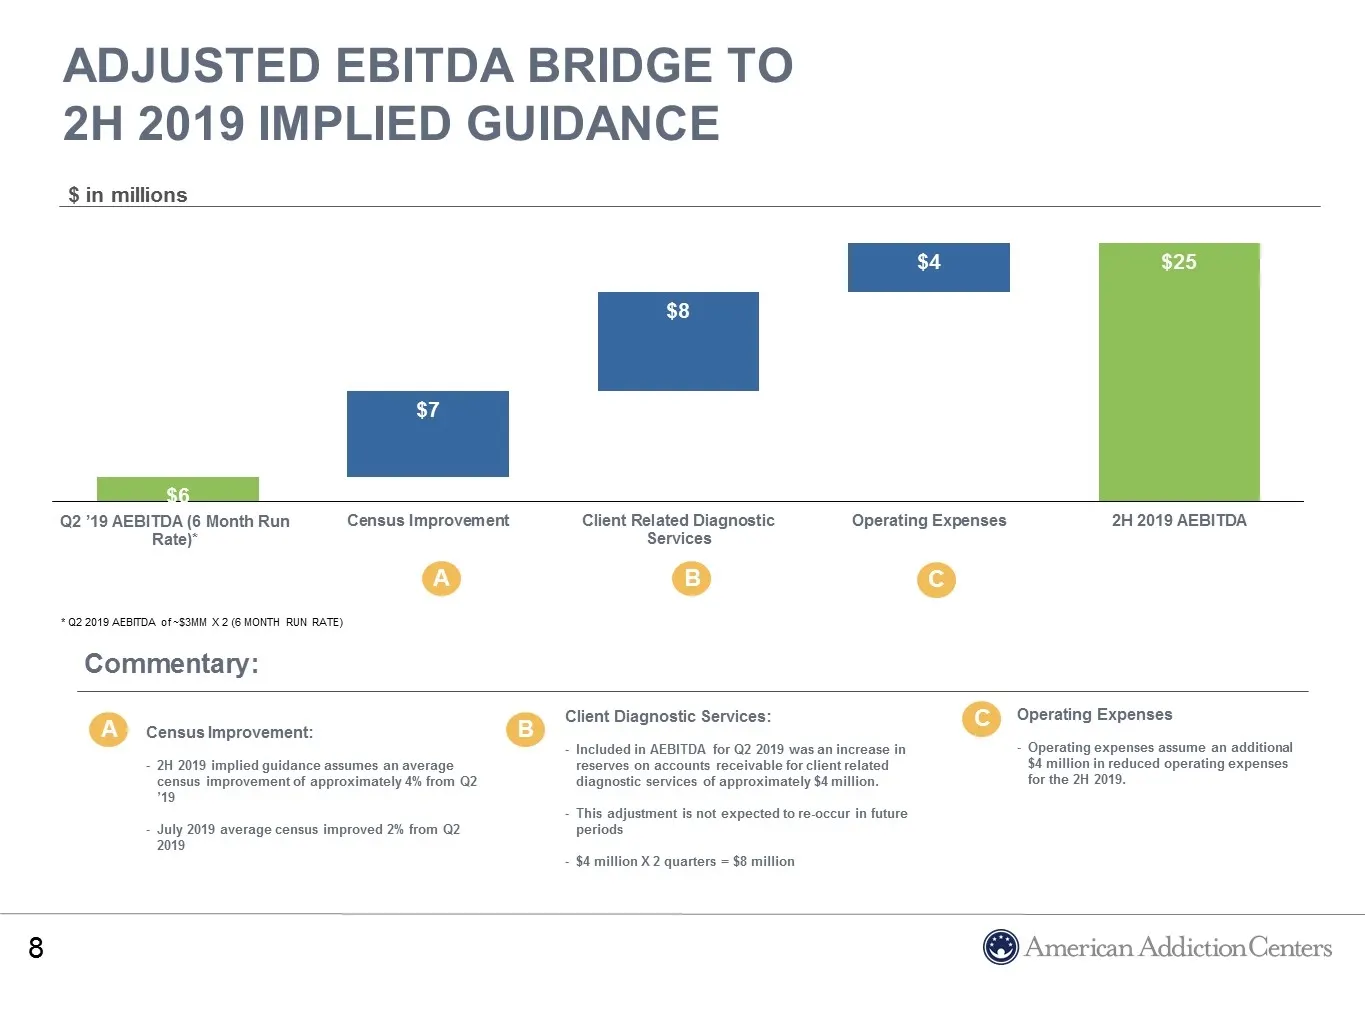
ADJUStED EBITDA Bridge to 2H 2019 Implied Guidance Adjusted EBITDA A Adjusted EBITDA Bridge to 2H 2019 Implied Guidance $ in millions Client Diagnostic Services: Included in AEBITDA for Q2 2019 was an increase in reserves on accounts receivable for client related diagnostic services of approximately
Slide 9: Appendix: Reconciliation of AEBITDA
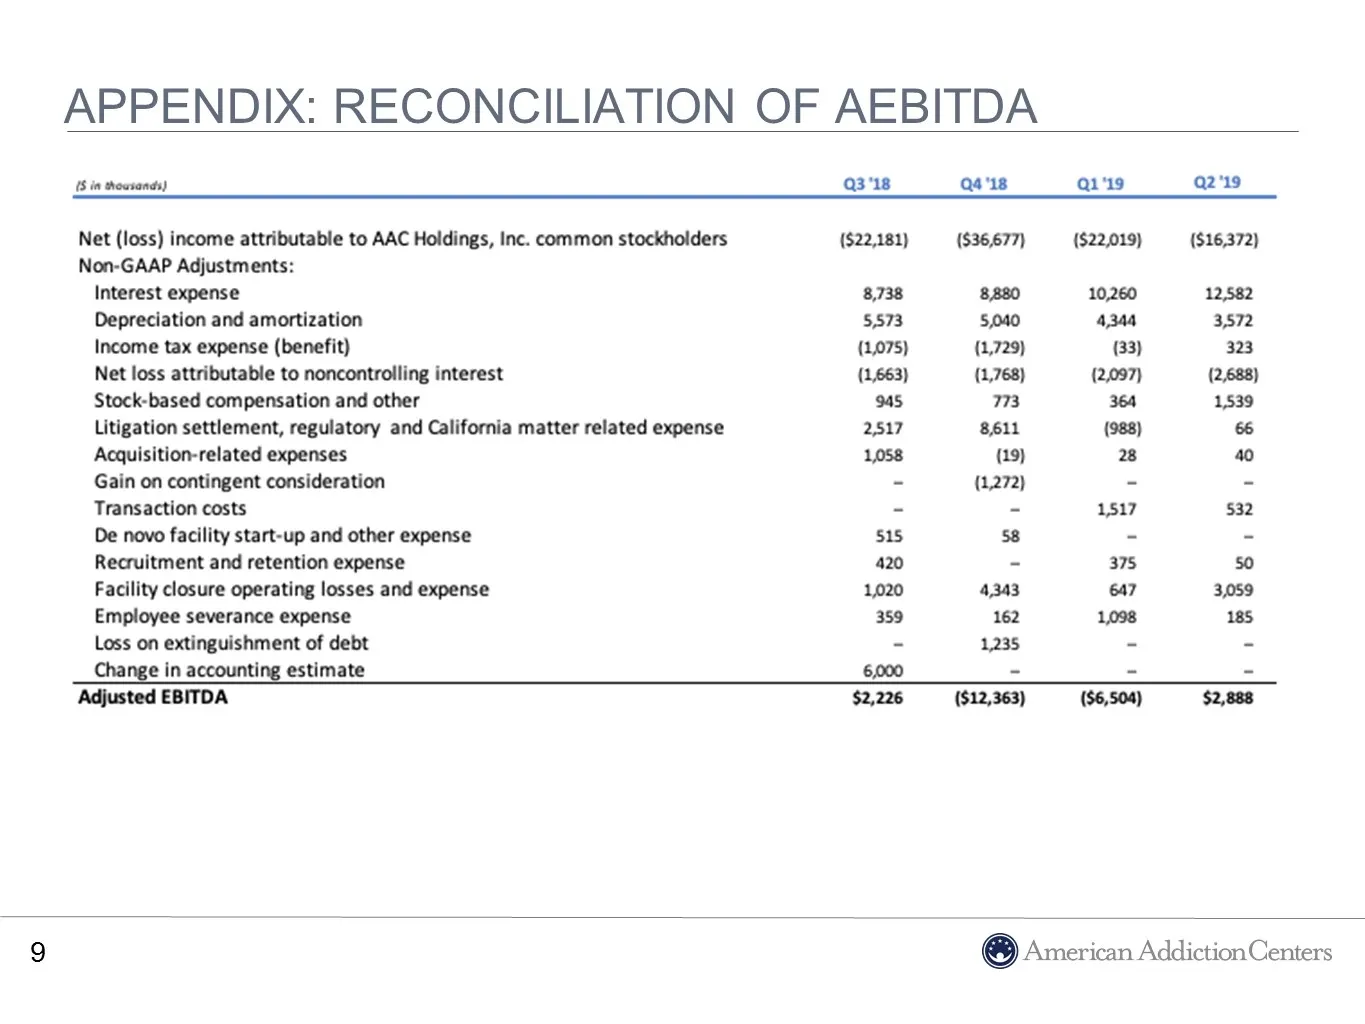
Appendix: Reconciliation of AEBITDA
Source: SEC EDGAR · 8-K filed Aug 30, 2019