Tele2 AB Class A · OMXSTO:TEL2_A
Tele2 AB Class A — Q3 2026 Earnings Presentation
17 slides from Tele2 AB Class A's earnings presentation, Oct 20, 2026
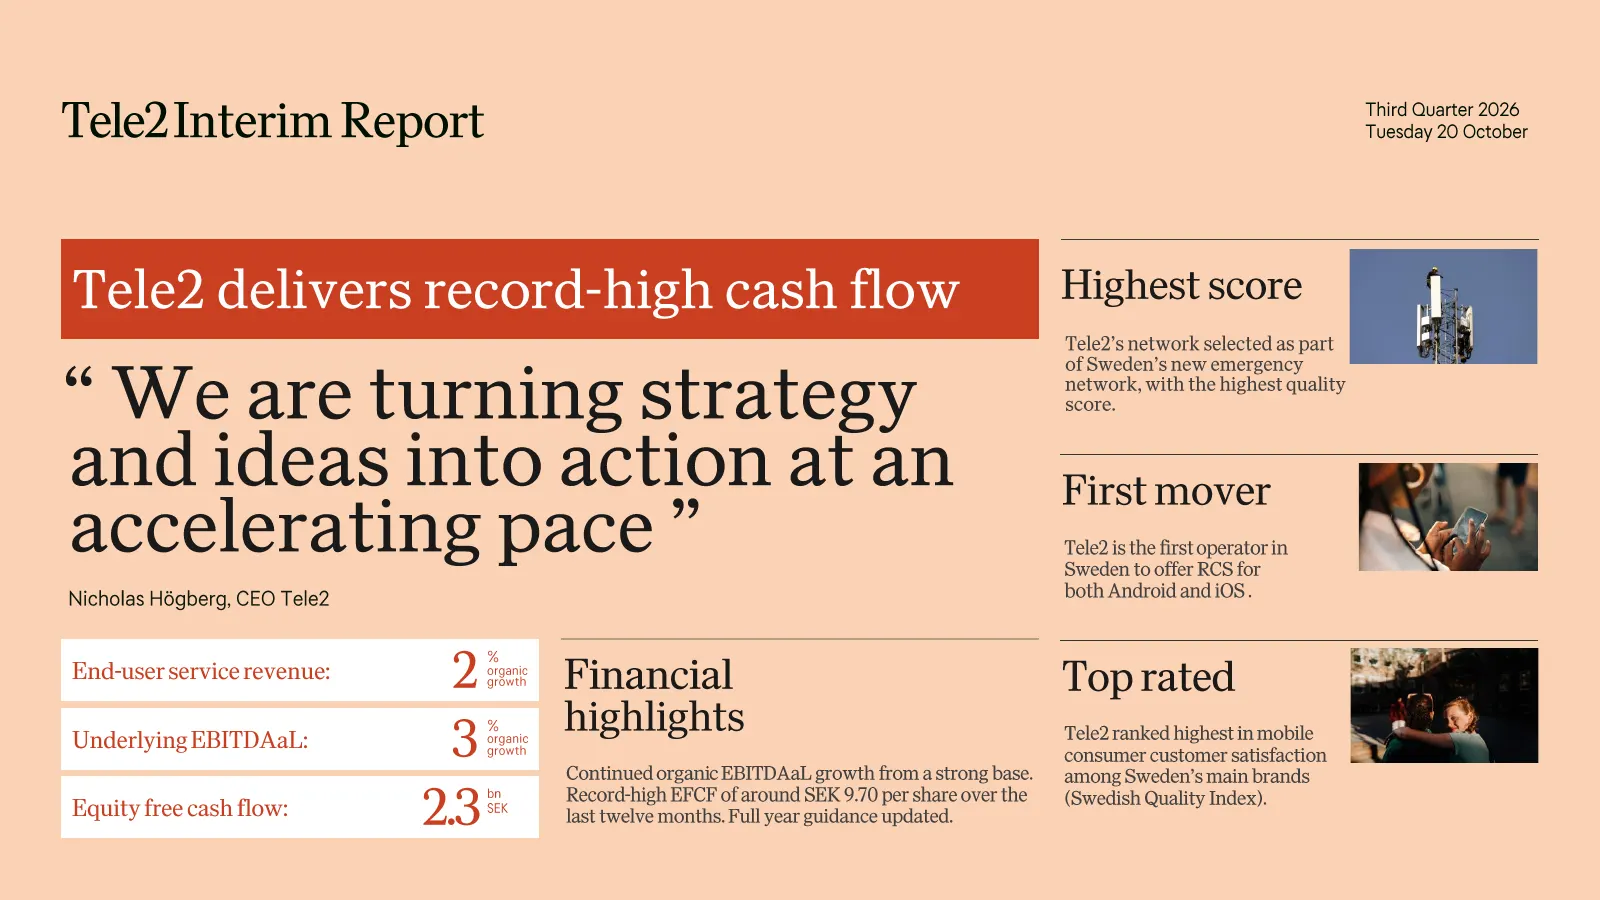
Slide 1: Tele2 Interim Report Third Quarter 2026
Tele2 Interim Report Third Quarter 2026 Tuesday 20 October Tele2 delivers record -high cash flow Highest score Tele2’s network selected as part of Sweden’s new emergency “ We are turning strategy network, with the highest quality score. and ideas into action at an First mover accelerating pace ” Tel
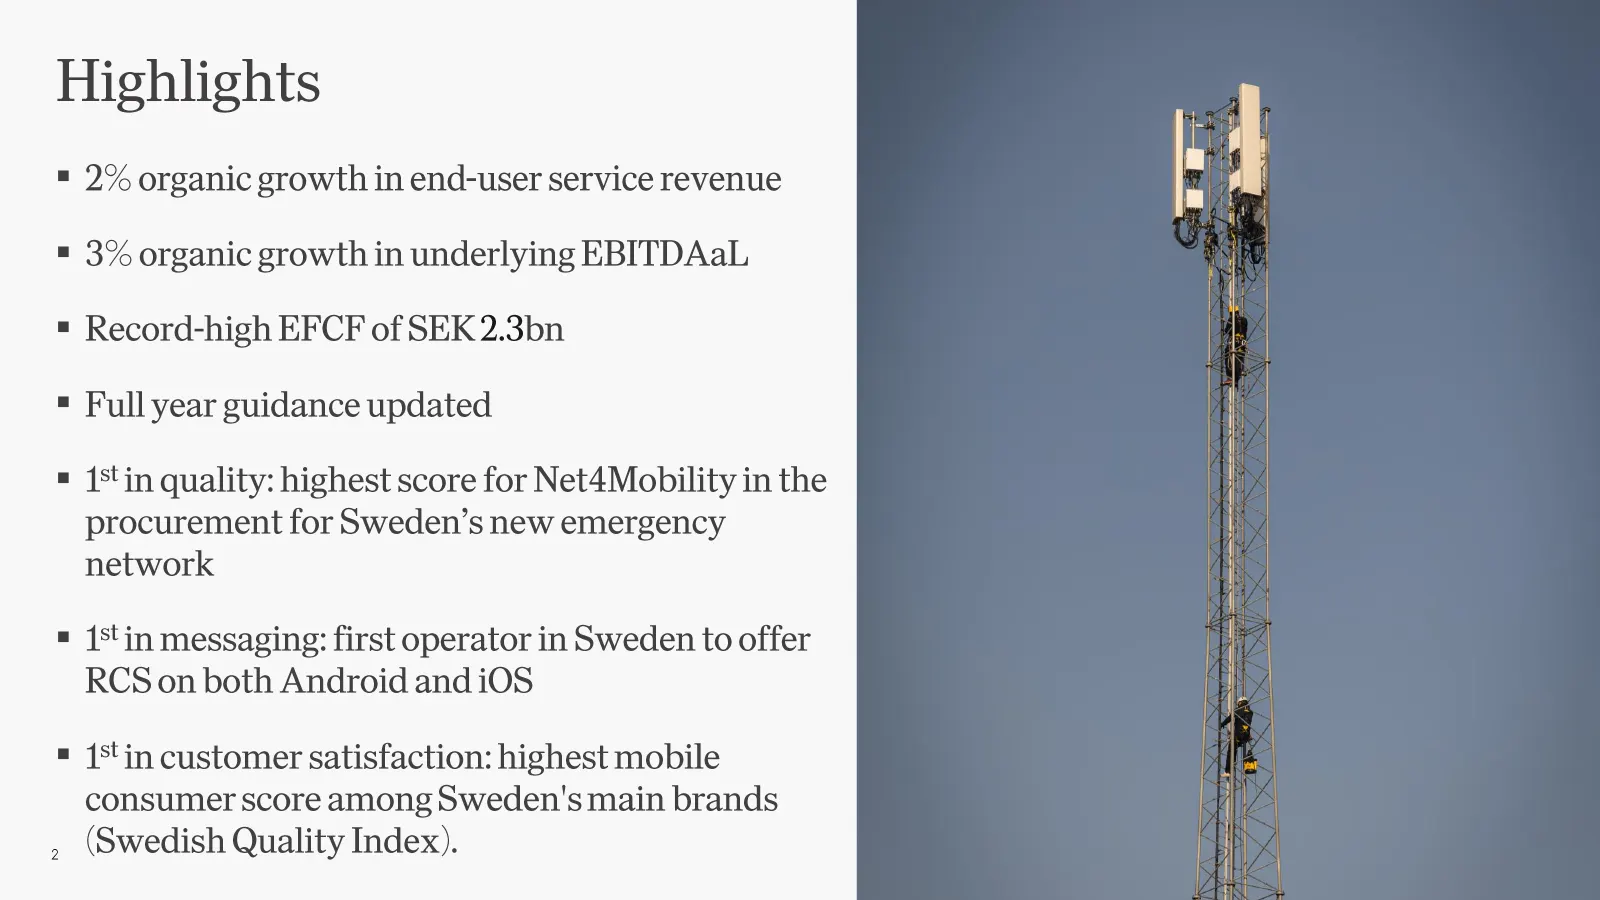
Slide 2: Highlights
Highlights ▪ 2% organic growth in end -user service revenue ▪ 3% organic growth in underlying EBITDAaL ▪ Record -high EFCF of SEK 2.3bn ▪ Full year guidance updated ▪ 1st in quality: highest score for Net4Mobility in the procurement for Sweden’s new emergency network ▪ 1st in messaging: first operat
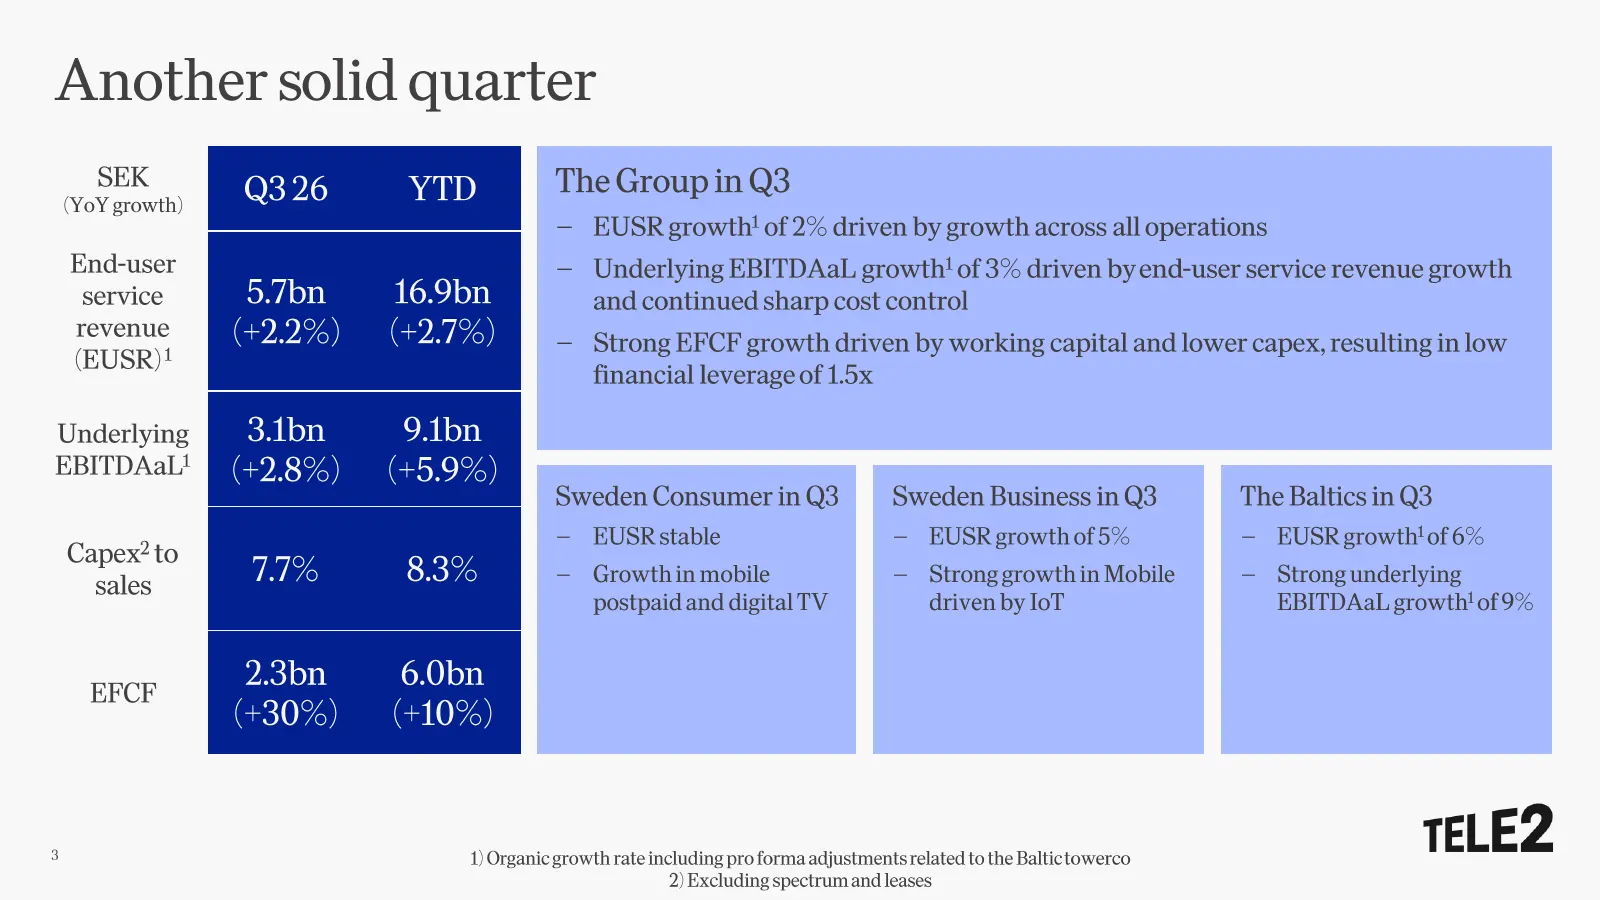
Slide 3: Another solid quarter
Another s olid quarter SEK The Group in Q3 (YoY growth) Q3 26 YTD – EUSR growth 1 of 2% driven by growth across all operations End -user – Underlying EBITDAaL growth 1 of 3% driven by end-user service revenue growth service 5.7bn 16.9bn and continued sharp cost control revenue (+2.2%) (+2.7%) – Stro
Slide 4: Sweden
SWEDEN
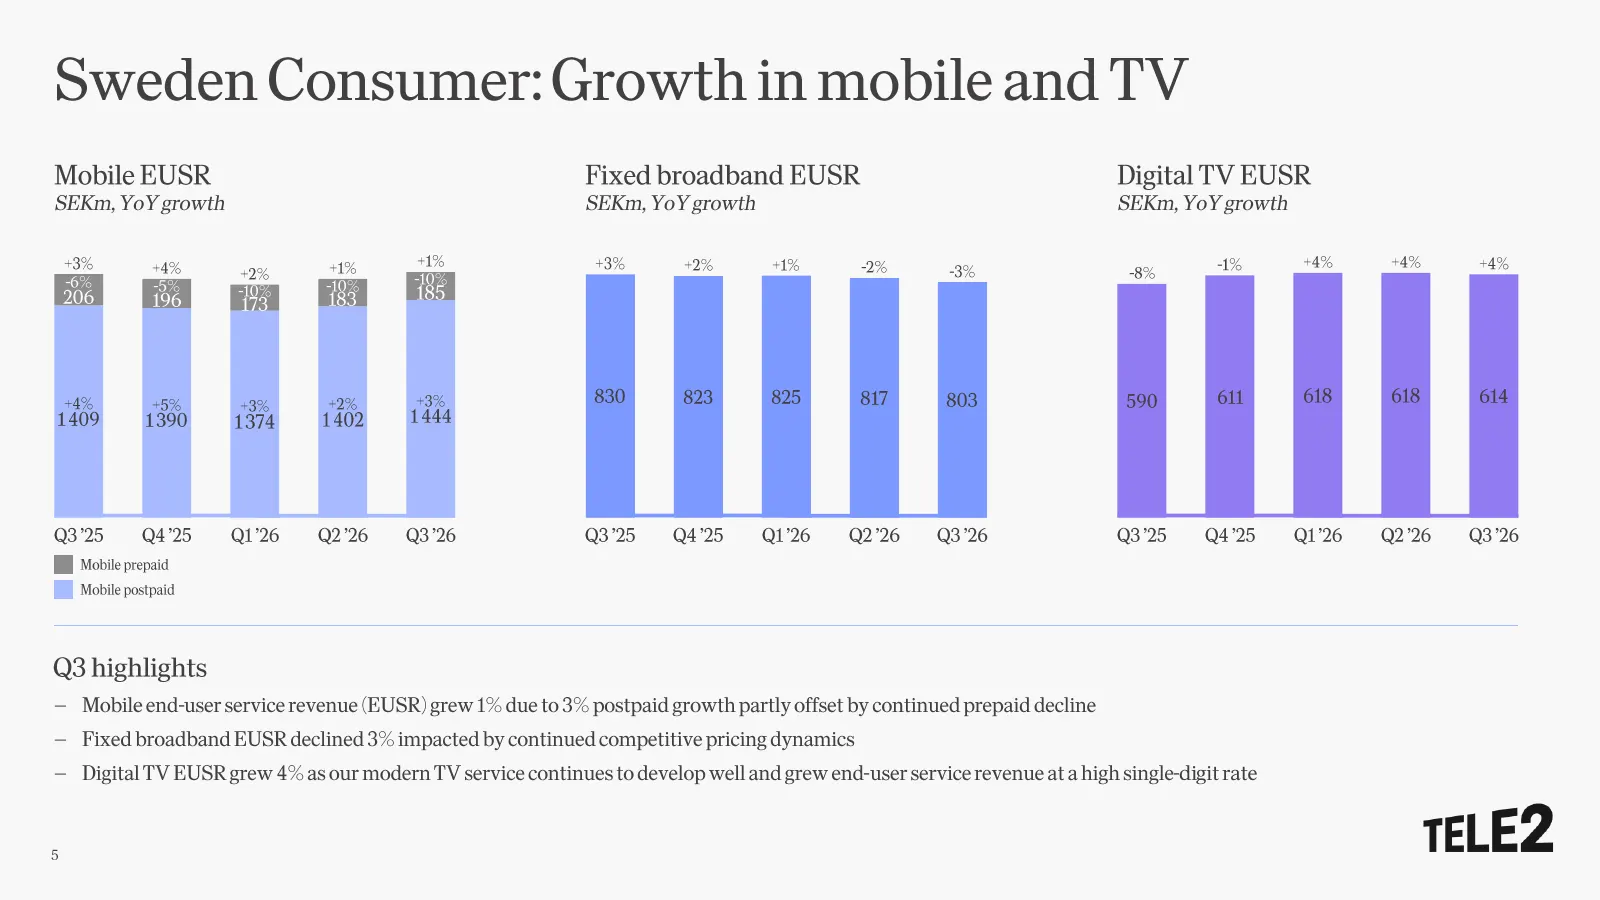
Slide 5: Sweden Consumer: Growth in mobile and TV
Sweden Consumer: Growth in mobile and TV Mobile EUSR Fixed broadband EUSR Digital TV EUSR SEKm, YoY growth SEKm, YoY growth SEKm, YoY growth +3% +4% +1% +1% +3% +2% +1% -2% -1% +4% +4% +4% +2% -3% -8% -6% -5% -10% -10% -10% 185 206 196 173 183 +4% +5% +2% +3% 830 823 825 817 803 590 611 618 618 614
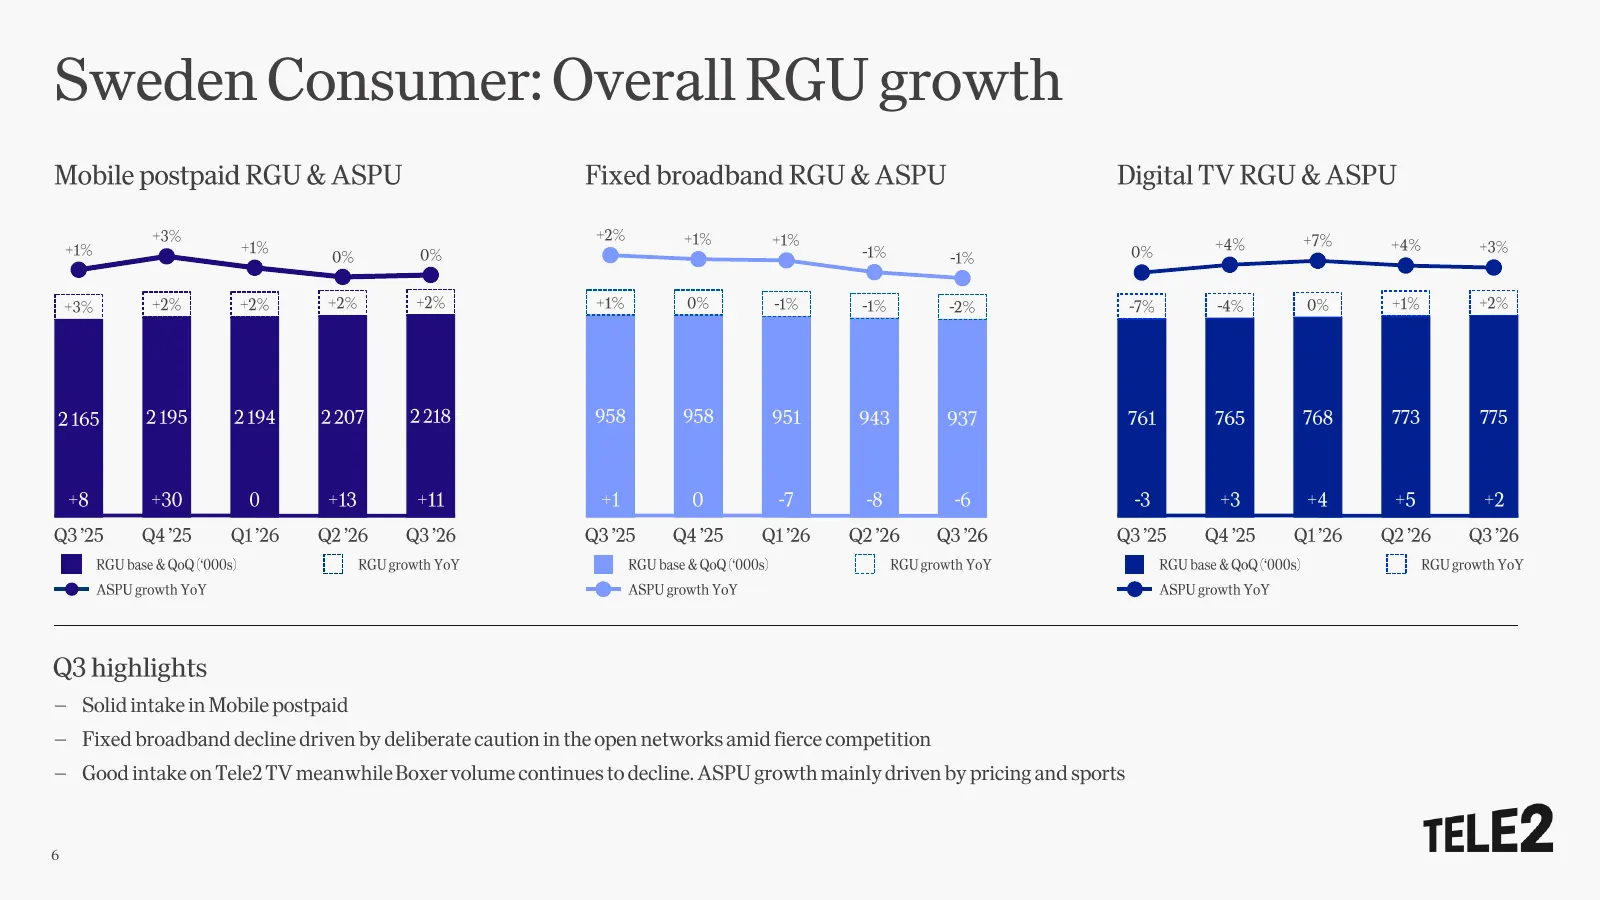
Slide 6: Sweden Consumer: Overall RGU growth
Sweden Consumer: Overall RGU growth Mobile postpaid RGU & ASPU Fixed broadband RGU & ASPU Digital TV RGU & ASPU +3% +2% +1% +1% +7% +1% +1% +4% +4% +3% 0% 0% -1% -1% 0% +3% +2% +2% +2% +2% +1% 0% -1% -1% -2% -7% -4% 0% +1% +2% 2 165 2 195 2 194 2 207 2 218 958 958 951 943 937 761 765 768 773 775 +8
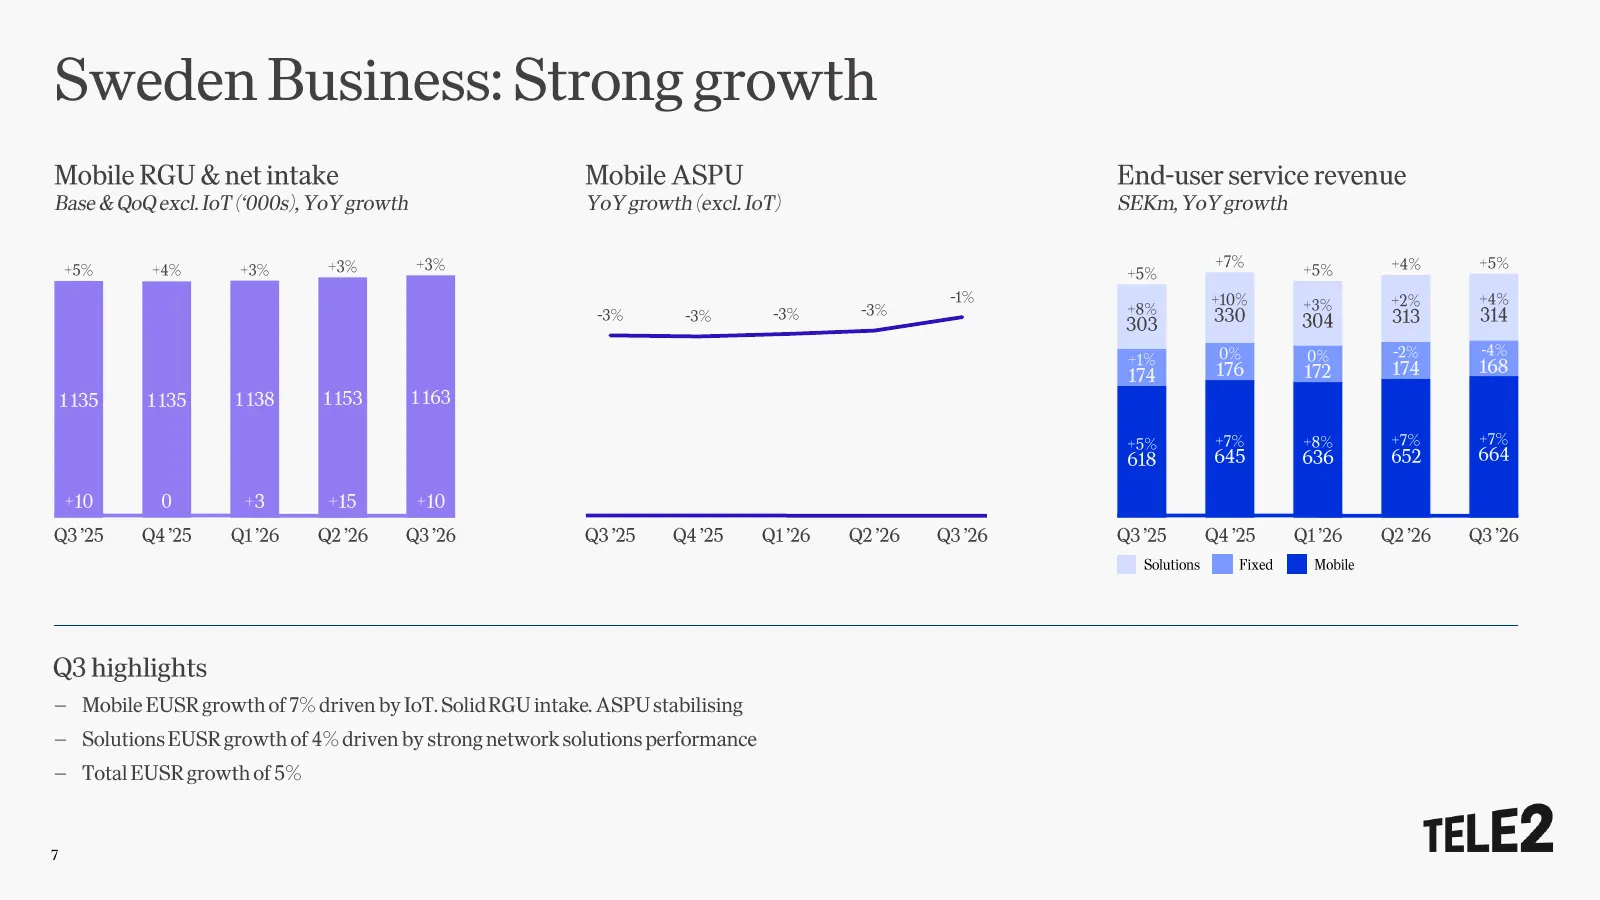
Slide 7: Sweden Business: Strong growth
Sweden Business: Strong growth Mobile RGU & net intake Mobile ASPU End -user service revenue Base & QoQ excl. IoT (‘000s), YoY growth YoY growth (excl. IoT) SEKm , YoY growth +3% +3% +7% +4% +5% +5% +4% +3% +5% +5% -1% +10% +2% +4% -3% +8% +3% -3% -3% -3% 330 304 313 314 303 0% 0% -2% -4% +1% 168 17
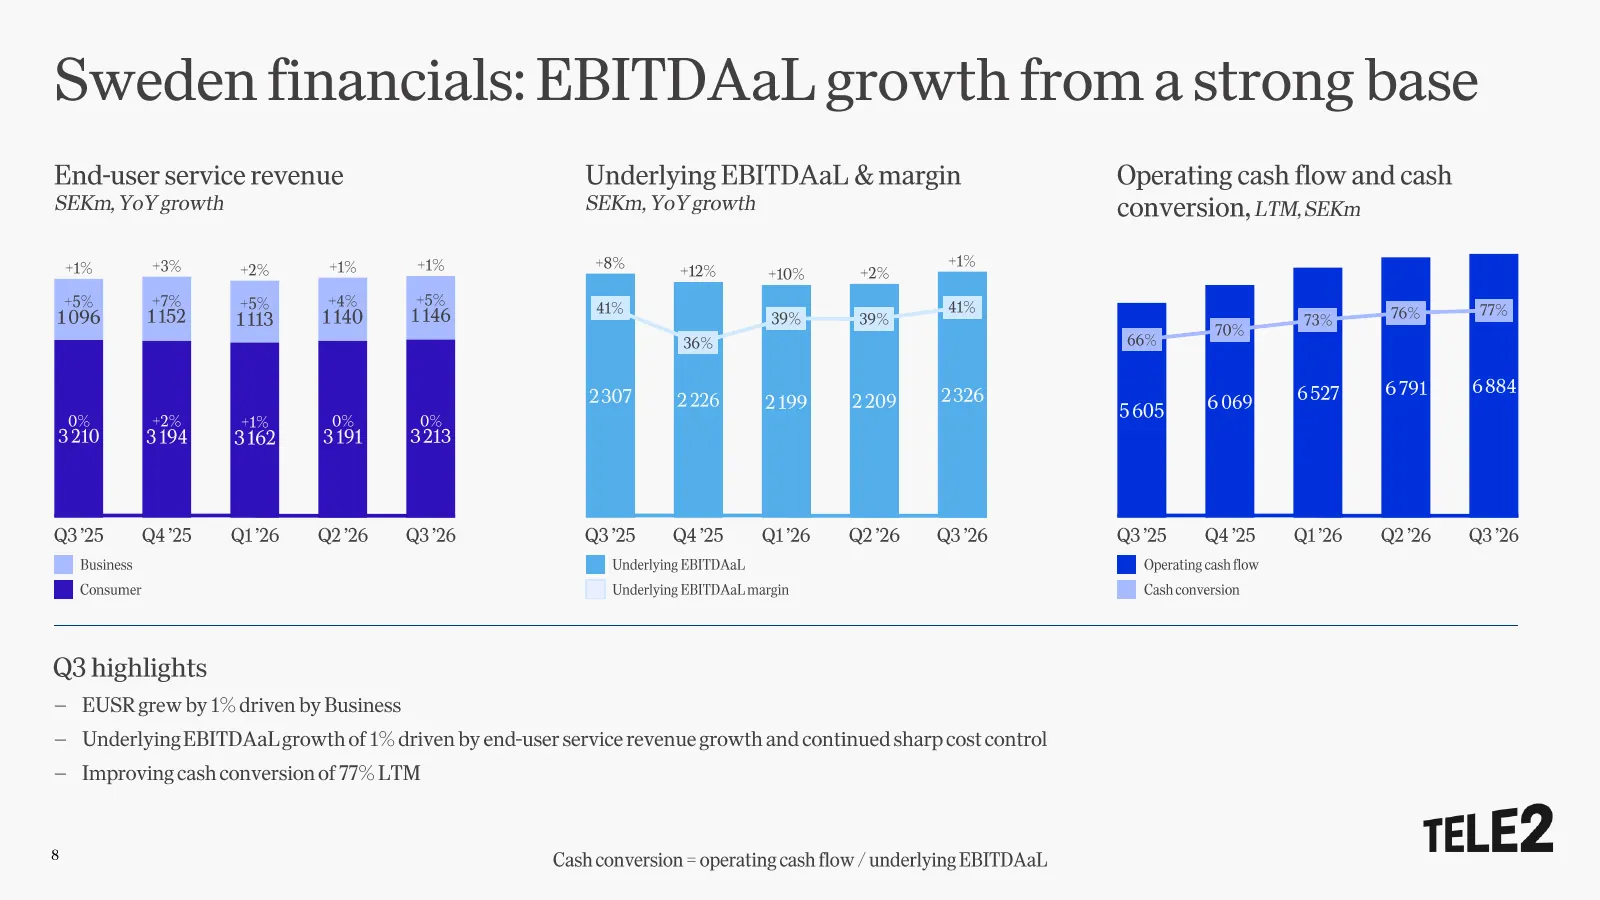
Slide 8: Sweden financials: EBITDAaL growth from a strong base
Sweden financials: EBITDAaL growth from a strong base End -user service revenue Underlying EBITDAaL & margin Operating cash flow and cash SEKm , YoY growth SEKm, YoY growth conversion, LTM, SEKm +1% +3% +1% +1% +8% +1% +2% +12% +10% +2% +5% +7% +5% +4% +5% 41% 41% 76% 77% 1096 1152 1113 1140 1146 39

Slide 9: Baltics
BALTICS
Slide 10: Baltics financials: 9% EBITDAaL growth
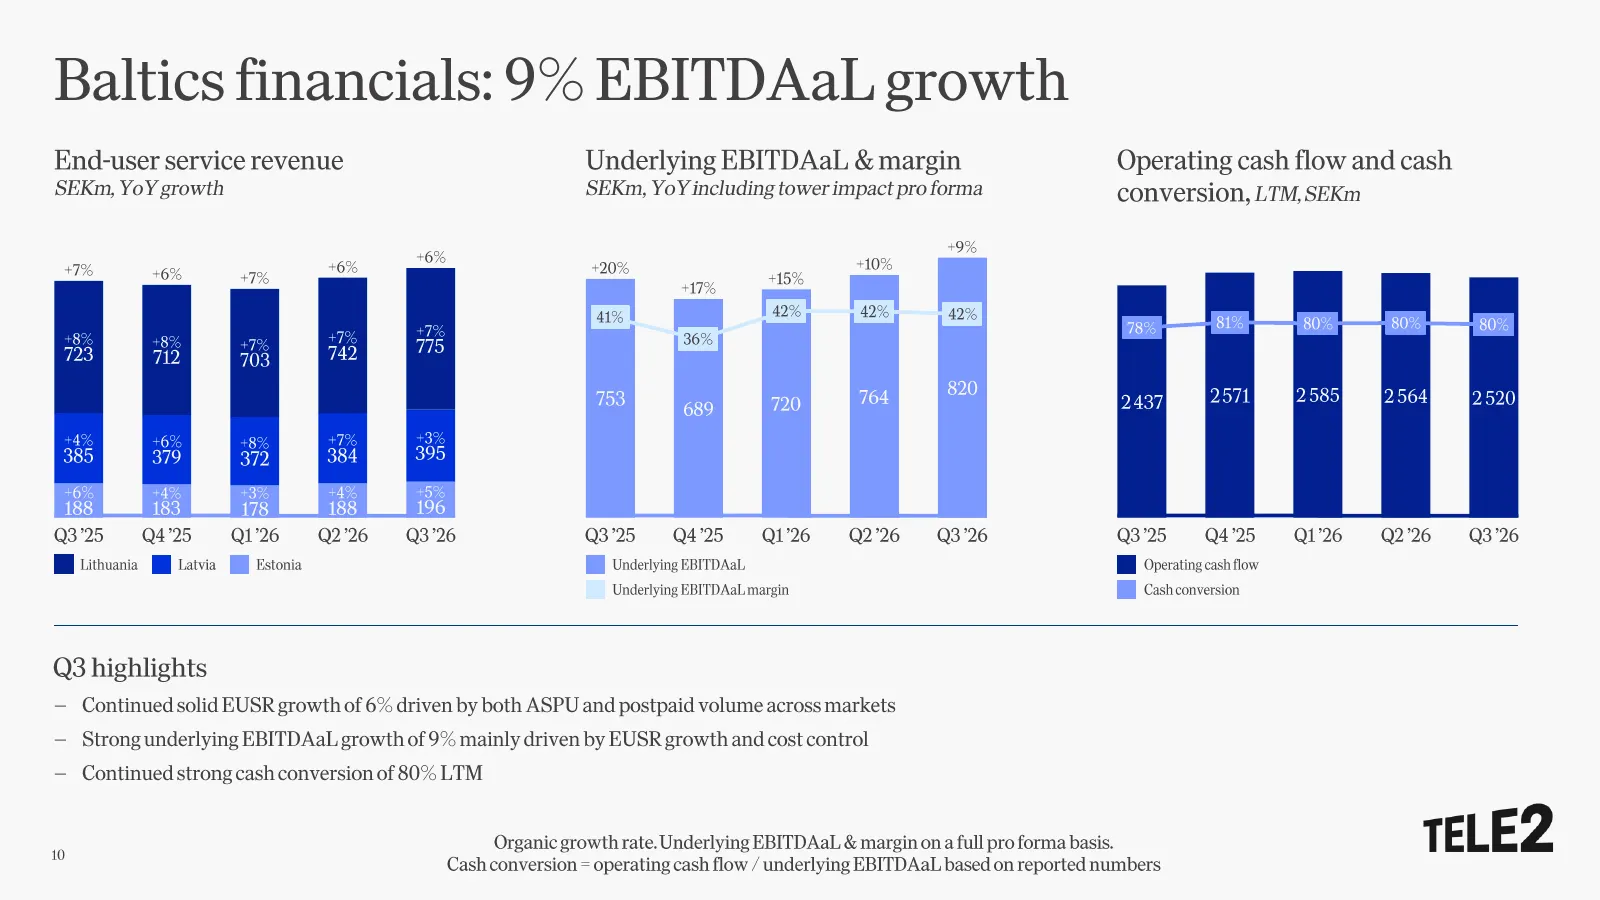
Baltics financials: 9% EBITDAaL growth End -user service revenue Underlying EBITDAaL & margin Operating cash flow and cash SEKm , YoY growth SEKm, YoY including tower impact pro forma conversion, LTM, SEKm +9% +6% +10% +7% +6% +6% +20% +7% +15% +17% 41% 42% 42% 42% 78% 81% 80% 80% 80% +7% +7% +8% +8
Slide 11: Baltics KPIs: Strong ASPU growth
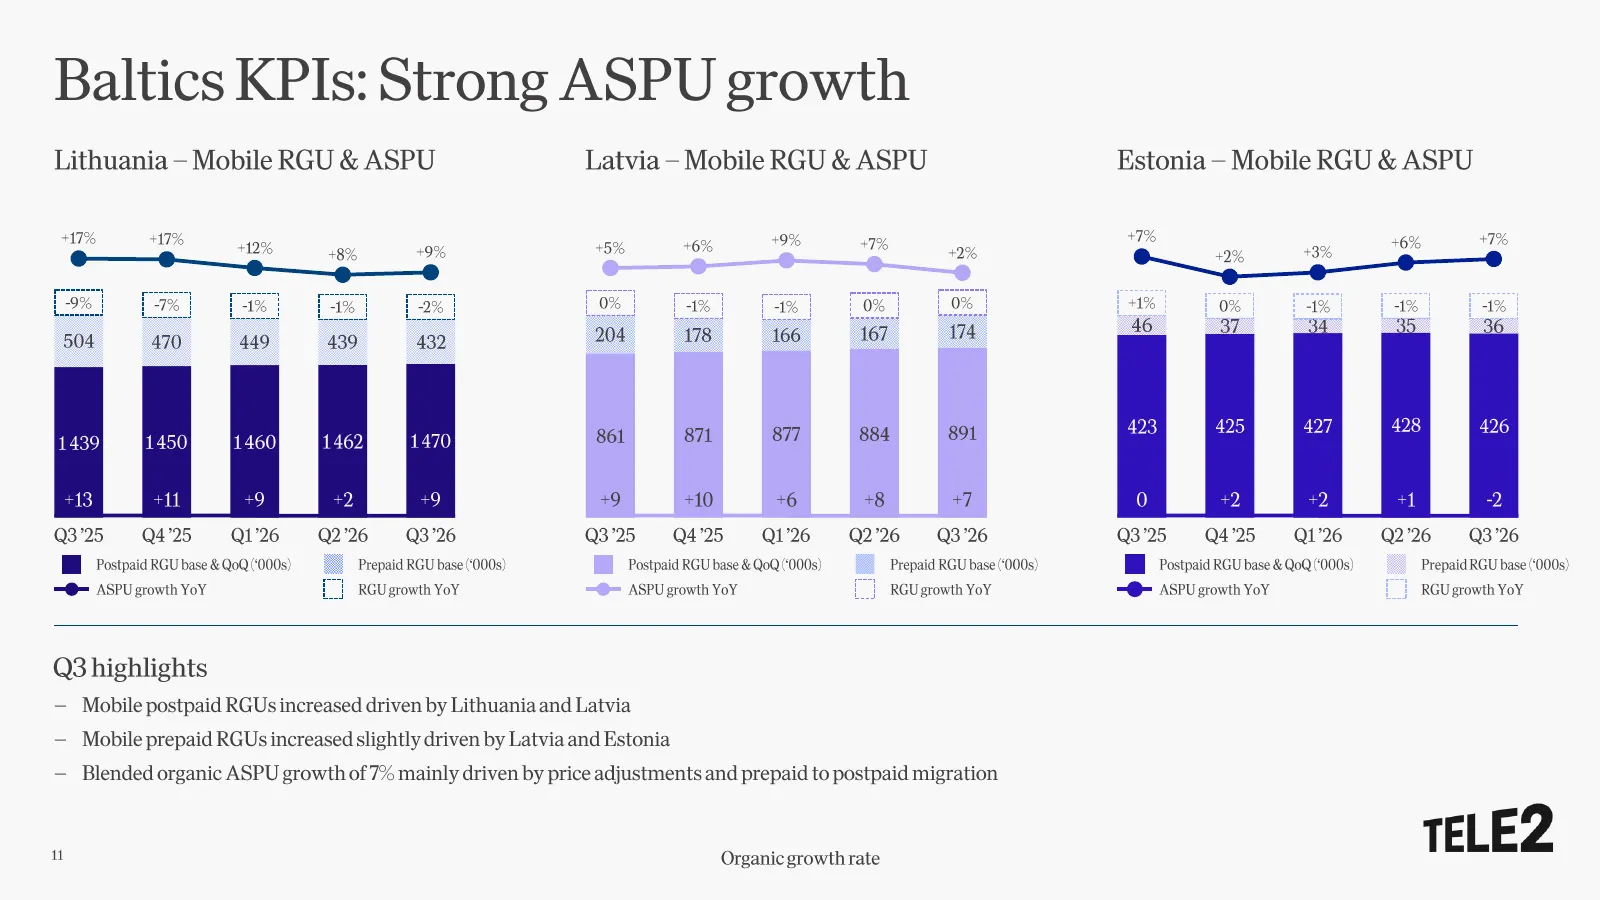
Baltics KPIs: Strong ASPU growth Lithuania – Mobile RGU & ASPU Latvia – Mobile RGU & ASPU Estonia – Mobile RGU & ASPU +17% +17% +9% +7% +6% +7% +12% +5% +6% +7% +8% +9% +2% +2% +3% -9% -7% -1% -1% -2% 0% -1% -1% 0% 0% +1% 0% -1% -1% -1% 204 167 174 46 37 34 35 36 504 470 449 439 432 178 166 877 884

Slide 12: Financial overview
FINANCIAL OVERVIEW
Slide 13: Group results
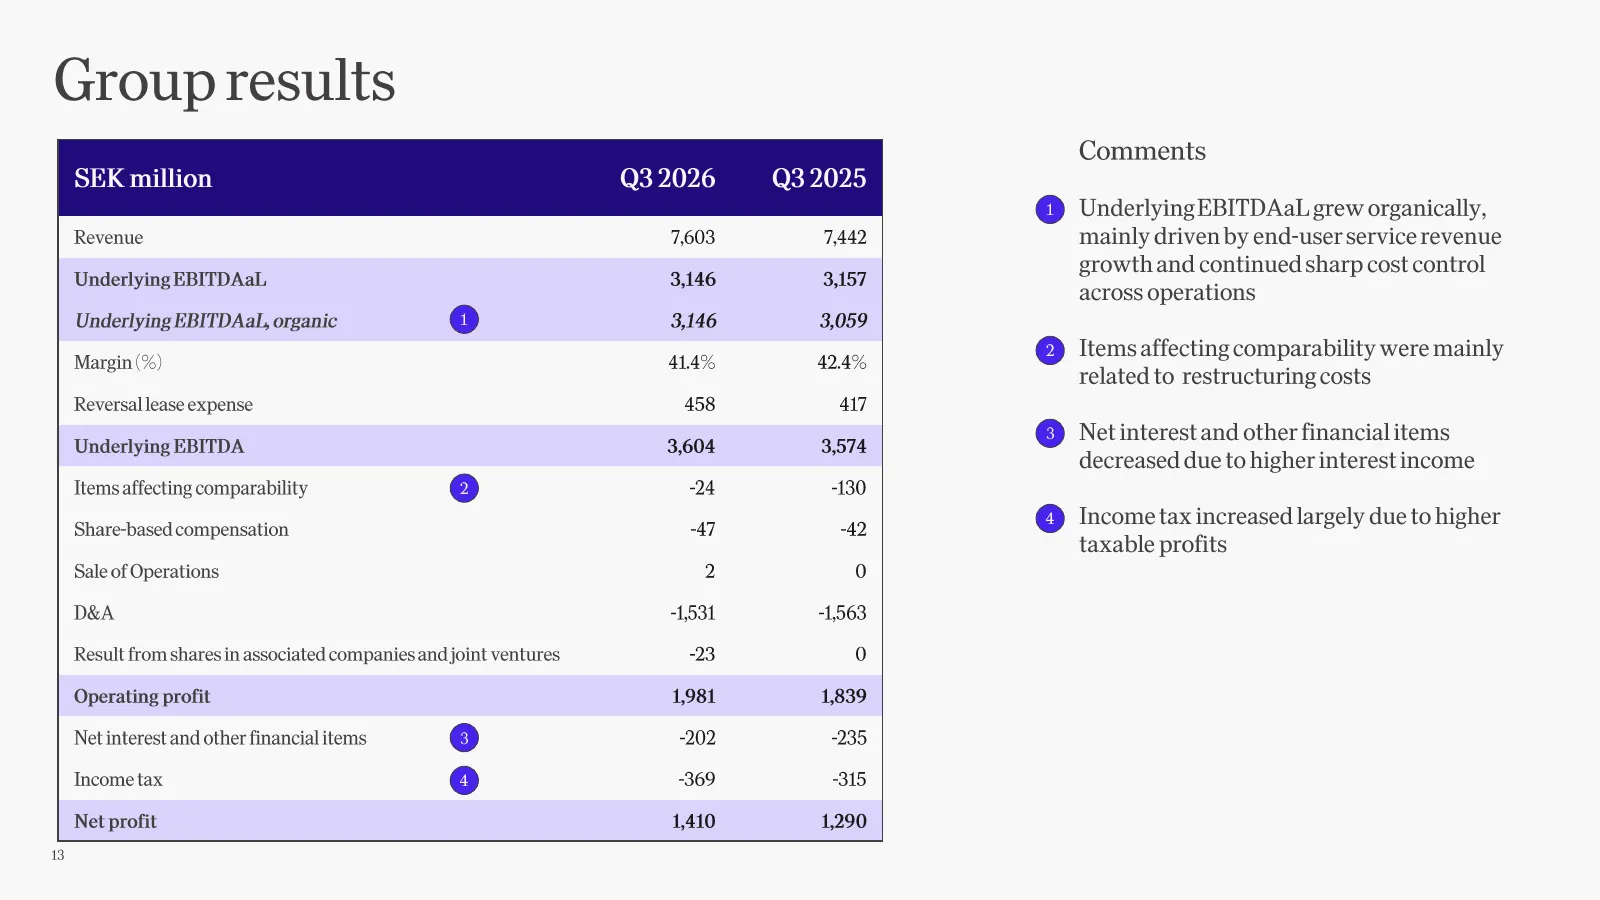
Group results Comments SEK million Q3 2026 Q3 2025 1 Underlying EBITDAaL grew organically, Revenue 7,603 7,442 mainly driven by end -user service revenue growth and continued sharp cost control Underlying EBITDAaL 3,146 3,157 across operations Underlying EBITDAaL , organic 1 3,146 3,059 2 Items affe
Slide 14: Group cash flow
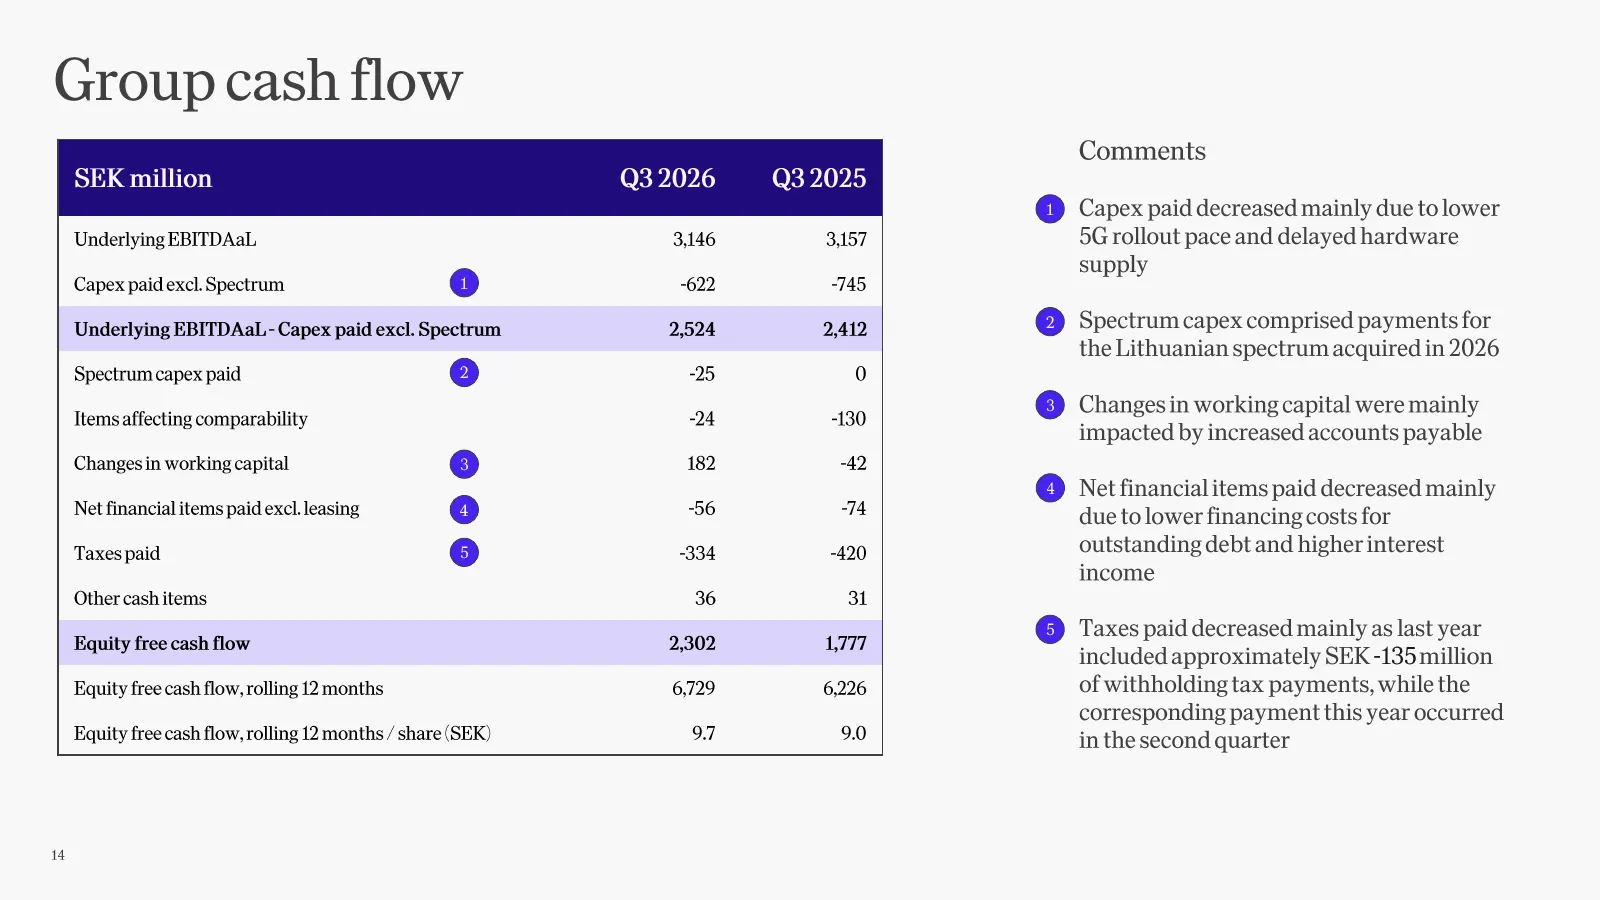
Group cash flow Comments SEK million Q3 2026 Q3 2025 1 Capex paid decreased mainly due to lower Underlying EBITDAaL 3,146 3,157 5G rollout pace and delayed hardware supply Capex paid excl. Spectrum 1 -622 -745 Underlying EBITDAaL - Capex paid excl. Spectrum 2,524 2,412 2 Spectrum capex comprised pay
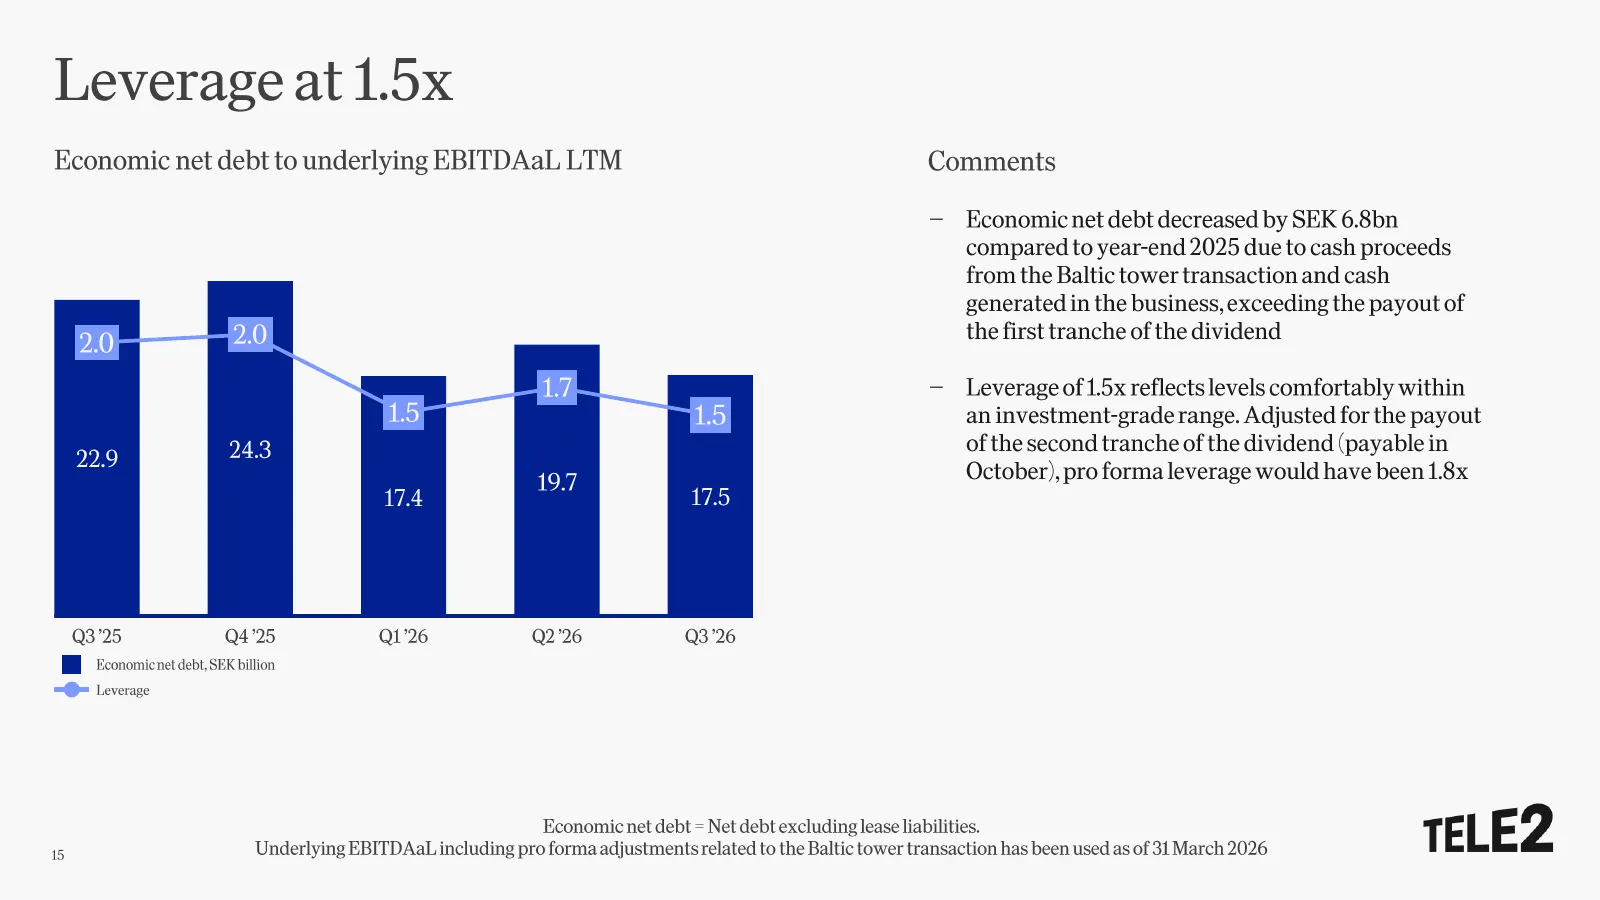
Slide 15: Leverage at 1.5x
Leverage at 1.5x Economic net debt to underlying EBITDAaL LTM Comments – Economic net debt decreased by SEK 6.8bn compared to year -end 2025 due to cash proceeds from the Baltic tower transaction and cash generated in the business, exceeding the payout of 2.0 the first tranche of the dividend 2.0 1.
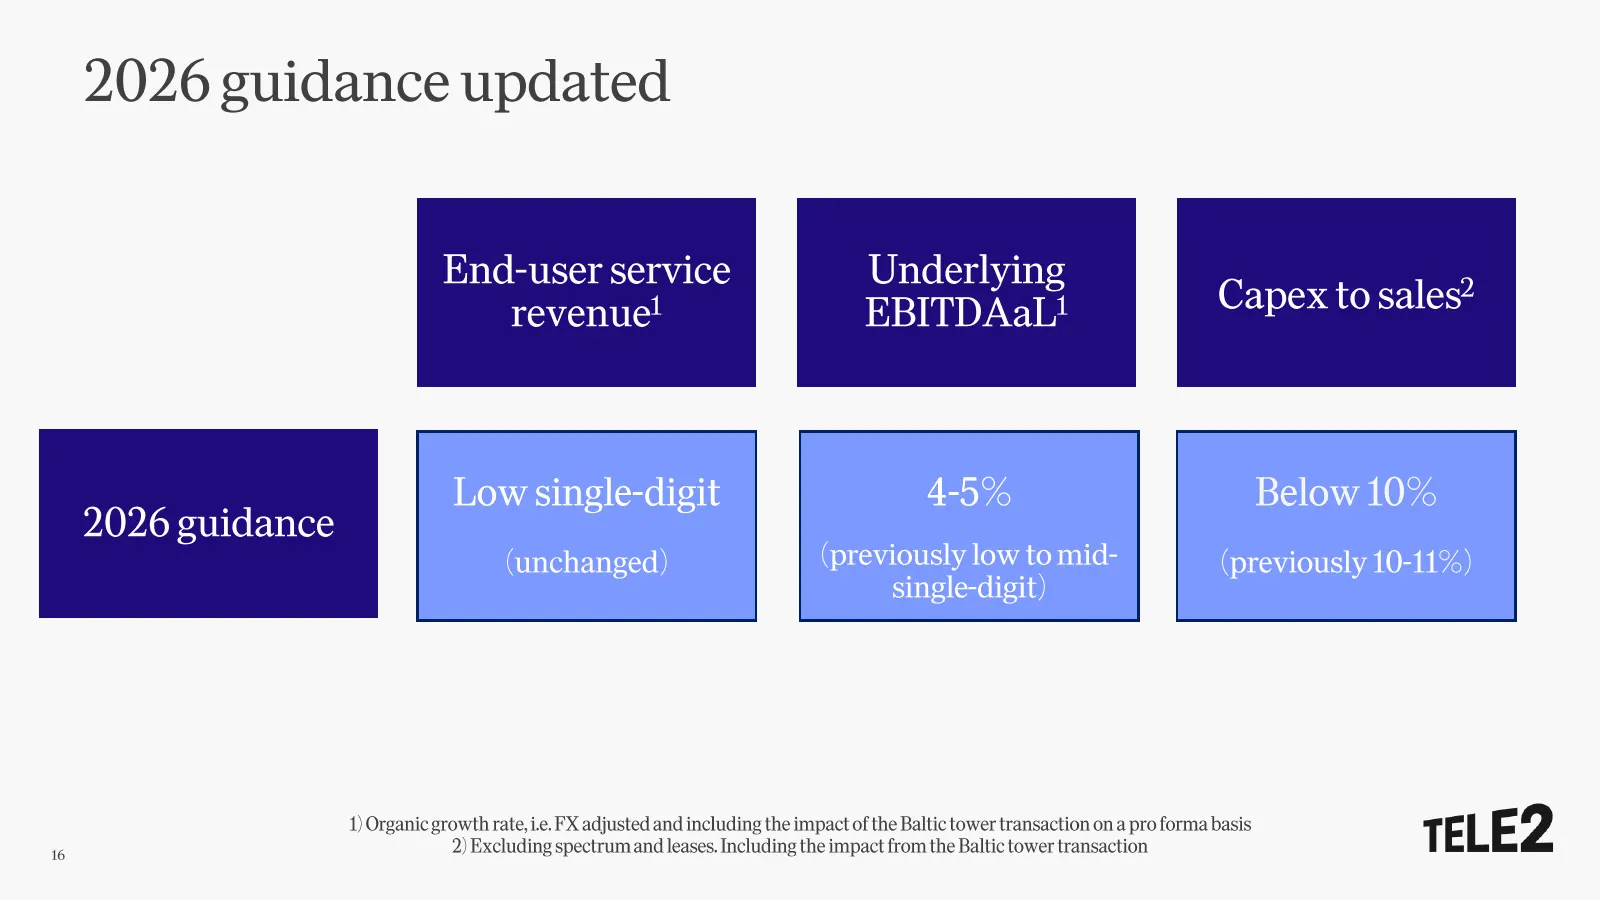
Slide 16: 2026 guidance updated
2026 guidance updated End -user service Underlying revenue 1 EBITDAaL 1 Capex to sales 2 Low single -digit 4-5% Below 10% 2026 guidance (unchanged) (previously low to mid - (previously 10 -11%) single -digit) 1) Organic growth rate, i.e. FX adjusted and including the impact of the Baltic tower trans

Slide 17: You are no 1. We are Tele2.
You are no 1. We are Tele2.
Source: company website
More decks from Tele2 AB Class A
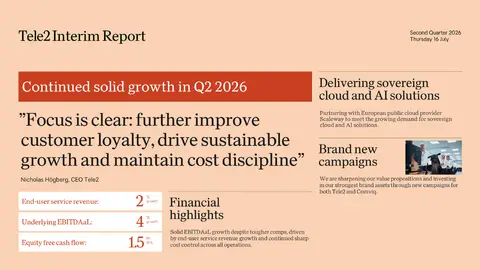 Q2 2026 Earnings Presentation17 slides · Jul 16, 2026
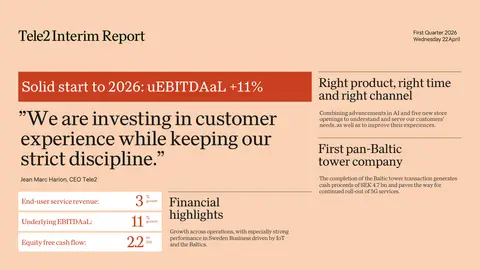 Q1 2026 Earnings Presentation17 slides · Apr 22, 2026
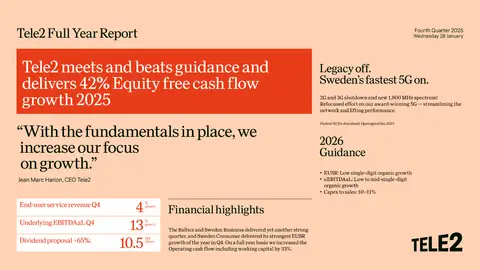 Q4 2025 Earnings Presentation19 slides · Jan 28, 2026
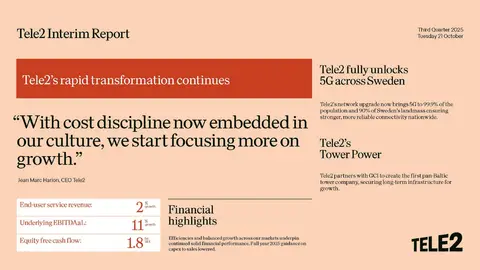 Q3 2025 Earnings Presentation17 slides · Oct 21, 2025
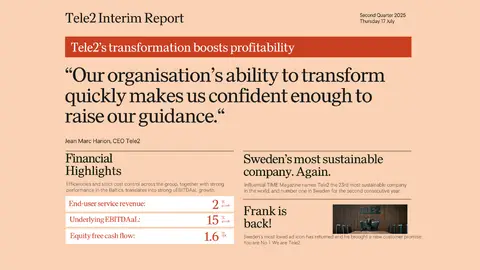 Q2 2025 Earnings Presentation18 slides · Jul 17, 2025
 Q1 2025 Earnings Presentation18 slides · Apr 23, 2025